1. Introduction
Fifth Generation (5G) systems are End-to-End (E2E) service platforms that support a mobile-connected society and provide a substantial rise in the data rate and reduction in latency compared to previous mobile generations [
1,
2]. However, 5G is not just the next development from Long-Term Evolution (LTE), the most widely adopted cellular communication standard nowadays, but a fundamental paradigm change [
3,
4]. 5G networks are expected to enable various vertical industries with diverse use cases and applications [
5]. 5G can deliver Gigabit bandwidth, ultra-high reliability, always-on availability and massive network capacity with 1 ms latency to support a mobile-connected society.
5G, therefore, accelerates the adoption of a huge range of vertical markets, multiple use cases and heterogeneous services with corresponding cybersecurity requirements. It supports multiple Radio Access Networks (RANs) including Global System for Mobile Communications (GSM), Universal Mobile Telecommunications System (UMTS), and LTE. Consequently, the implementation of 5G inherits the security challenges of those access networks. The key vulnerabilities and cyber-attacks on the RAN are currently an active topic of research [
6].
There has been a significant body of research to develop accurate simulation models of 5G radio channels. The primary focus has been on modelling variations in amplitude and phase across the bandwidth of radio signals. These can be used to measure the performance of the signal-processing algorithms to help to improve the performance of the radio link [
7]. A review of the literature finds that none of the propagation models, including WINNER/IMT-Advanced, COST 2100, and IEEE 802.11, fully satisfy our requirements and their complexity requires a high level of radio expertise to be usable [
8,
9]. Since our aim is to provide large datasets for use by data analysis researchers, it is critical to select the appropriate model that gives results that are typical of a drive test with the least amount of complexity. This study aims to provide a synthesized stream of received signal strength values that would be expected to be observed by a mobile device travelling along a highway. Installing a real 5G testbed to create the received radio signal and the measurement report is challenging in both deployment cost and scalability [
10]. Moreover, any results from a specific drive test will inherently be only valid for that particular test and may not be representative of any other highway section.
A simulation model is proposed to fill such gaps that can efficiently produce realistic signal strength metrics using well-known radio propagation models. This proposal removes the need for this expensive infrastructure to conduct research in this area. Computer science researchers can easily use the model to quickly generate large datasets that model many different scenarios, removing an existing research barrier. Moreover, the literature study indicates that, there are no currently existing simulations of this nature that do not require expert radio knowledge [
7]. This solution might be beneficial to the wider 5G security research community.
The proposed method uses a well-known propagation model, and antenna radiation patterns for estimating the coverage [
11]. The RSS values are calculated from the Friis propagation and path loss equations, and the calculated signal level is in the range of 5G signal standard. Drive test results are normally presented as statistical distributions or RSS levels accumulated during the drive test rather than as a time series of measurement data. Hence, such time series results are not readily available in any references [
12]. However, but the results are broadly compatible with the contour plots in [
13]. They have contour maps of coverage around an antenna that would give a time series similar to those resulting from our work if a road went straight through the coverage area and passed close to the base station.
Rogue Base Station (RBS) attacks and International Mobile Subscriber Identity (IMSI) catchers are the most frequently published attacks on the RAN layer. In these attacks, the IMSIs of User Equipment (UE) are targeted during the initial network registration process and paging attacks. However, it is expected that the 5G standards and services will address known attacks for all access types in this layer. An unencrypted IMSI, for example, could not be transferred in 5G.
A further move toward countering the RBS is undertaken by the 3rd Generation Partnership Project (3GPP). The security group in 3GPP (called SA3) has outlined that radio information received by UEs may include traces of RBS “fingerprints” [
14]. Based on this information and analyses of Measurement Report (MR), SA3 suggests recognising a framework that enables cellular networks to reliably identify such RBS threats. The framework complements other technology implemented in 5G, as described above, to protect the UEs from RBS attacks [
15].
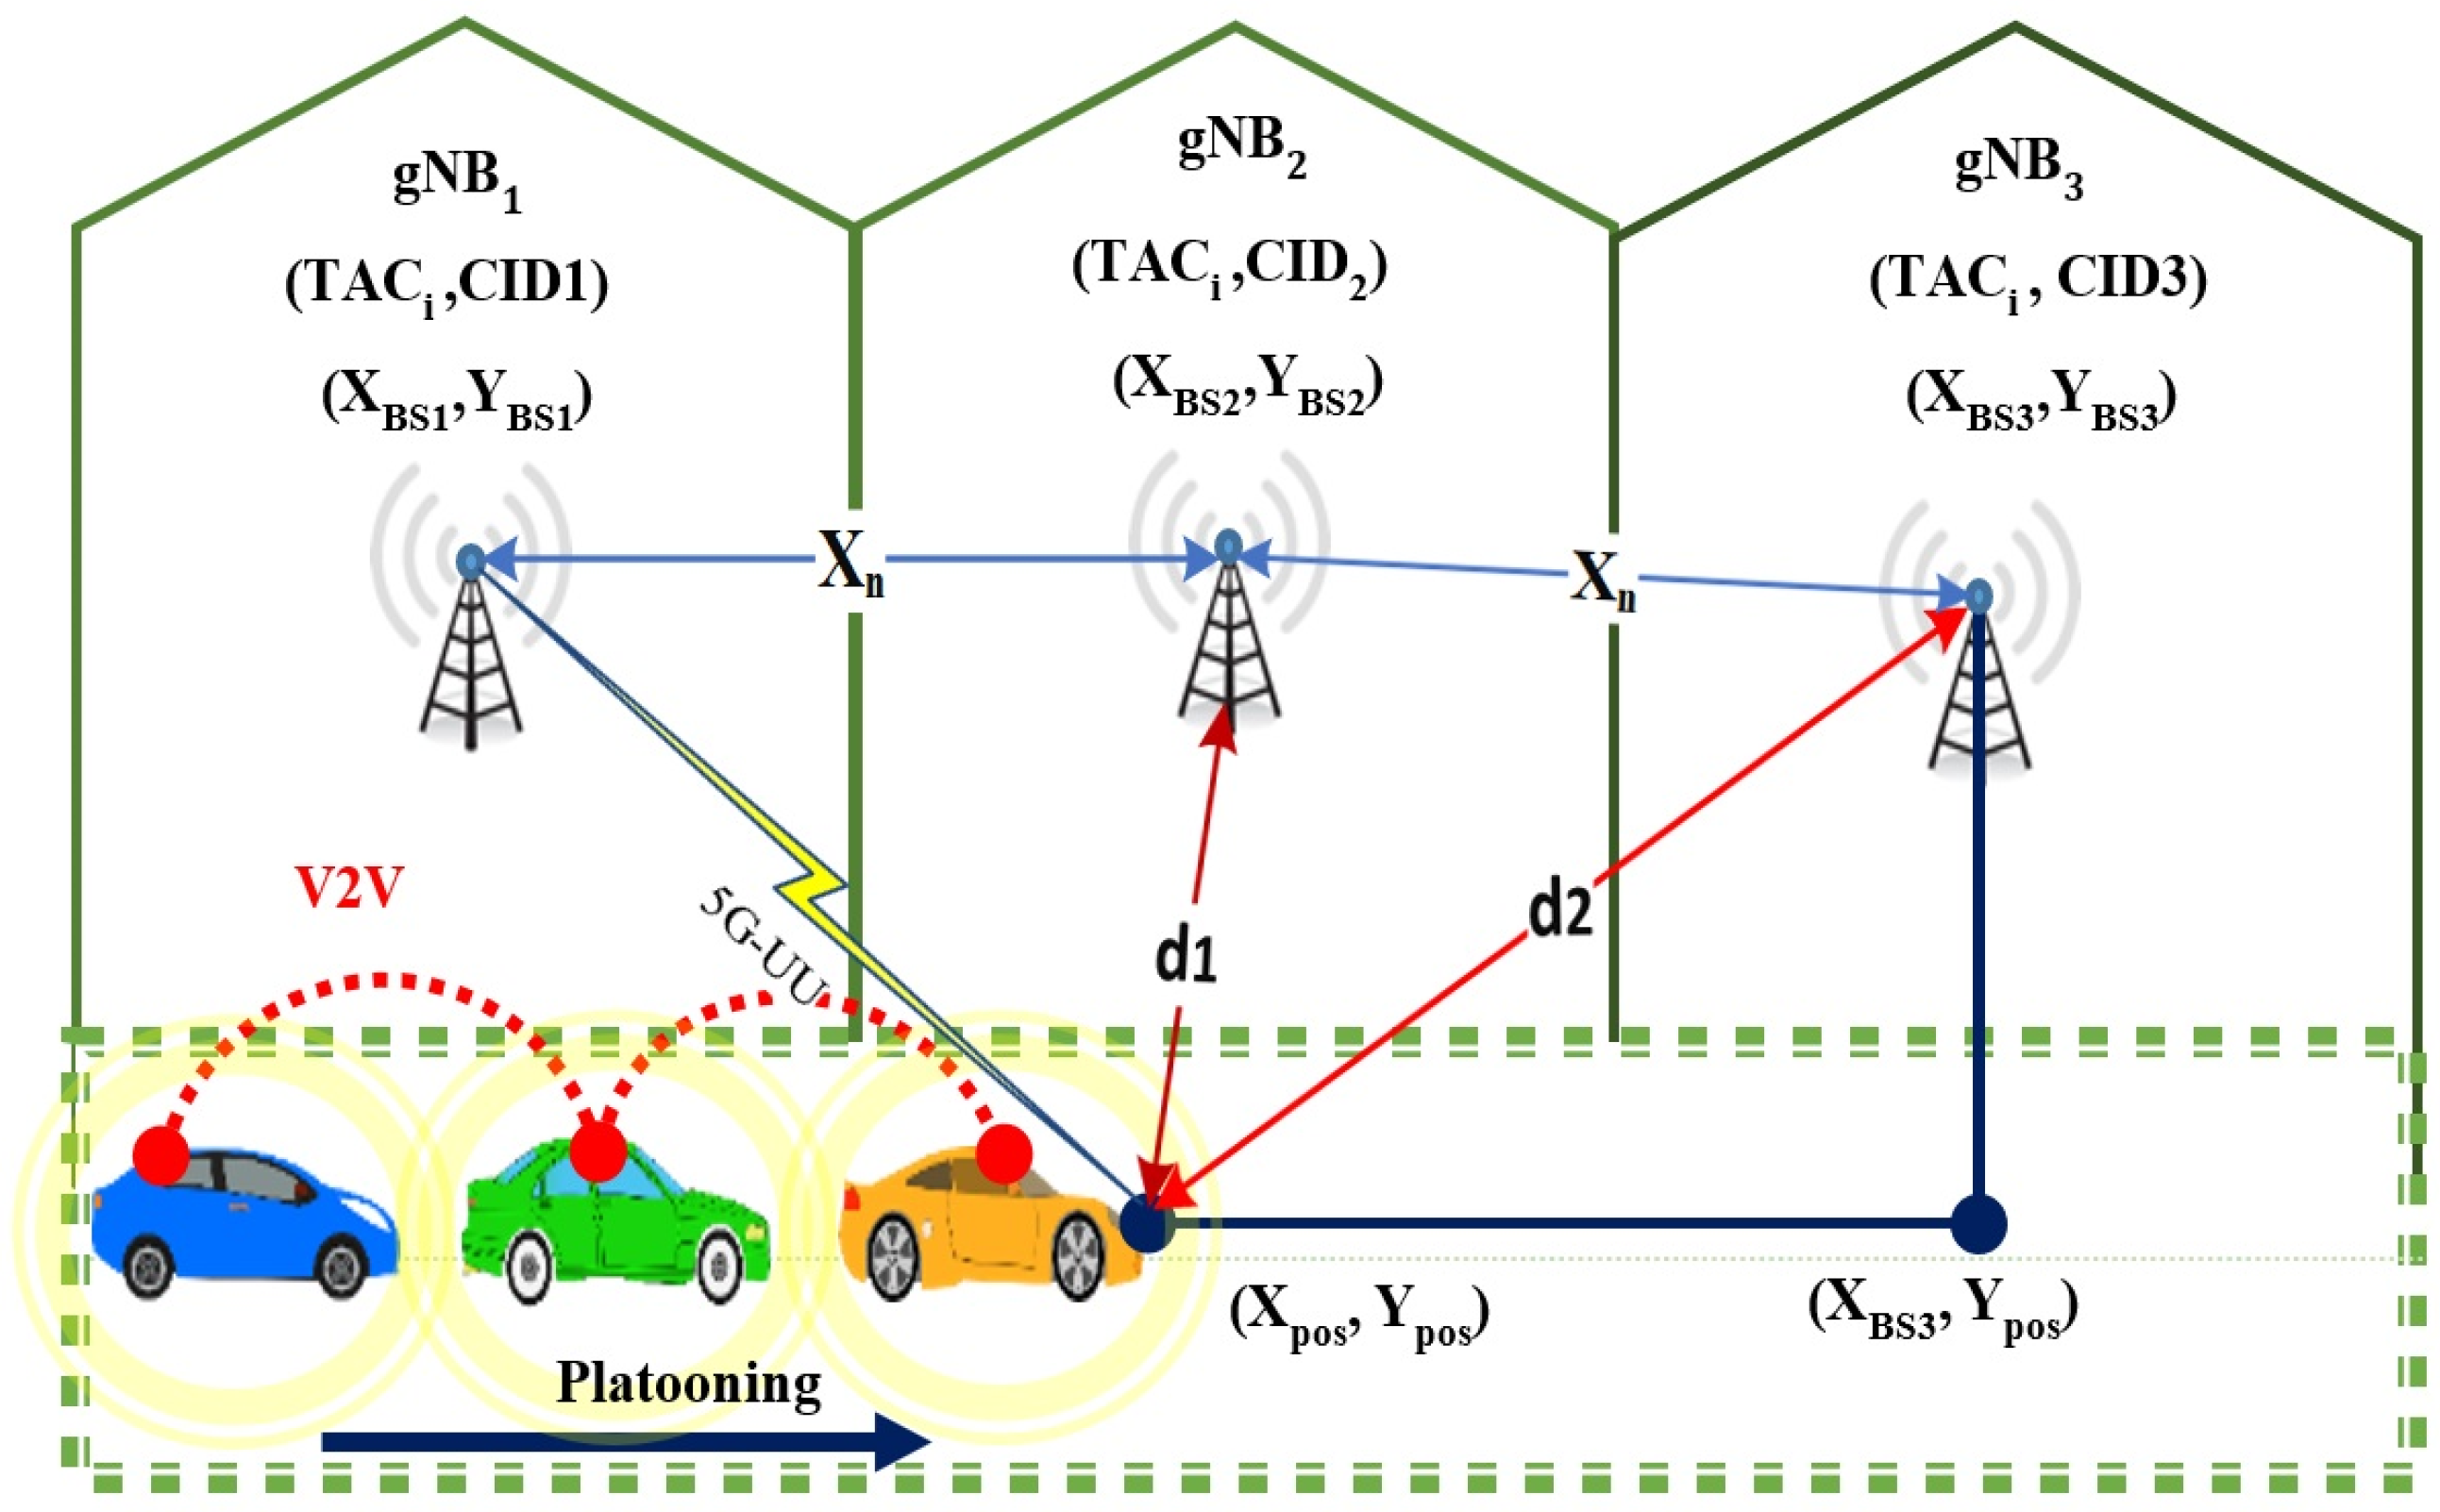
This study focuses on the generation of realistic MR data. In D2D and V2X communication, there might be rogue gNodeB units alongside legitimate gNodeB units. The use case includes several vehicle platooning scenarios in which an RBS is positioned along the road and attempts to entice the platoon leader’s UE to handover to the RBS. Many scenarios have included several RBS attacks in vehicular platooning to influence the platoon and cause large traffic collisions with a significant threat to life. This could be performed as an MitM attack, where the RBS imitates a legitimate BS and transmits information between the other legitimate BS and the leader of the platoon. Eventually, the platoon leader can then be ordered to take a manoeuvre that results in a fatal accident by changing the contents of the control messages.
The generation of large datasets for training and testing was a priority. One could use UE measured data gathered from a vehicle driving through a 5G coverage area, but it would be difficult to determine whether these datasets were normal or anomalous. To preclude the generation of anomalous data or data that are only relevant to the specific route that was taken, a novel method of simulation has been developed, capable of generating large datasets for a wide range of scenarios in a fraction of the time needed to obtain UE data from a “drive test”.
Our method runs on a standard PC and quickly generates realistic MR data reflecting a user-defined topology of legitimate BS and RBS, BS/RBS transmission strength, speed and direction of platoon leader, and physical position of the road surface with respect to the BS/RBS location.
In summary, our work provides the following contributions:
Simulation of 5G tracking areas where platooning vehicles travel and connect to the BS situated in each tracking area.
Building a novel flexible data generator of 5G MRs that can generate realistic streams of radio data.
A Handover protocol is implemented and a model for RBS antenna beams is introduced to present several normal and attack scenarios.
Developing a software platform to mimic the signals from legitimate BSs and RBSs at variable locations and proposing several attack scenarios to enable 5G RBS investigations.
The remainder of this paper is organised as follows. In
Section 2, a short summary of studies related to RBS detection techniques is presented to establish the role of the MR and the type of data that it contains.
Section 3 describes the proposed architecture and simple handover protocol.
Section 4 describes the antenna beam model for the RBS and the attack model.
Section 5 presents the experimental results by illustrating the legitimate and attack scenarios in detail. Finally, in
Section 6, we conclude the paper by summarising the main achievements and considering some directions for future work.
2. Background and Related Work
The privacy of network subscribers can be compromised if their IMSI are stolen. Man in the Middle (MitM) attacks and Distributed Denial of Service (DDoS) attacks are the most common attacks against subscribers. In mobile communication networks, MitM employs an RBS when a malicious third party Base Station (BS) masquerades as a legitimate network BS. DDoS attacks may involve implanted malware to simultaneously reboot all UEs in a target 5G coverage area at the same time. This may result in excessive malicious connection requests, constructing a storm of signalling to overload 5G RAN resources. Such an attack makes the RAN unavailable to legitimate subscribers [
6,
16].
Mutual authentication between an LTE network’s Evolved Packet Core (EPC) and the UEs is regarded as the primary technique for protecting privacy in the security architectures of pre-5G cellular networks. The Authentication and Key Agreement (AKA) procedure is applied to achieve mutual authentication and generate a ciphering key to protect the encrypted data and an integrity key to derive session keys for signalling integrity. Although this method has provided a multitude of benefits, it cannot completely eliminate the risk posed by RBS attacks [
17,
18].
5G uses two mechanisms to boost subscriber privacy. The first mechanism encrypts a long-term identifier to prevent stingrays and IMSI catchers [
19]. 5G networks exploit the Subscription Permanent Identifier (SUPI) rather than the IMSI as well as a Public Key Infrastructure (PKI) to encrypt the SUPI into the Subscription Concealed Identifier (SUCI). Furthermore, 5G changes subscribers’ short-term identifiers frequently. Both techniques have already significantly improved resistance to RBS attacks in 5G networks compared with previous standards [
20].
Other Related Work. The most recent review of current technologies and open communication difficulties focused on 5G data transmission between BSs and V2X, as well as challenges of RBS attacks on Internet of Things (IoT) security [
21,
22]. We report on security issues for V2X scenarios, and synthetic data generation, and delineate the various RBS schemes in the 5G environment [
23,
24,
25,
26].
The authors of [
27] present an RBS detection approach to prevent violation of the consistency of RSS reports in WiMax/802.16 wireless access networks. In this technique if a RBS is present in a network, anomalies in the RSS reports received by mobile stations (MSS) can be observed. For LTE and 5G technologies, their methods are not robust.
In [
28], the authors described an Intrusion Detection System (IDS) to detect anomalies and identify RBS through data traffic. Their mechanism searches for false data such as emergency messages injected into the traffic data and informs the local administrator of their existence before destroying them. Their method has two limitations. First, their model only tests for the synthetic and static data traffic in a centralised BS and secondly, the designed IDS suffers from a lack of control of BS and the handover process. Both are addressed in this work, which considers multiple instances of BS and RBS as well as a simulated handover.
Some solutions have mainly concentrated on large-scale RBS detection. For example, [
29] introduced a large-scale RBS detection mechanism to discover and control misbehaving traffic among UEs, especially for IoT devices demanding limited resources. This strategy was mainly tested using synthetic dataset and was unable to monitor previously received signals at each BS. In addition, the authors in [
30] developed a shadow fading mechanism to check large-scale suspicious synchronization signal strength and region-matching criteria on a BS in an LTE system. Their method does not address IoT devices and platooning applications in a 5G environment.
In [
31], the authors presented an RBS metric mechanism compatible with GPRS to detect interventions by malicious intruders in 3G (UMTS) and 4G (LTE) communications. Their method can detect devices with a limited computational resource in a system. This work is a practical method but suffers from a lack of real-time analysis on a platooning platform for IoT within a 5G network, which is the focus of this work.
In [
32], the authors explored an Azure scaffold environment combining various analyses on the BSs to detect an RBS in an LTE network. However, this method does not address the real-time interference in the dedicated resources of 5G networks.
The work described in [
18] designed an automated system to discover RBS in a GSM/LTE mobile network that controls the BS traffic data and recognises the invasion in the system. Although this work is a novel and interesting addition to the field, it does not handle traffic data over the 5G network and does not work for a platooning platform for IoT devices. In addition, [
33] proposed a time-efficient symbol-based statistical Radio Frequency (RF) fingerprinting scheme to realise signal pattern anomalies and detect intrusions in the network. This work is impractical for large-scale IoT devices and does not address the actual propagation conditions considered in this study.
Finally, FBSleuth [
34] is a recently designed BS-based tool that can identify RBS devices based on minor differences in the emitted signals caused by hardware imperfections. This defence software lacks monitoring of the platooning data traffic traversing between multiple BS in a 5G network that is the domain of our work.
The literature reviewed here indicates a wide range of RBS detection schemes and some of their drawbacks. Although the approaches are varied, they all operate by some kind of data analysis, hence, the availability of a large quantity of realistic MR data is a key component in the development of RBS detection techniques. It is the provision of this data that is the focus of our work. This motivates the potential future use of Machine Learning (ML) approaches that require a very large dataset that covers many different scenarios. This motivated the development of a simple simulator that can generate such datasets which is the focus of this study.
4. Proposed Antenna Beam Model for RBS
In the scenario of an RBS targeting road segments, it is reasonable to assume that the radio equipment is less sophisticated than a commercial 5G BS. In particular, it is assumed that such equipment will have limited power amplification capabilities at the transmitter; thus, a directional antenna with a relatively high gain is required to deceive a UE. The use of a directional antenna will radiate the radio signal in a relatively small beam so that the malicious actors will need to point the beam along the road segment to some extent to maximise the amount of road that is within the “rogue cell”.
Here, a real antenna that would be suitable for mounting in a vehicle that can be parked at a vantage point with a good line of sight to the desired road segment was modelled. The radiation pattern of the main lobe is represented by a blue line in
Figure 4 which shows the extremely steep roll-off of the beam at the edges. These data are related to a commercially available antenna, the specifics of which have been redacted to avoid educating potential malicious actors. Because the goal of this work is to generate realistic RSS measurements from a fast and simple simulation, it is important to model the antenna radiation pattern in a manner that captures the characteristics that are likely to help identify an RBS. The model used in this simulator approximates the main lobe of the antenna with a single gain value (17 dBi) and a defined beamwidth, as indicated by the yellow line in
Figure 4 as a yellow line. Similarity of the steep sides of the real and simplified radiation patterns were clearly captured which validates the use of the simple model in this particular use case.
4.1. Deploy RBS to the Motorway (Attack Scenario)
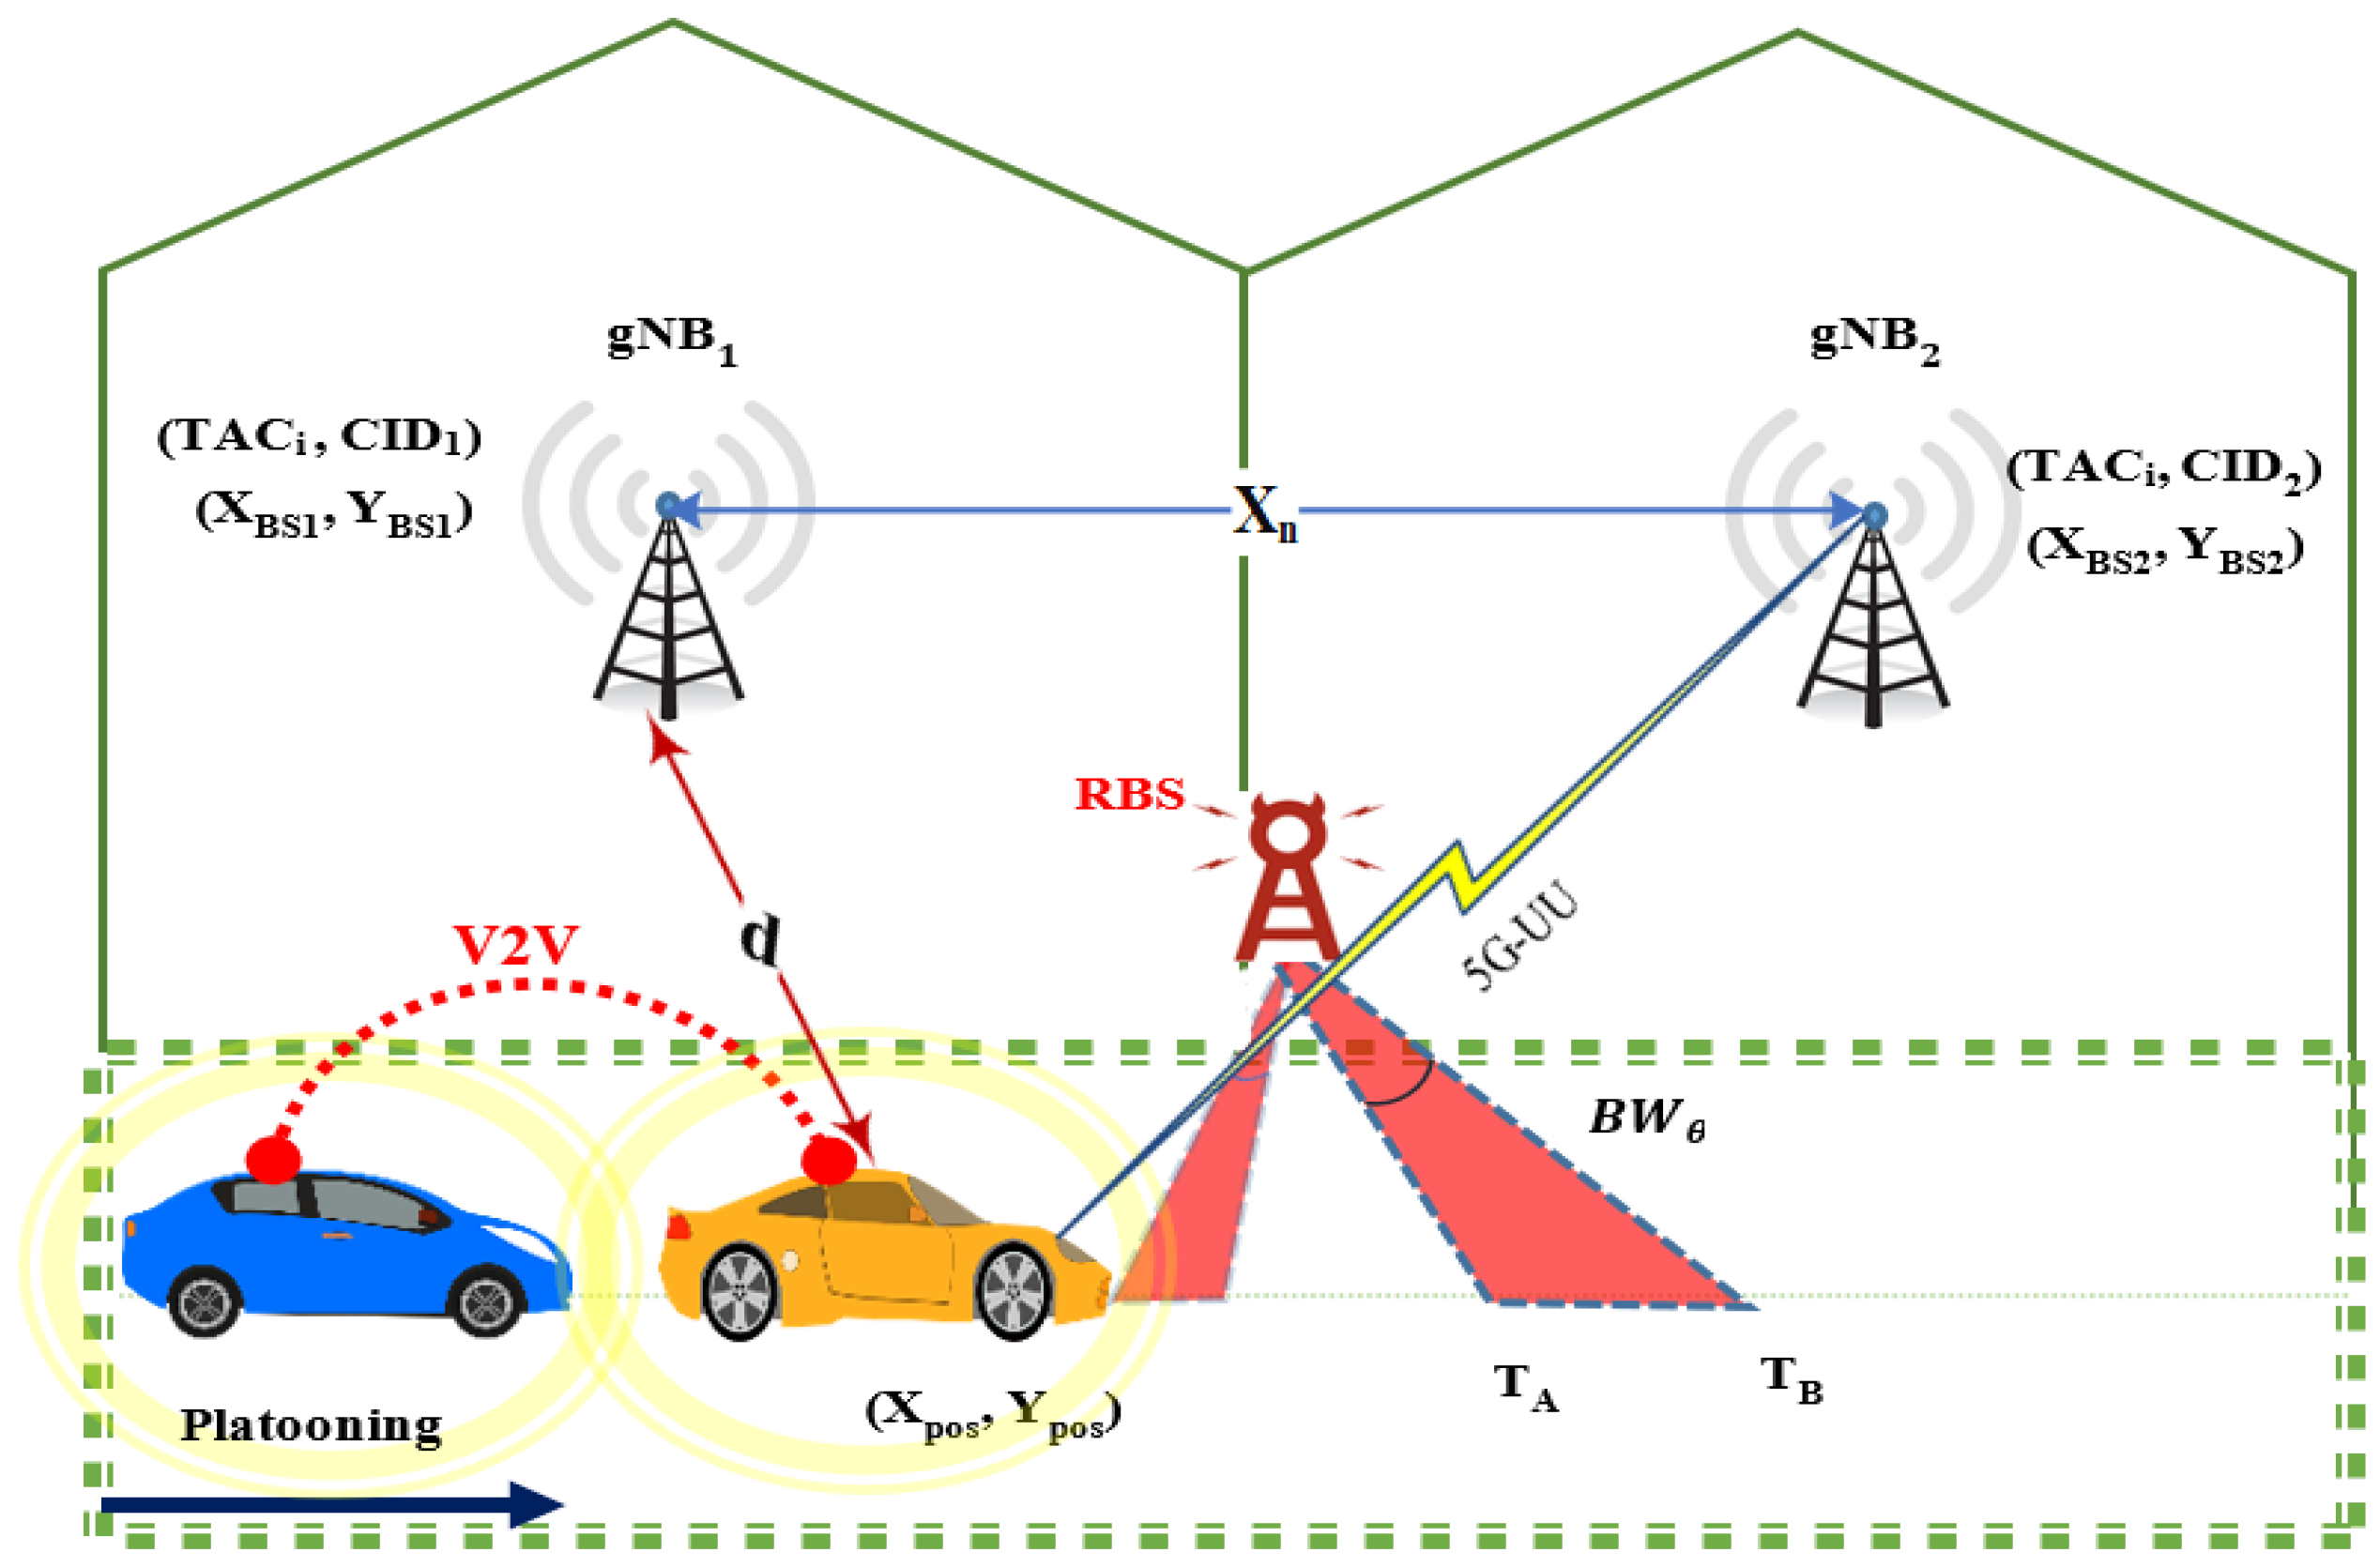
The outline of a suggested potential RBS attack scenario is proposed here. An intruder establishes an RBS in close proximity to the road segment, indicated by the red shape in
Figure 5. A rogue agent attempts to entice the UE to attach to it by spoofing the TAC and CID of a legitimate BS that is slightly further away [
37].
Figure 5 shows an RBS with two beams. Usually, a single beam would suffice, but in a “real” scenario only one of the red beams would be present depending on the direction in which the antenna is pointed. Nevertheless,
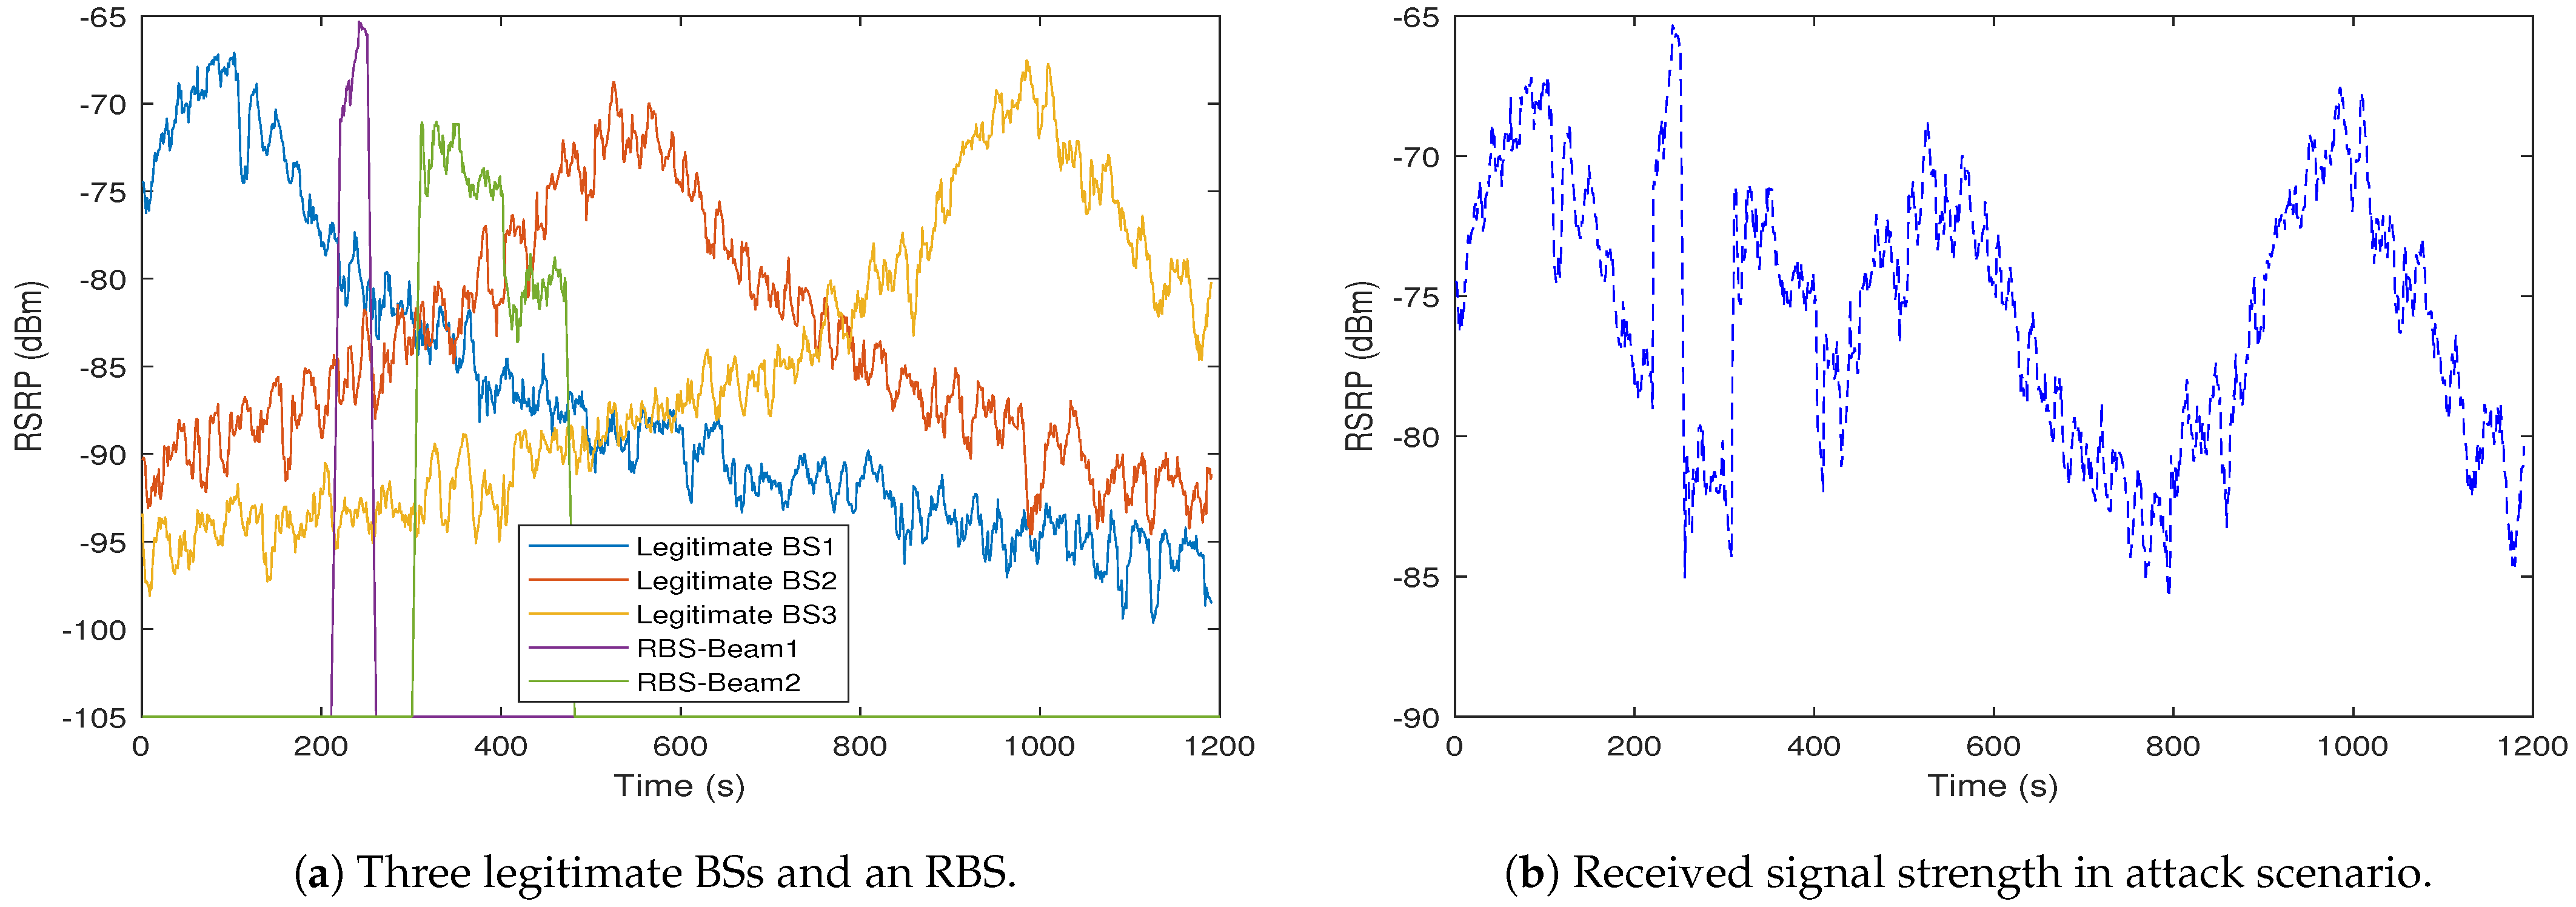
Figure 6a clearly shows that both RBS beams are actually generated.
It is unlikely that attackers would implement an RBS with high transmission power because of the high cost and physical size of the required infrastructure. For this reason, the simulated RBS has been specified with a lower transmit power than the legitimate BS units in the area and uses a narrow beam directional antenna that covers part of the motorway with higher gain to deceive the UE.
The antenna gain is also inversely proportional to the beamwidth of the antenna as shown in Equation (
5) [
38]:
The antenna pattern was assumed as a rectangular area in the proposed model, and the APC (Antenna Pattern Constant) takes a fixed value of 41,253 if the beamwidth dimensions are in degrees [
15]. The horizontal and vertical beamwidths are considered to be approximately equal in the simulation, therefore an antenna beamwidth is estimated based on the given gain by (
5). The position of the RBS is being used to determine when the UE falls below the RBS coverage. This is also used to measure the timespan during which the UE is covered by the narrow beams of the RBS identified as
and
as shown in
Figure 5.
The RBS generates a higher RSS that can defraud the mobile UE, as shown in
Figure 6a. As expected, there are two areas in which the RBS power is higher when two beams are used. The first beam is pointed down to the road at 30 degrees; thus, we can see a higher received signal, but for a shorter time than the second beam which is positioned on the road at 60 degrees.
Typically, the 5G standard does not allow a legitimate BS to handover a UE to an RBS that is unknown to the 5GCore (5GC). The 5GC Access and Mobility Management Function (AMF) would normally maintain a list of legitimate BS-IDs in the respective tracking area. This should prevent the RBS from stealing the UE communication link at the user plane level. Thus, at first glance, injecting malicious information into a platoon leader may not be possible.
However, in the technical specification of enhanced 5G security against RBS, the 3GPP identifies that the handover decision making in 5G systems is centred on the information included in the UE MR. The UE evaluates the RSS of nearby BS units on the basis of the syncing signal that transports the synchronisation and information block without additional security [
43]. Consequently, as shown in
Figure 6b, the RBS attempts to forge the identification parameters of the second BS such as its Mobile Country Code (MCC) and Mobile Network Code ( MNC). It then masquerades as the second legitimate BS with a higher RSS and declares itself to be available for connection.
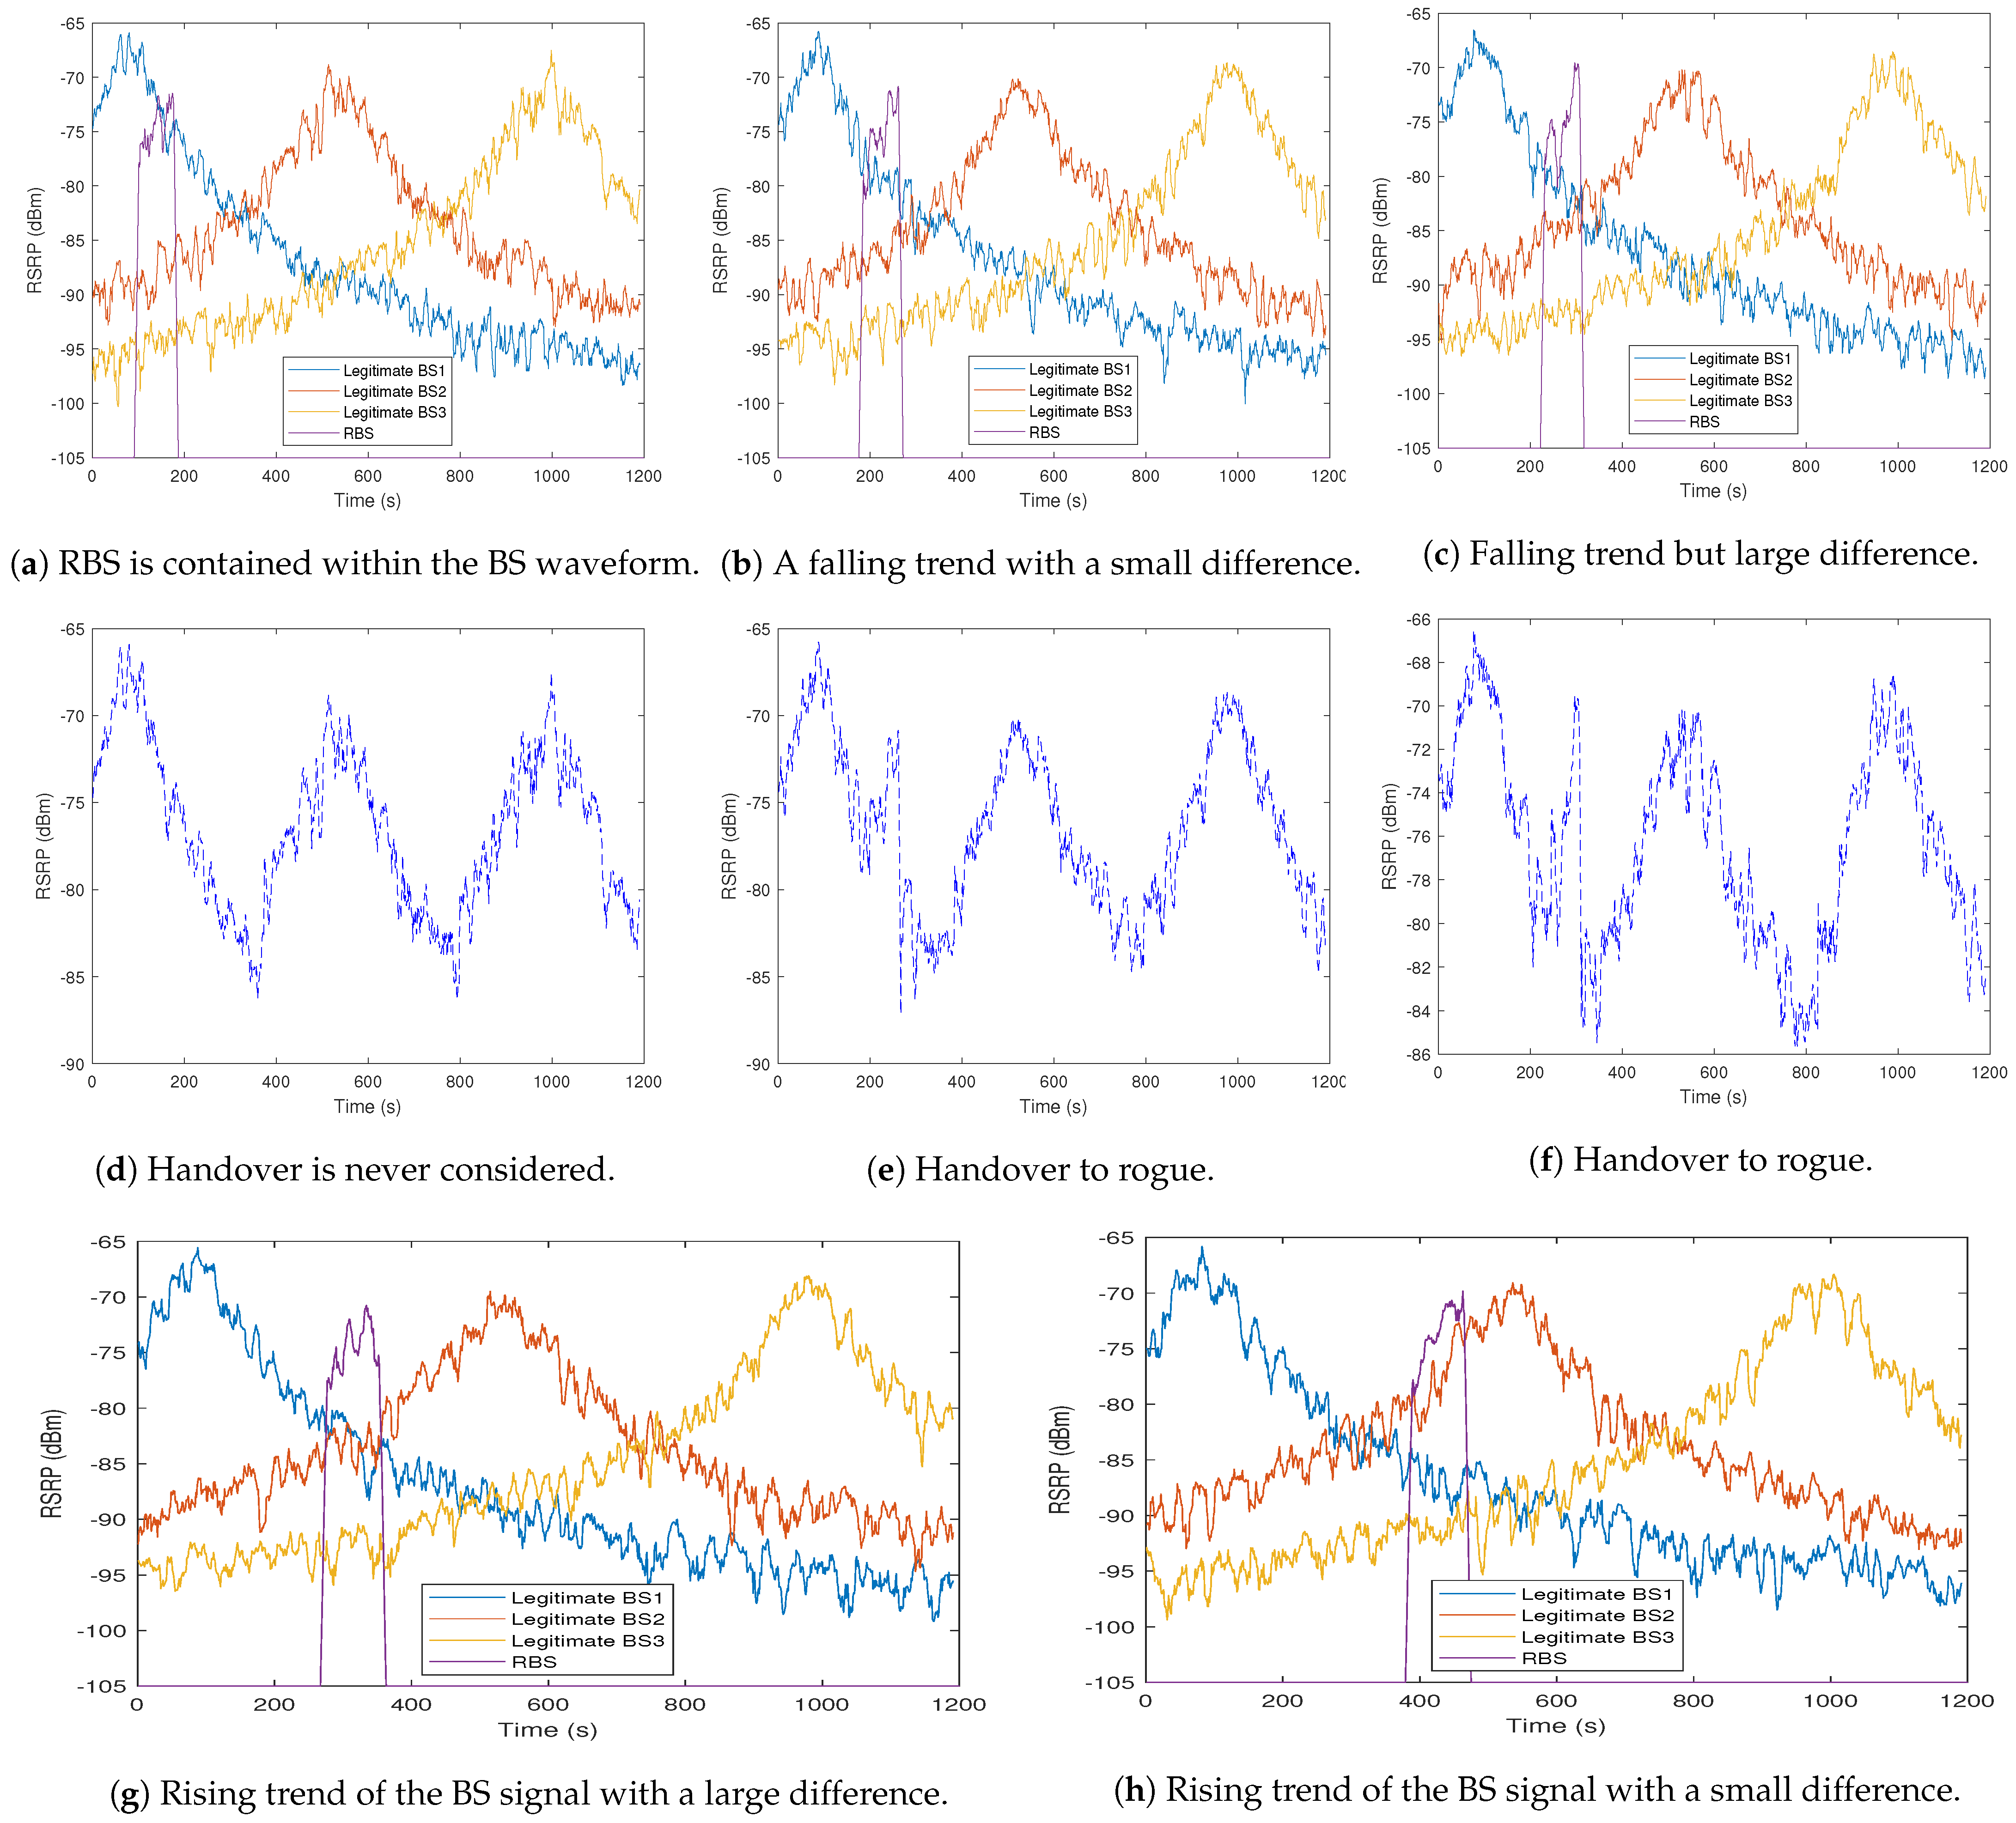
To design an RBS detection mechanism, designers need data that are equivalent to that contained in the MR from a UE. As a first step, a simulation tool was constructed to generate MR data based on the simulation of received signal values from multiple base stations. This includes the ability to specify simulated RBS actors at varying positions to model a range of scenarios—such as when the RBS is detected against a falling BS signal, when the difference in RSS between BS and RBS is small, when the RBS is detected against a rising BS signal, and when the difference in RSS between BS and RBS is large.
As shown in
Figure 7, the simulation generates signal profiles for the RBS in a range of different positions relative to the peak signal received from a legitimate BS which we refer to as the “phase” of the BS.
Figure 7a illustrates a situation in which the RBS is completely included within the legitimate BS waveform. In this case, as illustrated in
Figure 7d, a handover is never considered since the RBS is assumed not to be the strongest candidate BS to which to attach.
Figure 7b,c show the cases when the RBS is detected against a falling BS signal when the difference in RSS between the BS and RBS is small and large respectively. On the other hand, the RBS may be positioned against a rising BS signal such as in
Figure 7g where the difference in RSS between BS and RBS is large, or in
Figure 7h where the difference is small. In all cases, handover depends on a comparison between the RSS of BS and RBS with respect to the threshold, as illustrated in
Figure 7e,f,i,j. These are the scenarios for which we aimed to generate realistic synthetic data.
4.2. RBS Activated Period
This section looks more closely at the handover to an RBS by considering in detail the period during which an RBS is active as a candidate BS.
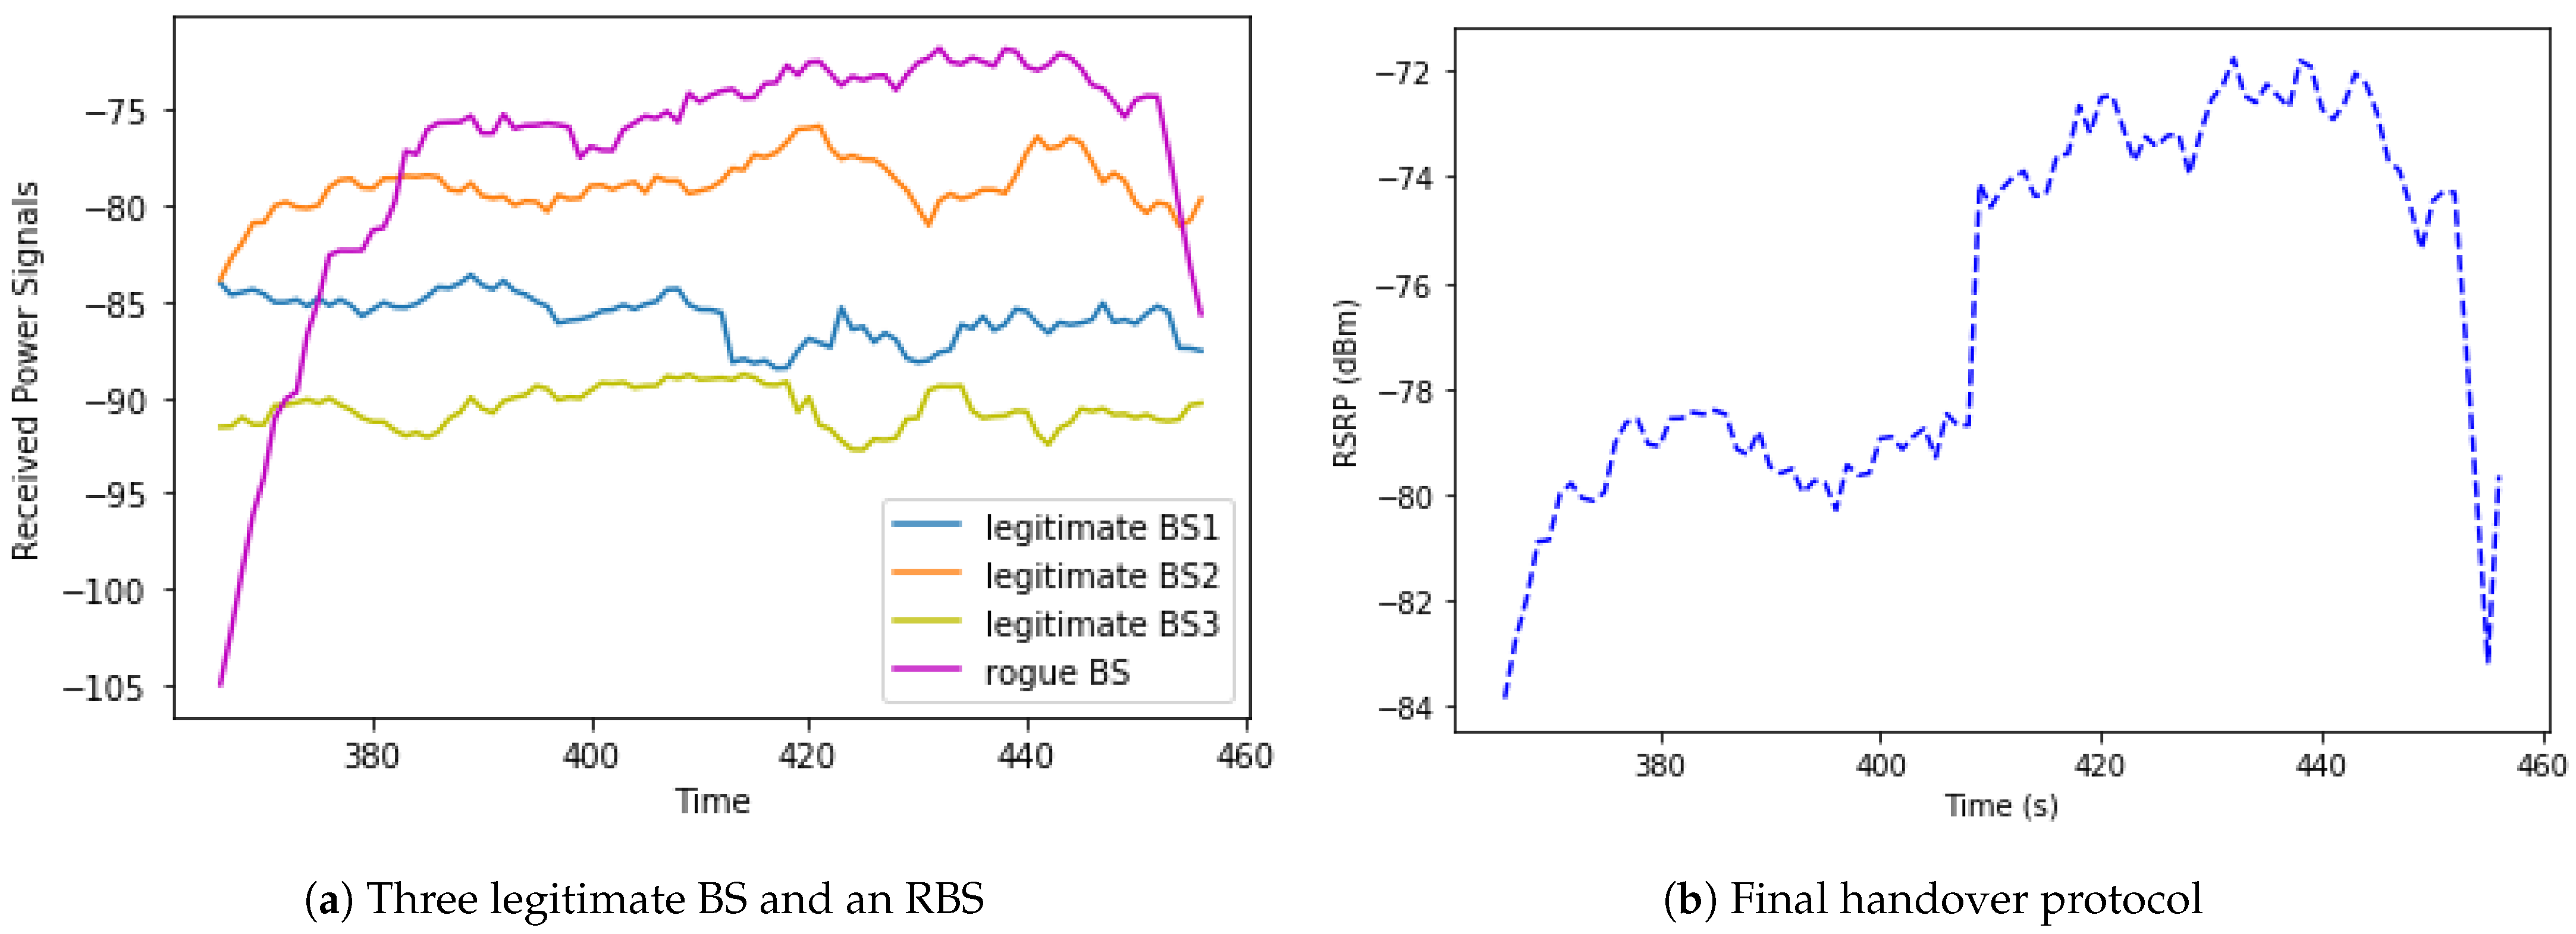
Figure 8a illustrates the situation where the RSS of an RBS rises steeply between time
t = 360 and time
t = 385. The RBS then maintains a strong RSS until time
t = 450 after which it drops sharply.
As shown in the figure, for the period when
380, the moving UE is connected to the orange BS2 and remains connected until the difference in signal strength between “orange” and “purple” passes the threshold (around
t = 410). At that point, the strongest received signal is found to be from the RBS, so the UE hands over to the RBS at that time as shown in
Figure 8b. The vertical axis scale was enlarged to observe the steep rise and the threshold.
The period immediately before connection to the RBS is key in preserving the security of the network. The steep rise in RSS between t = 360 and t = 380 should trigger this signal to represents an RBS, so the handover logic should discount any candidate BS that exhibits this pattern from the handover calculation. Potential future work will focus on the development of techniques to analyse the RSS profile of candidate BS elements so that those that fit the profile of a rogue can be ignored before they are connected to it.
5. Experimental Results
This section provides an overview of the simulation results to verify the proposed attack model.
5.1. Simulation Setup
The experiment was conducted in MATLAB on a quad-core Dell machine with an Intel Core i5-8250U CPU and 16 GB of RAM. The simulation parameters are presented in
Table 1. The following sections provide a thorough explanation of the results of the various simulation scenarios.
Table 1.
Parameter Setting of Simulation in the Attack Model.
Table 1.
Parameter Setting of Simulation in the Attack Model.
| Parameter | Value | Parameter | Value |
|---|
| Platoon’s Speed | 80 Km/h | RBS Number | 1 |
| Frequency | 3.8 GHz | Road Width | 50 m |
| Power of RBS | 1 (watt) | Road Length | 22,500 m |
| Power of BS | 10 (watt) | RBS Gain | 15 (dBi) |
| BS Number | 3 | BS Gain | 1 (dBi) |
5.2. A Flexible Data Generator
This section describes the system developed to model a potential RBS attack scenario in a scalable realistic environment. The geography of this simulation includes a motorway 50 m wide and 500 km long.
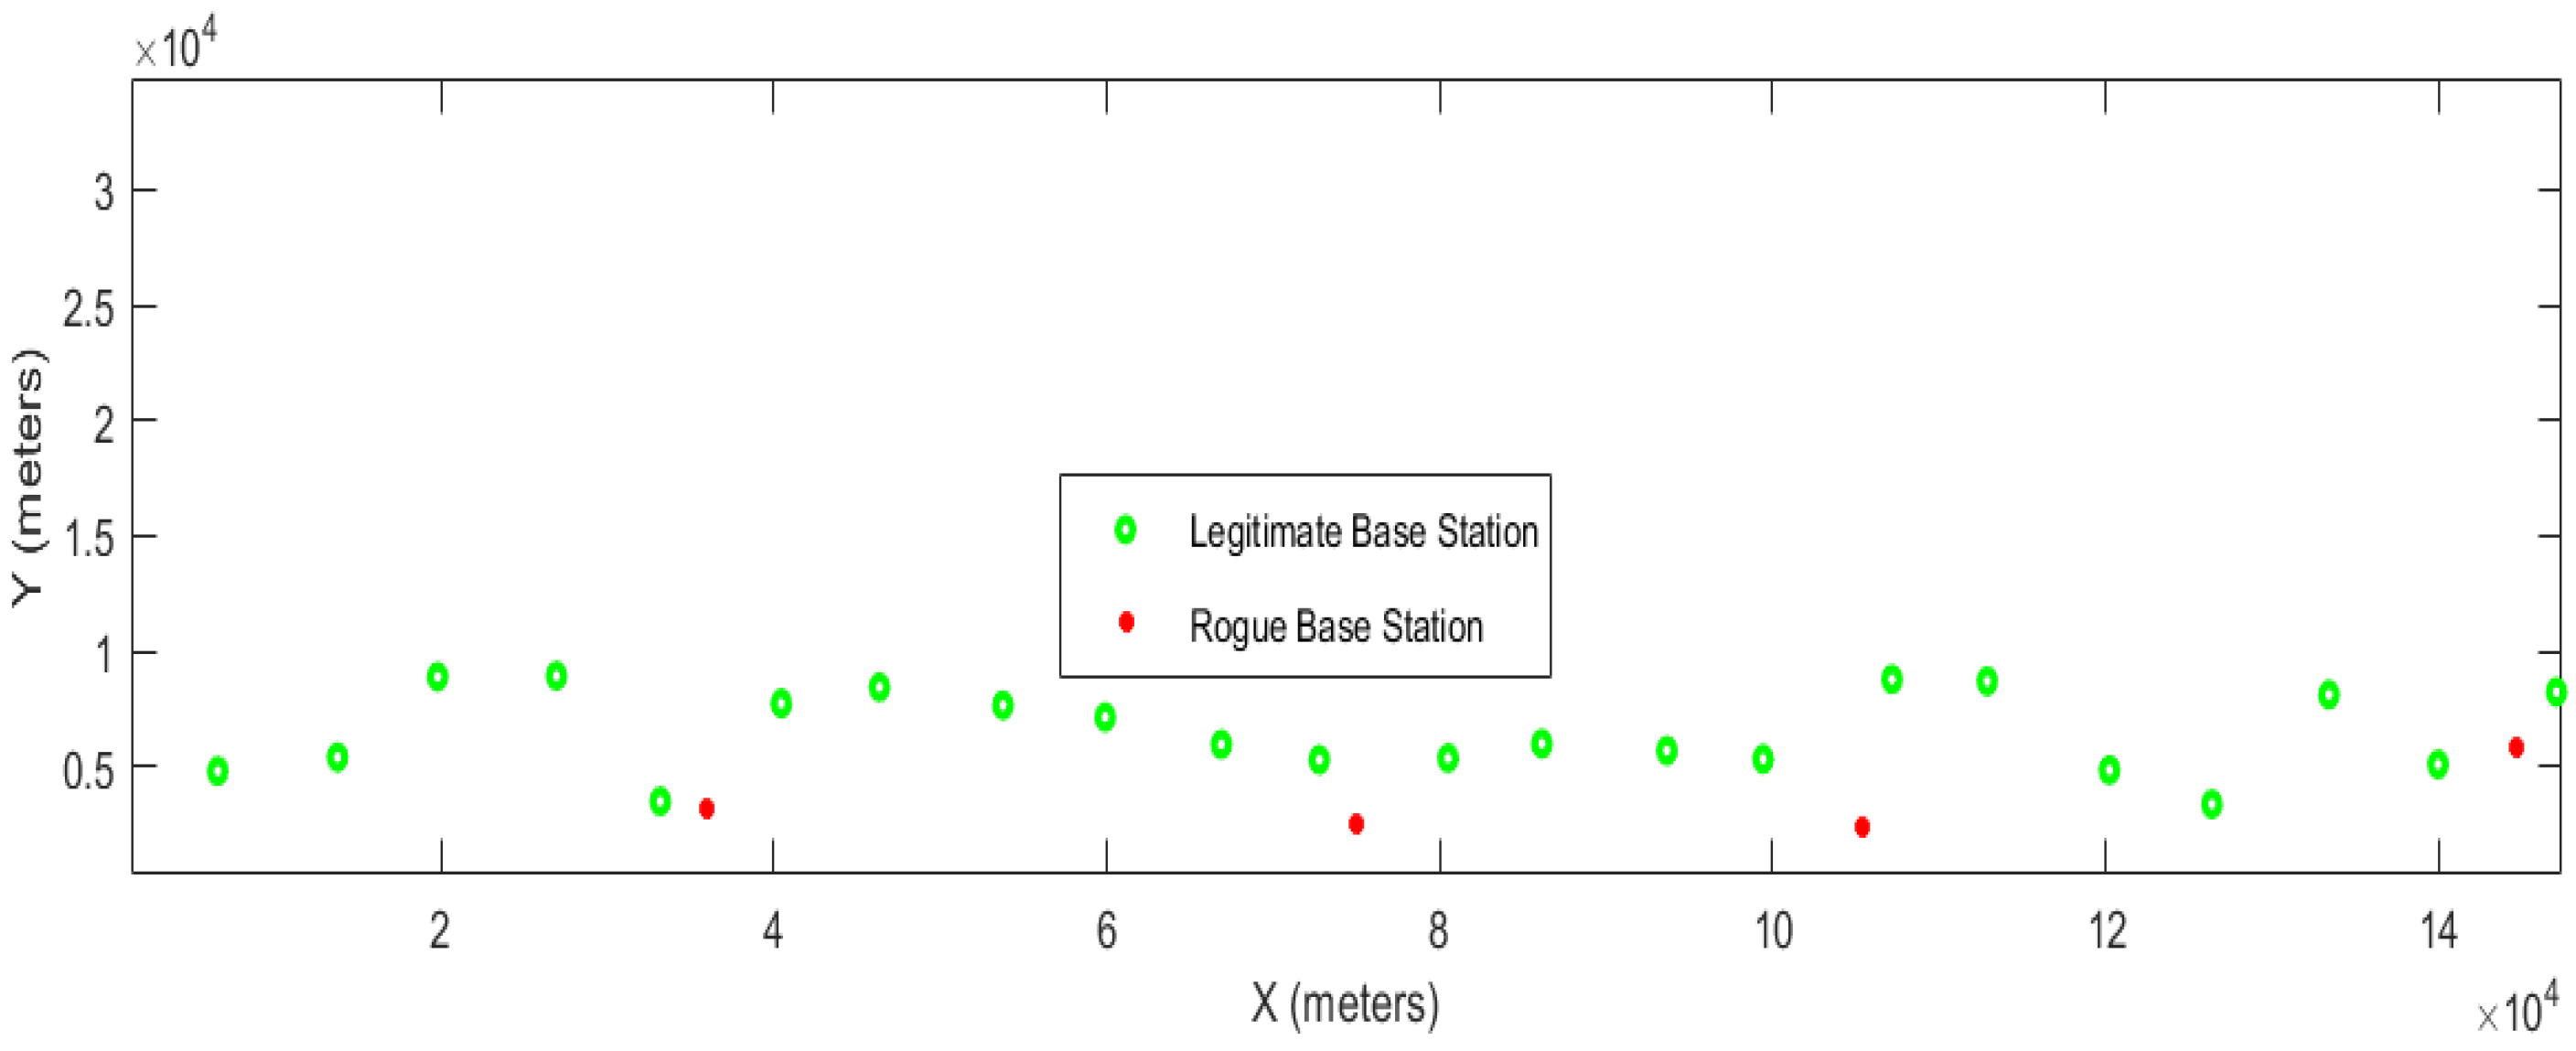
A random number of BS units in random positions along the road and a smaller number of RBS units in the proximity of the roadway are established, as illustrated by the green and red dots, respectively, in
Figure 9. X is the distance along the road and Y is the distance from the road at which the BS/RBS is positioned. Each RBS is positioned such that it appears in different parts of the BS phase, that is, when BS is rising, when BS is falling, when BS is at its peak, and in the “gap” between BS peaks.
As illustrated in
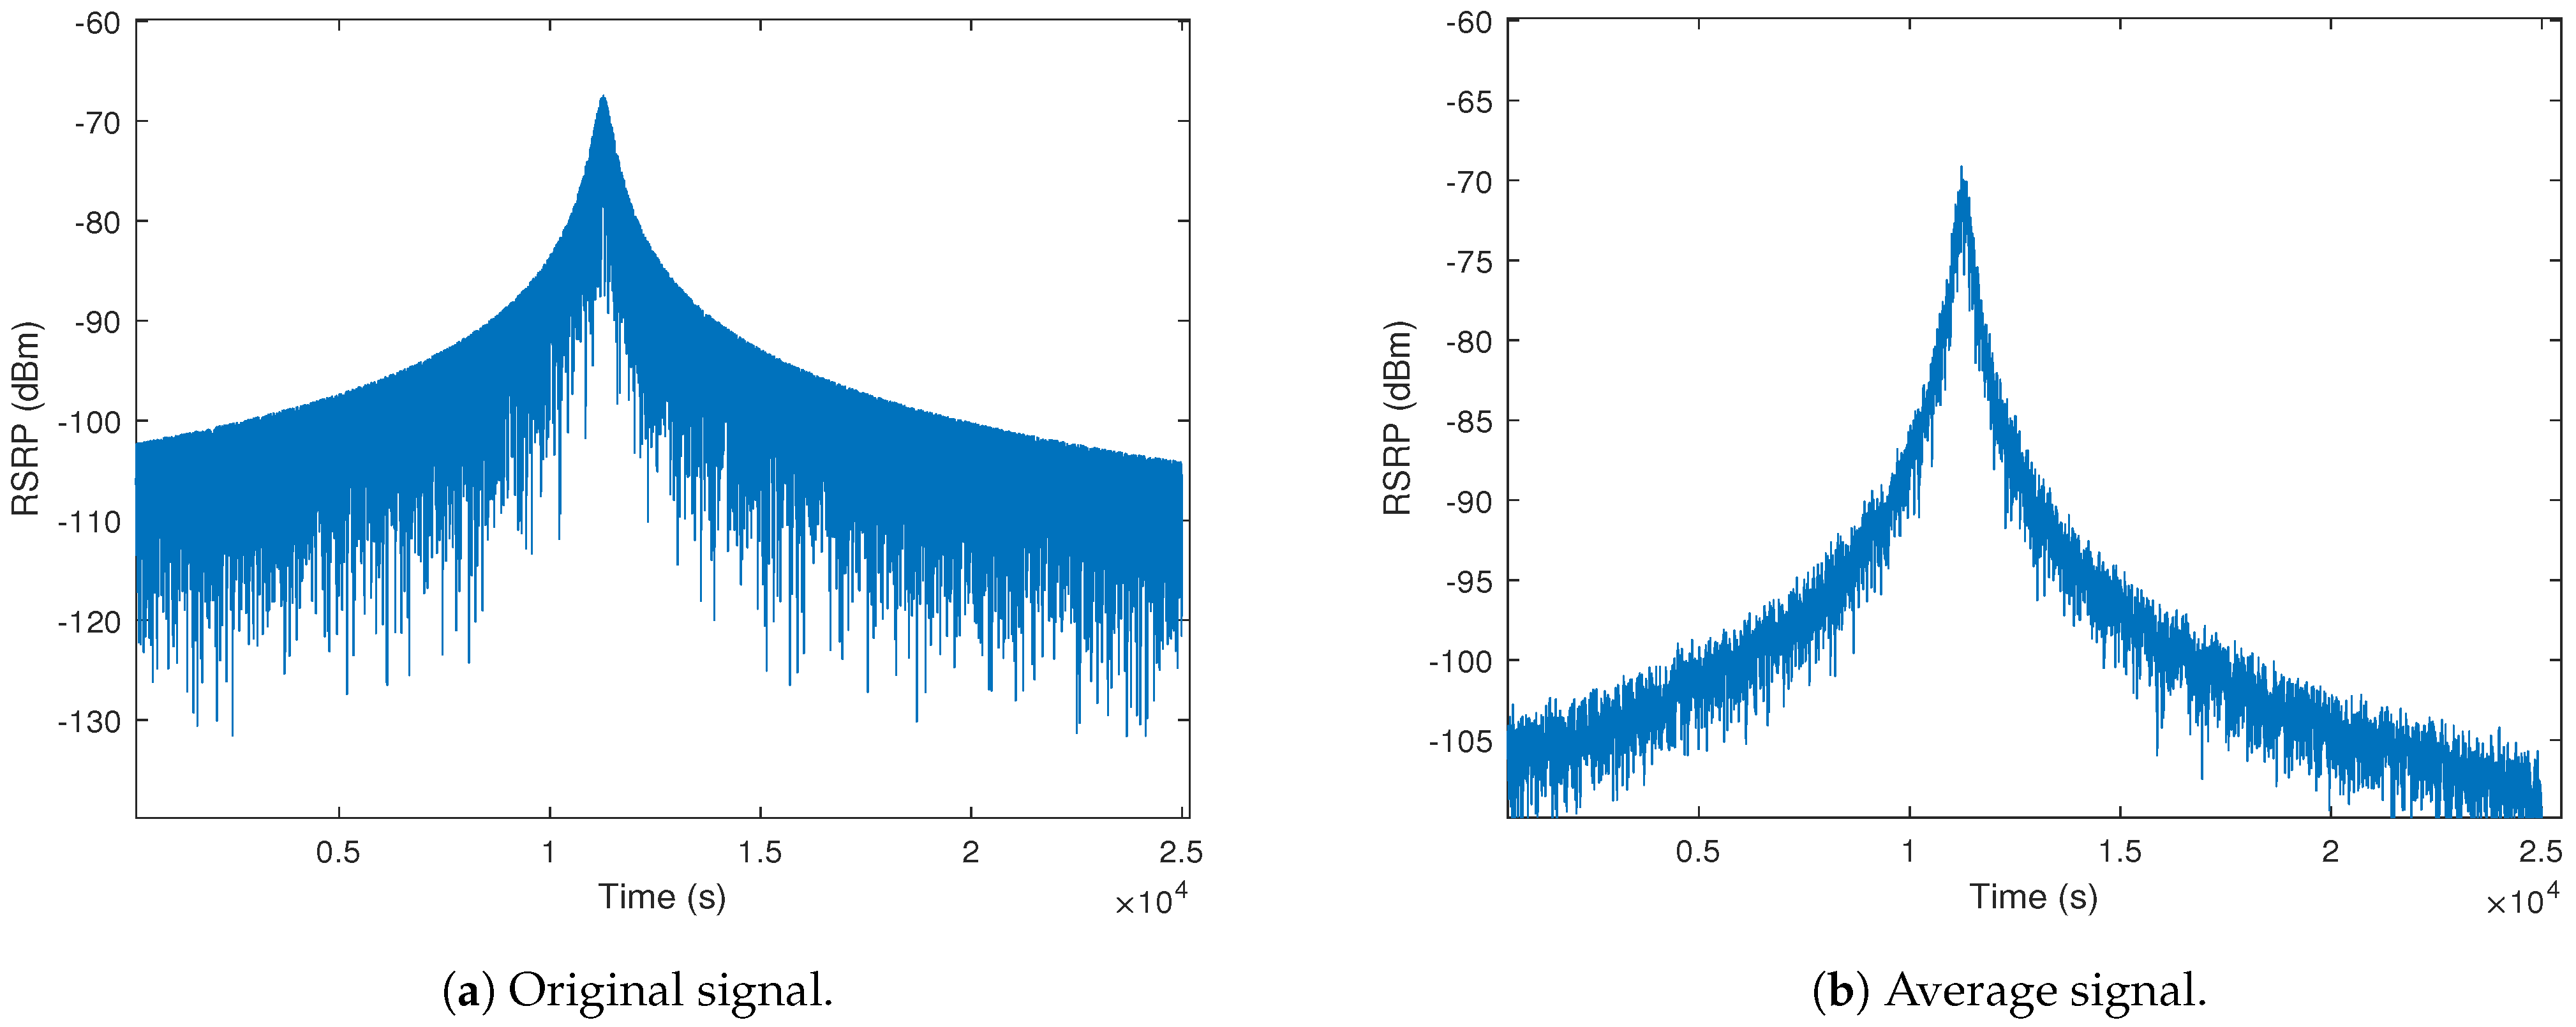
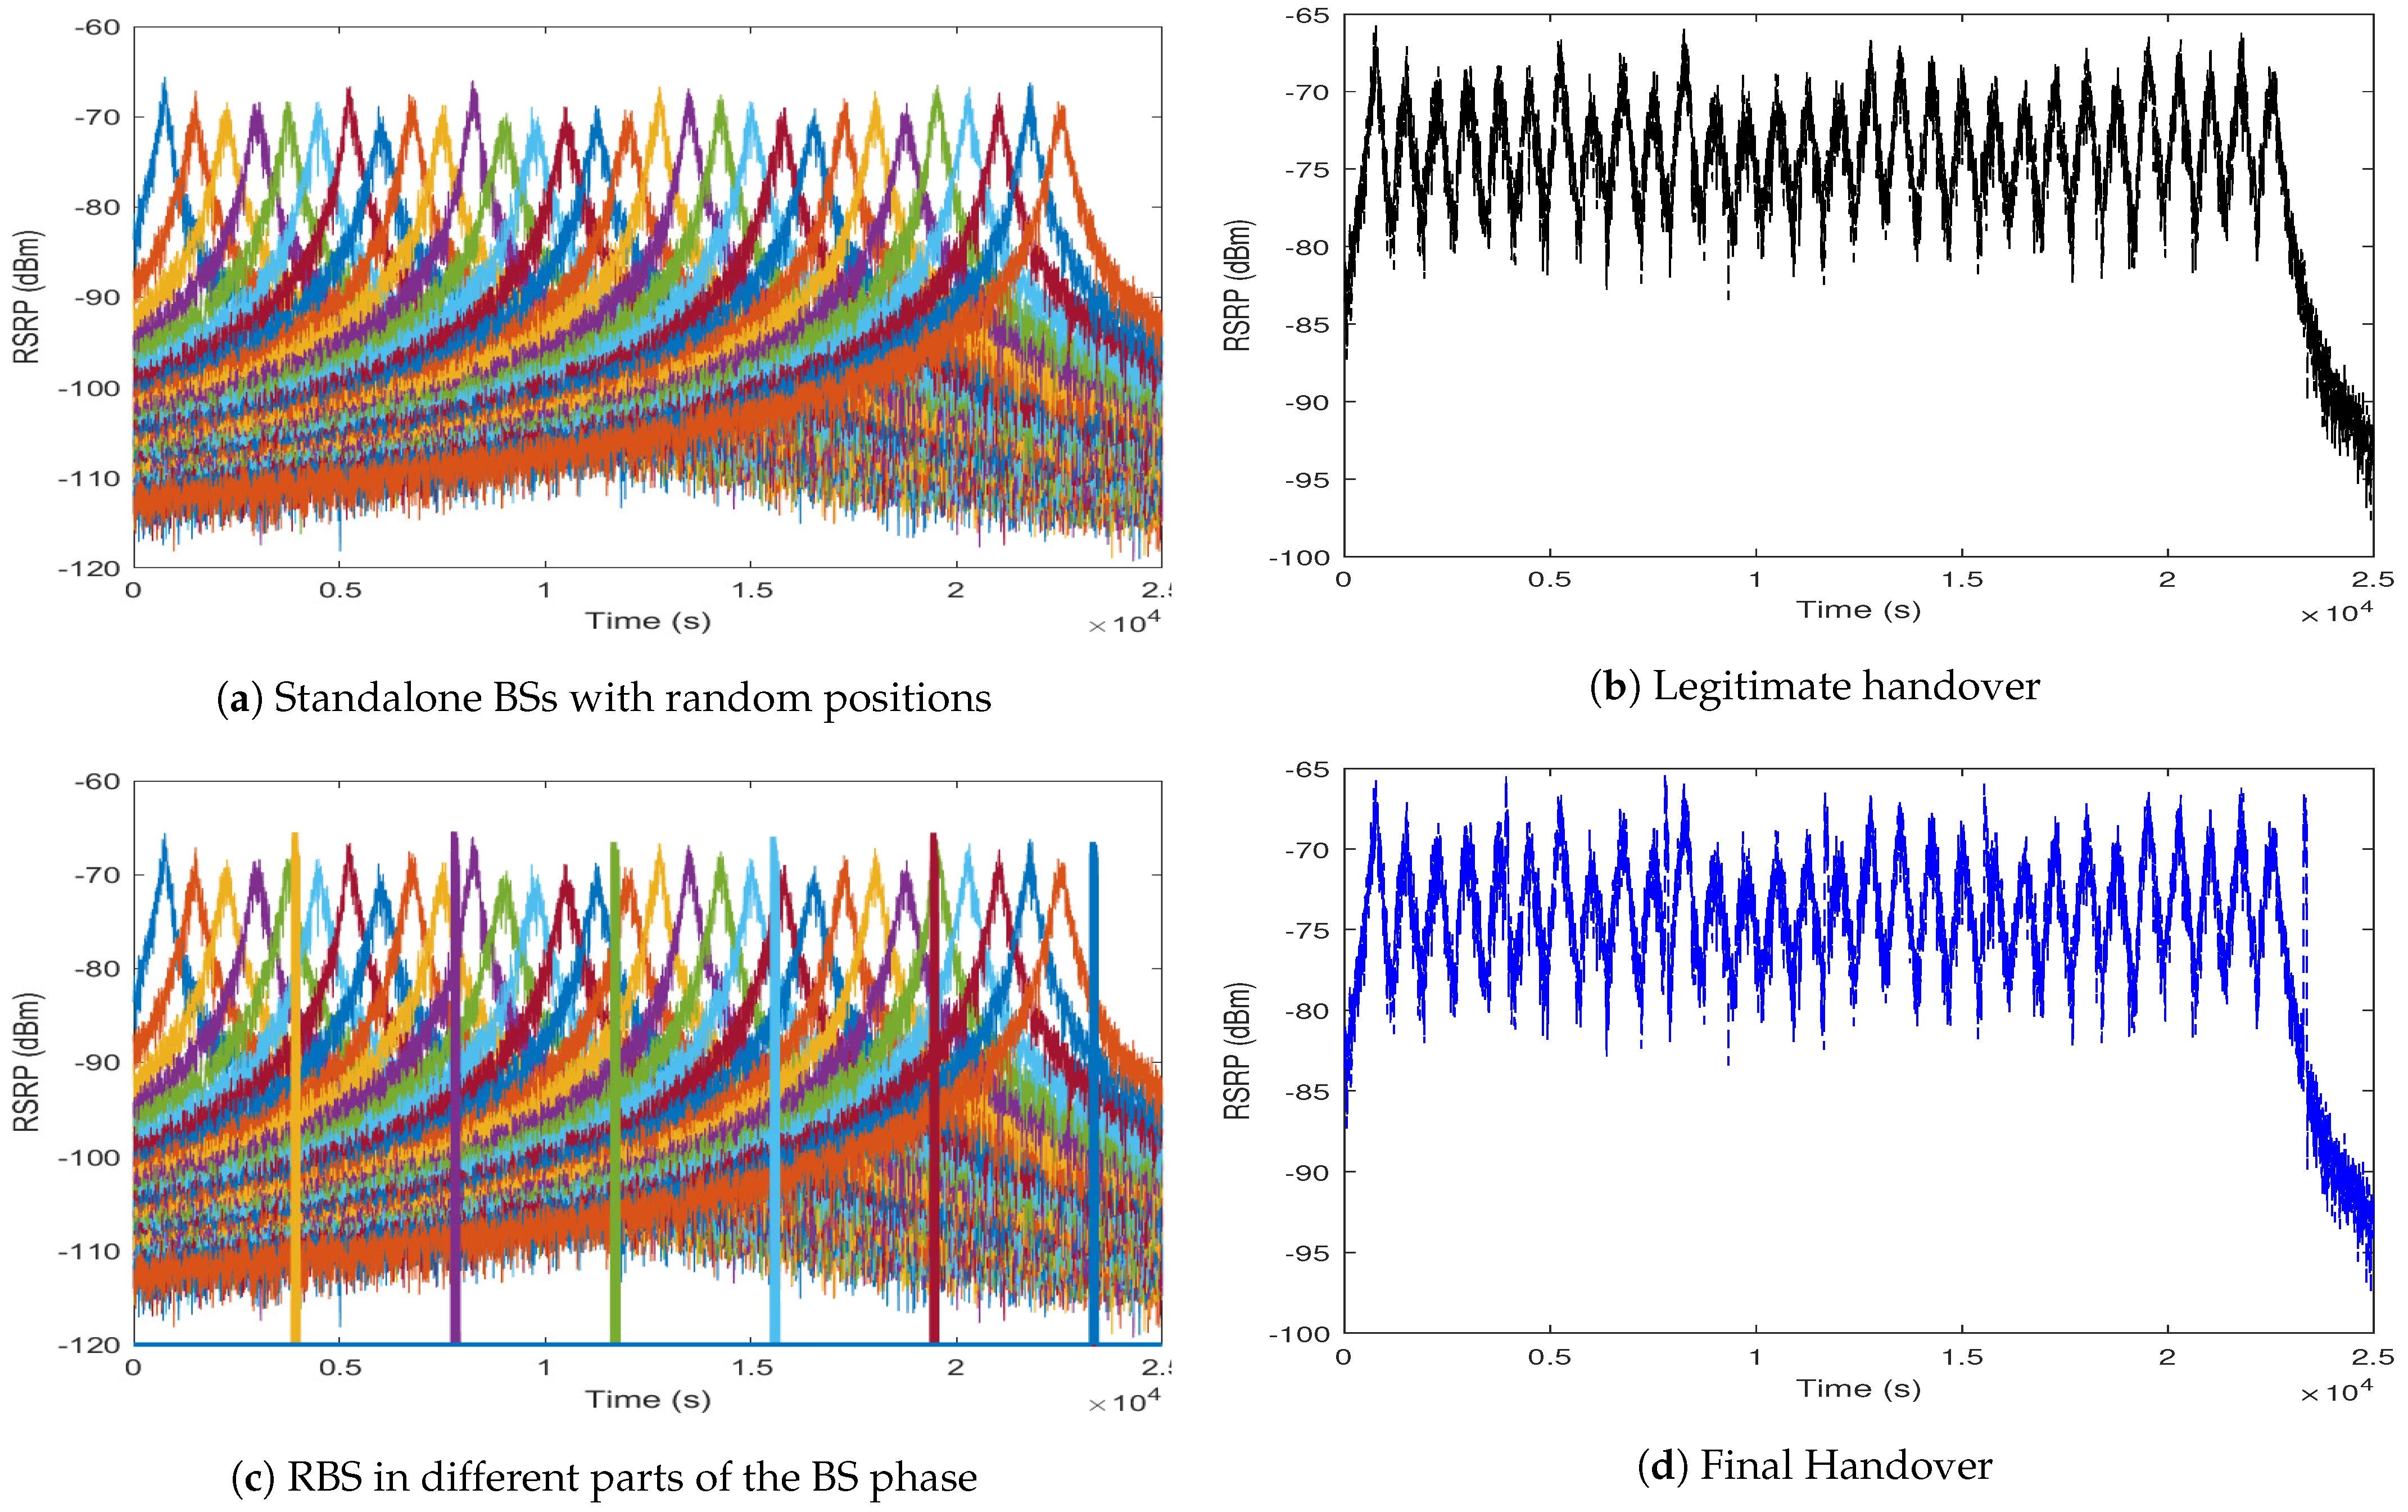
Figure 10, the RSRP for a moving UE from a collection of standalone base stations at random positions is computed. The legitimate BS units provide 5G coverage for a particular area comprising a section of an urban roadway on which autonomous vehicle platoons travel.
When the platoon leader is in the range of the BS units, the RSRP is calculated every second. From this, we observe that the range of the signal is between −115 dBm to −65 dBm as an approximation of realistic network configurations. When the RSRP is greater than −80 dBm, the signal strength is deemed to be excellent and can be described as a strong signal with maximum data speeds. When it is between −80 dBm and −90 dBm it depicts a strong signal with good data rates. From −90 dBm to −100 dBm the signal strength was fair to poor. In this case, a reliable data transfer rate may be attained; however, dropouts are possible. As the signal approaches −100 dBm, the performance drops drastically, whereas at less than −100 dBm disconnection may occur.
The model presented here is based on a combination of simple radio propagation, statistical variation of the path loss and simple Newtonian models of moving objects and the use of high gain antennas at the RBSs. With the randomised placement of the base stations and the speed of the platoon, the model therefore produces values of the expected RSRP as the platoon moves along a road that does not actually exist, but that contains normally encountered radio propagation artifacts. The validity of the model is evident from the results in
Figure 10a as the peak RSRP for each BS occurs at the point where the distance between the BS and the UE is a minimum and the value of that peak varies depending on the randomised distance between the BS and the road.
In
Figure 10a,b, the 5G handover decision protocol is implemented considering only the legitimate BS units. Decision making is based on the RSRP values measured by the UE from the surrounding BS units. In the first second, the BS with the maximum RSRP is chosen as the serving BS. The figure shows how the moving UE moves from BS to BS when the RSRP from the second BS is greater than the 5 dB threshold specified.
Figure 10c introduces a number of RBS units positioned in different parts of the BS phase, i.e., when the BS is rising, falling, at its peak, and in the “gap” between BS peaks. The RBS need to produce a higher received signal (including the threshold) to defraud the UE.
Figure 10d shows that some of these RBSs are located such that they can deceive UEs and compete against legitimate BSs for the handover protocol. When the received signal at the platoon is more than 5 dB higher than the BS, the UE switches from BS to RBS, and the rogue can cause sudden turns resulting in dangerous road accidents.
To date, an attempt has been made to design a software platform that mimics the real signals from legitimate BS and rogue BS so that they can be used for our generated dataset to test its effectiveness in various scenarios. The platform enables the user to control anything that might be variable in terms of the location of each BS, the proximity to the road, the separation between BS units and, the BS power output, and the velocity of the platoon leader to create a realistic dataset. The velocity varies during the simulation and is implemented based on the Markov model and according to the maximum and minimum highway speeds in the UK. Thus, we can easily generate a wide range of simulations with different parameters, resulting in a variety of signal profiles. From the perspective of the platoon leader, each BS might look different as the road curves and the linear distance between the platoon leader and BS units vary. Similarly, the distance from the road of the RBS can be varied.
This study generates realistic data without the need for a complex, expensive 5G testbed. We can do this simply using the software we obtained very realistic results, which allowed us to simulate multiple scenarios more quickly. The simplicity of the simulation model enables the rapid and effective generation of data for any scenario in which RBS elements are positioned in a location that can potentially interfere with a 5G network. Changing parameters and geography of the simulation makes it possible to produce MR data for any UE in a dynamic environment and develop strategies to prevent such attacks.
The simulator described here generates received signal level reports that are calculated from a defined geographical arrangement of base stations and roadways. This will allow the essential parameters of a UE’s measurement reports to be generated, which can then be used to devise new methods to prevent RBS attacks.
The time series measurement data were not available in any references as it is normal for drive test [
12] results to be shown as a distribution of different RSS ranges accumulated throughout the drive test, but the results are broadly compatible with the contour plots in [
13].
6. Discussion and Conclusions
RBS attacks pose a significant threat to cellular communication networks and subscribers which can have devastating effects in V2X scenarios. This paper describes the simulation of a platoon of autonomous vehicles moving through an area of 5G radio coverage, and periodically calculates the RSS. As can be seen from various attack scenarios, there is potential for a compromised BS to be masqueraded by the RBS, which will assume control of the UE. When such an event occurs, an UE can be captured for tens of seconds. This is sufficient time to steal information or cause a car accident.
The simulation model can generate a realistic dataset of radio information and RSS measurements in a reconfigurable scenario with multiple legitimate base stations and a numerous rogues. The dataset is created using radio propagation models and aims to generate measurement reports that exhibit characteristics that would be normally evident in a real drive test. Our experiments show that a dataset that would represent a 20-min drive test can be obtained in only 15 s of simulation. Consequently, this method enables researchers to quickly develop various geographical and radio scenarios and generate MR data in the absence of abnormal radio propagation situations.
As the broadcast channels of gNodeB elements in 5G and previous standards must contain unciphered information so that UEs can identify each BS and decide whether to attach, RBS attacks are always possible. However, by exploiting the data provided in the MRs, the network may look for aberrant behaviour to indicate that an RBS is trying to capture the UE. The work to date described in this paper presents the specifications of a tool for generating realistic streams of RSS data. A software platform was developed to simulate signals from legitimate BS units and variable positioned RBSs. The dataset yielded from this stage was approximately 7 h of drive test results passing 30 legitimate BSs. It seems likely that an ML-based solution can yield a robust and adaptive RBS identification mechanism that can be trained on a large set of signal strength measurements covering many different scenarios.
The proposed novel flexible data generator creates received signal-level reports based on vehicles platooning scenarios. Users can generate a highway scenario that is hundreds of kilometres long with randomised locations of base station and variable speed of the vehicles. The simulation runs 80 times faster than real time so that we can generate large time series datasets of a UE’s measurement reports, which can then be used to design new techniques for detecting RBS attacks.
The next step of this work will involve using this dataset to develop high-performance models for the detection of RBS so that they can be rejected before being considered for handover. This will exploit the output from the simulator to design ML methods to identify RBS attacks and protect against them.
