Article

The Efficiency of Edge Banding Module in a Mass Customized Line for Wooden Doors Production

1
Department of Furniture Design, Faculty of Forestry and Wood Technology, Poznań University of Life Sciences, Wojska Polskiego 38/42, 60-627 Poznań, Poland
2
Porta KMI Poland, Szkolna 54, 84-239 Bolszewo, Poland
3
Department of Wood Science and Technology, Faculty of Forestry and Wood Technology, Mendel University in Brno, Zemědělská 3, 61300 Brno, Czech Republic
4
Department of International Business, Faculty of Economics, University of Gdańsk, Armii Krajowej 119/121, 81-824 Sopot, Poland
5
Center of Wood Technology, Łukasiewicz Research Network—Poznan Institute of Technology, 60-654 Poznań, Poland
*
Author to whom correspondence should be addressed.
Appl. Sci. 2022, 12(24), 12510; https://doi.org/10.3390/app122412510
Submission received: 16 November 2022 / Revised: 2 December 2022 / Accepted: 5 December 2022 / Published: 7 December 2022
(This article belongs to the Special Issue Advances in Wood Processing Technology)

Abstract

:
The TechnoPORTA technology line is a fully automated smart line ensuring the highest quality and efficiency of production wooden doors. The aim of the study was to experimentally determine the performance of the edge banding module in the TechnoPORTA line on particular working days and to determine the possible influence of organizational and technological factors characterizing the line’s operation, which can be defined and determined by analyzing the temporal technological data obtained from the IT systems controlling the line’s operation. The research was conducted on the edge banding module, which is crucial to the performance of the entire TechnoPORTA line. During the study, data on door leaf machining were collected such as the mean time of production per one working cycle, mean time of retooling, number of retooling, number of door leaves leaving in a series, and most frequent time of series. The data collected by the IT system controlling the line indicates that this module is flexible and its performance is not related to the control parameters. The results can be used to improve the operation of the module and the replication of the work schedule to subsequent modules of the technological line.

1. Introduction

Davis [1], the creator of the concept of mass customization (MC), defined it as reaching a large number of customers, as is the case in mass markets, but also treating them individually, as in individualized markets. The assumption of MC is high individualization while maintaining relatively low costs and mass production efficiency [2]. Today, the term MC is used for strategies connected with high variety, personalization, and flexible production [3]. This results from the acceptance of the individual treatment of consumers. MC is also related to the increased global competition, shortening the life cycle of products as well as implementing new production and information technologies that enable companies to produce to customer specifications at low cost [4,5]. Facing the customer-driven market, the product design must cover a larger scope of the value chain and accentuate high-added value to the customers [6]. MC can be treated as a key instrument in building relations between producers and customers and gives manufacturers the opportunity to increase customer satisfaction, and hence customer retention in the long-term [7], which is followed by increasing customer loyalty [8].
According to the concept, mass personalization enables companies to achieve a competitive advantage through a product differentiation strategy while maintaining cost-effectiveness. Cavusoglu et al. [5] explained that if the customization cost is not low enough, companies should consider offering custom products instead of one single product. The authors emphasize that introducing flexibility requires a significant initial investment, known as the cost of operational flexibility. Furthermore, the mass production of tailor-made products cannot proceed directly without some loss of efficiency. Even in an increasingly individualized economy, many products are actually more semi-classic than completely custom-made. An example is a product in which the consumer can choose the species of wood, and the finish to be used in a particular design. Manufacturers of ready-to-assemble furniture are experiencing increasing demand from customers who expect products to be tailored to their specific needs such as a system for designing personalized ergonomic furniture (chairs, beds, tables, kitchen interiors, etc.) using anthropometric dimensions or other specific needs [9,10,11,12]. Based on the empirical test, Blecker and Abdelkafi [13] underlined that proliferation had a significant impact on cost due to the complexity of production, which affects the level of overhead costs. Of great importance, in addition to the variety of products, is the construction of the material being processed such as solid wood or wood-based panels, since the processing of wood-based materials is specific, which can sometimes limit the scope of customization [14,15]. As product variety increases, the planning complexity increases with more on-floor alternative routes, more work-in-progress inventory, assembly line balancing problems, increasing variability, etc. [13]. In the door industry, constraints on carrying out mass customization also arise from technical standards specifying requirements, for example, in terms of strength, intrusion resistance, soundproofing or other factors, with a particular focus on doors for public buildings [4].
Innovations in manufacturing processes should affect the cost reduction for the customer, reducing waste without additional resource requirements. Referring to the idea of a sustainable, circular economy, regeneration and the reuse of waste products and production residues can significantly reduce energy consumption and waste [16,17,18]. In modern production lines, achieving green production by saving energy and reducing emissions is possible by combining the automation of most production operations and the source and type of raw materials used in products such as using equally valuable forest biomass and its own production waste [16,19,20]. The answer to these requirements is lean manufacturing (LM) [21,22]. For any manufacturing company, machine breakdowns and downtime are a source of unavoidable costs. It is their reliability that affects the productivity of the company and directly affects the company’s bottom line. More and more companies are recognizing the need to control the efficiency of machinery utilization, which allows them to identify waste in the technological processes implemented and the existing production reserves [23]. The target state that all enterprises should strive for is 100% utilization of the machinery park in their possession, and at the same time, no shortage of production is realized with an efficiency corresponding to the nominal efficiency of the technological equipment and machinery in their possession [24]. Based on these assumptions, the Porta KMI Poland door manufacturing plant is betting on innovation in the development and modernization of the production hall by creating a new customized TechnoPORTA technological line [25]. This is a fully automated intelligent module line that ensures the highest quality and production efficiency. Designed for mass customization while maintaining the required minimum production batch size (one door leaf), the line meets the highest technical requirements [4]. The line was developed using technologically advanced machinery and equipment, enabling the greatest possible automation of work at each stage of processing including the positioning and feeding of material and machine changeover [26,27].
The need for improvement in companies has existed for a long time, but in today’s rapidly changing market, characterized by high dynamics and the need to flexibly adapt production to the needs, it is becoming essential to implement [28,29,30,31]. There are many tools and indicators for this to analyze the possibility of improving production processes in a manufacturing plant including TQM (total quality management) [32,33,34], lean management [35,36], Six Sigma [37,38], and quality management system (QMS) in accordance with the ISO standards [39,40]. An essential support for process improvement is the provision of adequate human resources to effectively manage and improve processes [41,42]. Achieving a high level of product quality requires continuous monitoring, analysis, and improvement of the process. Continuous monitoring of the production process involves recording and collecting accurate data on its progress. This type of activity is an important part of a company’s management strategy [43]. For this purpose, it is possible to use manual methods (i.e., filling out the appropriate index cards or forms), but especially electronic methods (i.e., using MES—manufacturing execution systems). However, in order to analyze the process, it can be difficult to coordinate the use of measurements with different specifications and simultaneously from multiple workstations. It is much more practical to use numerical indicators of a synthetic nature that combine data from different sources. For this purpose, so-called key performance indicators (KPIs) are used in manufacturing systems. KPIs are defined as a set of measures (metrics) used to facilitate the evaluation of the performance of a production system from the perspective of productivity, quality, and maintenance [44,45].
In light of the need to evaluate the use of modules in the TechnoPORTA line in order to determine the fulfilment of the productivity design assumptions under the conditions specified by the MC concept, it was decided to conduct research to obtain production data from the IT system controlling the operation of the line. The aim of this research was to experimentally determine the performance of the edge banding module in the TechnoPORTA line on particular working days and to determine the possible influence of organizational and technological factors characterizing the line’s operation, which can be defined and determined by analyzing the temporal technological data obtained from the IT system controlling the line’s operation.

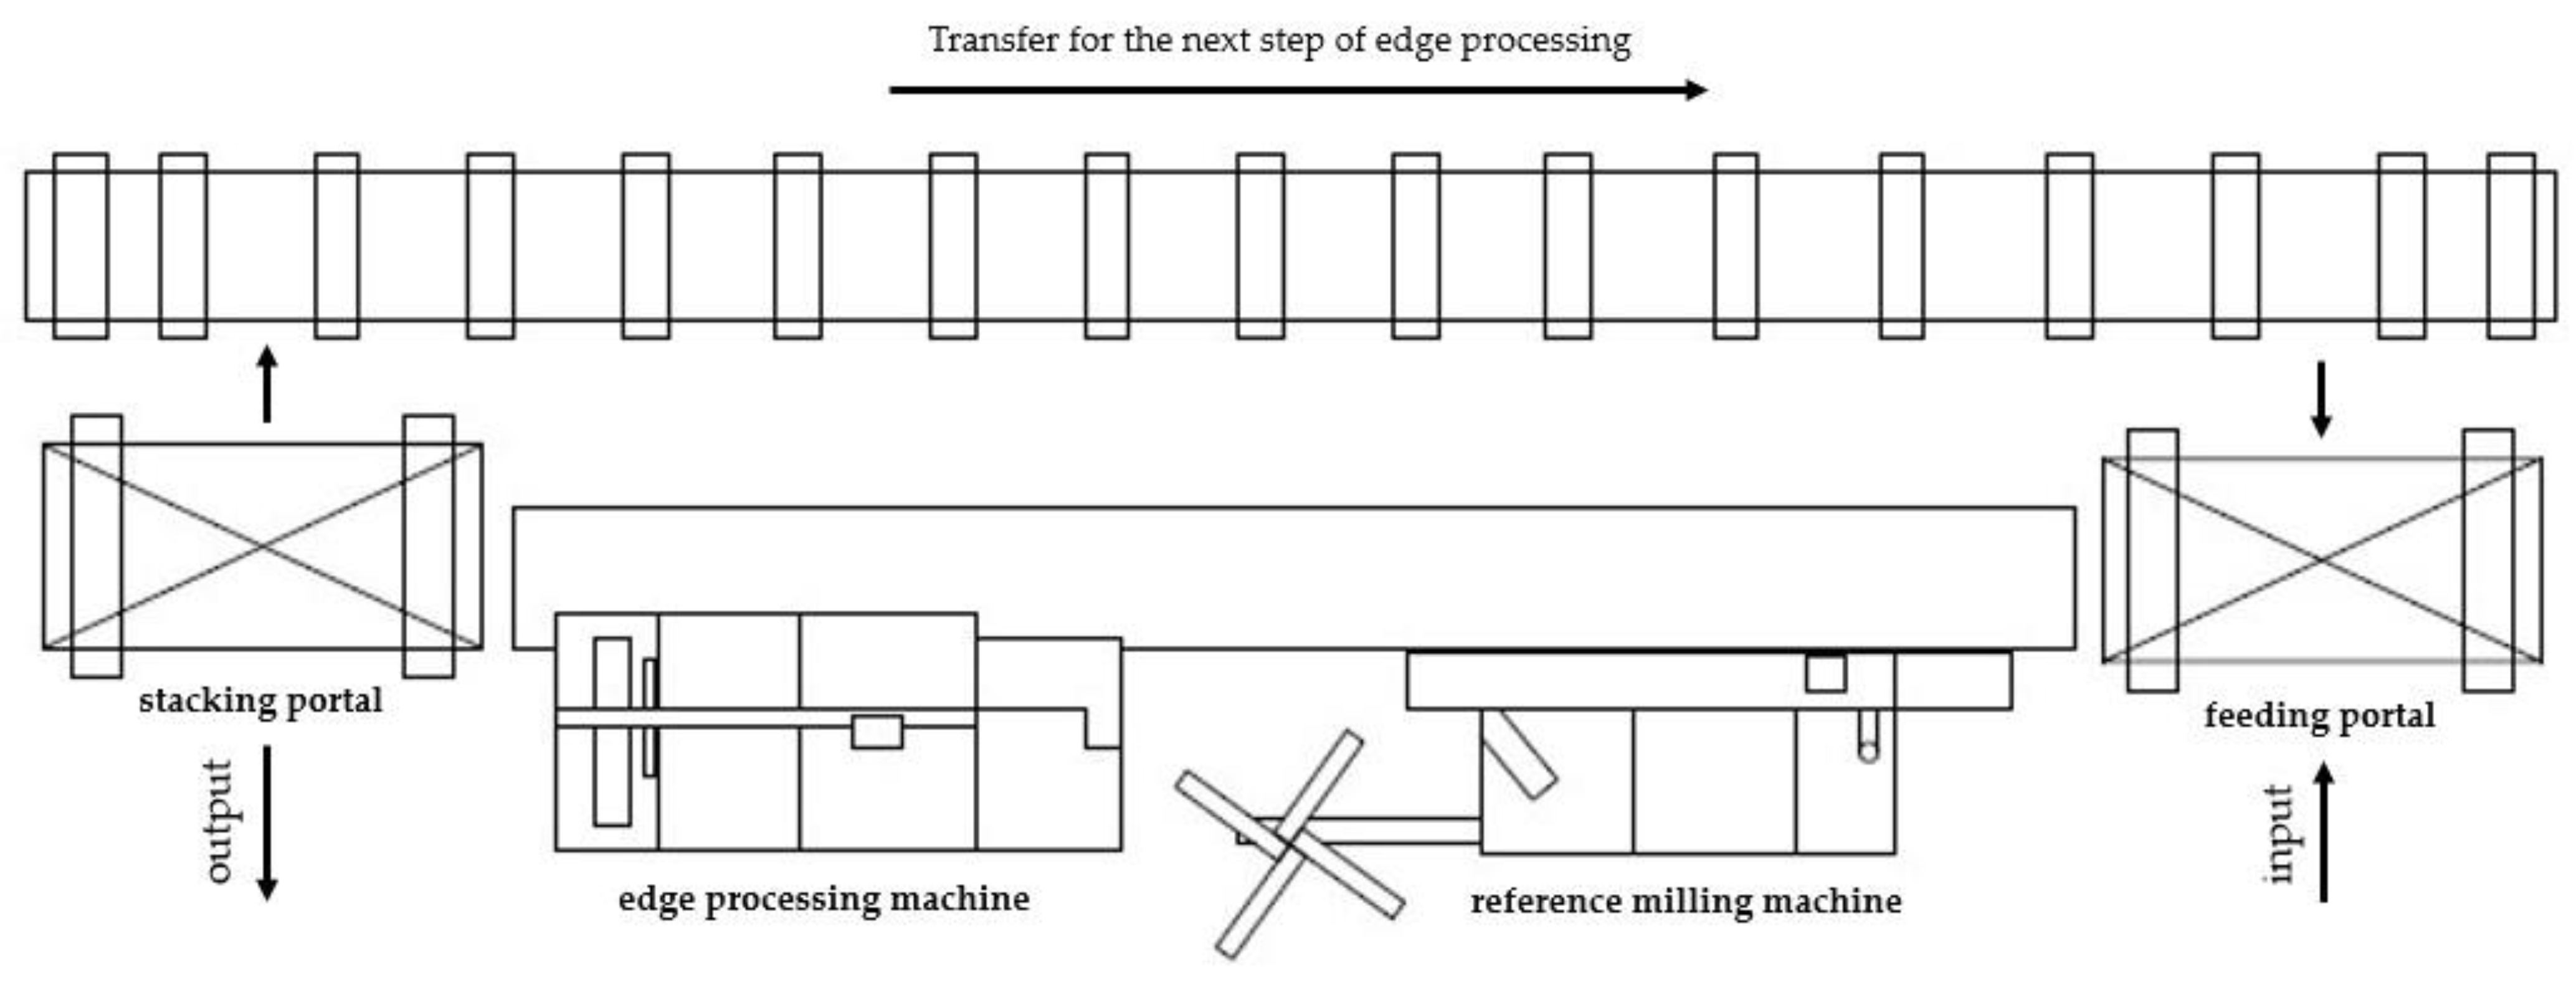
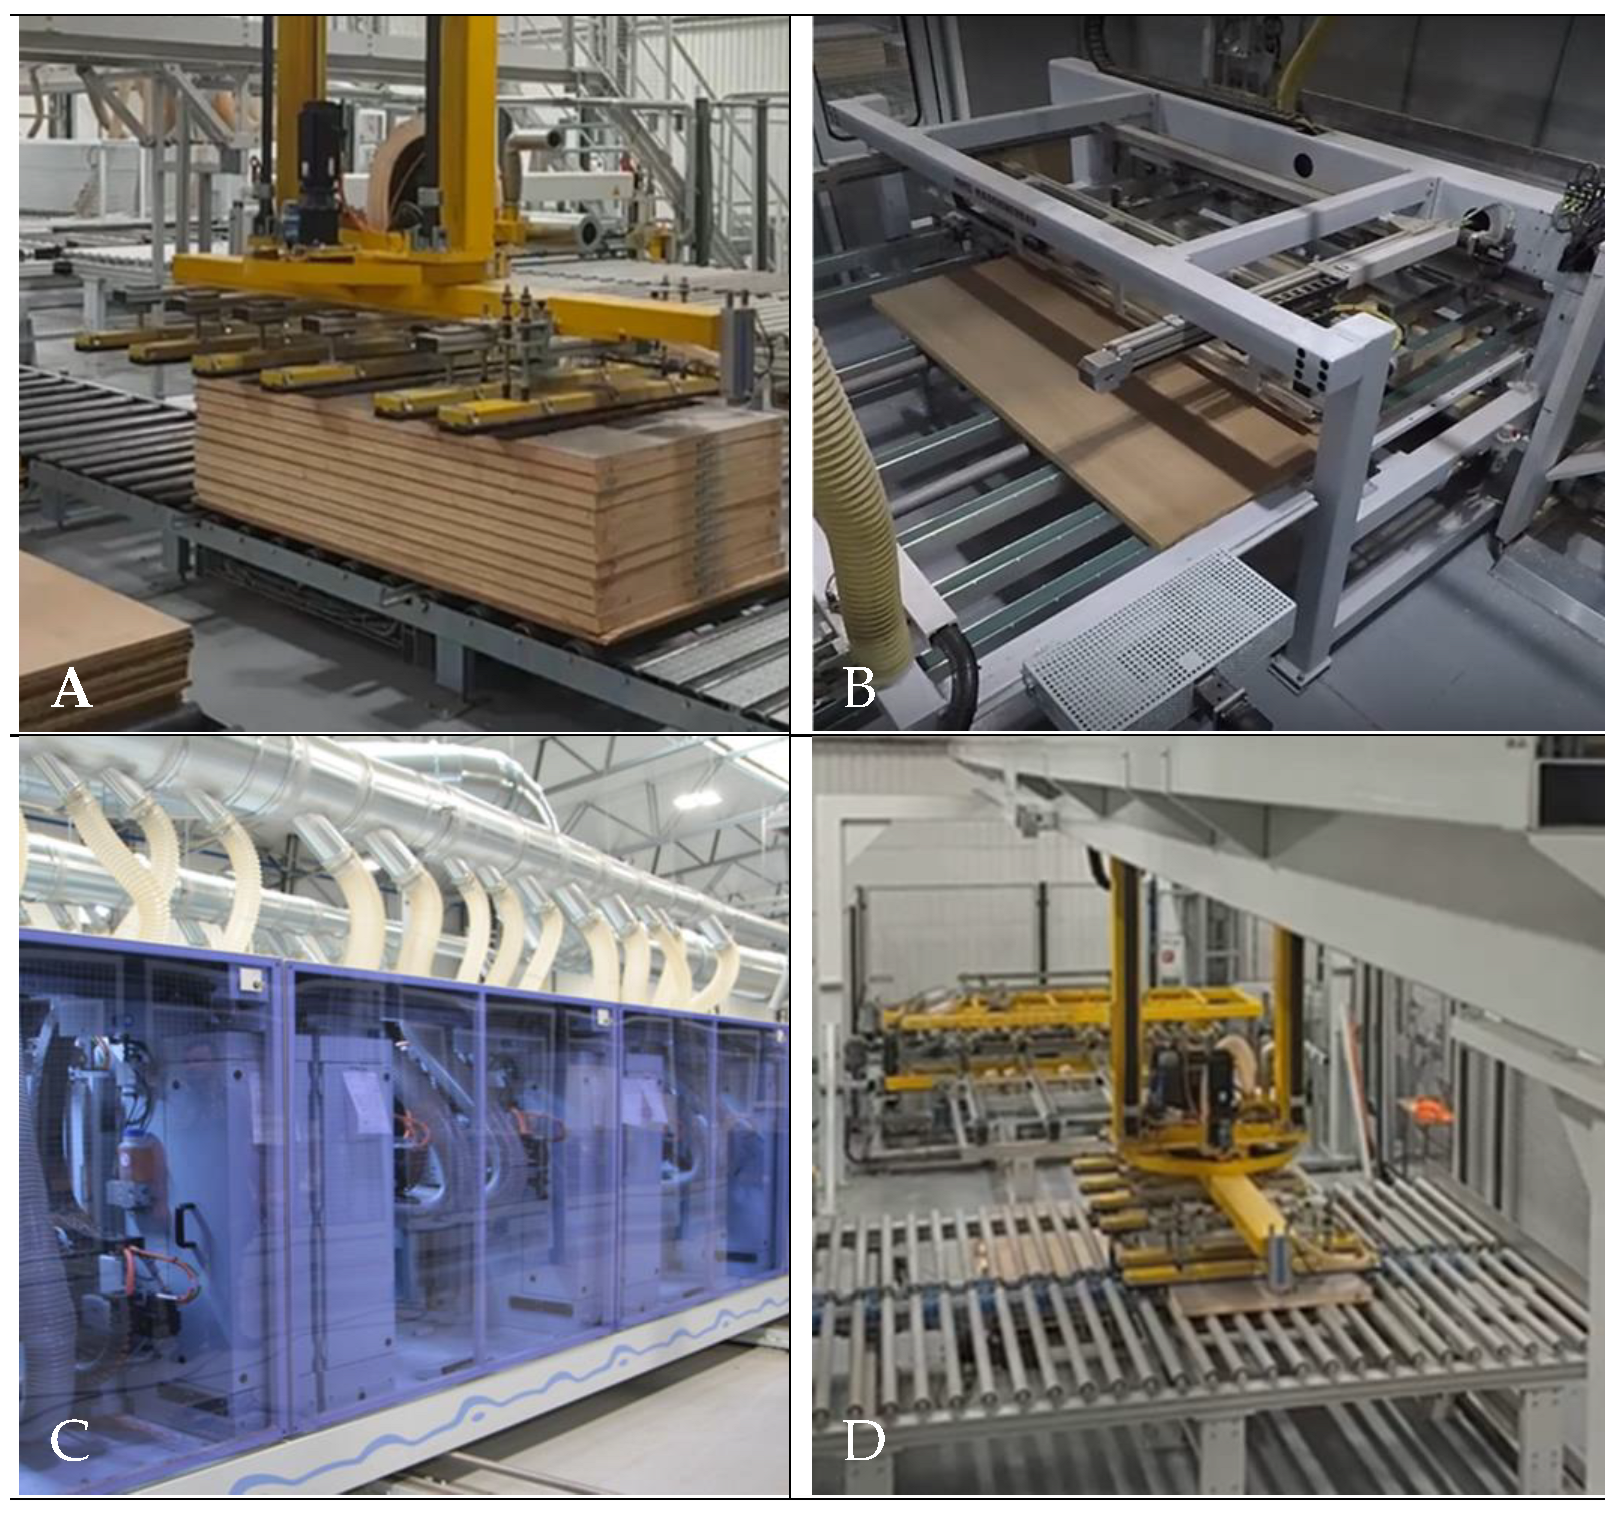
2. Materials and Methods

The edge banding module, which is crucial to the performance of the entire TechnoPORTA line was selected for testing. During the production process, each door leaf passes through this module at least three times (up to six times) to process three edges (two sides and one top). Therefore in order to produce one door leaf, the module must perform from three to six working cycles. In this process, subsequent machining units perform the following actions:
  • Feeding door leaves for production (feeding portal);
  • Reference edge milling (reference milling machine);
  • Edge processing (the edge with a rebate processing machine);
  • Stacking and transfer to the further processing of door leaves (two-way stacking portal).
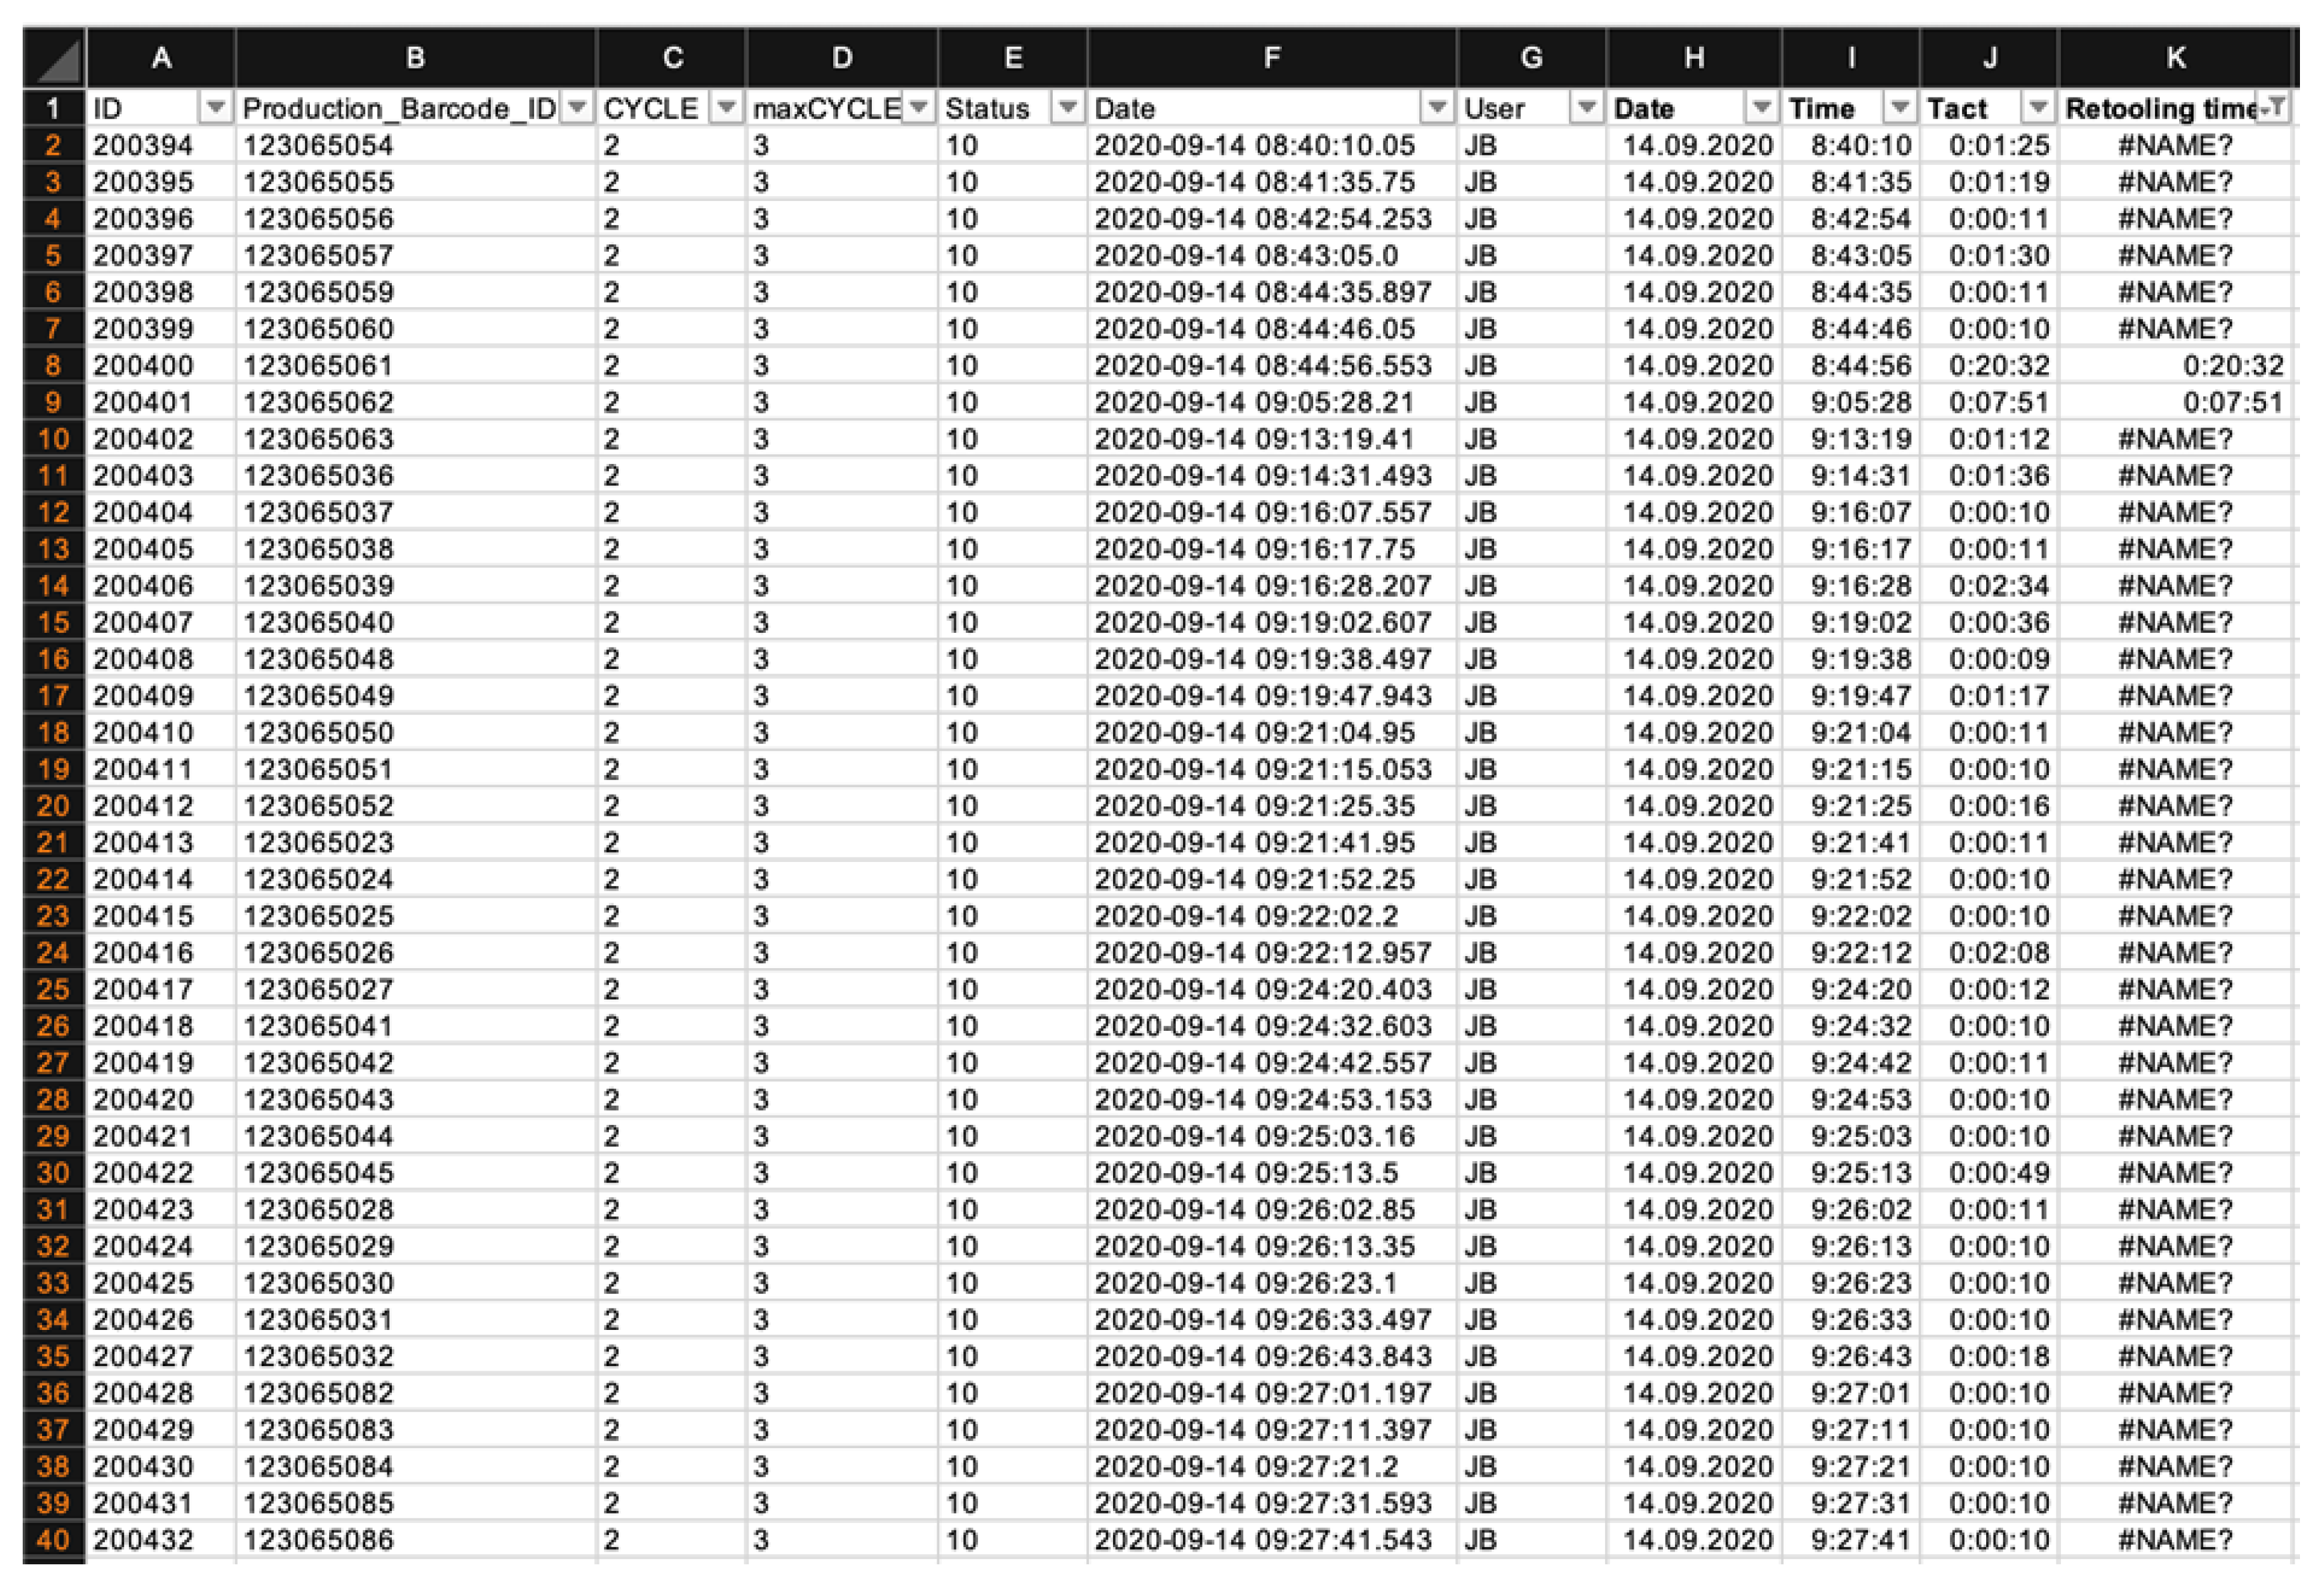
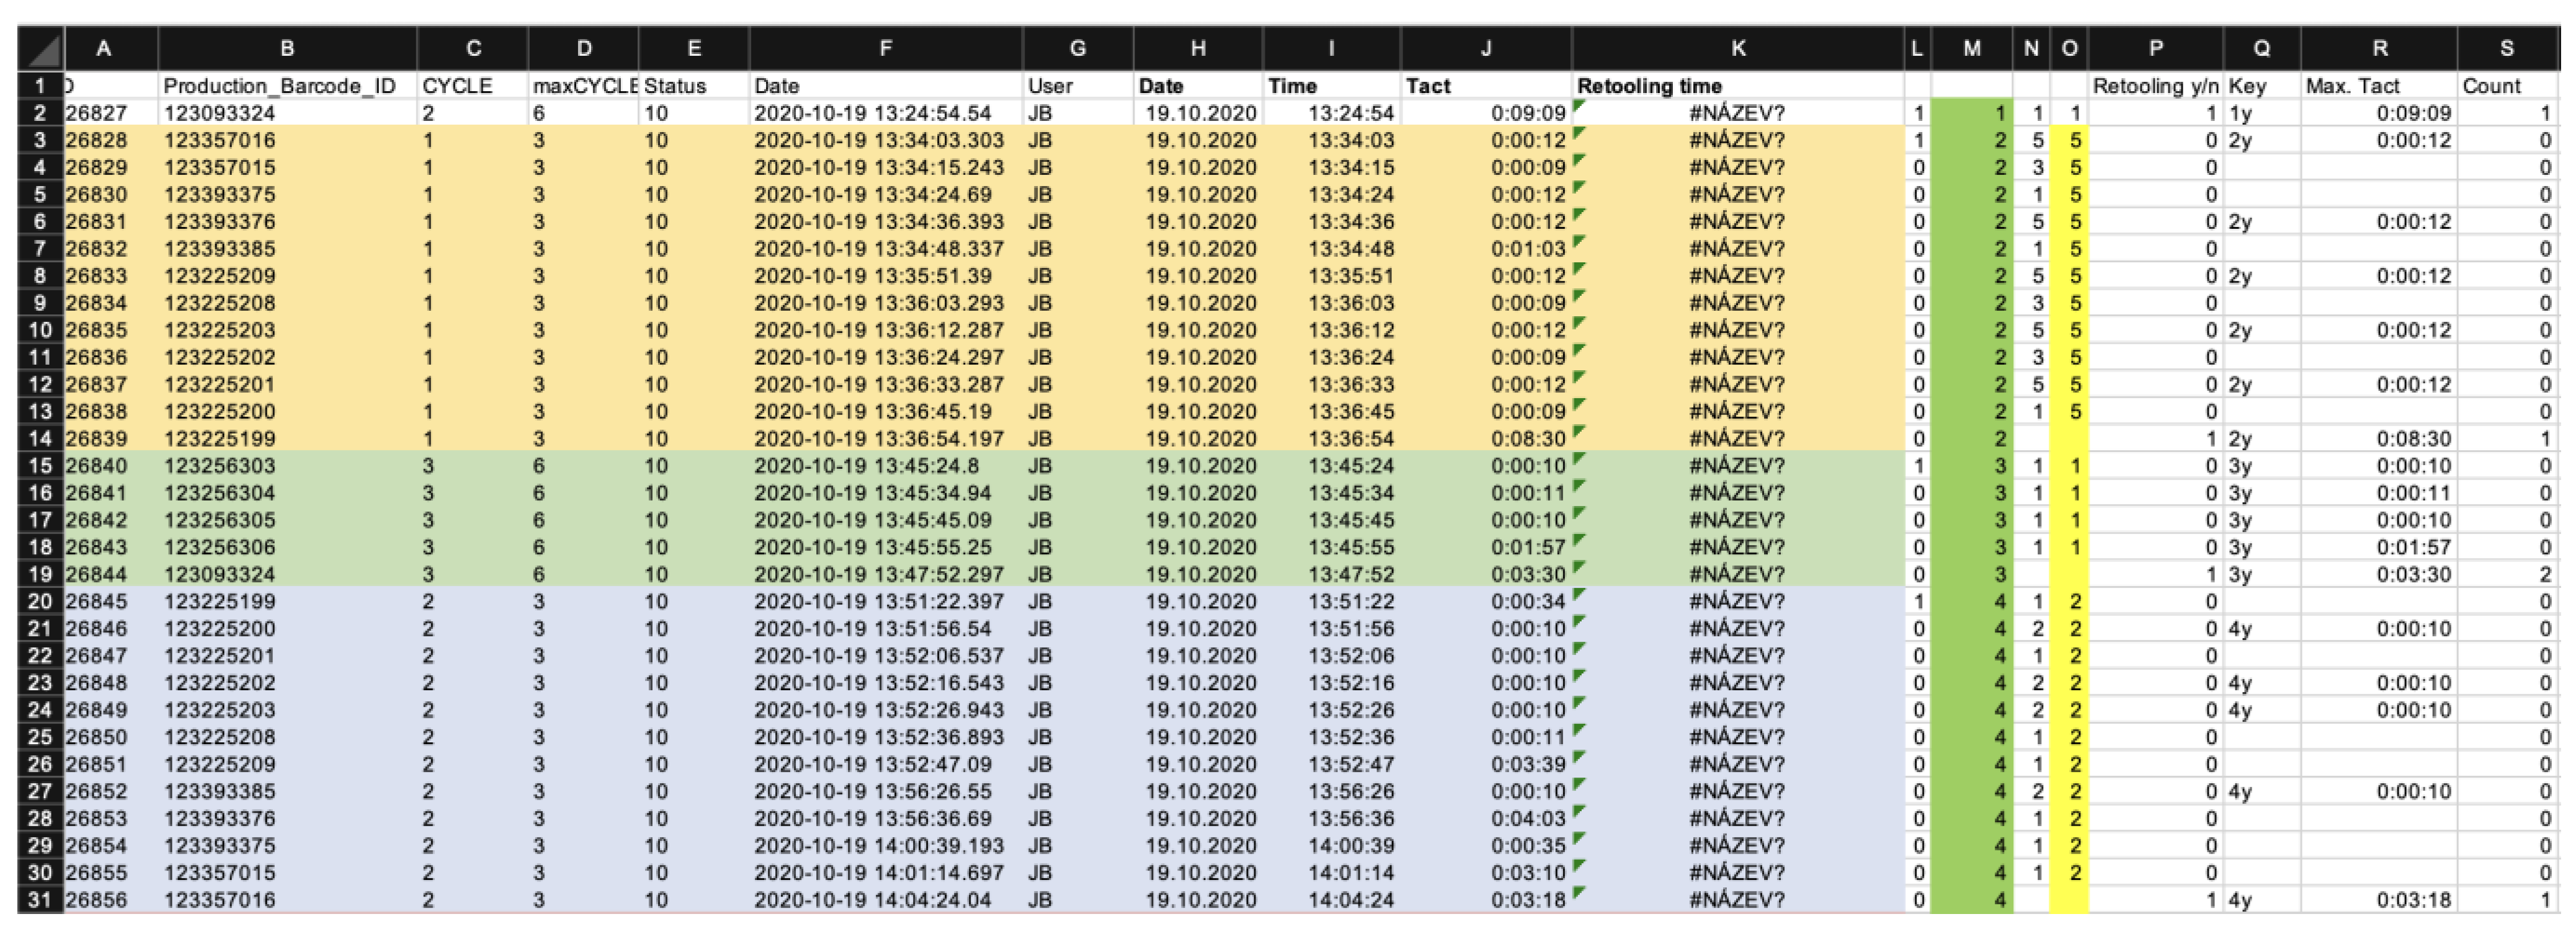
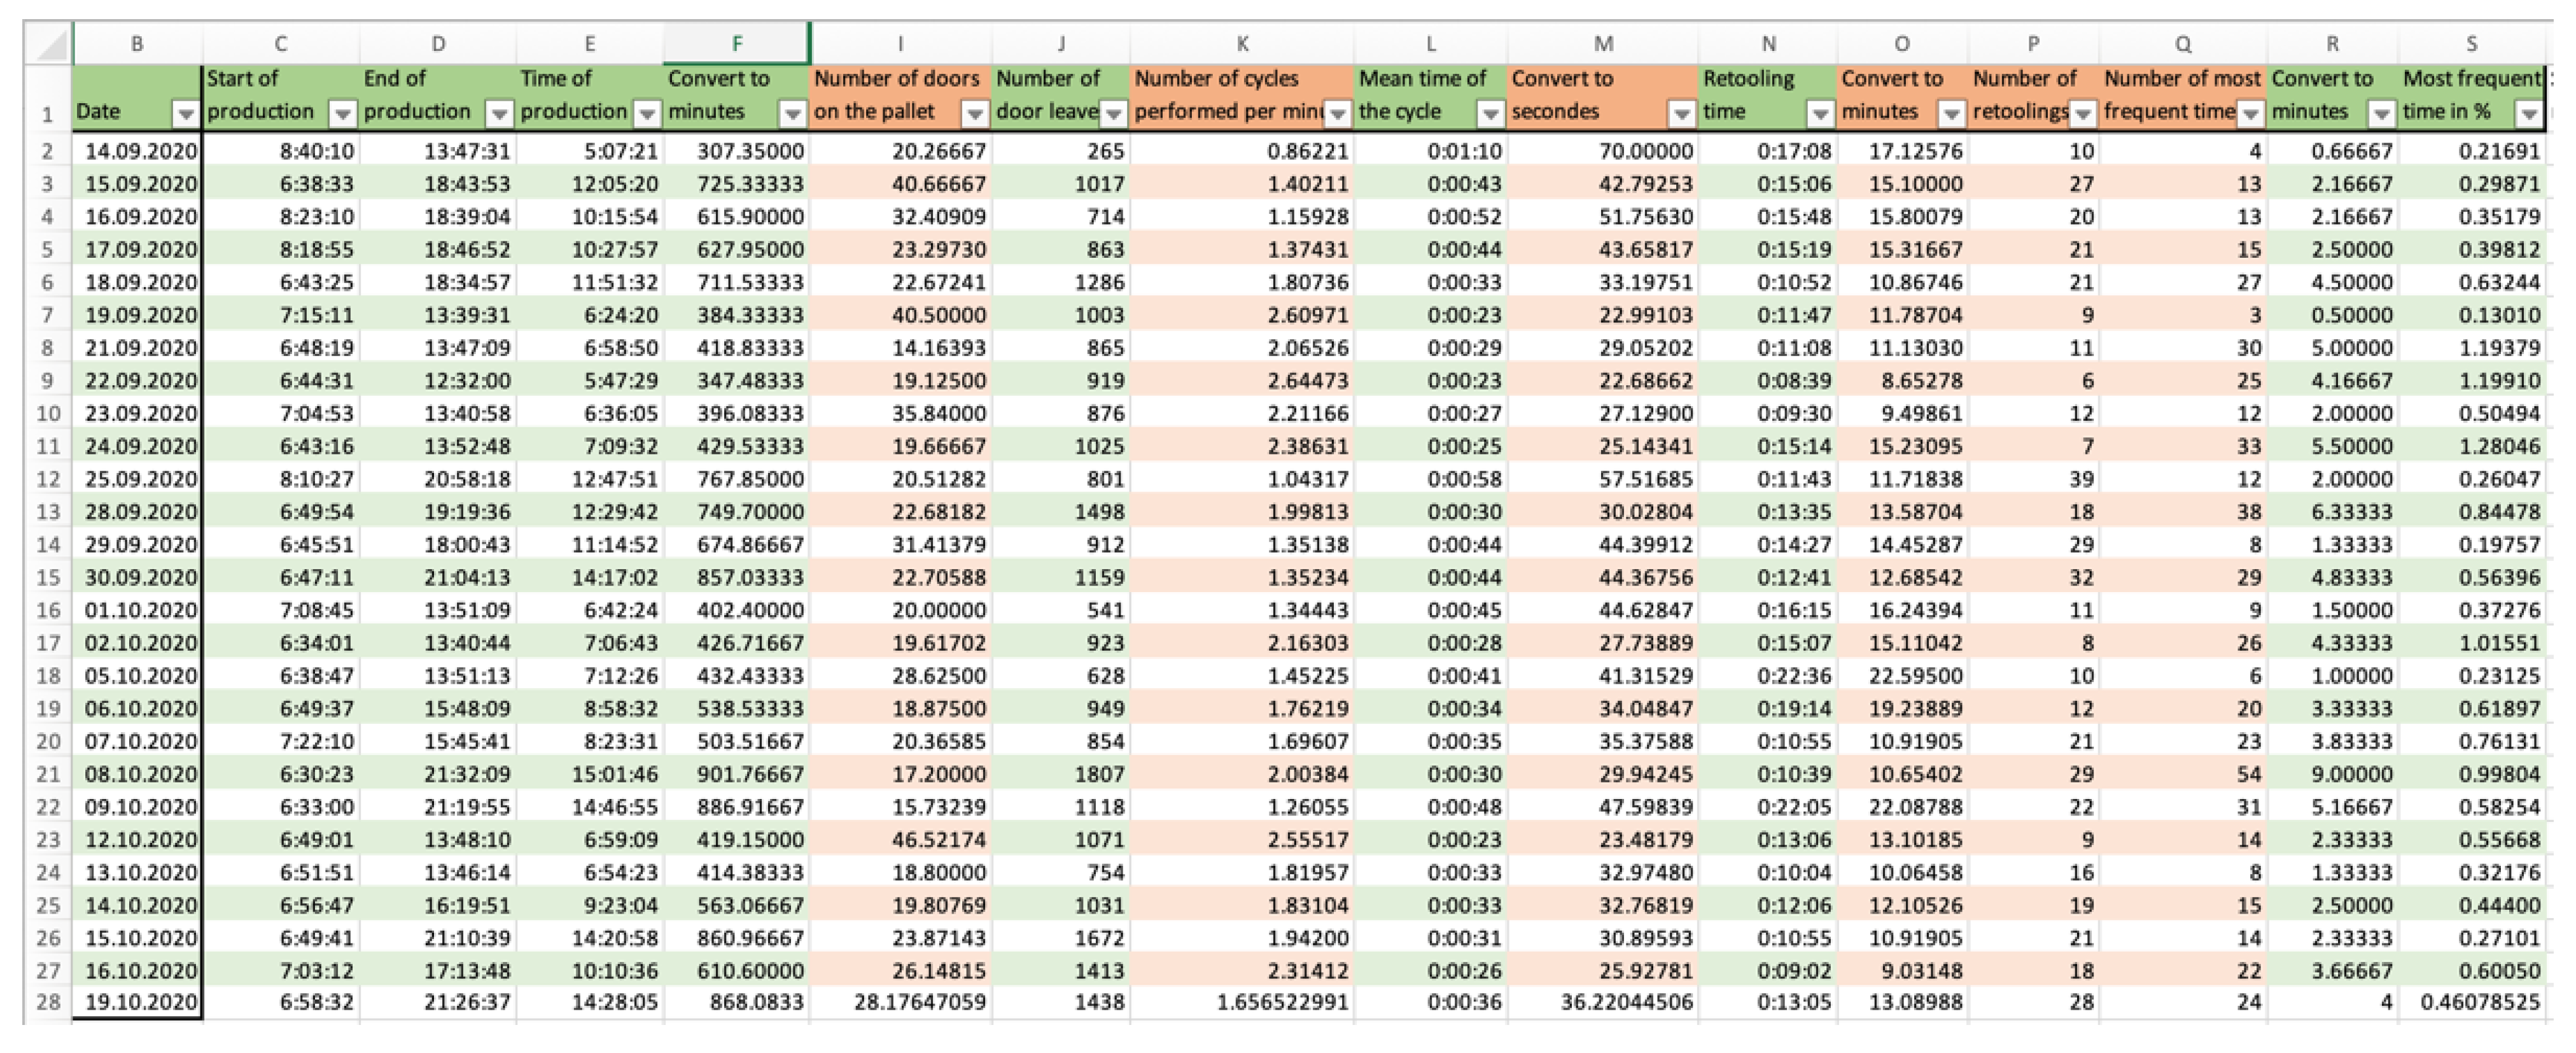
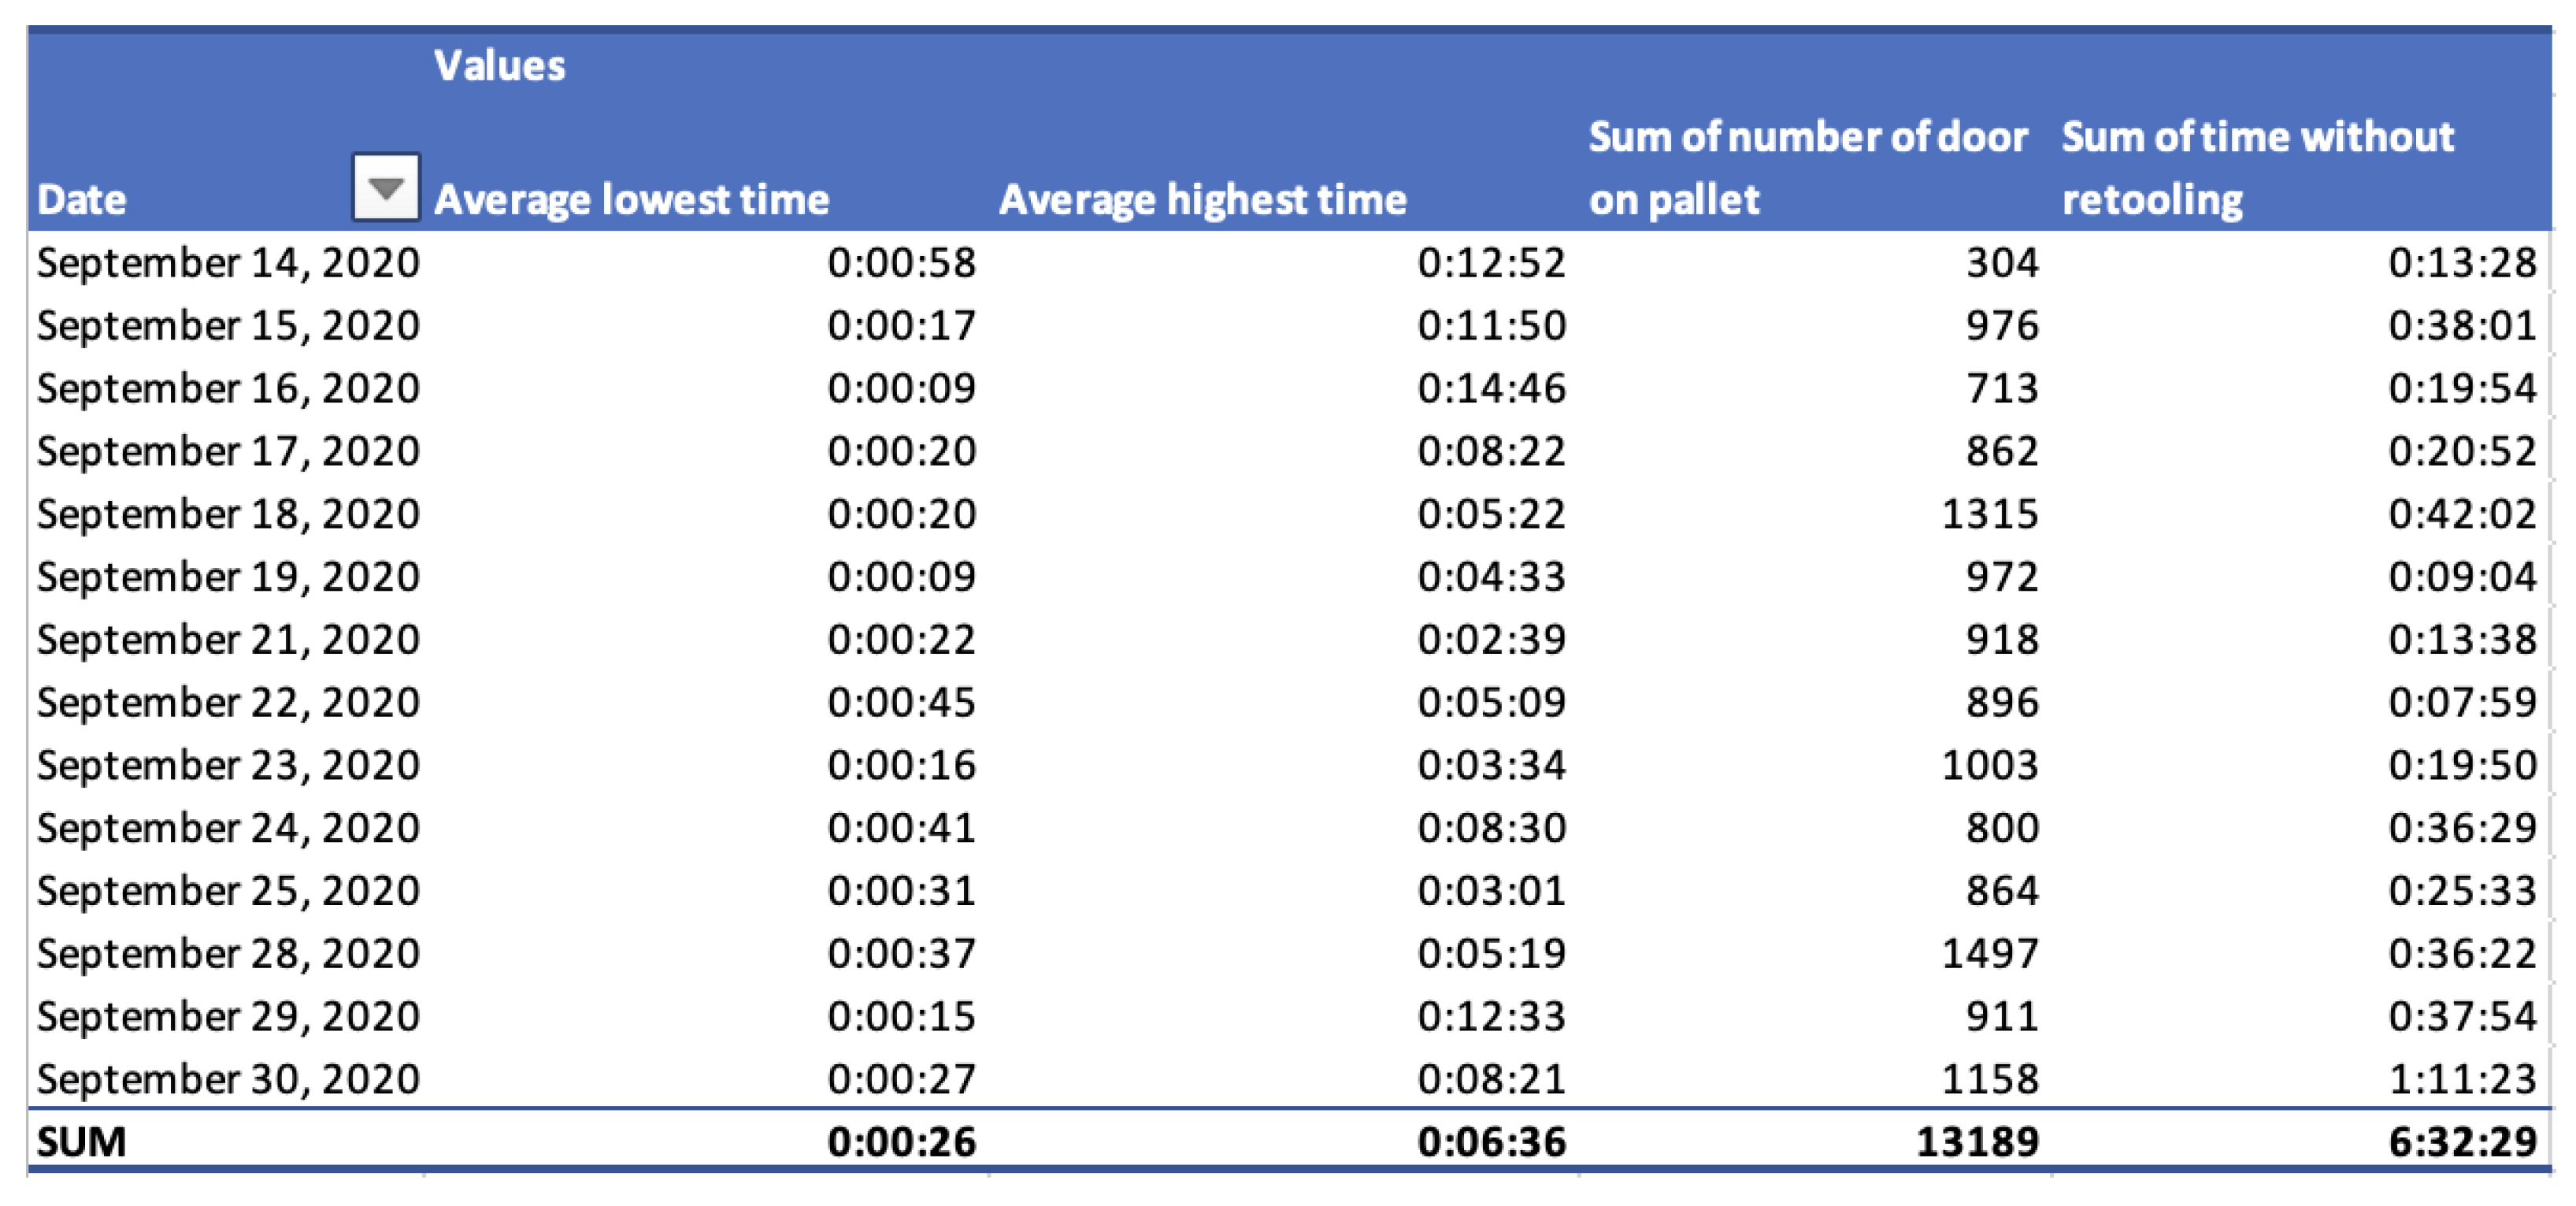
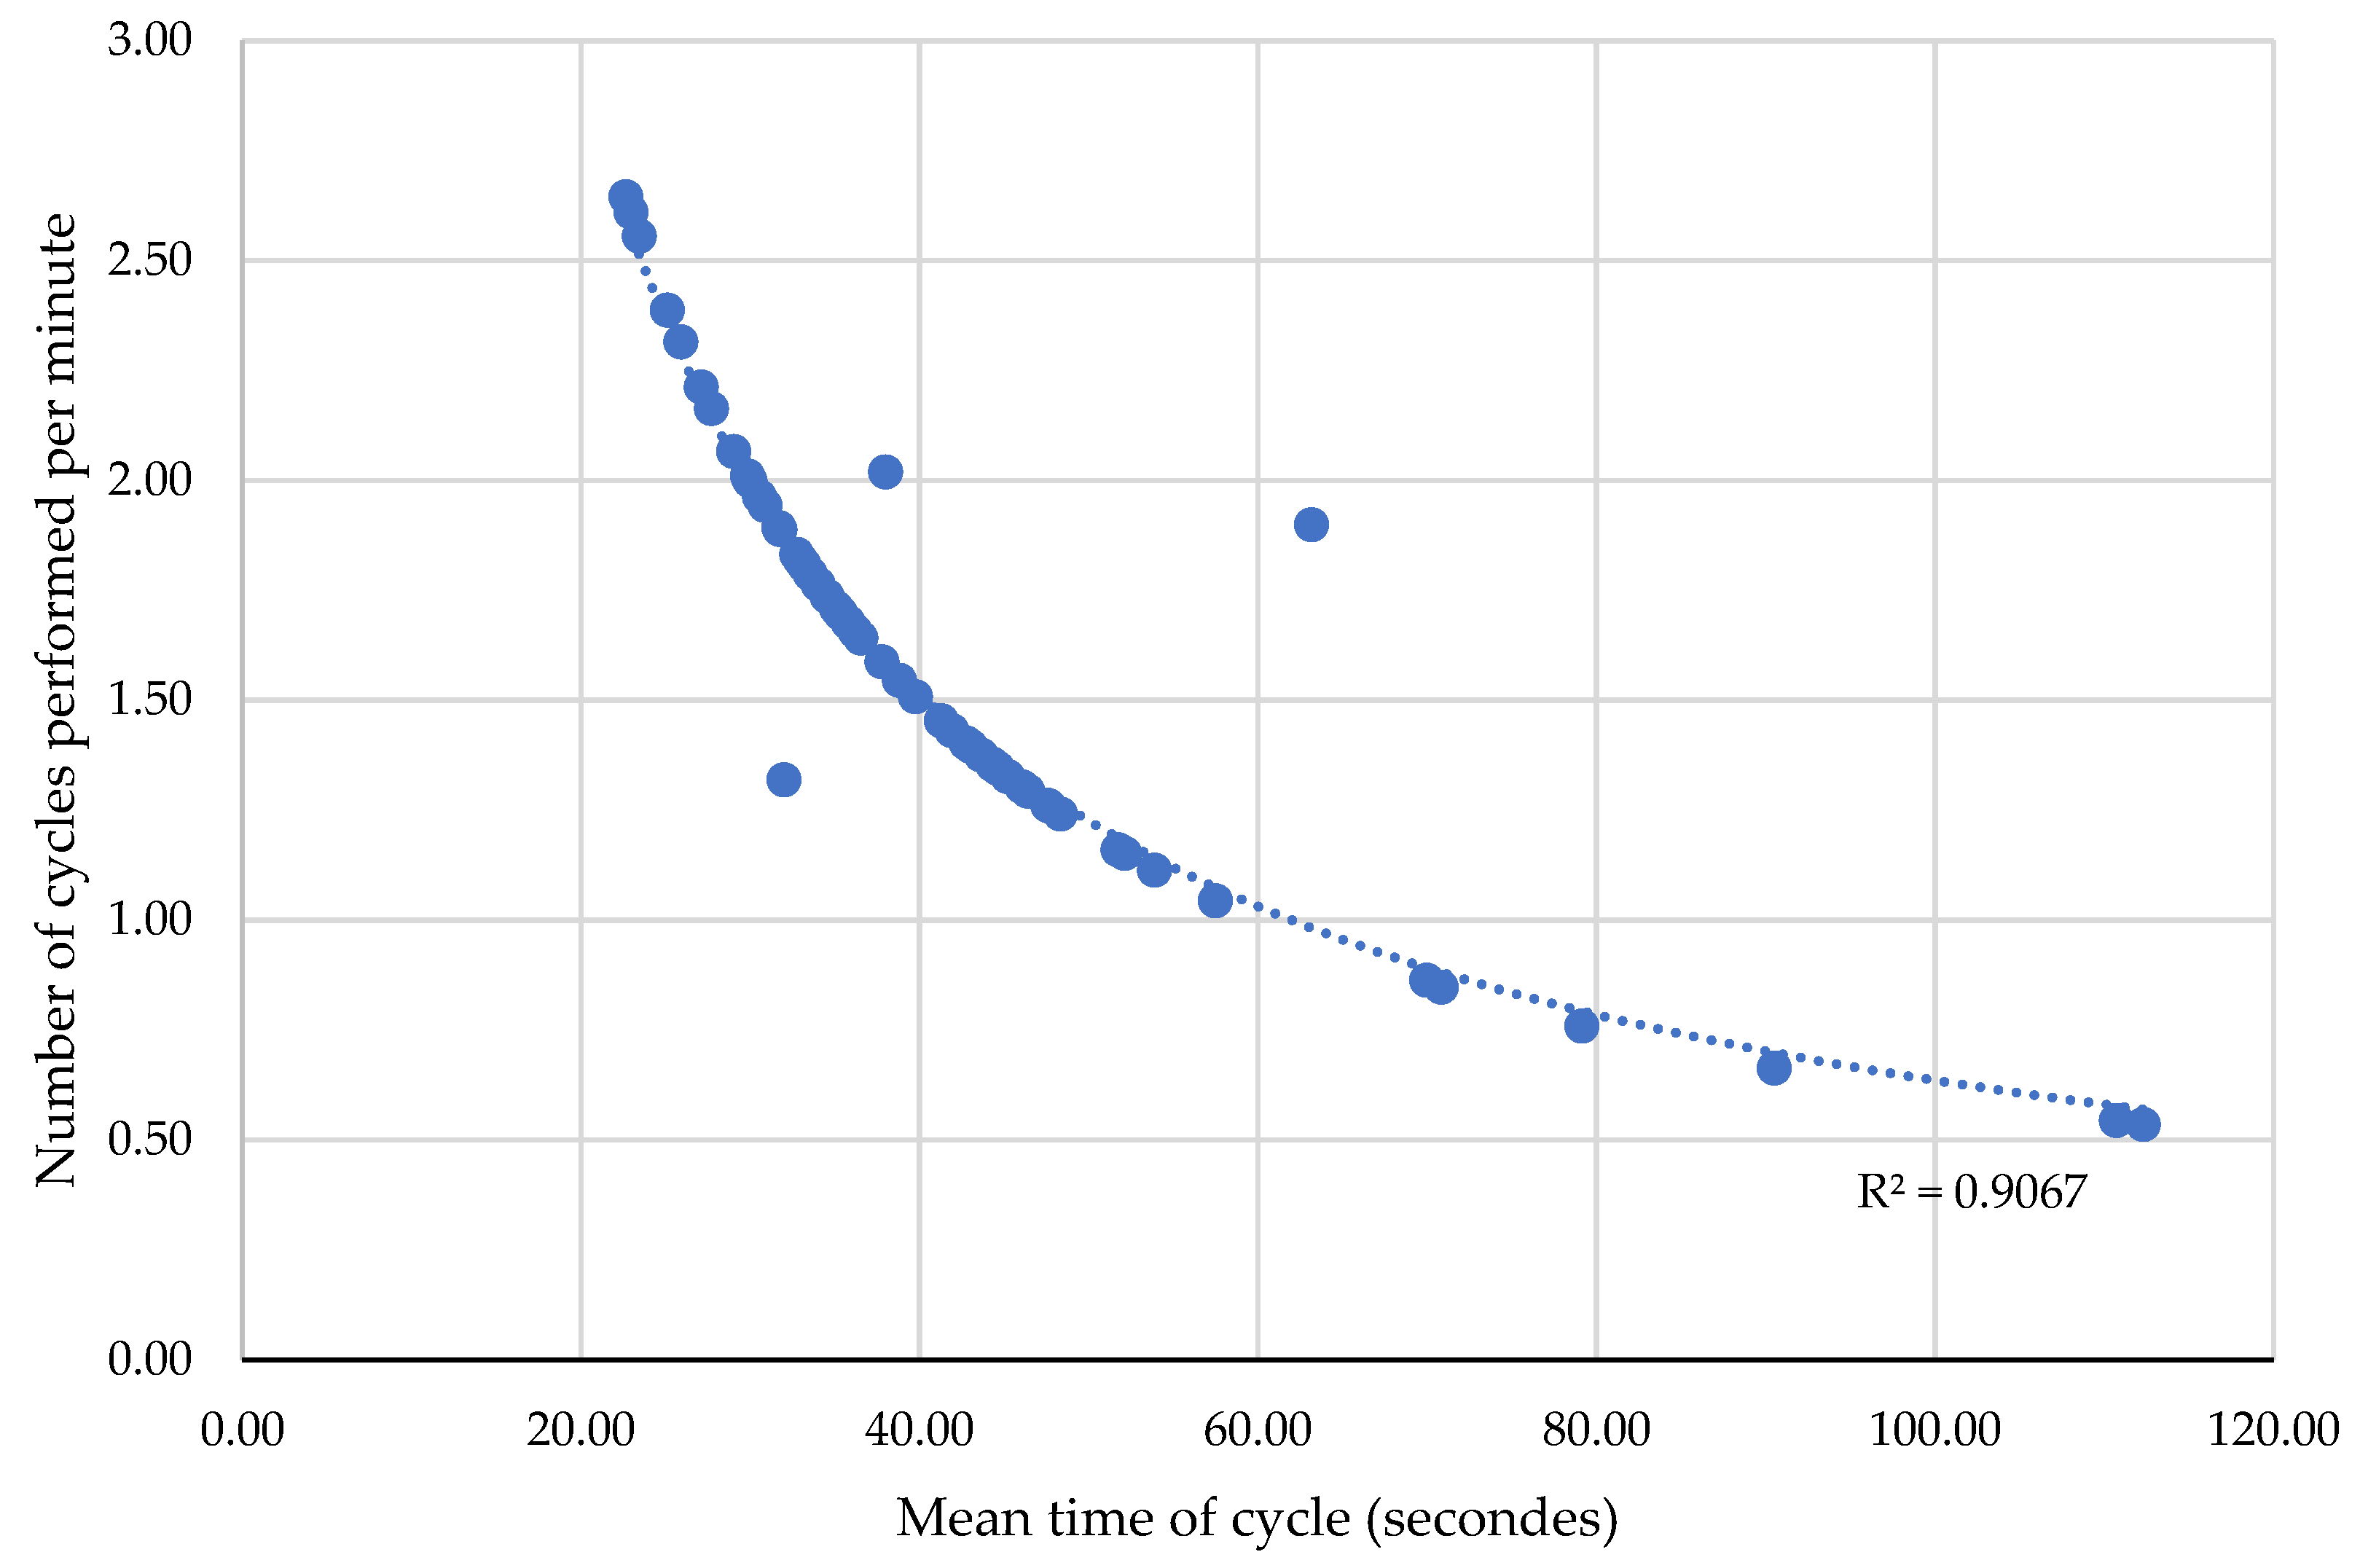
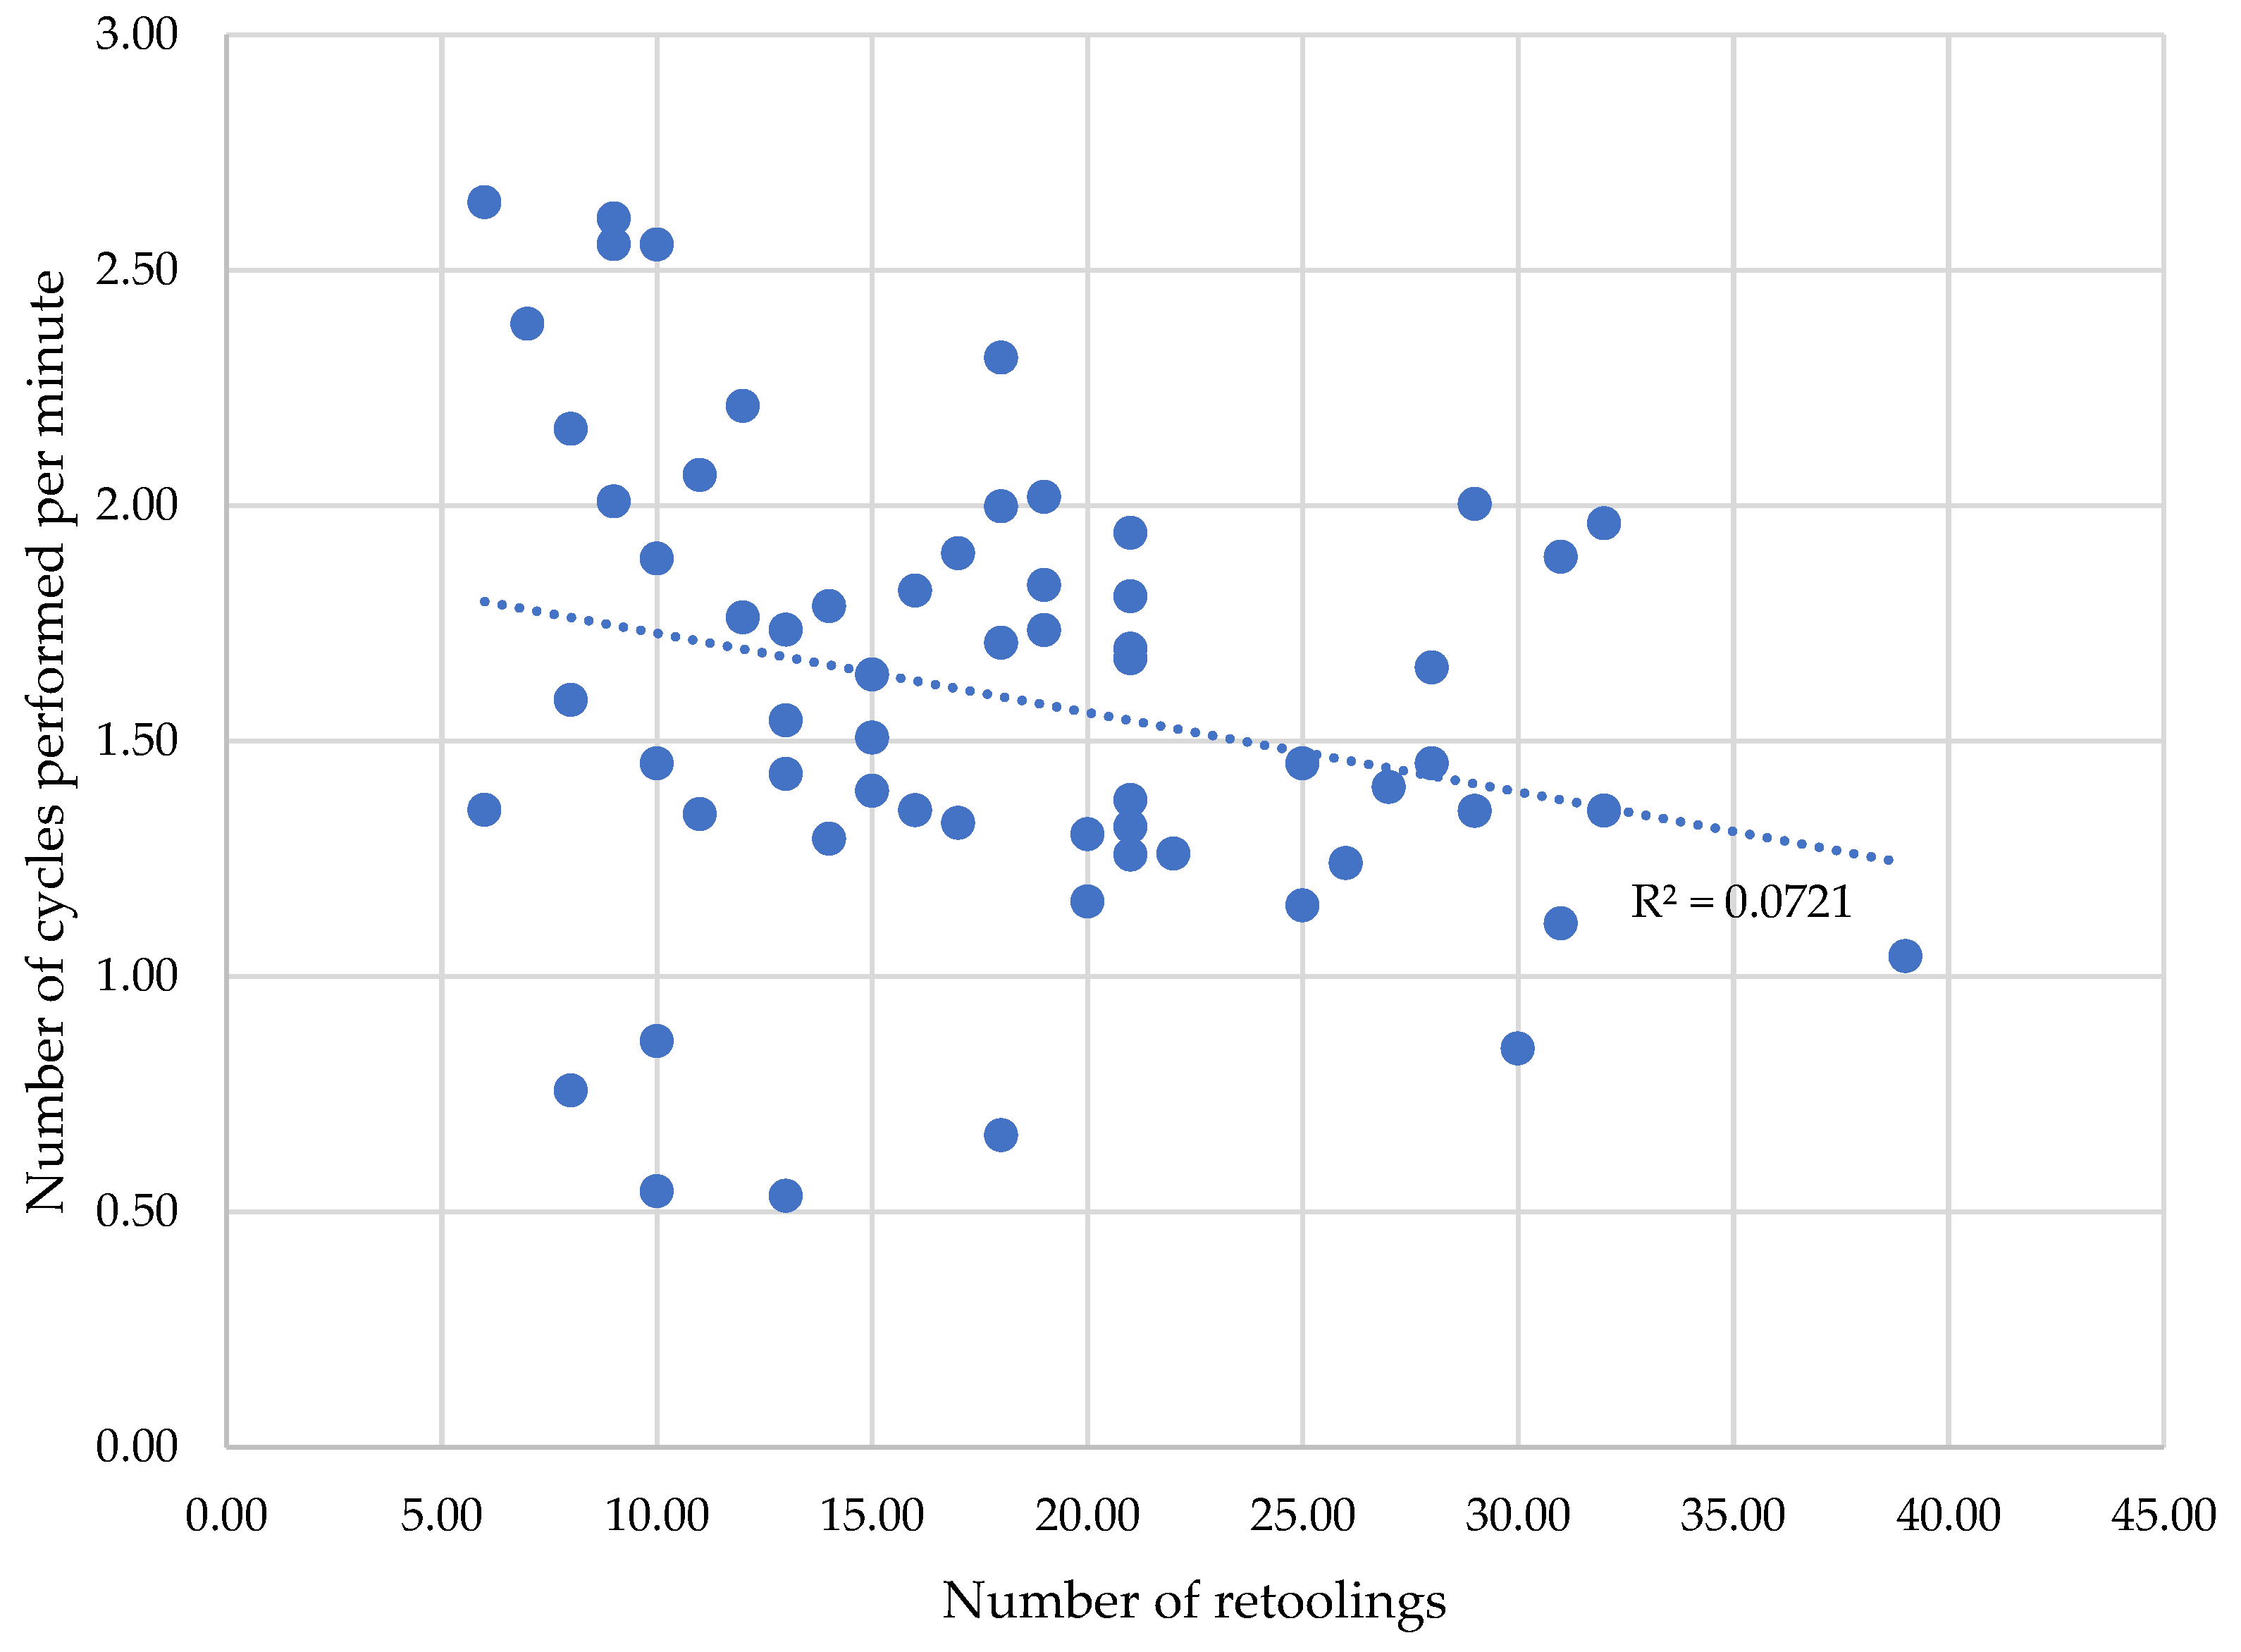
The arrangement diagram and the most important machine units are shown in Figure 1 and Figure 2.
The research process consisted of two stages. In the first stage, machining data were collected from 14 September to 5 December 2020. Then, the data obtained from the IT system controlling the operation of the line were in the form of *.csv files. These data were analyzed in MS Excel software to determine the efficiency of the edge banding module.
A sample layout of machine data in a *.csv file is shown in Figure 3.
First, the data were sorted based on the “CYCLE” column (Figure 4). When the value in the column changed from “1” to “3”, for example, it means that an entire pallet of one type of door leaf has gone through the machine tools to machine one edge, and then the machines are retooled to another type of door leaves ready on the next pallet.
Using the “IF(C1 <> C2; 1; 1; 0)” function, the data from the “CYCLE” column can be used to determine the moment when the machine retooling occurs. Passing through the first door leaf after retooling, it is marked with the number 1 in the “L” column. Then, in the “M” column, based on the “L” column, each series of processed door leaves is sequentially numbered thanks to the formula “=L2 + M1”.
Based on the obtained data in column F (Date), the start and end time of the work shift could be determined. Based on these times, the production time for each day of door leaves production was calculated. From column B (Production Barcode ID), it was possible to count the number of working cycles performed on the door leaves produced each production day. These two parameters are very important for the main parameter characterizing production (i.e., the number of cycles performed per minute).
Column J shows the times of a working cycle for the production of door leaves. From these data, it was possible to calculate the average production time per working cycle using the function “=AVERAGE(Jx;Jy)”. Using the function “=MODESNGL(Jx;Jy)” it was possible to find the most frequently occurring working cycle time, and using the function “=COUNTIF(Jx:Jy;most frequent time)”, we could count how many times this time was reached during production.
Column K shows the retooling time. Using the filter, it was possible to extract and display only those rows containing times when retooling occurred. From the data displayed in this way, it was possible to calculate the average time for retooling for individual production days “=AVERAGE(Kx;Ky)” and the number of retooling occurred “=COUNT(Kx;Ky)”.
All of these parameters (mean time of production per one working cycle, mean time of retooling, number of retooling, number of door leaves leaving in a series, most frequent time of series) were summarized in a sheet (Figure 5) and then processed in the form of graphs.
At the end of the analysis, another sheet was created in the form of a contingency table, in which the calculated statistical parameters were averaged for each production day in the analyzed period (Figure 6).
The results were summarized within the months of the study period (broken down into data from September, October, November, and December).

3. Results

The number of working cycles per shift in the function of the mean time of the cycle shows the strict theoretical inversely proportional relationship (Figure 7). However, this was not the subject of this analysis. It is important to show that under favorable conditions, the edge banding module of the TechnoPORTA line could achieve an efficiency level of over 2.5 cycles per minute. However, it is often lower, sometimes only 0.5 cycles per minute. This means that there are factors that limit this performance. The scientific goal should be to identify these factors and the business goal to eliminate or reduce their impact.
Figure 8, Figure 9, Figure 10 and Figure 11 show that there is a low level of influence of internal factors, which can be determined based on the production data on the efficiency of this module. Figure 8 shows that the average mean time of retooling is between 10 and 20 min. The number of cycles performed per minute is not dependent on the average mean time of retooling. The number of retoolings from 5 to more than 40 did not change the number of cycles performed per minute, falling within the range of 0.5 to 2.5 per minute (Figure 9). Similarly, the number of doors per pallet, ranging from 10 to even 60, did not affect the efficiency (Figure 10). The most frequent processing times per day fell within a wide range from 3 to 54 cycles. Their number is irrelevant to the performance calculated in cycles per minute (Figure 11). Although the overall efficiency range was between 0.5 and 2.5 cycles per minute, on the vast majority of days, a narrower range of 1 to 2 cycles per minute was achieved, regardless of the values of the internal factors measured.
The mean time of retooling, number of retooling, number of doors on the pallet, and number of the most frequent time in one working shift did not influence the efficiency of the customized module of the edge banding of door leaves. It can be concluded that the machine data collected from 14 September to 5 December 2020 did not allow us to identify factors influencing the daily variability of efficiency. Either the IT system was unable to catch them in this time, or they were outside the area controlled by the system.

4. Discussion

Although MC is a trend that nowadays is developing dynamically, companies can perceive this phenomenon as a significant challenge. It happens because it requires both the products and the production processes to be customized [46].
There are two basic groups of limitations of mass customization connected with external (customer, market) and internal (production, logistic) elements, looking from the point of view of entities [47]. The first group of restrictions associated with external factors are related to the structure of the market and unfavorable demand conditions. It is fundamental for companies to determine whether there is a potential market demand big enough to respond to the customers’ preferences and expectations. It is mostly connected with visible and measurable demand conditions that appear on the market. Customers demand variety when they differ sharply in their preferences for certain attributes of a product. Under such circumstances, customization may truly add value [5,47]. Production processes must be flexible to provide individual product features, bearing in mind the impact of the technological and material parameters on the final quality of, for example, the final processing surface during edge banding, milling, or other operations in individual technological line modules [48,49]. Milling is at the forefront of operations with which to give the final product the characteristics the customer wants. On the other hand, any slowdown or recession may reduce the rationality of the implementation of the customization process.
It is also worth noting that the changes on the market have a cyclical nature (the theory of business cycles). In particular, the concept of Kitchin’s minor business cycle can be applied. described by Grasselli and Nguyen-Huu [50], taking a supply-side perspective, manufacturers decide on the level of production based on the expected level of demand and the desired level of inventory. On the demand side, investment is determined as a function of utilization and profitability and can be financed by debt, whereas consumption is independently determined as a function of income and wealth. In business activities, the time lags in information and decision adjustment affect the prices, output, demand, inventory, and employment in a periodic manner [50].
Mendelson and Parlaktürk [51] found that the implementation of MC depends on the company’s competitive position on the market. They concluded that in a competitive environment, before introducing MC, a company should consider reducing costs or making efforts to improve the product quality. In the case of a monopoly, where price competition does not exist, the company can easily implement costless personalization. However, strong competition in the market makes companies accept worse financial results than if they offered standard products [5].
The internal adverse factors of companies are those connected with production, technologies, and logistics. Mass customization requires a highly flexible production technology [4]. Increasing flexibility takes place through the implemented innovations in the field of modular structures and cost-effective operations as well as the increasingly common use of information and digital technology to control production devices. Product–process–supply chain engineering is coexistent in MC. Manufacturers implement reconfigurable production systems (RMS) that help to operate in unpredictable and changeable markets through the machines’ reconfigurability and flexibility [2]. Nevertheless, as described by Modrak and Soltysova [52], assembly line balancing causes difficult and important problems for manufacturers. Mass customization also requires a properly adapted logistics system for the customer [47].
Taking into account the above-mentioned external and internal factors, companies have to decide not only on whether to customize their products to the needs of the consumers, but also the level of this adaptation. As mentioned by Hou et al. [53], manufacturers can use optimization models to balance the costs of customization and the economies of the scale of mass production. In industry, only certain product features can be customized because only certain processing steps are sufficiently flexible.
The results of the study showed that neither the mean time of retooling, the number of retooling a working shift, the number of door leaves on the pallet, nor the number of the most frequent processing time in a door leaves series influenced the efficiency of the line. These technological and production organization parameters are the internal factors of the line, which can be calculated based on the machine reports generated and recorded in the IT production system. Therefore, it can be said that the edge banding module in the TechnoPORTA line is flexible in known and measurable conditions.
However, as a result of the tests, a significant variation in the line efficiency was found, defined by the average number of door leaves produced per minute, which was from just over 0.5 to over 2.5 pieces per minute. This proves the presence of external factors influencing the efficiency of the line, which could be connected with the customers’ order structure or internal factors unidentified in the conducted tests. In this case, external factors may include the volatility of the structure characteristic of the customers’ orders. On the other hand, the IT production control system was updated and reprogrammed to identify possible internal factors related to the operation of the TechnoPORTA line. The efficiency of the line was also further stabilized, but it is still necessary to carry out more extended working time observations, especially in terms of identifying the causes of downtime.

5. Conclusions

Based on the analysis of the obtained data and the discussion on the factors limiting mass customized production systems, it can be concluded that in the case of the edge banding module of the TechnoPORTA line, there was no influence of the mean time of retooling, the number of retooling, the number of doors on the pallet, and the number of the most frequent time in one working shift on the efficiency of this module. The data collected by the IT system controlling the line indicates that this module is flexible and its performance is not related to the control parameters. However, the large differences in efficiency on individual days indicate the existence of efficiency-limiting factors. Therefore, for the effective implementation of mass customization, thanks to which the efficiency of the line modules will be stable and their operation as flexible as possible, it is necessary to conduct planned technological tests to identify these factors and their significance. In order to identify them, the process engineering department reprogrammed the IT system to use production scheduling (ERP) data. Tests are in progress, which will show that the identification and control of the technological factors improve the performance of the customized line. The further direction of research will be the interpretation of the results obtained, and based on them, the determination of further work to improve the operation of the module and the replication of the work schedule to subsequent modules of the technological line.

Author Contributions

Conceptualization, Z.K., T.R., L.H. and E.T.; Methodology, Z.K., Ł.S., B.K., E.T., L.H. and J.P.; Software, Ł.S., B.K., L.H. and E.T.; Validation, Z.K., T.R. and M.P.; Formal analysis, Z.K., T.R. and L.H.; Investigation, Z.K. Ł.S., B.K., E.T. and T.R.; Resources, Z.K. Ł.S., B.K., J.B. and E.T.; Data curation, L.H., E.T. and J.P.; Writing—original draft preparation, T.R., J.B., L.H., E.T. and M.P.; Writing—review and editing, T.R. and M.P.; Visualization, L.H., Z.K., E.T. and M.P.; Supervision, T.R. and Z.K.; Project administration, Z.K. and T.R.; Funding acquisition, T.R. and Z.K. All authors have read and agreed to the published version of the manuscript.

Funding

This research received no external funding.

Institutional Review Board Statement

Not applicable.

Informed Consent Statement

Not applicable.

Data Availability Statement

Not applicable.

Conflicts of Interest

The authors declare no conflict of interest.

References

  1. Davis, S.M. Future Perfect; Addison-Wesley Publishing: Reading, MA, USA, 1987. [Google Scholar]
  2. Sabioni, R.C.; Daaboul, J.; le Duigou, J. Joint Optimization of Product Configuration and Process Planning in Reconfigurable Manufacturing Systems. Int. J. Ind. Eng. Manag. 2022, 13, 58–75. [Google Scholar] [CrossRef]
  3. Piller, F.T. Mass Customization: Reflections on the State of the Concept. Int. J. Flex. Manuf. Syst. 2004, 16, 313–334. [Google Scholar] [CrossRef]
  4. Pędzik, M.; Bednarz, J.; Kwidziński, Z.; Rogoziński, T.; Smardzewski, J. The Idea of Mass Customization in the Door Industry Using the Example of the Company Porta KMI Poland. Sustainability 2020, 12, 3788. [Google Scholar] [CrossRef]
  5. Cavusoglu, H.; Cavusoglu, H.; Raghunathan, S. Selecting a Customization Strategy Under Competition: Mass Customization, Targeted Mass Customization, and Product Proliferation. IEEE Trans. Eng. Manag. 2007, 54, 12–28. [Google Scholar] [CrossRef] [Green Version]
  6. Du, X.; Jiao, J.; Tseng, M.M. Understanding Customer Satisfaction in Product Customization. Int. J. Adv. Manuf. Technol. 2006, 31, 396–406. [Google Scholar] [CrossRef]
  7. Bardakci, A.; Whitelock, J. Mass-customisation in Marketing: The Consumer Perspective. J. Consum. Mark. 2003, 20, 463–479. [Google Scholar] [CrossRef]
  8. Wang, Y.; Wu, J.; Lin, L.; Shafiee, S. An Online Community-Based Dynamic Customisation Model: The Trade-off between Customer Satisfaction and Enterprise Profit. Int. J. Prod. Res. 2021, 59, 1–29. [Google Scholar] [CrossRef]
  9. Bonenberg, A.; Branowski, B.; Kurczewski, P.; Lewandowska, A.; Sydor, M.; Torzyński, D.; Zabłocki, M. Designing for Human Use: Examples of Kitchen Interiors for Persons with Disability and Elderly People. Hum. Factors Ergon. Manuf. Serv. Ind. 2019, 29, 177–186. [Google Scholar] [CrossRef]
  10. Gejdoš, M.; Hitka, M. The Impact of the Secular Trend of the Slovak Population on the Production of Wooden Beds and Seating Furniture. Forests 2022, 13, 1599. [Google Scholar] [CrossRef]
  11. Bumgardner, M.S.; Nicholls, D.L. Sustainable Practices in Furniture Design: A Literature Study on Customization, Biomimicry, Competitiveness, and Product Communication. Forests 2020, 11, 1277. [Google Scholar] [CrossRef]
  12. Langová, N.; Réh, R.; Igaz, R.; Krišťák, Ľ.; Hitka, M.; Joščák, P. Construction of Wood-Based Lamella for Increased Load on Seating Furniture. Forests 2019, 10, 525. [Google Scholar] [CrossRef] [Green Version]
  13. Blecker, T.; Friedrich, G. Mass Customization: Challenges and Solutions; Springer: Boston, MA, USA, 2006; Volume 87, ISBN 978-0-387-32222-3. [Google Scholar]
  14. Sydor, M.; Pinkowski, G.; Kučerka, M.; Kminiak, R.; Antov, P.; Rogoziński, T. Indentation Hardness and Elastic Recovery of Some Hardwood Species. Appl. Sci. 2022, 12, 5049. [Google Scholar] [CrossRef]
  15. Sydor, M.; Rogoziński, T.; Stuper-Szablewska, K.; Starczewski, K. The Accuracy of Holes Drilled in the Side Surface of Plywood. Bioresources 2019, 15, 117–129. [Google Scholar] [CrossRef]
  16. Yang, Y.; Yuan, G.; Zhuang, Q.; Tian, G. Multi-Objective Low-Carbon Disassembly Line Balancing for Agricultural Machinery Using MDFOA and Fuzzy AHP. J. Clean. Prod. 2019, 233, 1465–1474. [Google Scholar] [CrossRef]
  17. Jiang, Z.; Wang, H.; Zhang, H.; Mendis, G.; Sutherland, J.W. Value Recovery Options Portfolio Optimization for Remanufacturing End of Life Product. J. Clean. Prod. 2019, 210, 419–431. [Google Scholar] [CrossRef]
  18. Ghayebloo, S.; Tarokh, M.J.; Venkatadri, U.; Diallo, C. Developing a Bi-Objective Model of the Closed-Loop Supply Chain Network with Green Supplier Selection and Disassembly of Products: The Impact of Parts Reliability and Product Greenness on the Recovery Network. J. Manuf. Syst. 2015, 36, 76–86. [Google Scholar] [CrossRef]
  19. Pędzik, M.; Tomczak, K.; Janiszewska-Latterini, D.; Tomczak, A.; Rogoziński, T. Management of Forest Residues as a Raw Material for the Production of Particleboards. Forests 2022, 13, 1933. [Google Scholar] [CrossRef]
  20. Pędzik, M.; Kwidziński, Z.; Rogoziński, T. Particles from Residue Wood-Based Materials from Door Production as an Alternative Raw Material for Production of Particleboard. Drv. Ind. 2022, 73, 351–357. [Google Scholar] [CrossRef]
  21. Bhamu, J.; Singh Sangwan, K. Lean Manufacturing: Literature Review and Research Issues. Int. J. Oper. Prod. Manag. 2014, 34, 876–940. [Google Scholar] [CrossRef]
  22. Gupta, S.; Jain, S.K. A Literature Review of Lean Manufacturing. Int. J. Manag. Sci. Eng. Manag. 2013, 8, 241–249. [Google Scholar] [CrossRef]
  23. Antosz, K.; Ciecińska, B. Podstawy Zarządzania Parkiem Maszyn w Przedsiębiorstwie; Oficyna Wydawnicza Politechniki Rzeszowskiej: Rzeszów, Poland, 2011; ISBN 978-83-7199-688-7. [Google Scholar]
  24. Furman, J.; Orszag, P.R. Slower Productivity and Higher Inequality: Are They Related? SSRN Electron. J. 2018. [Google Scholar] [CrossRef] [Green Version]
  25. Kwidziński, Z.; Drewczyński, M.; Rogoziński, T.; Pędzik, M. Energy Efficiency in Mass Customized Production of Wooden Doors. In Proceedings of the Chip and Chipless Woodworking Processes, Zvolen, Slovakia, 15–17 September 2022; Volume 13. [Google Scholar]
  26. Kwidziński, Z.; Bednarz, J.; Sankiewicz, Ł.; Pędzik, M.; Rogoziński, T. TechnoPORTA Intelligent, Customized Technological Line for the Automated Production of Technical Doors—Selected Technical and Economic Indicators. Ann. WULS For. Wood Technol. 2021, 114, 96–100. [Google Scholar] [CrossRef]
  27. Kwidziński, Z.; Bednarz, J.; Pędzik, M.; Sankiewicz, Ł.; Szarowski, P.; Knitowski, B.; Rogoziński, T. Innovative Line for Door Production Technoporta—Technological and Economic Aspects of Application of Wood-Based Materials. Appl. Sci. 2021, 11, 4502. [Google Scholar] [CrossRef]
  28. Liker, J.K. The Toyota Way: 14 Management Principles from the World’s Greatest Manufacturer; McGraw-Hill: New York, NY, USA, 2004; ISBN 978-0-07-139231-0. [Google Scholar]
  29. Womack, J.P.; Jones, D.T. Lean Thinking, 1st ed.; Lean Enterprise Institute; Taylor & Francis: Abingdon, UK, 1996; ISBN 978-0-684-81035-5. [Google Scholar]
  30. Malms, M.; Ostasz, M.; Gilliot, M.; Bernier-Bruna, P.; Cargemel, L.; Suarez, E.; Cornelius, H.; Duranton, M.; Koren, B.; Rosse-Laurent, P.; et al. ETP4HPC’s Strategic Research Agenda for High-Performance Computing in Europe 4. 2020. Available online: https://www.google.com.hk/url?sa=t&rct=j&q=&esrc=s&source=web&cd=&ved=2ahUKEwiUvLiBzeb7AhXWUGwGHQsJAyoQFnoECAwQAQ&url=https%3A%2F%2Fhal.inria.fr%2Fhal-03354396%2Ffile%2FETP4HPC_SRA4_2020_web_20200331.pdf&usg=AOvVaw1qFzhCZq0jSEhLZkZEAPGD (accessed on 15 November 2022). [CrossRef]
  31. Skotnicka-Zasadzień, B. Analiza Efektywności Zastosowania Metody FMEA w Małym Przedsiębiorstwie Przemysłowym. Syst. Support. Prod. Eng. 2012, 2, 142–153. [Google Scholar]
  32. Permana, A.; Purba, H.H.; Rizkiyah, N.D. A Systematic Literature Review of Total Quality Management (TQM) Implementation in the Organization. Int. J. Prod. Manag. Eng. 2021, 9, 25. [Google Scholar] [CrossRef]
  33. Lasrado, F.; Nyadzayo, M. Improving Service Quality. Int. J. Qual. Reliab. Manag. 2020, 37, 393–410. [Google Scholar] [CrossRef]
  34. Tasleem, M.; Khan, N.; Masood, S.A. Impact of TQM and Technology Management on Organizational Performance. Mehran Univ. Res. J. Eng. Technol. 2016, 35, 585–598. [Google Scholar] [CrossRef] [Green Version]
  35. Garcia-Buendia, N.; Moyano-Fuentes, J.; Maqueira-Marín, J.M.; Cobo, M.J. 22 Years of Lean Supply Chain Management: A Science Mapping-Based Bibliometric Analysis. Int. J. Prod. Res. 2021, 59, 1901–1921. [Google Scholar] [CrossRef]
  36. Uriona Maldonado, M.; Leusin, M.E.; de Albuquerque Bernardes, T.C.; Vaz, C.R. Similarities and Differences between Business Process Management and Lean Management. Bus. Process Manag. J. 2020, 26, 1807–1831. [Google Scholar] [CrossRef]
  37. Simanova, Ľ.; Gejdoš, P. Implementation of the Six Sigma Methodology in Increasing the Capability of Processes in the Company of the Furniture Industry of the Slovak Republic. Manag. Syst. Prod. Eng. 2021, 29, 54–58. [Google Scholar] [CrossRef]
  38. Raval, S.J.; Kant, R.; Shankar, R. Analyzing the Lean Six Sigma Enabled Organizational Performance to Enhance Operational Efficiency. Benchmarking Int. J. 2020, 27, 2401–2434. [Google Scholar] [CrossRef]
  39. Sfreddo, L.S.; Vieira, G.B.B.; Vidor, G.; Santos, C.H.S. ISO 9001 Based Quality Management Systems and Organisational Performance: A Systematic Literature Review. Total Qual. Manag. Bus. Excell. 2021, 32, 389–409. [Google Scholar] [CrossRef]
  40. Pacana, A.; Ulewicz, R. Analysis of Causes and Effects of Implementation of the Quality Management System Compliant with ISO 9001. Pol. J. Manag. Stud. 2020, 21, 283–296. [Google Scholar] [CrossRef]
  41. Bessant, J.; Lamming, R.; Noke, H.; Phillips, W. Managing Innovation beyond the Steady State. Technovation 2005, 25, 1366–1376. [Google Scholar] [CrossRef]
  42. Yen-Tsang, C.; Csillag, J.M.; Siegler, J. Theory of Reasoned Action for Continuous Improvement Capabilities: A Behavioral Approach. Rev. Adm. Empres. 2012, 52, 546–564. [Google Scholar] [CrossRef] [Green Version]
  43. Corredera, A.; Macia, A.; Sanz, R.; Hernandez, J.L. An Automated Monitoring System for Surveillance and KPI Calculation. In Proceedings of the 2016 IEEE Workshop on Environmental, Energy, and Structural Monitoring Systems (EESMS), Bari, Italy, 13–14 June 2016; pp. 1–6. [Google Scholar]
  44. Borsos, G.; Iacob, C.C.; Calefariu, G. The Use KPI’s to Determine the Waste in Production Process. IOP Conf. Ser. Mater. Sci. Eng. 2016, 161, 012102. [Google Scholar] [CrossRef] [Green Version]
  45. Tzeng, G.-H.; Cheng, H.-J.; Huang, T.D. Multi-Objective Optimal Planning for Designing Relief Delivery Systems. Transp. Res. E Logist. Transp. Rev. 2007, 43, 673–686. [Google Scholar] [CrossRef]
  46. Yu, B.; Zhao, H.; Xue, D. A Multi-Population Co-Evolutionary Genetic Programming Approach for Optimal Mass Customisation Production. Int. J. Prod. Res. 2017, 55, 621–641. [Google Scholar] [CrossRef]
  47. Zipkin, P. The Limits of Mass Customization. Sloan Manag. Rev 2001, 42, 81–87. [Google Scholar]
  48. Korčok, M.; Koleda, P.; Barcík, Š.; Očkajová, A.; Kučerka, M. Effect of Technological and Material Parameters on Final Surface Quality of Machining When Milling Thermally Treated Spruce Wood. Martin 2019, 14, 10004–10013. [Google Scholar]
  49. Kminiak, R.; Siklienka, M.; Igaz, R.; Krišťák, Ľ.; Gergeľ, T.; Němec, M.; Réh, R.; Očkajová, A.; Kučerka, M. Effect of Cutting Conditions on Quality of Milled Surface of Medium-Density Fibreboards. Bioresources 2019, 15, 746–766. [Google Scholar] [CrossRef]
  50. Grasselli, M.R.; Nguyen-Huu, A. Inventory Growth Cycles with Debt-Financed Investment. Struct. Chang. Econ. Dyn. 2018, 44, 1–13. [Google Scholar] [CrossRef]
  51. Mendelson, H.; Parlaktürk, A.K. Competitive Customization. Manuf. Serv. Oper. Manag. 2008, 10, 377–390. [Google Scholar] [CrossRef] [Green Version]
  52. Modrak, V.; Soltysova, Z. Batch Size Optimization of Multi-Stage Flow Lines in Terms of Mass Customization. Int. J. Simul. Model. 2020, 19, 219–230. [Google Scholar] [CrossRef]
  53. Hou, S.; Gao, J.; Wang, C. Design for Mass Customisation, Design for Manufacturing, and Design for Supply Chain: A Review of the Literature. IET Collab. Intell. Manuf. 2022, 4, 1–16. [Google Scholar] [CrossRef]
Figure 1. The arrangement diagram and the most important machine units of the edge banding module.
Applsci 12 12510 g001
Figure 2. The units of the edge banding module: (A) feeding portal, (B) reference milling machine, (C) edge processing machine, (D) two-way stacking portal.
Applsci 12 12510 g002
Figure 3. An example of the machine report.
Applsci 12 12510 g003
Figure 4. An example of the machine data sorted by the column “CYCLE”.
Applsci 12 12510 g004
Figure 5. An example of the statistical parameters determined based on the machine data.
Applsci 12 12510 g005
Figure 6. An example of the monthly averaged data.
Applsci 12 12510 g006
Figure 7. Dependence of the number of cycle doors per minute on the mean time of the cycle.
Applsci 12 12510 g007
Figure 8. Dependence of the number of cycles performed per minute on the mean time of retooling.
Applsci 12 12510 g008
Figure 9. Dependence of the number of cycles performed per minute on the number of retoolings.
Applsci 12 12510 g009
Figure 10. Dependence of the number of cycles performed per minute on the number of doors on the pallet.
Applsci 12 12510 g010
Figure 11. Dependence of the number of cycles performed per minute and the number of the most frequent time of series.
Applsci 12 12510 g011
Publisher’s Note: MDPI stays neutral with regard to jurisdictional claims in published maps and institutional affiliations.

