
3DSG: A 3D LiDAR-Based Object Detection Method for Autonomous Mining Trucks Fusing Semantic and Geometric Features

 ,
,  ,
, 

Abstract
1. Introduction
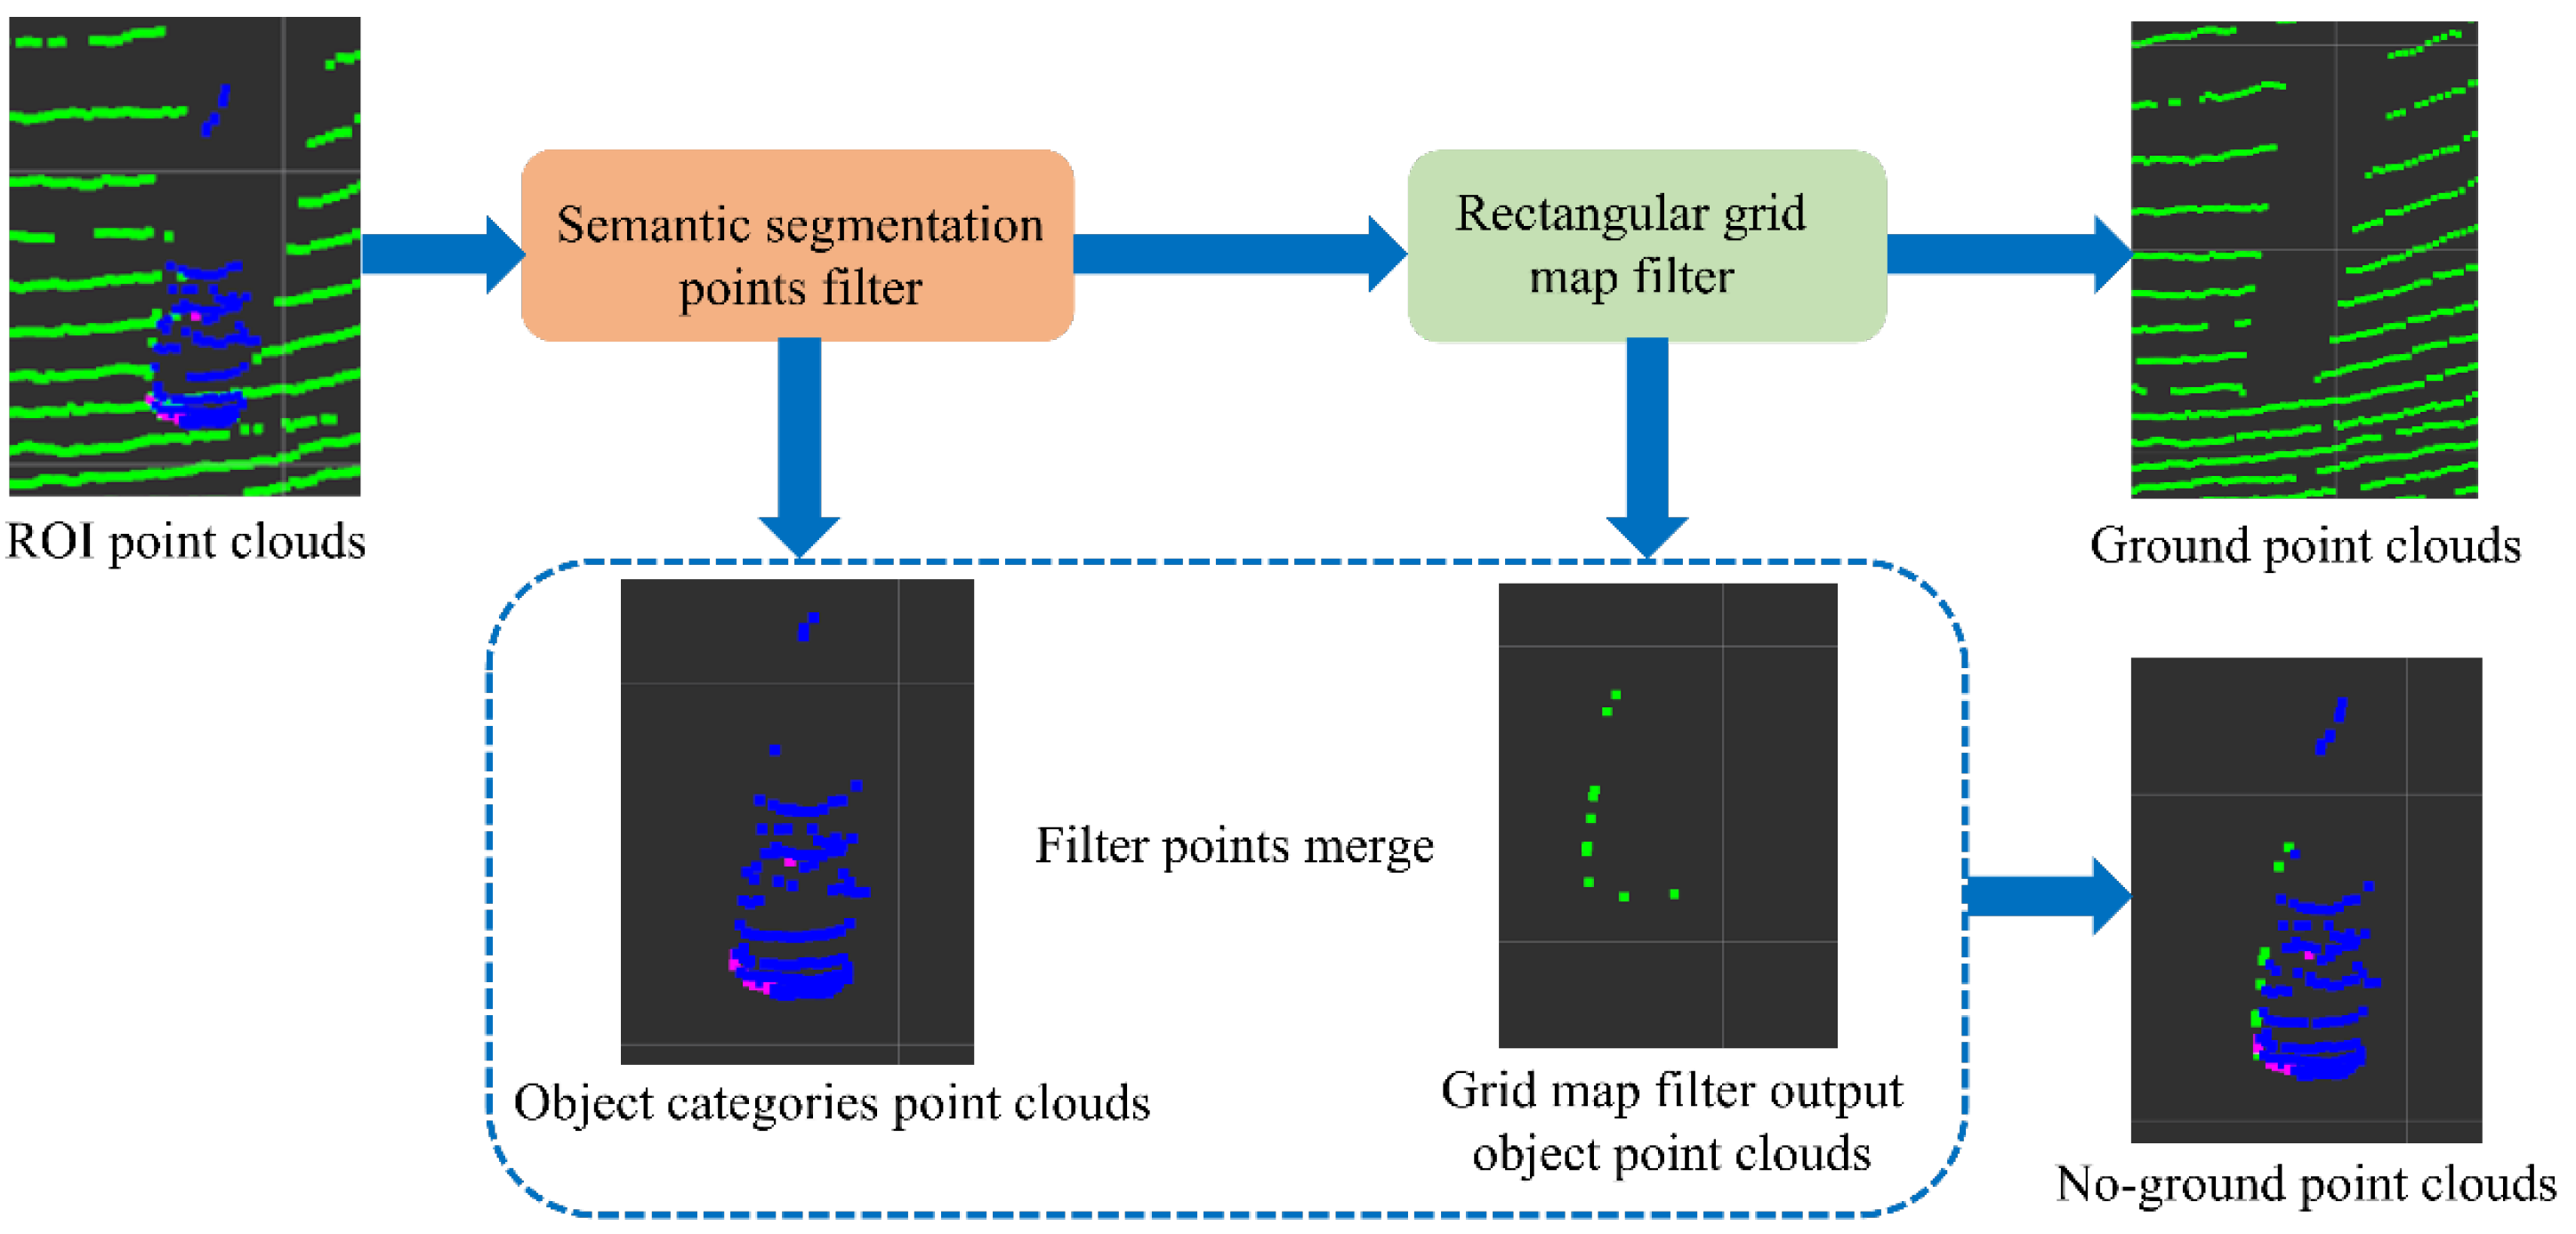
- A cascaded ground detection algorithm based on semantic segmentation point filtering and rectangular grid map filtering was designed, which performs reliably in unstructured terrains such as a mining environment.
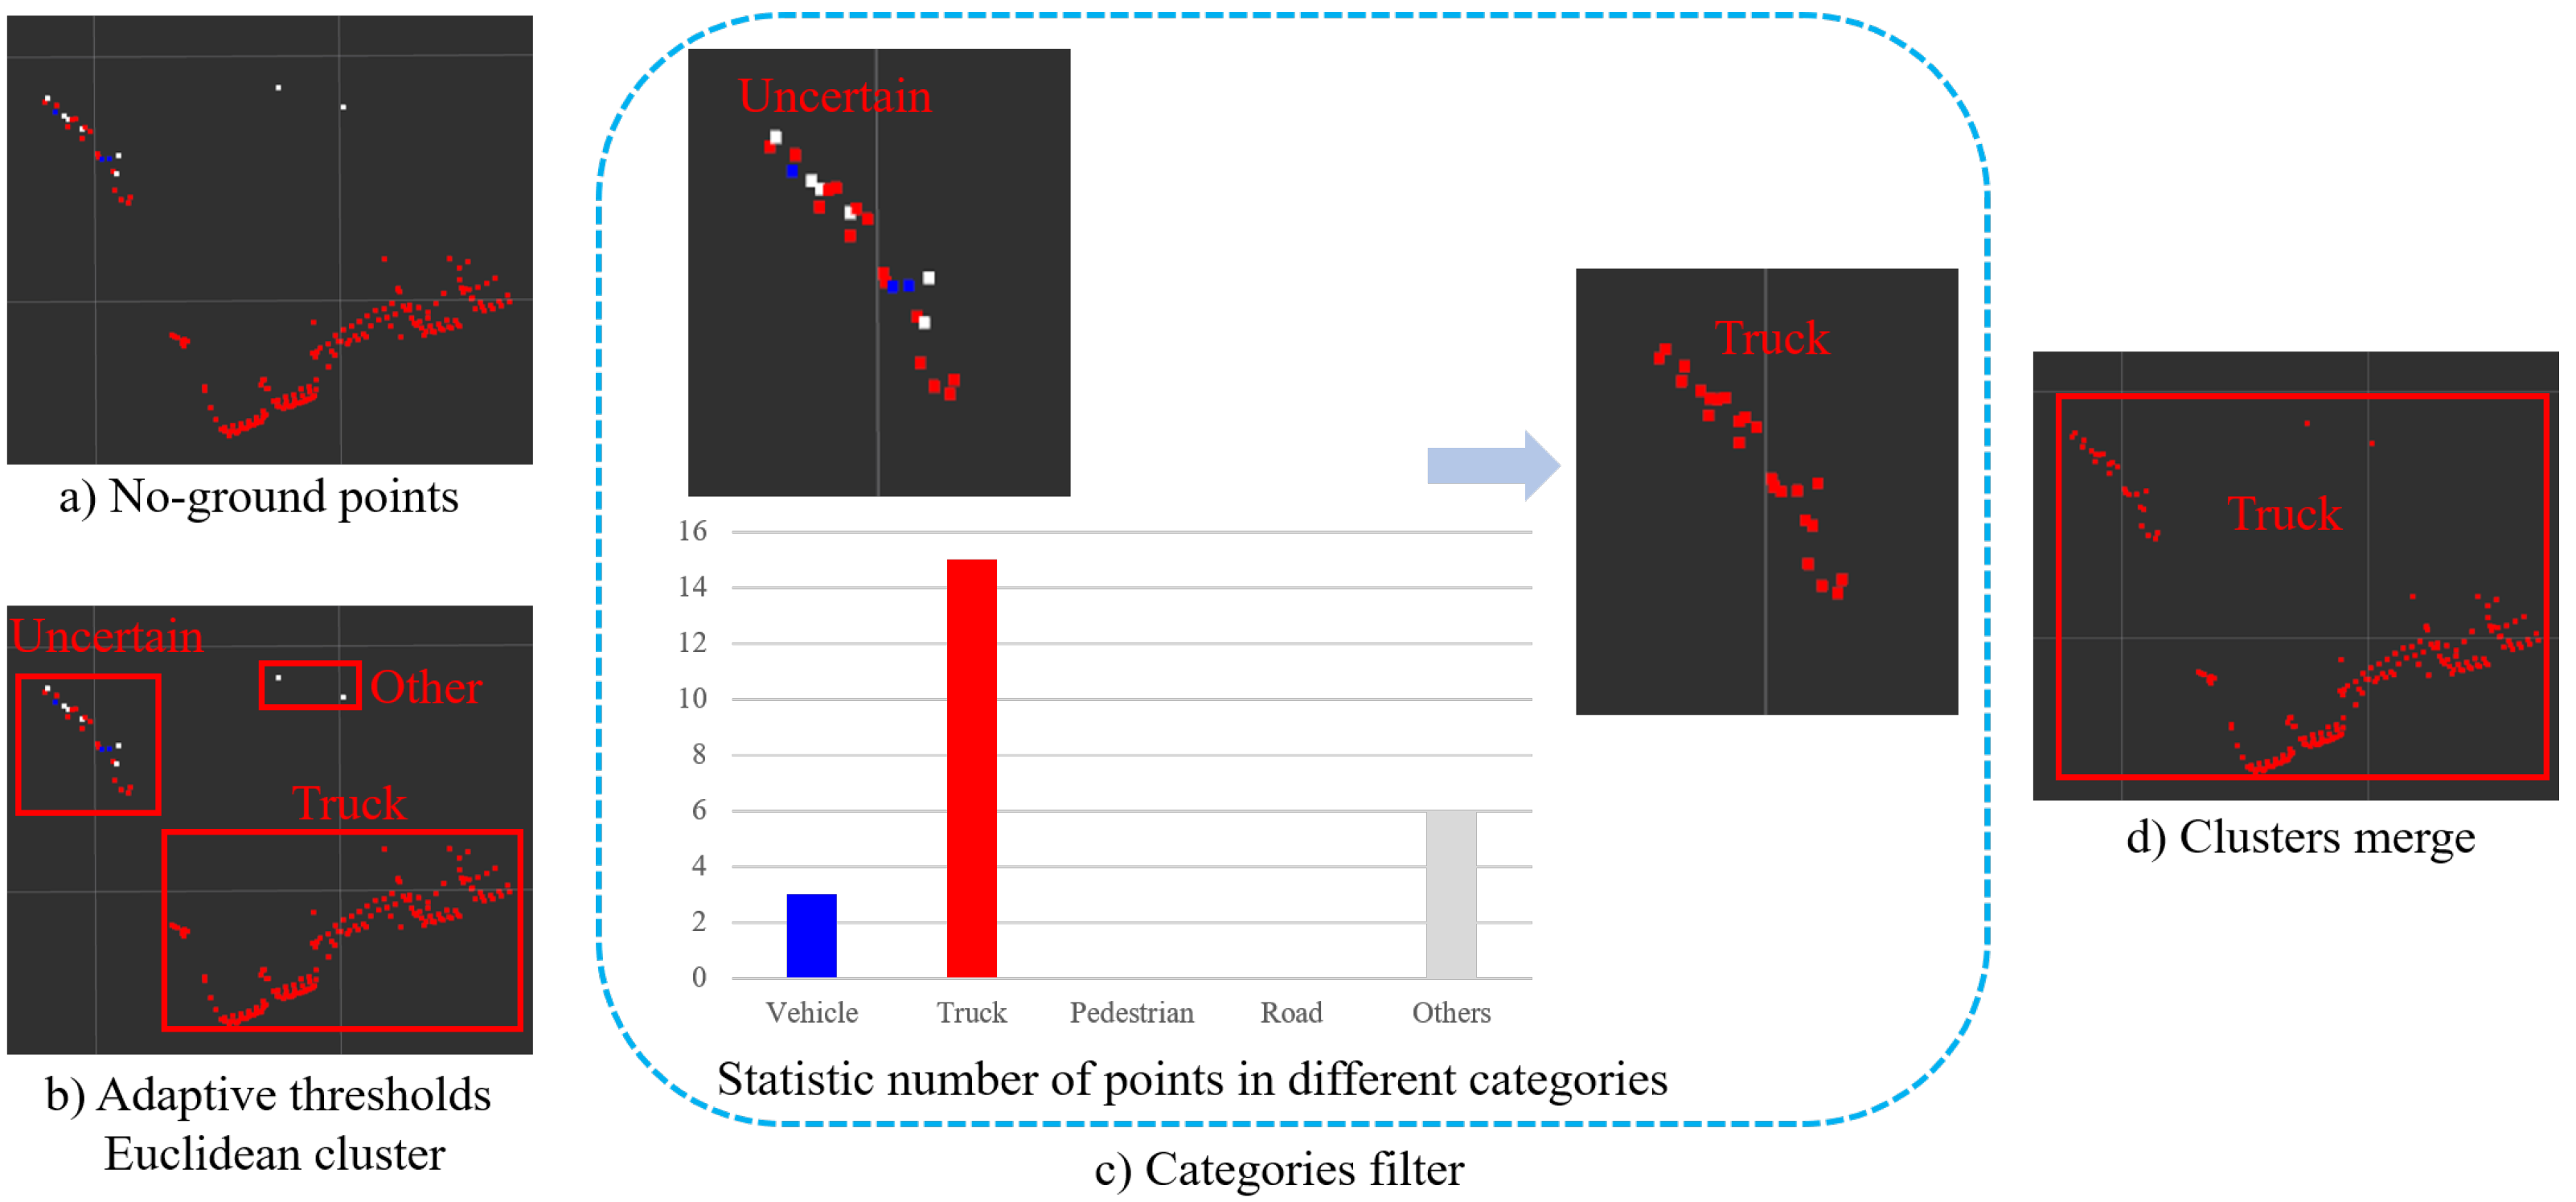
- To overcome over- and undersegmentation caused by the sparsity of point clouds, we propose a clustering method of adaptive Euclidean clustering distance thresholds according to semantic segmentation categories.
- Semantic and geometric features are fused to enhance the object detection performance in terms of both efficiency and accuracy. The quantitative comparisons on the TG-Mine-3D dataset illustrate that our method achieved state-of-the-art performance on truck and pedestrian detection accuracy, and promising computational speed.
2. Related Work
2.1. Research on Traditional Methods
2.2. Research on Deep-Learning-Based Methods
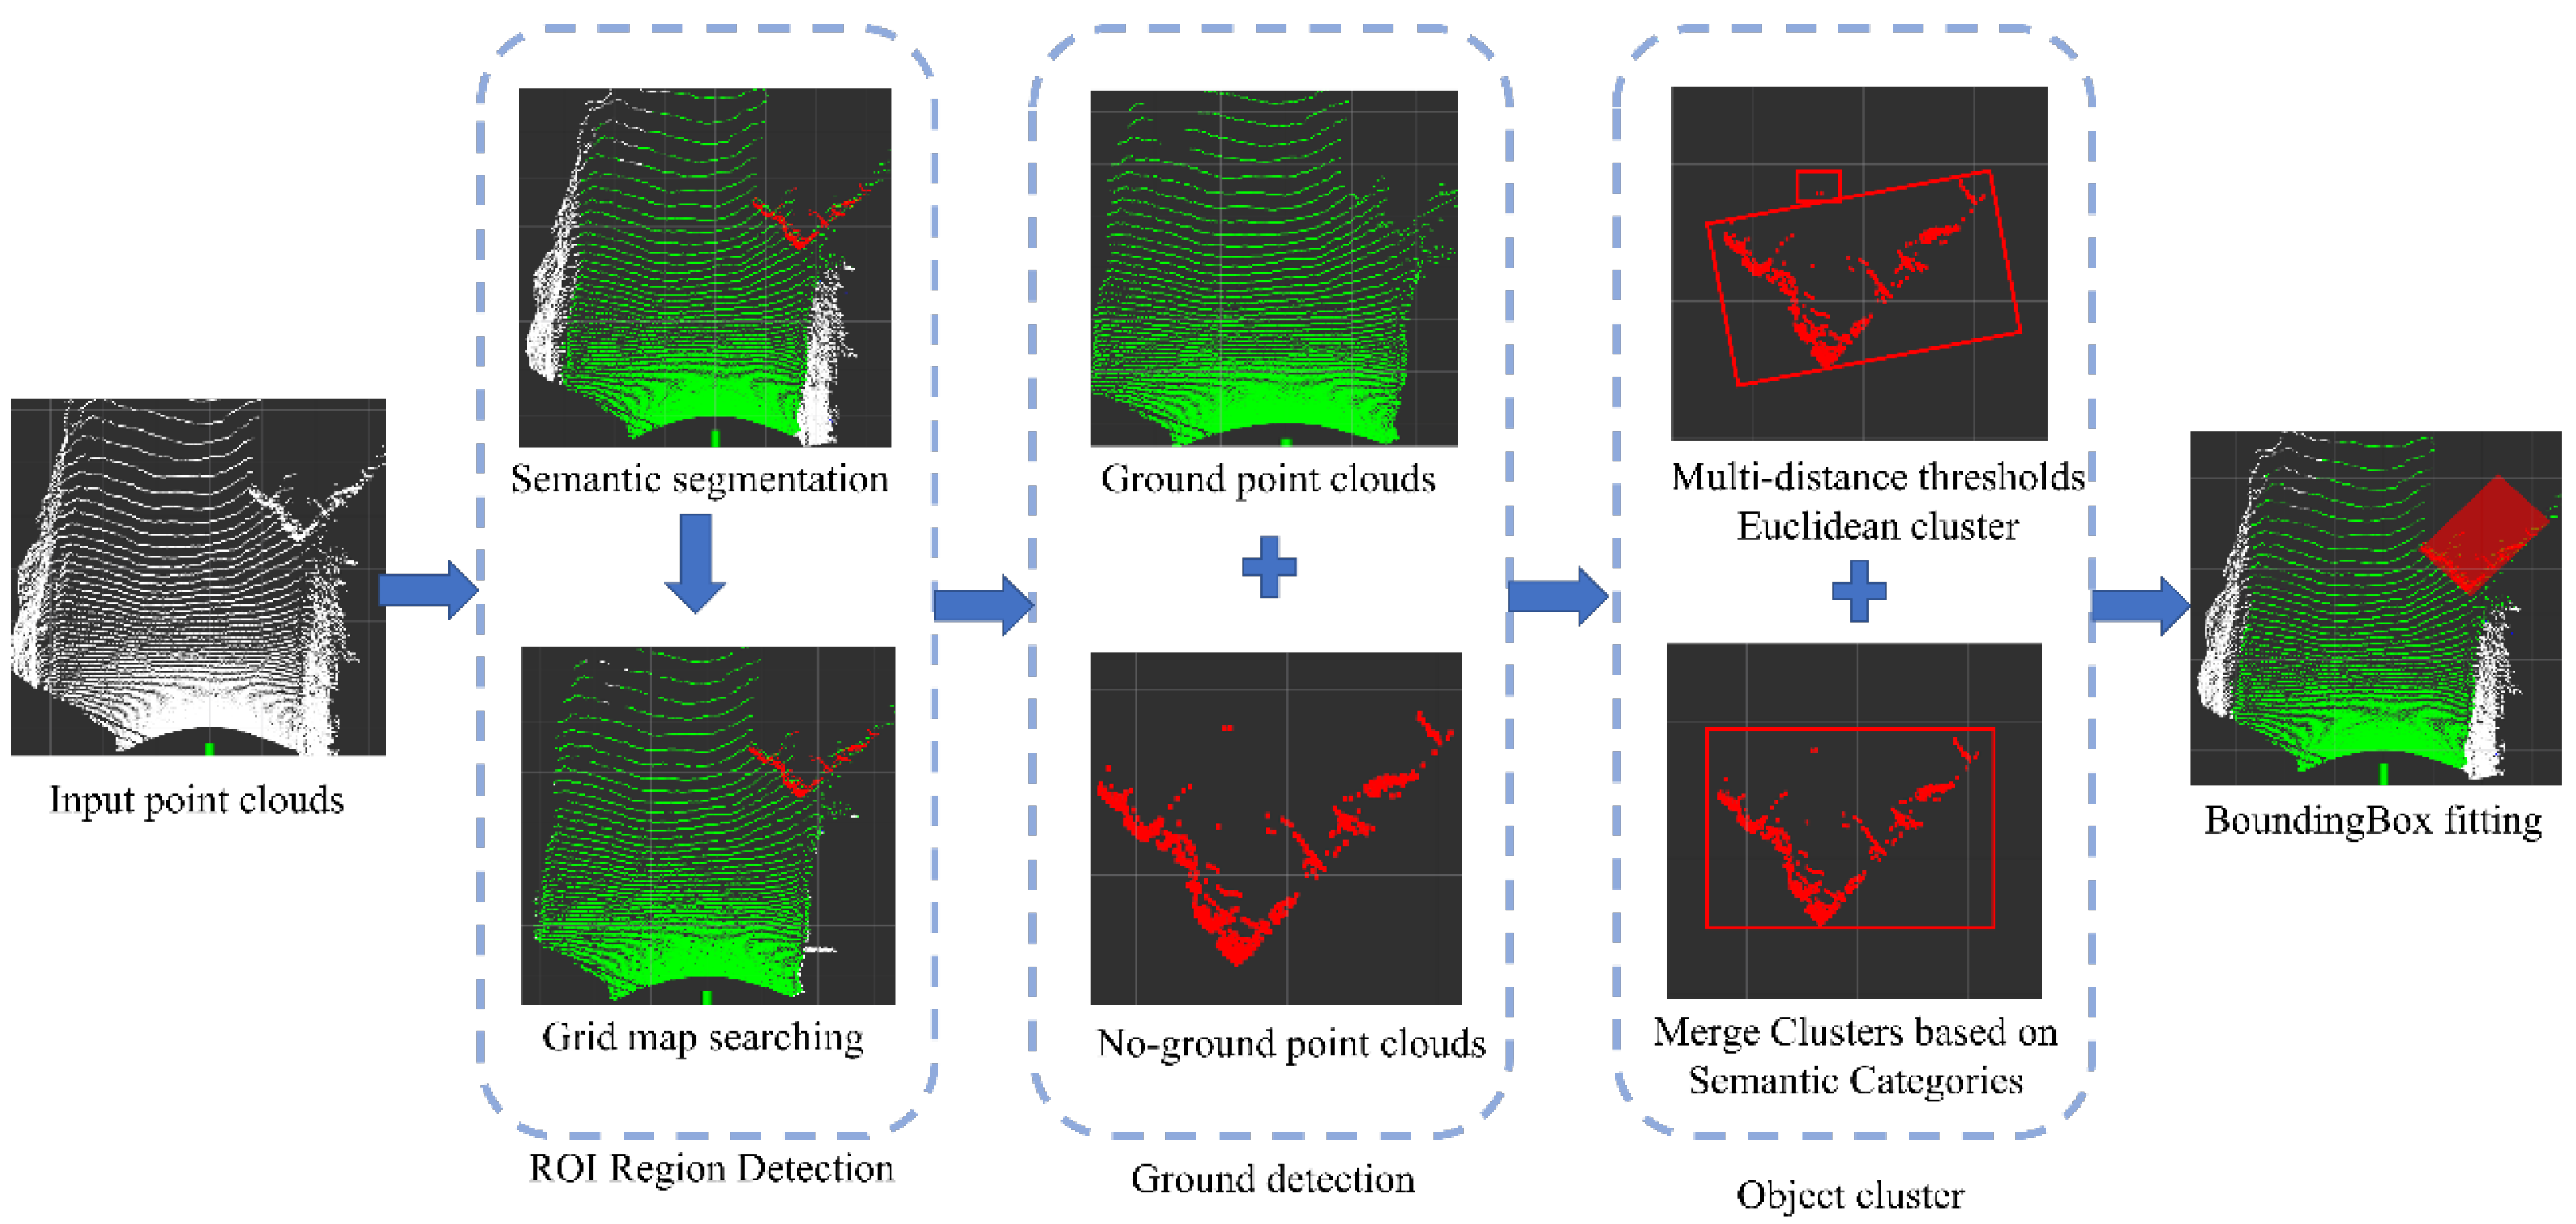
3. Methodology
3.1. Road Region Extraction
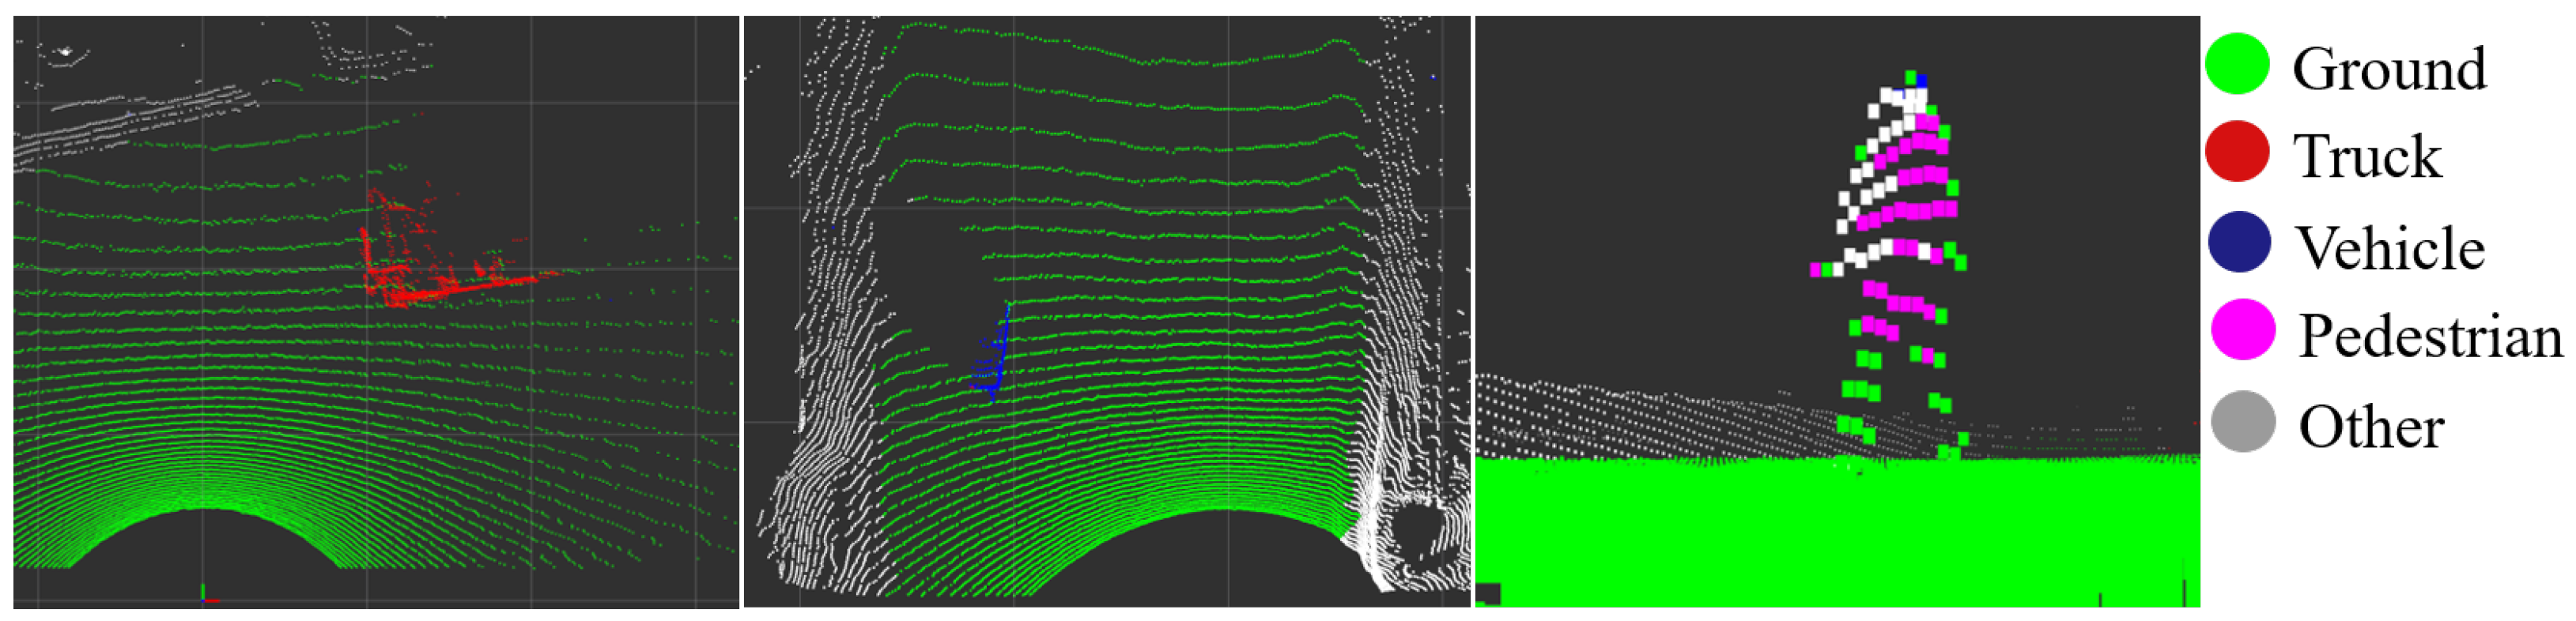
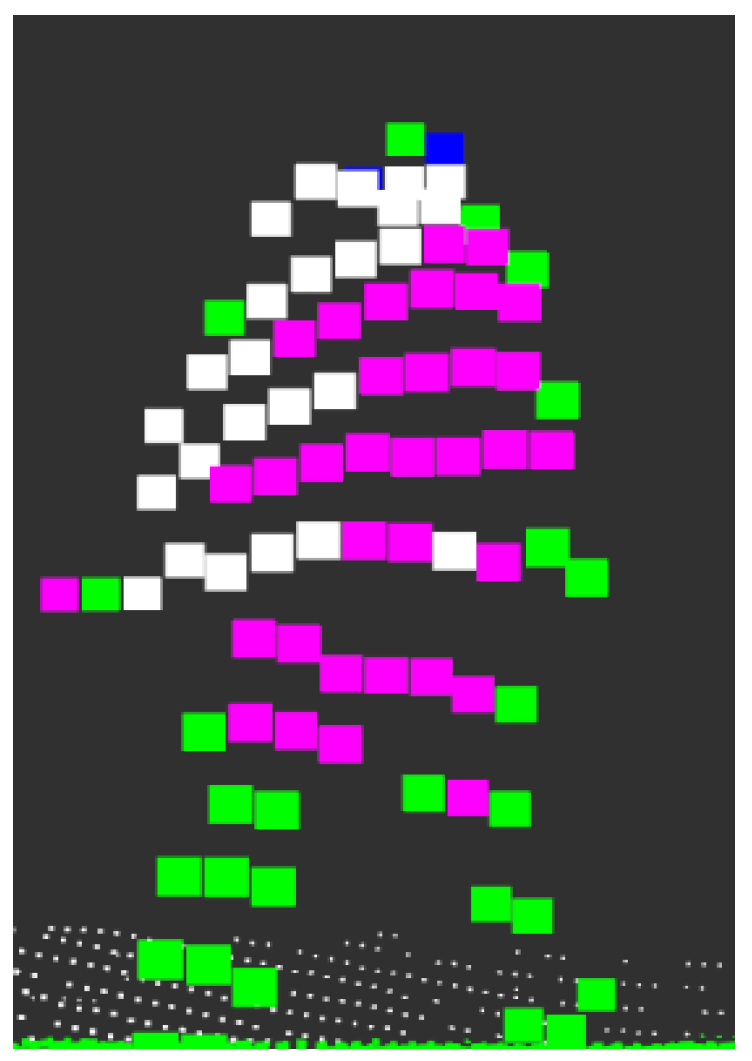
3.1.1. Cloud Semantic Segmentation
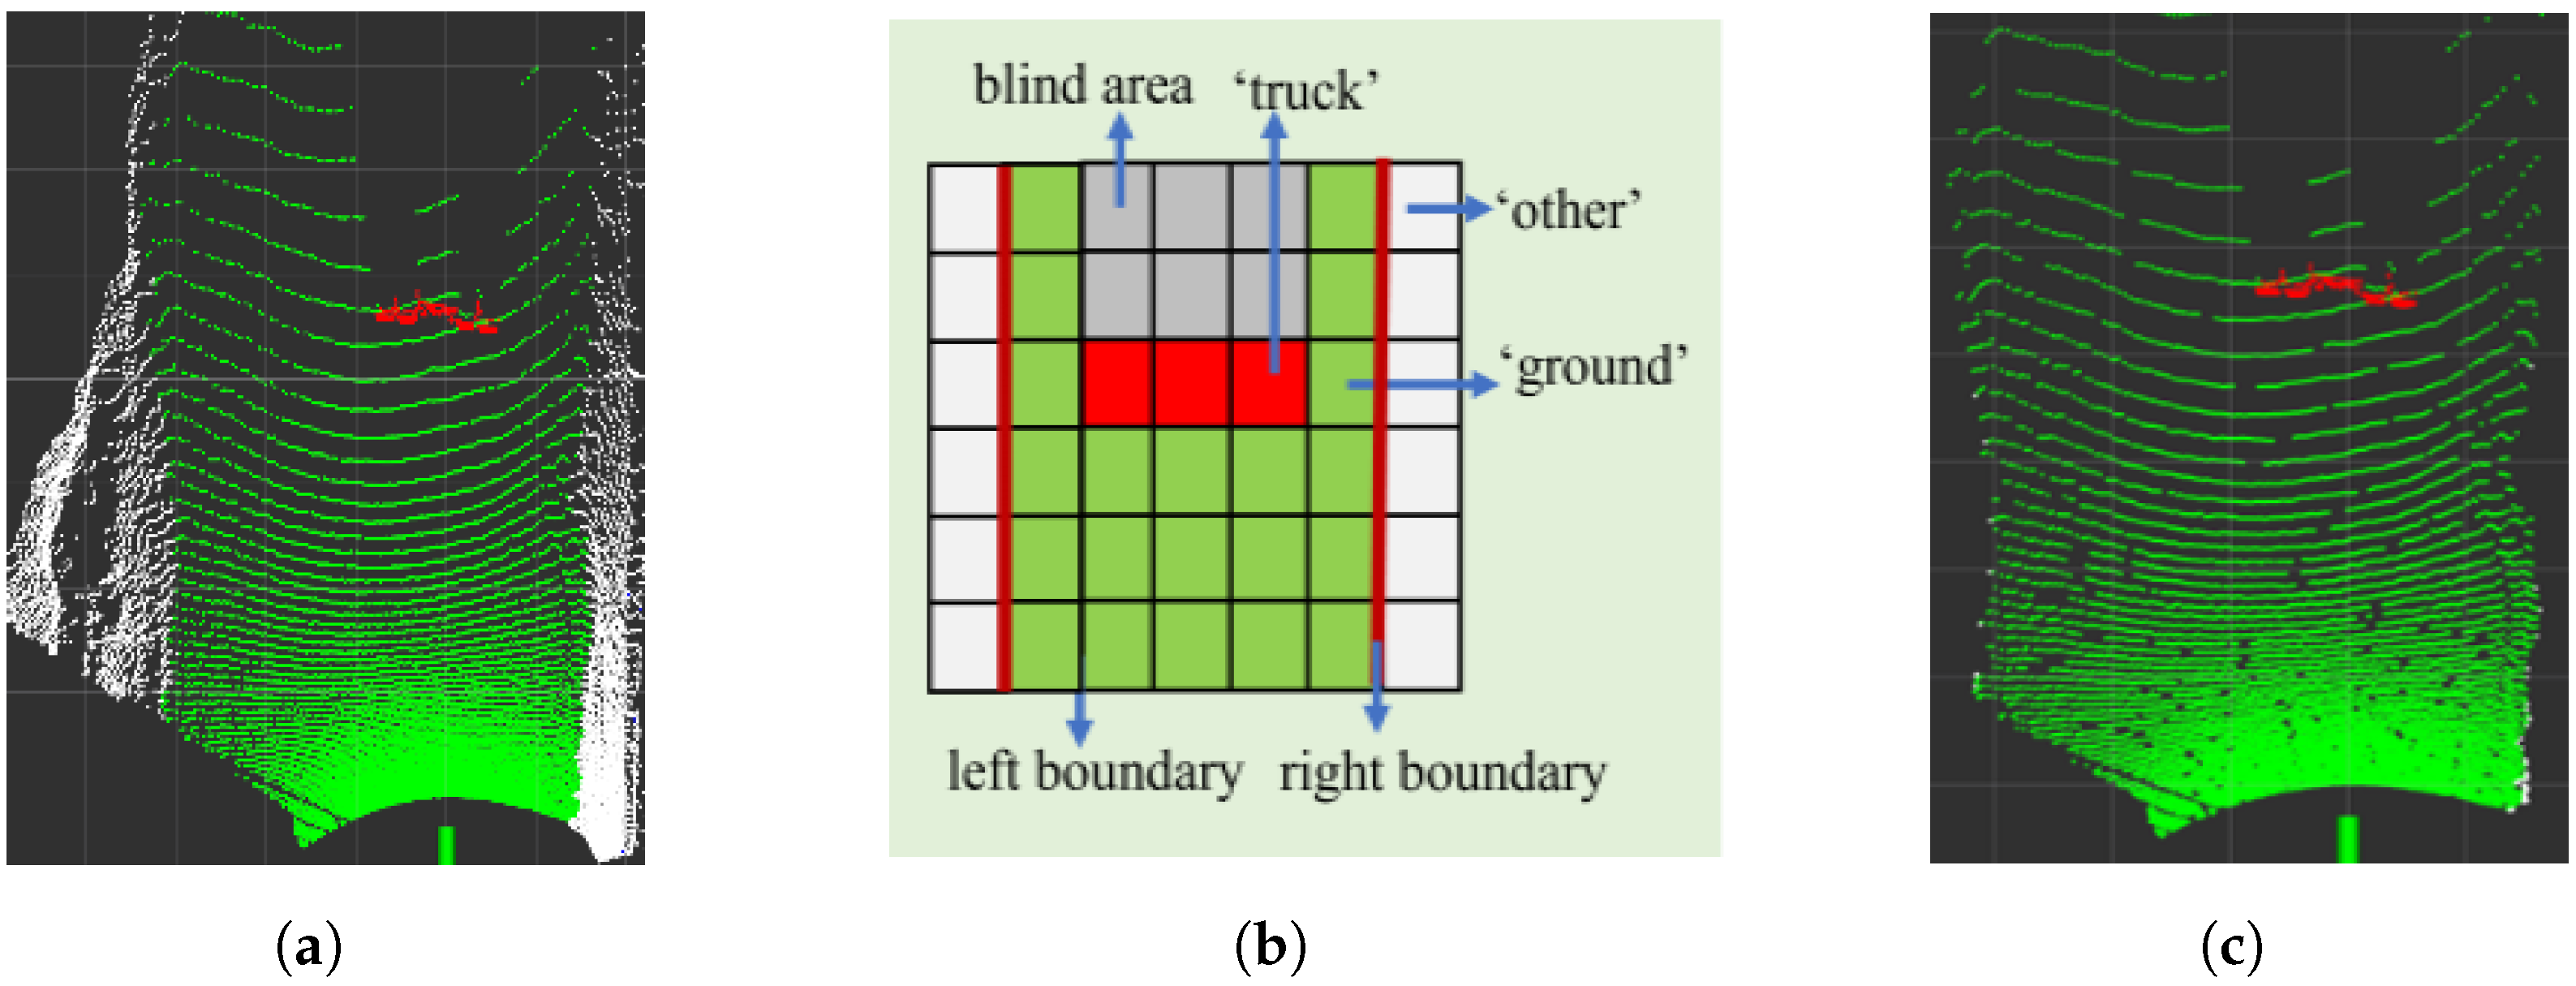
3.1.2. Road Region Searching
3.2. Ground Detection
| Algorithm 1 Road region searching. |
|
| Algorithm 2 Ground detection. |
|
3.3. Object Clustering
4. Experimental Results
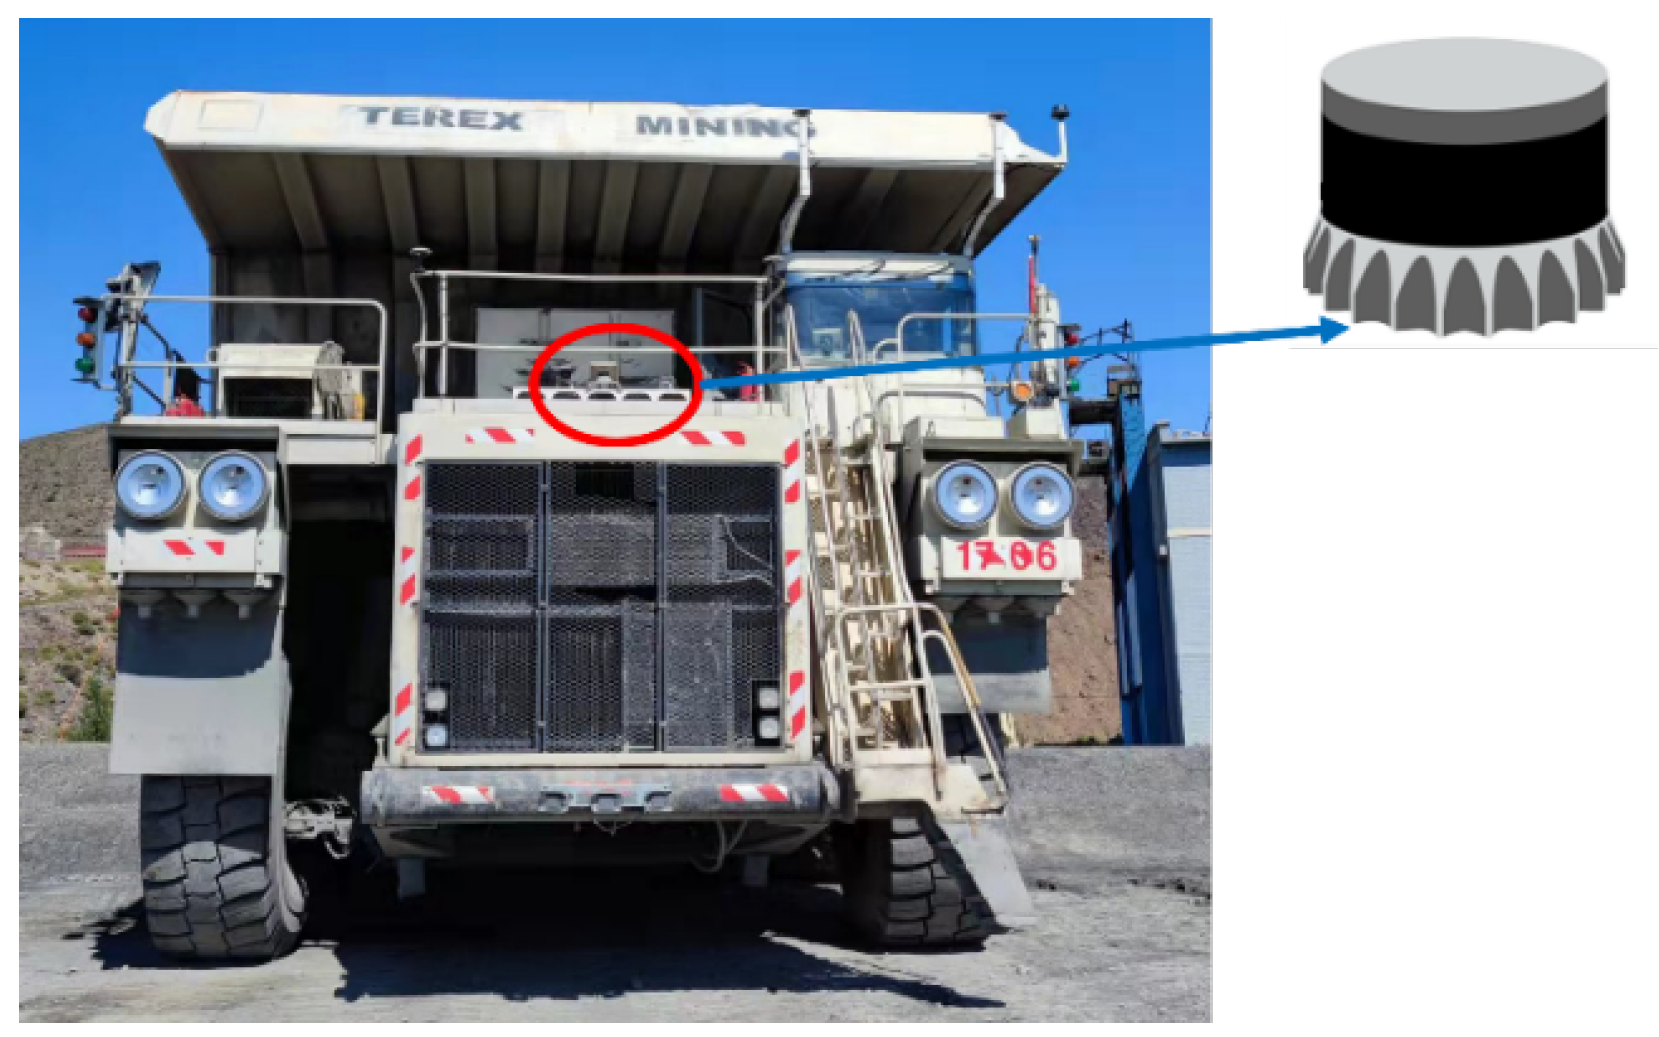
4.1. Experimental Setup
4.2. Dataset
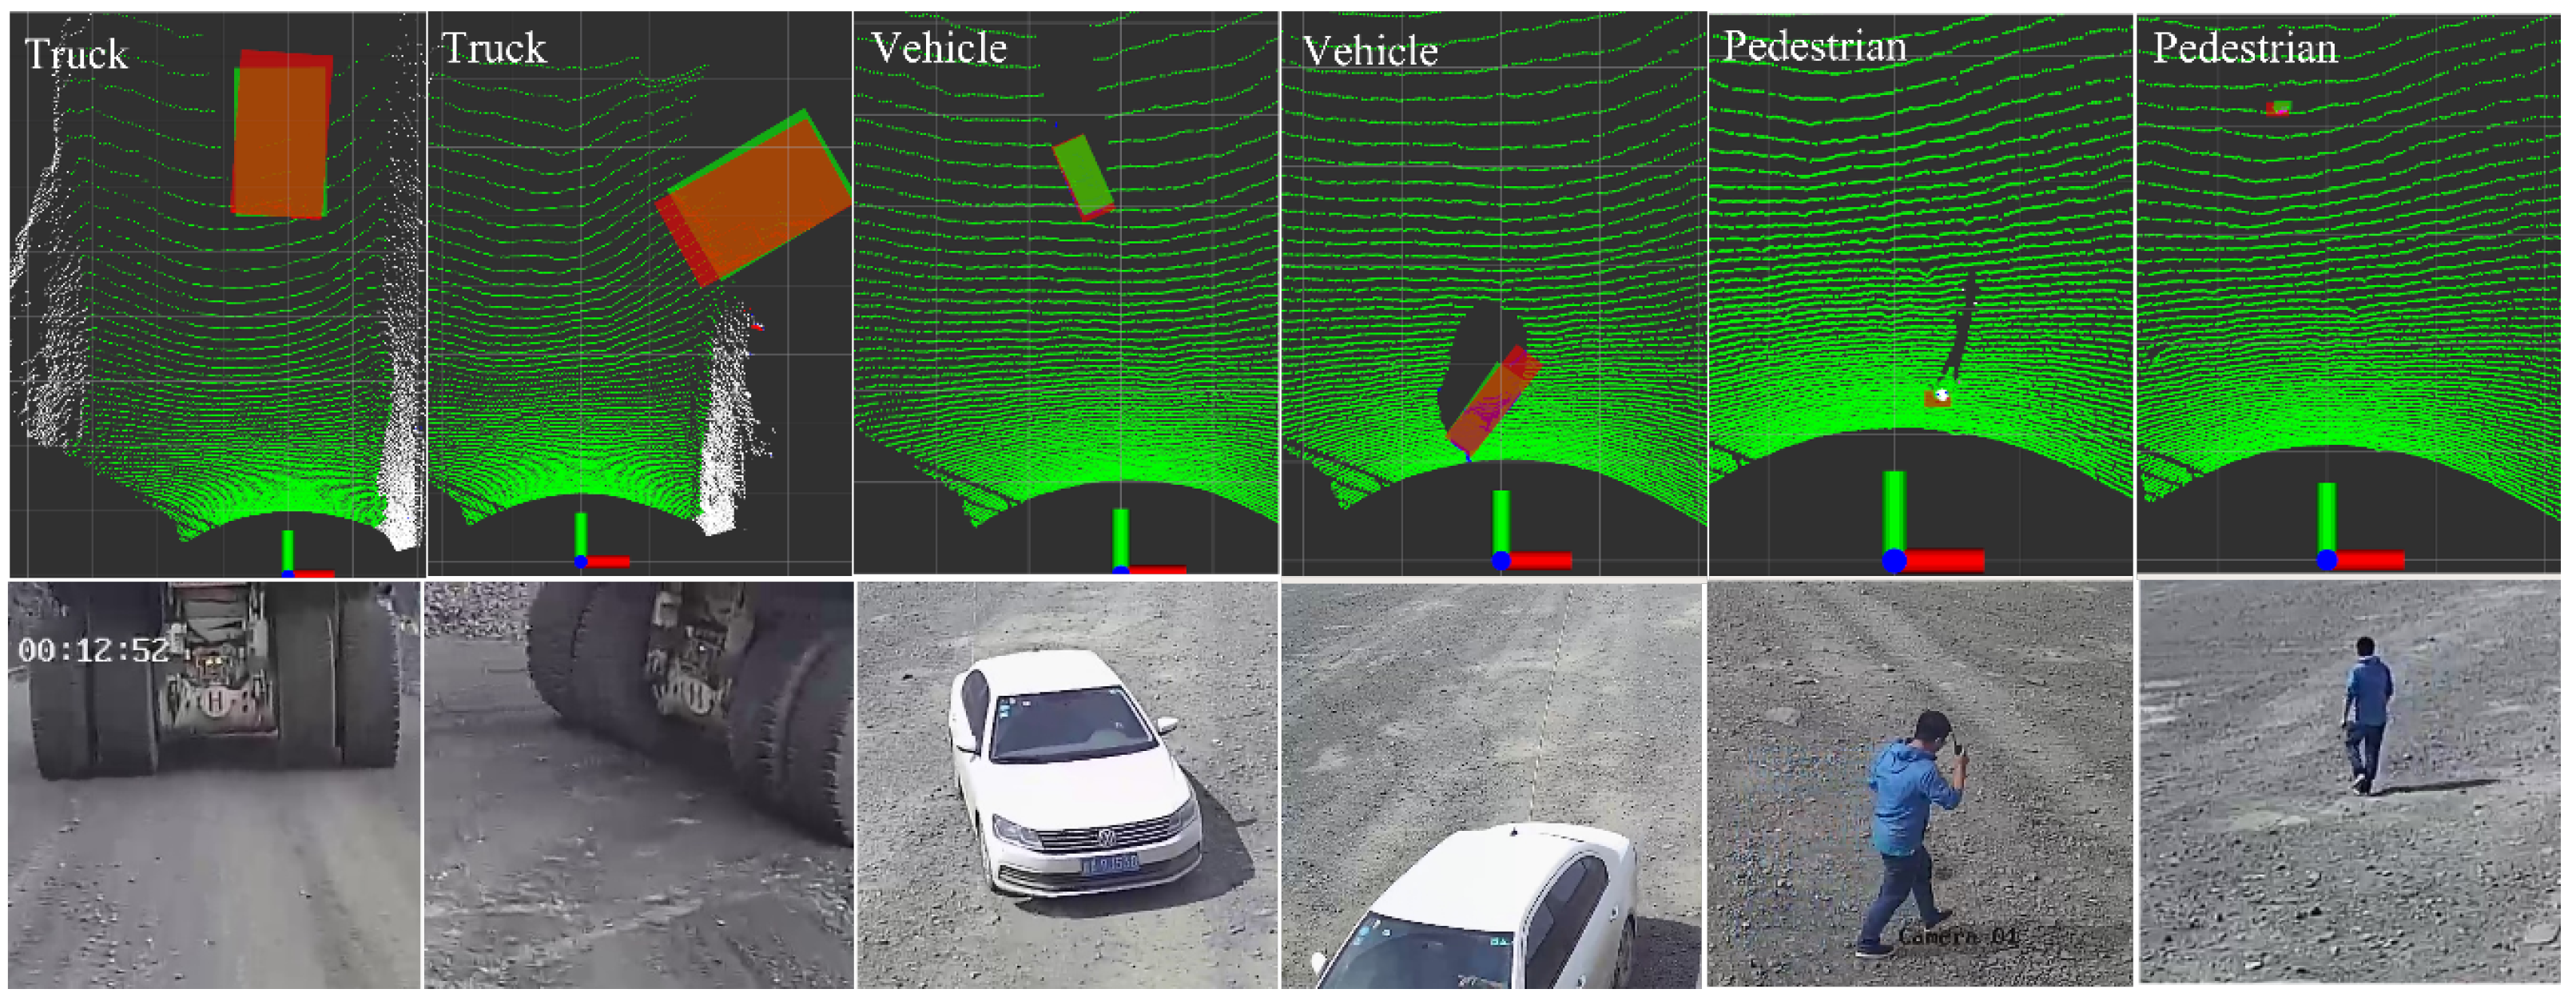
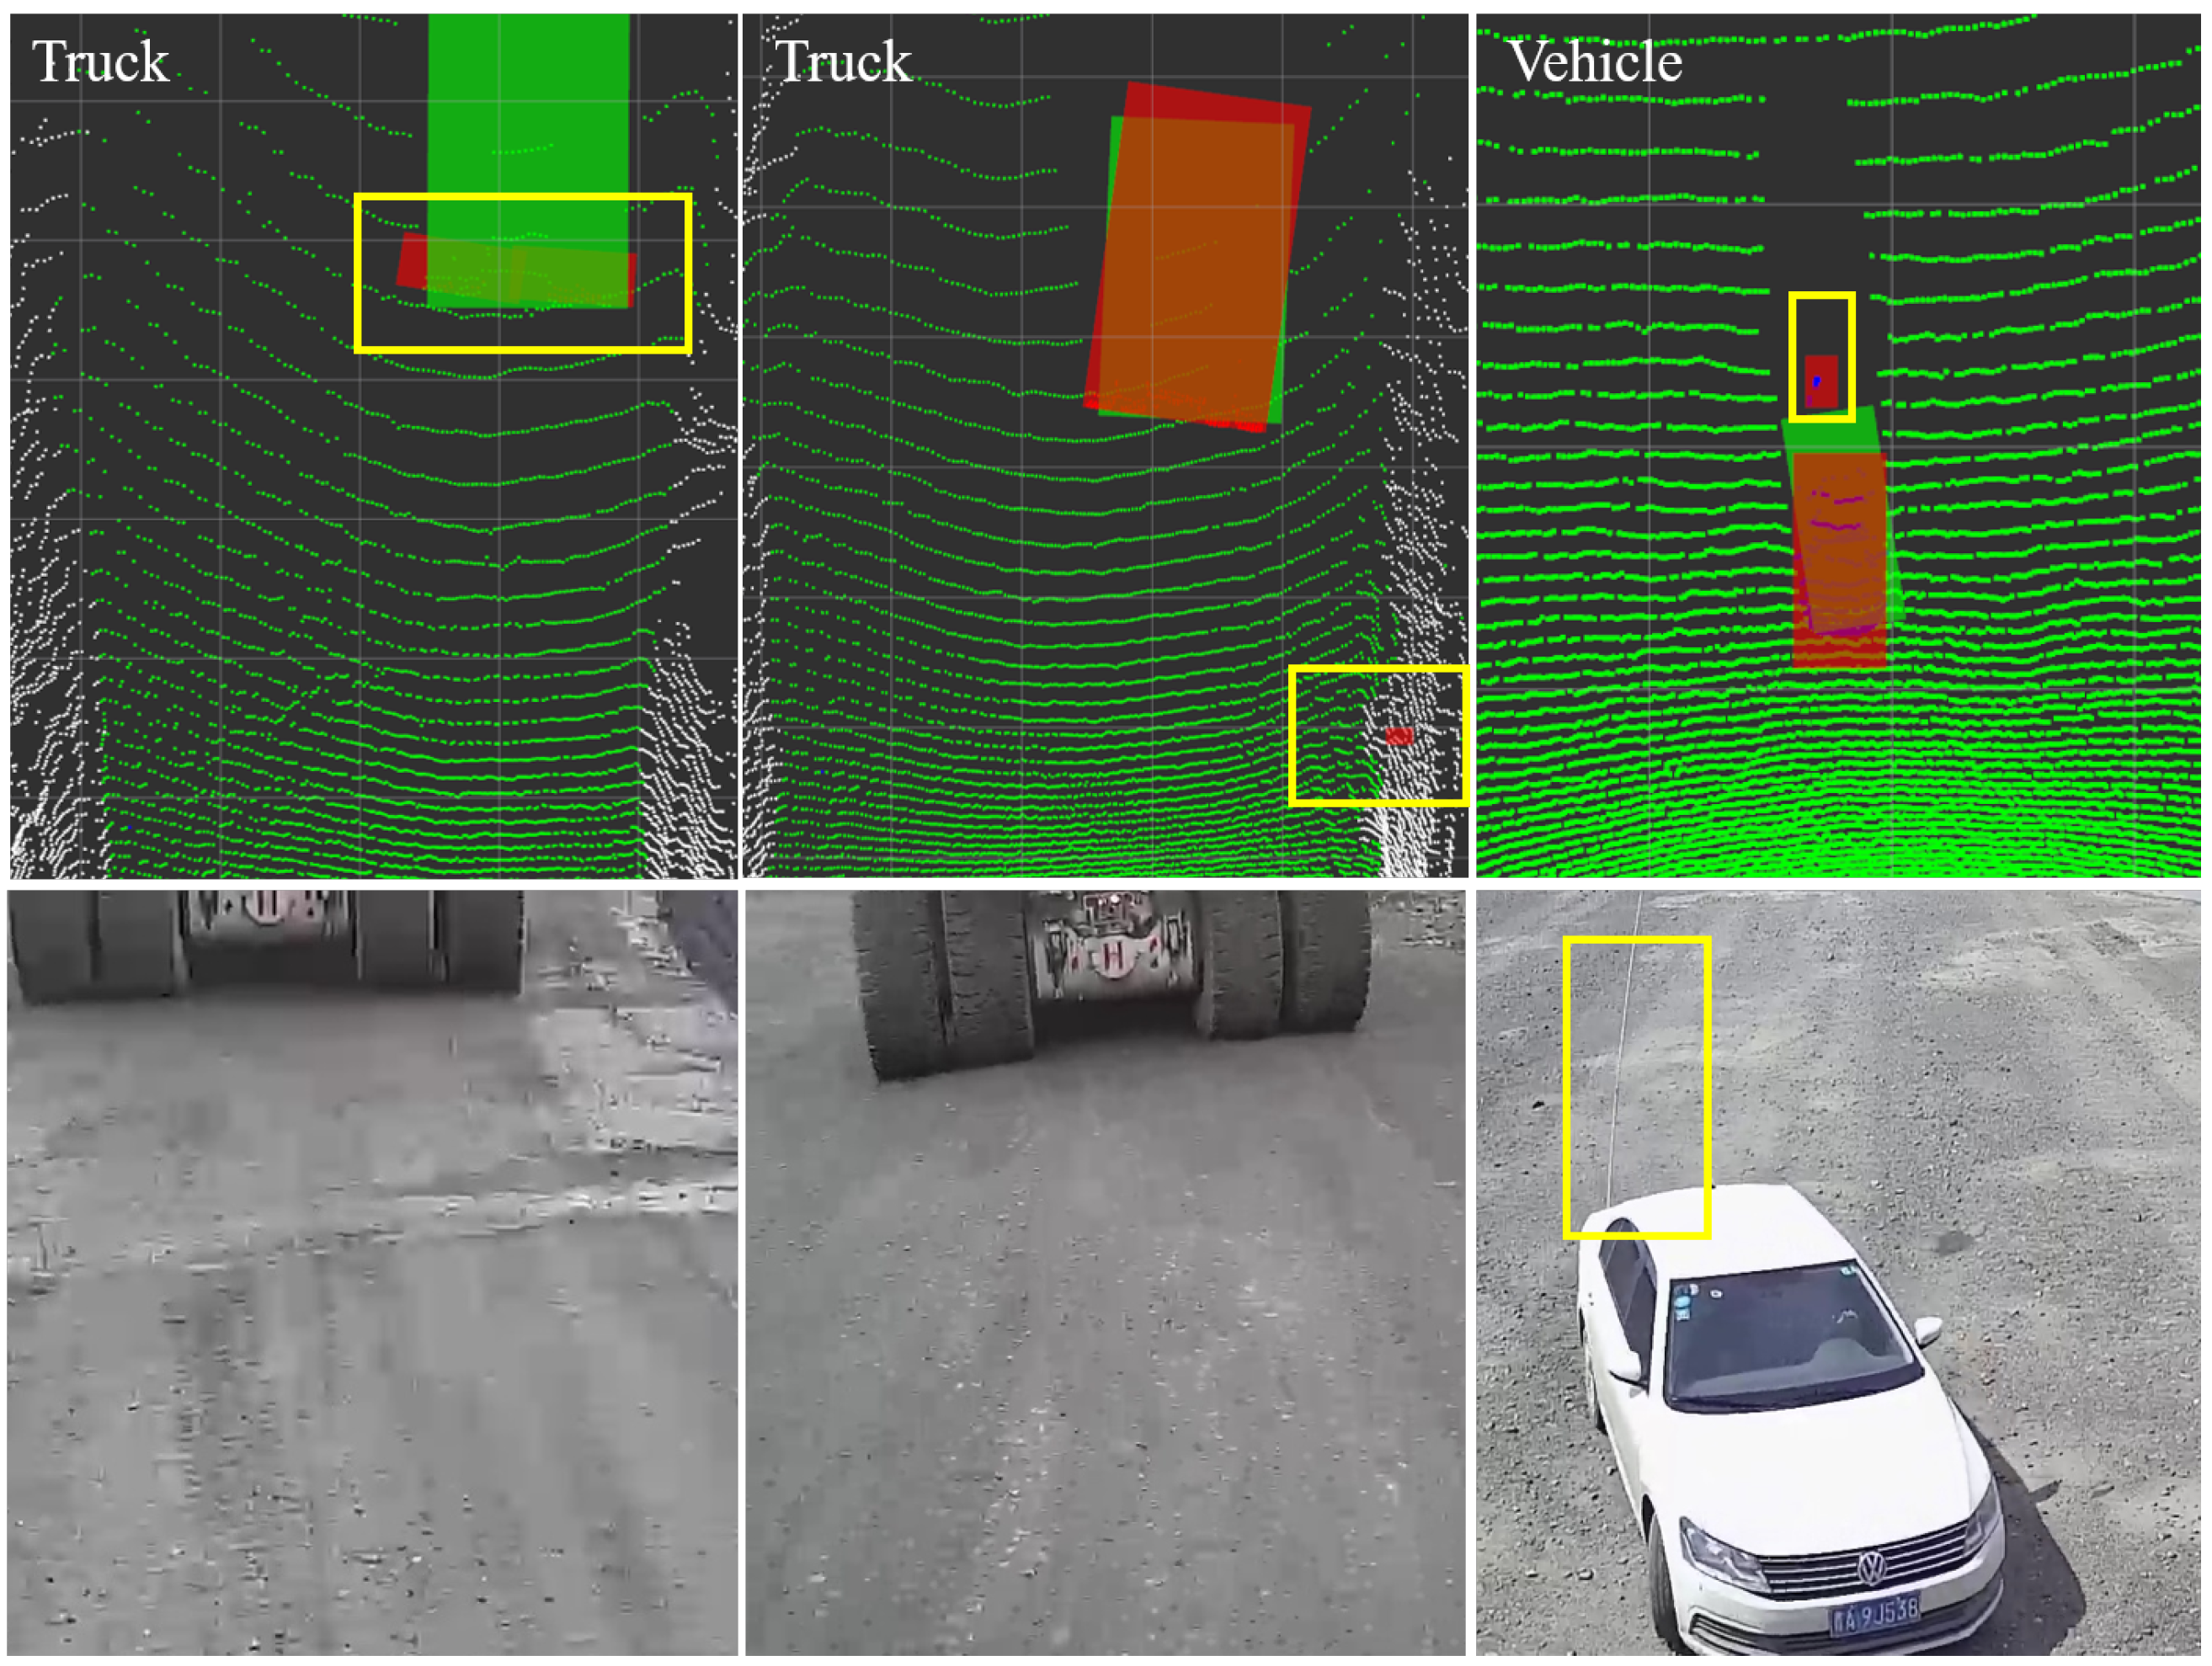
4.3. Results
5. Conclusions
Author Contributions
Funding
Institutional Review Board Statement
Informed Consent Statement
Data Availability Statement
Acknowledgments
Conflicts of Interest
References
- Ren, S.; He, K.; Girshick, R.; Sun, J. Faster R-CNN: Towards Real-Time Object Detection with Region Proposal Networks. IEEE Trans. Pattern Anal. Mach. Intell. 2017, 39, 1137–1149. [Google Scholar] [CrossRef] [PubMed]
- Zheng, W.; Xie, H.; Chen, Y.; Roh, J.; Shin, H. PIFNet: 3D Object Detection Using Joint Image and Point Cloud Features for Autonomous Driving. Appl. Sci. 2022, 12, 3686. [Google Scholar] [CrossRef]
- Sabou, S.; Oniga, S.; Lung, C. Magnetic sensors in inertial navigation system. In Proceedings of the 2014 IEEE 20th International Symposium for Design and Technology in Electronic Packaging (SIITME), Bucharest, Romania, 23–26 October 2014; IEEE: Piscataway, NJ, USA, 2014; pp. 211–214. [Google Scholar]
- Wang, W.; Chang, X.; Yang, J.; Xu, G. LiDAR-Based Dense Pedestrian Detection and Tracking. Appl. Sci. 2022, 12, 1799. [Google Scholar] [CrossRef]
- Hoang, L.; Lee, S.H.; Lee, E.J.; Kwon, K.R. GSV-NET: A Multi-Modal Deep Learning Network for 3D Point Cloud Classification. Appl. Sci. 2022, 12, 483. [Google Scholar] [CrossRef]
- Wang, G.; Wu, J.; Xu, T.; Tian, B. 3D vehicle detection with RSU LiDAR for autonomous mine. IEEE Trans. Veh. Technol. 2021, 70, 344–355. [Google Scholar] [CrossRef]
- Tang, J.; Lu, X.; Ai, Y.; Tian, B.; Chen, L. Road Detection for autonomous truck in mine environment. In Proceedings of the 2019 IEEE Intelligent Transportation Systems Conference (ITSC), Auckland, NZ, USA, 27–30 October 2019; IEEE: Piscataway, NJ, USA, 2019; pp. 839–845. [Google Scholar]
- Yan, Z.; Duckett, T.; Bellotto, N. Online learning for human classification in 3D LiDAR-based tracking. In Proceedings of the 2017 IEEE/RSJ International Conference on Intelligent Robots and Systems (IROS), Vancouver, BC, Canada, 24–28 September 2017; IEEE: Piscataway, NJ, USA, 2017; pp. 864–871. [Google Scholar]
- Zhao, Y.; Zhang, X.; Huang, X. A technical survey and evaluation of traditional point cloud clustering methods for lidar panoptic segmentation. In Proceedings of the IEEE/CVF International Conference on Computer Vision, Montreal, QC, Canada, 10–17 October 2021; pp. 2464–2473. [Google Scholar]
- Narksri, P.; Takeuchi, E.; Ninomiya, Y.; Morales, Y.; Akai, N.; Kawaguchi, N. A slope-robust cascaded ground segmentation in 3D point cloud for autonomous vehicles. In Proceedings of the 2018 21st International Conference on intelligent transportation systems (ITSC), Maui, HI, USA, 4–7 November 2018; IEEE: Piscataway, NJ, USA, 2018; pp. 497–504. [Google Scholar]
- Zermas, D.; Izzat, I.; Papanikolopoulos, N. Fast segmentation of 3d point clouds: A paradigm on lidar data for autonomous vehicle applications. In Proceedings of the 2017 IEEE International Conference on Robotics and Automation (ICRA), Singapore, 29 May–3 June 2017; IEEE: Piscataway, NJ, USA, 2017; pp. 5067–5073. [Google Scholar]
- Li, N.; Su, B. 3D-Lidar based obstacle detection and fast map reconstruction in rough terrain. In Proceedings of the 2020 5th International Conference on Automation, Control and Robotics Engineering (CACRE), Dalian, China, 19–20 September 2020; IEEE: Piscataway, NJ, USA, 2020; pp. 145–151. [Google Scholar]
- Anand, B.; Senapati, M.; Barsaiyan, V.; Rajalakshmi, P. LiDAR-INS/GNSS-Based Real-Time Ground Removal, Segmentation, and Georeferencing Framework for Smart Transportation. IEEE Trans. Instrum. Meas. 2021, 70, 1–11. [Google Scholar] [CrossRef]
- Klasing, K.; Wollherr, D.; Buss, M. A clustering method for efficient segmentation of 3D laser data. In Proceedings of the 2008 IEEE International Conference on Robotics and Automation, Bangkok, Thailand, 14–17 December 2008; IEEE: Piscataway, NJ, USA, 2008; pp. 4043–4048. [Google Scholar]
- Klasing, K.; Wollherr, D.; Buss, M. Realtime segmentation of range data using continuous nearest neighbors. In Proceedings of the 2009 IEEE International Conference on Robotics and Automation, Kobe, Japan, 12–17 May 2009; IEEE: Piscataway, NJ, USA, 2009; pp. 2431–2436. [Google Scholar]
- Ester, M.; Kriegel, H.P.; Sander, J.; Xu, X. A density-based algorithm for discovering clusters in large spatial databases with noise. In Proceedings of the Second International Conference on Knowledge Discovery and Data Mining (KDD), Portland, OR, USA, 2–4 August 1996; Volume 96, pp. 226–231. [Google Scholar]
- Tran, T.N.; Drab, K.; Daszykowski, M. Revised DBSCAN algorithm to cluster data with dense adjacent clusters. Chemom. Intell. Lab. Syst. 2013, 120, 92–96. [Google Scholar] [CrossRef]
- Hou, J.; Gao, H.; Li, X. DSets-DBSCAN: A parameter-free clustering algorithm. IEEE Trans. Image Process. 2016, 25, 3182–3193. [Google Scholar] [CrossRef] [PubMed]
- Sarcinelli, R.; Guidolini, R.; Cardoso, V.B.; Paixão, T.M.; Berriel, R.F.; Azevedo, P.; De Souza, A.F.; Badue, C.; Oliveira-Santos, T. Handling pedestrians in self-driving cars using image tracking and alternative path generation with Frenét frames. Comput. Graph. 2019, 84, 173–184. [Google Scholar] [CrossRef]
- Liu, W.; Anguelov, D.; Erhan, D.; Szegedy, C.; Reed, S.; Fu, C.Y.; Berg, A.C. Ssd: Single shot multibox detector. In Proceedings of the European Conference on Computer Vision, Amsterdam, The Netherlands, 11–14 October 2016; Springer: New York, NY, USA, 2016; pp. 21–37. [Google Scholar]
- Lang, A.H.; Vora, S.; Caesar, H.; Zhou, L.; Yang, J.; Beijbom, O. Pointpillars: Fast encoders for object detection from point clouds. In Proceedings of the IEEE/CVF Conference on Computer Vision and Pattern Recognition, Long Beach, CA, USA, 15–20 June 2019; pp. 12697–12705. [Google Scholar]
- Shi, S.; Wang, X.; Li, H. Pointrcnn: 3d object proposal generation and detection from point cloud. In Proceedings of the IEEE/CVF Conference on Computer Vision and Pattern Recognition, Long Beach, CA, USA, 15–20 June 2019; pp. 770–779. [Google Scholar]
- Liu, Z.; Zhao, X.; Huang, T.; Hu, R.; Zhou, Y.; Bai, X. Tanet: Robust 3d object detection from point clouds with triple attention. In Proceedings of the AAAI Conference on Artificial Intelligence, New York, NY, USA, 7–12 February 2020; Volume 34, pp. 11677–11684. [Google Scholar]
- Chen, X.; Kundu, K.; Zhu, Y.; Berneshawi, A.G.; Ma, H.; Fidler, S.; Urtasun, R. 3d object proposals for accurate object class detection. In Proceedings of the Advances in Neural Information Processing Systems, Montreal, QC, Canada, 7–12 December 2015; Volume 28, pp. 424–432. [Google Scholar]
- Chen, X.; Kundu, K.; Zhang, Z.; Ma, H.; Fidler, S.; Urtasun, R. Monocular 3d object detection for autonomous driving. In Proceedings of the IEEE Conference on Computer Vision and Pattern Recognition, Las Vegas, NV, USA, 27–30 June 2016; pp. 2147–2156. [Google Scholar]
- Mousavian, A.; Anguelov, D.; Flynn, J.; Kosecka, J. 3d bounding box estimation using deep learning and geometry. In Proceedings of the IEEE Conference on Computer Vision and Pattern Recognition, Honolulu, HI, USA, 21–26 July 2017; pp. 7074–7082. [Google Scholar]
- Li, B.; Ouyang, W.; Sheng, L.; Zeng, X.; Wang, X. Gs3d: An efficient 3d object detection framework for autonomous driving. In Proceedings of the IEEE/CVF Conference on Computer Vision and Pattern Recognition, Long Beach, CA, USA, 15–20 June 2019; pp. 1019–1028. [Google Scholar]
- Zhou, Y.; Tuzel, O. Voxelnet: End-to-end learning for point cloud based 3d object detection. In Proceedings of the IEEE Conference on Computer Vision and Pattern Recognition, Salt Lake City, UT, USA, 18–23 June 2018; pp. 4490–4499. [Google Scholar]
- Yan, Y.; Mao, Y.; Li, B. Second: Sparsely embedded convolutional detection. Sensors 2018, 18, 3337. [Google Scholar] [CrossRef] [PubMed]
- Qi, C.R.; Su, H.; Mo, K.; Guibas, L.J. Pointnet: Deep learning on point sets for 3d classification and segmentation. In Proceedings of the IEEE Conference on Computer Vision and Pattern Recognition, Honolulu, HI, USA, 21–26 July 2017; pp. 652–660. [Google Scholar]
- Qi, C.R.; Yi, L.; Su, H.; Guibas, L.J. Pointnet++: Deep hierarchical feature learning on point sets in a metric space. In Proceedings of the Advances in Neural Information Processing Systems, Long Beach, CA, USA, 4–9 December 2017; Volume 30, pp. 5099–5108. [Google Scholar]
- Zhao, G.; Yuan, J. Curb detection and tracking using 3D-LIDAR scanner. In Proceedings of the 2012 19th IEEE International Conference on Image Processing, Orlando, FL, USA, 30 September–3 October 2012; IEEE: Piscataway, NJ, USA, 2012; pp. 437–440. [Google Scholar]
- Jung, Y.; Seo, S.W.; Kim, S.W. Curb detection and tracking in low-resolution 3d point clouds based on optimization framework. IEEE Trans. Intell. Transp. Syst. 2019, 21, 3893–3908. [Google Scholar] [CrossRef]
- Kong, X.; Zhai, G.; Zhong, B.; Liu, Y. Pass3d: Precise and accelerated semantic segmentation for 3d point cloud. In Proceedings of the 2019 IEEE/RSJ International Conference on Intelligent Robots and Systems (IROS), Macau, China, 4–8 November 2019; IEEE: Piscataway, NJ, USA, 2019; pp. 3467–3473. [Google Scholar]
- Cortinhal, T.; Tzelepis, G.; Erdal Aksoy, E. SalsaNext: Fast, uncertainty-aware semantic segmentation of LiDAR point clouds. In Proceedings of the International Symposium on Visual Computing, San Diego, CA, USA, 5–7 October 2020; Springer: New York, NY, USA, 2020; pp. 207–222. [Google Scholar]
- Milioto, A.; Vizzo, I.; Behley, J.; Stachniss, C. Rangenet++: Fast and accurate lidar semantic segmentation. In Proceedings of the 2019 IEEE/RSJ International Conference on Intelligent Robots and Systems (IROS), Macau, China, 4–8 November 2019; IEEE: Piscataway, NJ, USA, 2019; pp. 4213–4220. [Google Scholar]
- Qin, T.; Zheng, Y.; Chen, T.; Chen, Y.; Su, Q. A Light-Weight Semantic Map for Visual Localization towards Autonomous Driving. In Proceedings of the 2021 IEEE International Conference on Robotics and Automation (ICRA), Xi’an, China, 30 May–5 June 2021; IEEE: Piscataway, NJ, USA, 2021; pp. 11248–11254. [Google Scholar]
- Zhou, B.; Huang, R. Segmentation Algorithm for 3D LiDAR Point Cloud Based on Region Clustering. In Proceedings of the 2020 7th International Conference on Information, Cybernetics, and Computational Social Systems (ICCSS), Guangzhou, China, 13–15 November 2020; IEEE: Piscataway, NJ, USA, 2020; pp. 52–57. [Google Scholar]
- Ye, Y.; Fu, L.; Li, B. Object detection and tracking using multi-layer laser for autonomous urban driving. In Proceedings of the 2016 IEEE 19th International Conference on Intelligent Transportation Systems (ITSC), Rio de Janeiro, Brazil, 1–4 November 2016; IEEE: Piscataway, NJ, USA, 2016; pp. 259–264. [Google Scholar]
- Rachman, A.S.A. 3D-LIDAR Multi Object Tracking for Autonomous Driving: Multi-Target Detection and Tracking under Urban Road Uncertainties. Master’s Thesis, Delft University of Technology, Delft, The Netherlands, 2017. [Google Scholar]


| Parameters | Definition | Value |
|---|---|---|
| H | Height | 4.1 m |
| Yaw | 0.12 deg | |
| Pitch | −16.1 deg | |
| Roll | −0.031 deg | |
| Horizontal angular resolution | 1024/0.703 deg | |
| Vertical angular resolution | 0.518 deg | |
| f | Out frequency | 10 Hz |
| Method | Truck | Vehicle | Pedestrian | 3D mAP (%) | Running Time (ms) |
|---|---|---|---|---|---|
| Method in [11] | 31.85 | 20.38 | 17.62 | 23.28 | 16.25 |
| Method in [40] | 52.35 | 25.16 | 26.76 | 34.76 | 25.32 |
| SECOND [29] | 75.86 | 71.18 | 39.61 | 62.21 | 49.52 |
| PointPillars [21] | 80.35 | 72.52 | 41.83 | 64.90 | 15.63 |
| PointRCNN [22] | 79.62 | 73.53 | 40.11 | 64.42 | 98.76 |
| TANet [23] | 81.29 | 71.44 | 46.51 | 66.41 | 31.26 |
| 3DSG without ROI | 56.15 | 31.25 | 28.31 | 38.57 | 110.69 |
| 3DSG | 83.95 | 62.91 | 52.31 | 66.39 | 51.35 |
Publisher’s Note: MDPI stays neutral with regard to jurisdictional claims in published maps and institutional affiliations. |
© 2022 by the authors. Licensee MDPI, Basel, Switzerland. This article is an open access article distributed under the terms and conditions of the Creative Commons Attribution (CC BY) license (https://creativecommons.org/licenses/by/4.0/).
Share and Cite
Li, H.; Wang, Z.; Yu, G.; Gong, Z.; Zhou, B.; Chen, P.; Zhao, F. 3DSG: A 3D LiDAR-Based Object Detection Method for Autonomous Mining Trucks Fusing Semantic and Geometric Features. Appl. Sci. 2022, 12, 12444. https://doi.org/10.3390/app122312444
Li H, Wang Z, Yu G, Gong Z, Zhou B, Chen P, Zhao F. 3DSG: A 3D LiDAR-Based Object Detection Method for Autonomous Mining Trucks Fusing Semantic and Geometric Features. Applied Sciences. 2022; 12(23):12444. https://doi.org/10.3390/app122312444
Chicago/Turabian StyleLi, Huazhi, Zhangyu Wang, Guizhen Yu, Ziren Gong, Bin Zhou, Peng Chen, and Fei Zhao. 2022. "3DSG: A 3D LiDAR-Based Object Detection Method for Autonomous Mining Trucks Fusing Semantic and Geometric Features" Applied Sciences 12, no. 23: 12444. https://doi.org/10.3390/app122312444
APA StyleLi, H., Wang, Z., Yu, G., Gong, Z., Zhou, B., Chen, P., & Zhao, F. (2022). 3DSG: A 3D LiDAR-Based Object Detection Method for Autonomous Mining Trucks Fusing Semantic and Geometric Features. Applied Sciences, 12(23), 12444. https://doi.org/10.3390/app122312444