Article

Visualization System for Transparency Requirement Analytics

1
Ecole Nationale Supérieure d’Informatique (ESI), BP 68M, Oued Smar, Algiers 16309, Algeria
2
Department of Information Technology, College of Computer and Information Sciences, Princess Nourah Bint Abdulrahman University, P.O. Box 84428, Riyadh 11671, Saudi Arabia
3
JPMorgan Chase, 1 Chaseside, Bournemouth, London BH7 7DA, UK
*
Authors to whom correspondence should be addressed.
Appl. Sci. 2022, 12(23), 12423; https://doi.org/10.3390/app122312423
Submission received: 21 October 2022 / Revised: 29 November 2022 / Accepted: 2 December 2022 / Published: 5 December 2022
(This article belongs to the Special Issue Data Science, Statistics and Visualization)

Abstract

:
Access to corporate information systems by consumers via the Internet has increased dramatically over the past several decades. In a separate organization, extensive research has been conducted on the free flow of information generated by both external and internal keywords. Research on transparency should aid the audience in making informed decisions. Few have, however, created clear and compelling visual representations of transparency requirements (stakeholders, data, process, policy, and their relationships) utilizing current information visualization and visual analytics methodologies. Maintaining both the quality and visual representation of transparency requirements is a difficult challenge. In this paper, we propose TranspVis, a new visual analytics tool designed for transparency analytics. It consists of multiple views that aid domain experts in efficiently analyzing, updating, and saving application transparency datasets. TranspVis is an interactive tool for displaying TranspLan (i.e., Transparency Language) representations manually generated by experts utilizing the Shield, Infolet, and SitReq forms. In addition to the new circle view, TranspVis generates and synchronizes these latter representations automatically. TranspVis is evaluated using AWS and WhatsApp policy datasets as two case studies. Results show that TranspVis extends the initial TranspLan representation and significantly improves transparency requirement analytics in terms of visual encoding, interactions, and insight extraction.

1. Introduction

Data transparency refers to the capacity to view all network-wide transactions and/or processes within a system in order to facilitate its effective management. Indeed, all transactions and processes within a system must be transparent so that, in the event of misconduct, each action can be traced back to its source and their actors are held accountable. With the passing of the millennium and the emergence of new generations, the importance of data transparency has grown [1]. It is primarily due to the ongoing need for transparency [2], particularly as social media and applications evolve. Furthermore, transparency has received increased attention in the aftermath of the 2008 financial crisis, which was caused by a lack of transparency in financial environments [3], as well as the Ashley Madison scandal, which was caused by unnecessary, unwanted transparency [4].
Eliciting transparency requirements can be challenging for two reasons. The first is determining what information the enterprise should be transparent about, what information should be revealed, and to whom (i.e., stakeholders). For example, not every information request should be answered by publicly posting relevant information, as this can result in both information overload and information leakage, potentially resulting in security breaches. The second issue is that transparency standards change over time. Some information, for example, may be obsolete because stakeholders are already aware of it. For example, a social media platform does not need to explain to users why they must enter their password every time because they already know the reason.
TranspLan [5] is a handcrafted visual language created by transparency experts. It describes the requirements for transparency, including stakeholders, data, processes, policies, and their interrelationships. Furthermore, data science research includes information visualization [6], which can help analyze or observe transparency requirements faster than reading a text using existing visual encoding techniques. Experts can examine and gain insights from texts more efficiently, with fewer catastrophic errors and misunderstandings between stakeholders, by replacing the existing manual system with an interactive one. Within this context, we present in this paper TranspVis (https://youtu.be/8O8BWa0w2so [accessed on 10 November 2022]), a new visual interactive web querying tool that helps domain experts analyze transparency categories (data, process, policy, and stockholders) and application requirements while visually expressing their knowledge. In addition to the visual and interactive encoding of TranspLan views, TranspVis connects to a new structured database validated by transparency experts (Shield, Infolet, and SitReq forms).
The rest of the paper is organized as follows: In Section 2, we first present the state of the art in transparency engineering and visualization. Section 3 follows with a requirements analysis based on feedback from transparency and computer science experts. Section 4 describes the proposed approach to transparency analytics using visualization, as well as the TranspVis tool developed to fulfill the specified requirements. In Section 5, an evaluation of the proposed tool is provided and discussed. Finally, a conclusion summarizes the work and outlines future research plans.

2. Literature Review

To propose a visualization approach to transparency analytics, we should first understand transparency analytics and present existing visualization or visual analytic tools based on Infovis research. Thus, we present the background material about transparency engineering and research work related to transparency visualization in this section.

2.1. Background: Transparency Engineering

The significance of technology’s role in engineering transparency is growing. It is stated that the gradually evolving third generation of transparency policies will be technologically driven and collaborative in nature (Fung [7], Albu and Flyverbom [8]).
Several models are proposed to define the analysis of transparency requirements. In this section, we examine two models in which we are especially interested.
The first model, the Transparency Actors Wheel [9,10], focuses on the flow of information between relevant stakeholders. Identifying stakeholders facilitates the comprehension of where information originates, who provides it, who receives it, and whether specific channels are utilized to transmit information. This model divides the flow of information elements into four components: information provider (IP), information receiver (IR), information entity ((IE), it can be information provider/receiver or another entity, depending on the information flow), and information medium ((IM), it refers to the channel through which information travels).
The second model, known as Transparency Depth Pyramid, focuses on the different levels of transparency, where the transparency requirements can be categorized as follows [11]:
  • Data transparency: A data transparency question (“what, when, where, or who?”) is one that has an answer that contains data, content, or information. For example, in a hosting service platform, data transparency reveals to the client the server performance and price for each plan.
  • Process transparency: A process transparency question (“how?”) is one that has an answer that includes procedures, processes, behaviors, and interactions. For example, how data are encrypted in servers and how servers are immune to cyber attacks in a hosting service platform.
  • Policy transparency: A policy transparency question (“why?”) has an answer that includes goals, intentions, and policies. For example, policy transparency in a hosting service platform reveals why encryption is required in servers or why users have limited storage capacity.
In our work, we focus on TranspLan, which is a prototype system based on transparency models and descriptions proposed by Hosseini et al. [5]. The views of TranspLan and their limitations are presented in the two next sections.

2.1.1. TranspLan Prototype
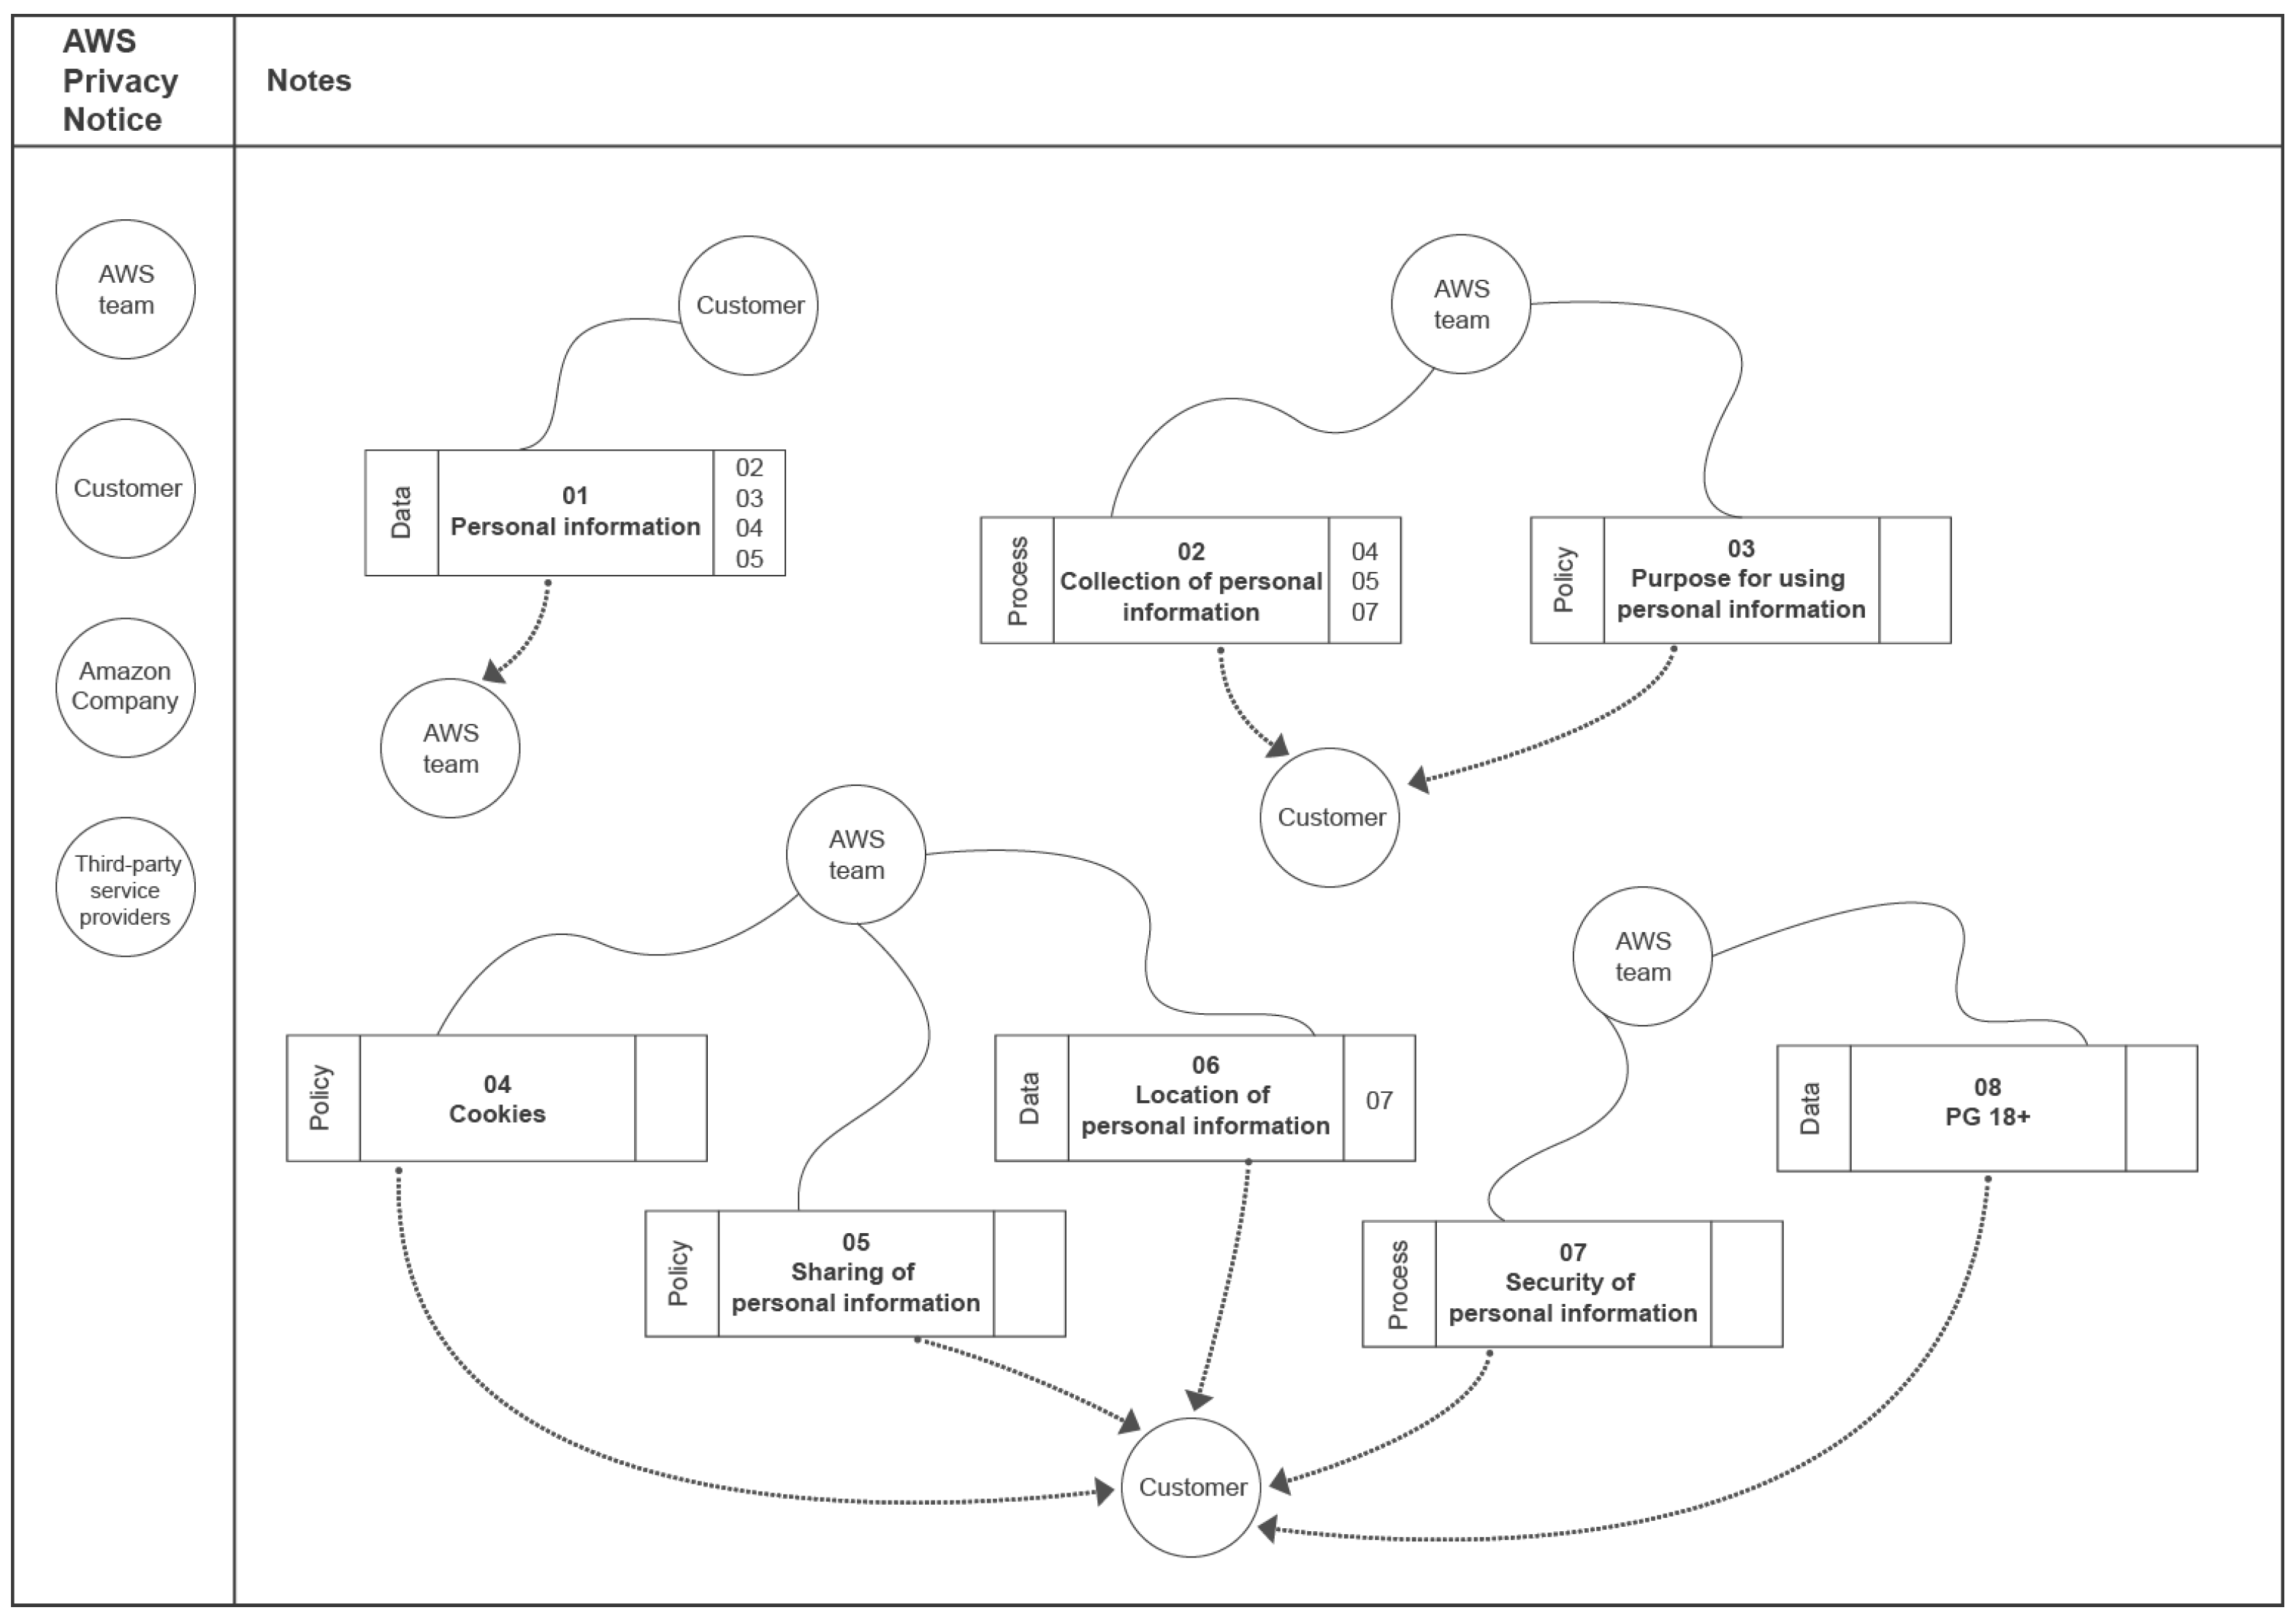
A TranspLan prototype includes the following three main elements:

Shield Diagram

The Shield diagram is the graphical representation of the TranspLan view [5]; it is used to depict TranspLan components and their various interactions. A comprehensive description of this diagram can be found in its original paper [5].

SitReq Specifications

Stakeholders’ Information Transparency Requirements Specification (SitReq) is a specification for each stakeholder in the Shield diagram. It is a descriptive tool for stakeholders, with the Shield diagram representing their transparency requirements. SitReq represents the relationship between stakeholders and specific information elements, as well as the other stakeholders involved in the process and their transparency requirements on those information aspects [5]. In an Amazon Web Service (AWS) application, for example, we can define SitReq for the AWS customer as follows:
  • Stakeholder’s name is “customers”;
  • IE label is “01”;
  • IE name could be “personal information”;
  • The relationship with the personal information is “producer”;
  • The requirement description explains that customers should provide some personal information to use AWS applications“;
  • The transparency requirement type of customer’s personal information could be ”optional“ (i.e., customers can provide or withhold the personal information);
  • Transparency meaningfulness type of customer’s personal information is ”data“;
  • Stakeholders involved with customer’s personal information could be ”AWS team“.

Infolet Specifications

Information Element Transparency Specification (Infolet) is a descriptive tool used in the Shield diagram to deal with information exchange. It provides additional information about each information element in the diagram. Infolet is primarily used to capture the three transparency reference models, as well as the general modeling information required for each information element. Appendix A contains several Infolet of AWS applications as examples.

2.1.2. TranspLan Limitations

We may notice a number of issues and constraints after studying the TranspLan modeling language. In this paper, we are not concerned with the structural components (such as the three reference models or the modeling language itself) but with improving the visualization provided by the Shield diagram. Here are some noteworthy issues:
  • Manual generation: The Shield diagram, Infolet, and SitReq are manually generated by experts, which is time-consuming, difficult, and prone to errors and mismatches.
  • Poor visual encoding: The current Shield diagram employs a visual encoding that includes only circles, lines, and rectangles with information redundancy (e.g., a stakeholder can be represented more than once and elements and relations on the diagram can be overwhelmingly overcrowded).
  • Interactions: Another limitation is the diagram’s lack of interaction. An interactive graphical representation improves comprehension by allowing users to experiment with initial data and apply filters and visual encoding.
  • Difficult for non-experts: Another limitation is that the current Shield diagram is only intended for experts. Non-experts in the transparency requirements domain, on the other hand, may find it difficult to understand the diagram because it employs a high level of visual encoding and technical terms that non-experts are unfamiliar with.
  • Inadequate expression of transparency requirements: TranspLan is a prototype in which we cannot easily find relationship information, hierarchy in stakeholders, and the degree of importance of each transparency element, among others.

2.2. Visualization in Transparency Analytics: Related Work

Because of its importance and benefits, visual analytics [12] are widely used in both theory and practice. Researchers in visual analytics typically concentrate on one of the following transparency requirements: data, process, policy, or relationships. Furthermore, the majority of research is focused on data privacy and cybersecurity visualization. Cybersecurity researchers prioritize network security by identifying potential vulnerabilities and attacks [13,14]. In order to assess the viability of key technologies, Zhang et al. [14] developed a prototype system for large-scale network topology visual analytics. They concentrated on computers and how data are processed, as well as how other users can attack them.
Visual analytics researchers, on the other hand, focus on one of the transparency requirements for social networks on the Internet (Twitter, Facebook, etc.). Wang et al. [15] used GraphProtector, a visual analytics tool, as an example. It is used to protect the privacy of social network users. They created databases containing individuals’ personal information. They used a common network cleansing technique based on the K-anonymity model. GraphProtector is a new system that maintains privacy in network datasets by interactively synthesizing and applying various anonymization models.
Furthermore, DeHart et al. [16] proposed a study of privacy in social media networks such as Facebook and Twitter, as well as the use of machine learning algorithms after collecting data from the users of these social media networks. This study is based on information gathered from social media users who participated in a survey but were not required to answer all questions. There were 250 participants in total, with the majority of them having multiple social media accounts (Facebook, Twitter, Reddit, etc.). They spent 11–20 h per week on these social media networks on average. Each user response containing text was analyzed using text analytical methods, and the responses were divided into three categories: identity, age, and gender.
Chou et al. [17] have contributed to the development of Privacy-Protecting Visualization. Using both data mining and data visualization techniques for representation purposes, they contributed primarily to the supervision of the anonymization procedure in the field of data preservation. The objective of their work is to reduce the likelihood of privacy issues arising from the widespread practice of data collection.
A few policy privacy visualization systems are also proposed. They have poor static interfaces with no interactive elements, making them difficult for both experts and novices to comprehend. Ghazinour et al. [18,19], for example, represent a privacy policy system in which they focused on a model of privacy policy notation in which people serve as the primary representation. Other researchers use UML or similar tools (such as draw.io) to represent policies and privacy [20]. The same issue, however, with poor visualization and a lack of interactions, makes understanding the tool difficult and increases the time required for system analysis and building.
As previously stated, transparency researchers prioritize the analysis of privacy data over the development of visualizations that aid them in understanding and making decisions based on these data. Furthermore, visual analytics only address one of the transparency requirements, such as privacy, security, or stakeholders visualization. To the best of our knowledge, no effort has been made to address the visualization of all requirements. To propose a new visualization, we analyze and describe two Shield diagram representations or prototypes to determine their limitations and how we can improve the current representation.

3. Requirements Analysis

Following interviews with domain experts and computer scientists, a list of requirements is developed. These specifications were presented to the experts and refined based on their feedback, yielding the following list:
  • [R1] Transparency keywords: As previously presented in Transparency Actors Wheel and Transparency Depth Pyramid, experts highlighted four keywords: data, process, policy, and stakeholders. These must be defined and presented in a tool for transparency.
  • [R2] Information flow management: Using the Transparency Actors Wheel or TranspLan prototype, we should be able to specify ways of communicating information between keywords, such as information provider/receiver/none, and so on.
  • [R3] Infolet representation: The proposed tool should enable the creation of a report containing information about keyword data interchange.
  • [R4] SitReq representation: The proposed tool should enable the creation of reports containing information about stakeholders who have used the tool.
  • [R5] Interactions: The proposed tool should be interactive.
In the following, we propose a visualization tool called TranspVis to address these requirements and the aforementioned limitations of the TranspLan prototype.

4. TranspVis: The Proposed Visualization Tool for Transparency Analytics

TranspVis is an interactive visual analytics tool for analyzing keywords and relationships pertaining to transparency. TranspVis components and interactions enable domain experts to (1) express their knowledge using transparency keywords and their relationships [R1, R2]; (2) analyze/create Infolet and SitReq for each transparency keyword [R3, R4]; and (3) enrich the dataset by incorporating external knowledge via interactions [R5]. We develop TranspVis by following the visualization process [21] and the problem design methodology in [22]. In addition, we follow the visual analytics process [12] to validate and enhance the visualization tool with the assistance of industry professionals.

4.1. TranspVis Database

The TranspVis database schema shown in Figure 1 includes various tables. Experts validate the database to ensure that all transparency requirements are met (keywords, relationships, etc.). The database contains two validating examples, namely WhatsApp and Amazon Web Services (AWS) conditions. Using TranspVis (https://transpvis.herokuapp.com/, accessed on on 10 November 2022) or the Django (https://transpvis-back.herokuapp.com/admin, accessed on on 10 November 2022) interface, experts can update the database.
There are three primary tables in the TranspVis database: Application, Stakeholder, and information element (data, policy, and process). First, the Application table describes the privacy of the viewed system, such as AWS. It consists of the identifier, name, description, and transparency note (optional). For example, AWS contains the characteristics id = “A1”, name = “AWS”, and description = “Amazon Web Services...”. Second, the Stakeholder table contains information such as stakeholder’s identifier, name, description, label, and application it is related to. Third, the information element table shares the same attributes as the Stakeholder Element table. Two tables are considered to illustrate the relationships. The table “Information Element Association” describes the relationship between two data elements. It has a unique identifier and a source/target information element. In AWS, for instance, there may be a connection between personal information (information element) and cookies (information element). The “Stakeholders Information Element Relationship” table describes the relationship between stakeholders and information elements. It contains the identifier and type of information/stakeholder element. For example, a customer (stakeholder) can provide (relation type) personal information for this application in AWS (information element).
TranspVis is primarily designed for transparency experts. However, our goal is to provide a tool that is simple to comprehend and use for both experts and non-experts. Finally, it can be used to assist a large number of people in making decisions about the use of applications.

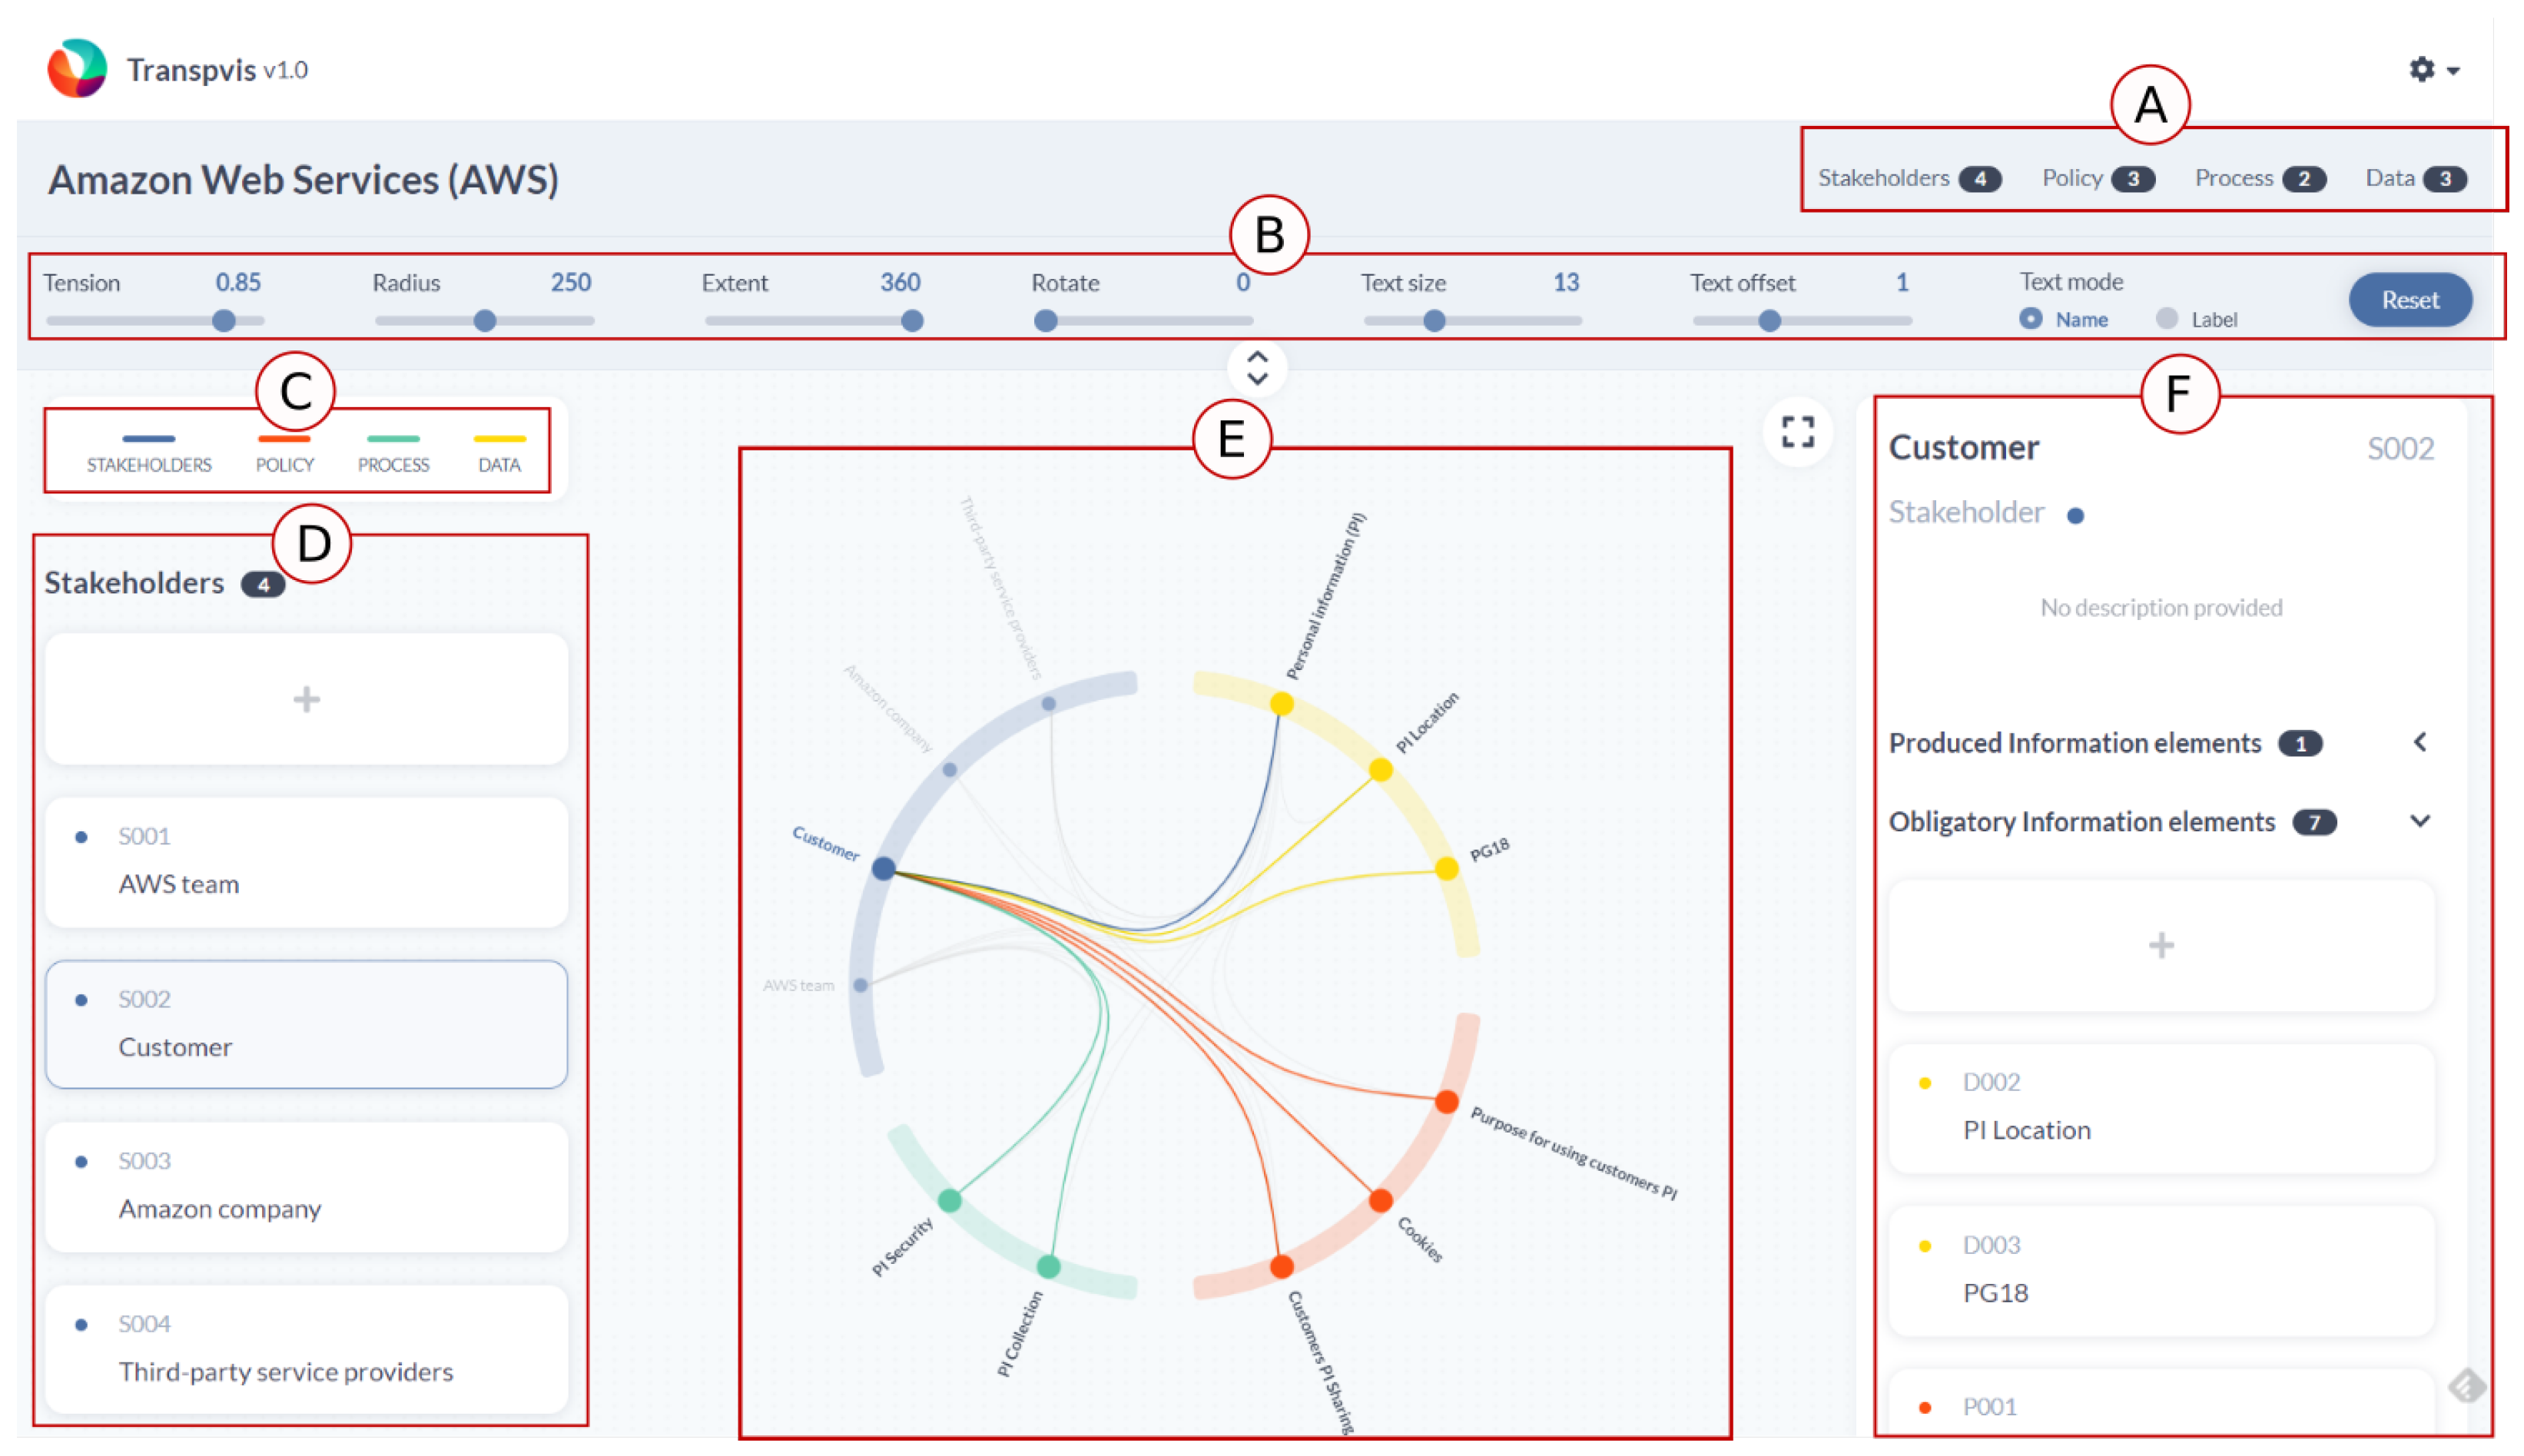
4.2. Visual Structures

TranspVis contains a variety of visual structures and components. Figure 2 depicts these components using data from Amazon Web Services (AWS). As shown in Figure 2A, it illustrates the transparency keywords [R1] in four categories (data, process, policy, and stakeholders). For example, Figure 2 for AWS depicts four stakeholders, three policy items, two process items, and three data items. Each category is encoded with a distinct color (Figure 2C), such as blue for stakeholders, red for policy, green for process, and yellow for data. TranspVis includes three major components. The first is a circle view (Figure 2E) that explains keywords [R1] and relationships [R2] using the AWS example. The second variant (Figure 2D) includes all transparency elements (stakeholders, information, etc.). The third is shown in Figure 2F, which details the SitReq/Infolet information [R3, R4]. Finally, in order to understand TranspVis sections, the three sections are synchronized, in addition to Figure 2B, which shows various interactions employed in the circle view [R5].

4.2.1. Circle View

Since circles can encode a large amount of data, we use them to represent keywords and interactions between them. We use a main circle divided into four parts or arcs, each representing a different keyword category. Each small circle denotes a keyword from a specific category (data, process, policy, and stakeholder). The distance between small circles and divided groups is uniform. Each arc also has its own color. Four colors are used: blue for stakeholders, red for policy, green for process, and yellow for data (see Figure 3).
For each category, we use a specific color from the VIZ PALETTE tools by Elijah Meeks and Susie Lu (https://rb.gy/3wm8vw, accessed on 1 November 2021). We added our color palette to this tool to detect color conflicts, to visualize its use in different visualizations (Silva et al. [23], Gramazio et al. [24], Popleteev et al. [25]), and to ensure color compatibility with our visualization by avoiding color conflicts. Furthermore, we chose contrasting colors to create diversity, analogy colors to create similarity, and a color blinder.
Each keyword can be encoded using either its full text or its ID (recommended by the experts and used in Infolet and SitReq forms). Compared with the display of a full text, the advantage of using IDs is that they have a small text size that occupy a small space. We use colored lines inside a circle to encode keyword relationships. The color at the beginning of the line indicates whether the information was received or provided, as explained further in the interaction section. We assign weights to each IE and stakeholder based on the recommendations of transparency experts. Weights determine the relative importance of each keyword in transparency system category. For instance, in AWS stockholders’ component, customers can be given a larger weight (0.8) than the AWS team members (0.5).

4.2.2. Infolet Form

The Information Element Transparency Specification (Infolet) [R3] is a descriptive form for dealing with information exchange between categories (stakeholders, data, process, and policy). It provides more details about each information element (IE) in three categories (data, process, and policy). We focus on two models (Transparency Actors Wheel and Transparency Depth Pyramid) to create Infolet. However, we do not focus on additional models, such as Transparency Quality/Usefulness.
TranspVis provides a simple Infolet representation of each keyword (or element) in the circle view. When the user selects IE, Figure 2F shows the details of the selected user (as it is explained in Section 2.1.1). For example, Figure 4A represents the details about “Personal information” element. According to this, the user can observe: ID, description, related IE, IE provider (for example, customer), and receiving/requesting/restricted stakeholders. They can also see them directly in circle view, as it is shown in Figure 5.

4.2.3. SitReq Form

Stakeholders’ Information Transparency Requirements Specification (SitReq) is a descriptive form for stakeholders [R4]. SitReq represents the relationship between stakeholders and other categories, as well as their information transparency requirements.
TranspVis includes the SitReq form. Figure 4B shows the stakeholders details in the SitReq form by selecting one of them (for example, Customer) from the circle. The user can observe the ID, name, description, and related keywords and IE of the selected stakeholder (e.g., produced, obligatory, optional, restricted, and/or undecided information elements). As a result, we can see all the details described in Section 2.1.1.

4.3. Interactions

TranspVis allows users (including experts) to interact in a variety of ways [R4]. Users can use the options in Figure 2B to change metrics such as tension, extents, and radius. These interactions allow the user to conduct a more in-depth analysis of the circle dataset. Figure 6 shows the user a full text or just the IDs of keywords used in each category.
Additionally, the edge bundling [26] encoding is implemented in the circle to reduce edge crossing when there is a large number of edges, as shown in Figure 7.
To better analyze keywords, TranspVis gives the user the option of switching between total and sub-circle visual encoding, as shown in Figure 8.
A mouse-over action is also provided by hovering the mouse on one of the keywords (for example, “Amazon web services team”; see Figure 6) in order to analyze each keyword and its associated relationships.
In addition, in the left side form, we can see keywords in each category. This enables users to add and remove keywords. Furthermore, the user can add various types of relationships on the right side. These operations are coordinated with TranspVis components. Additionally, by clicking on the parameters button, users can save a “JSON” file of the TranspVis dataset handling and return to the list of applications. Experts can also create and update new applications on TranspVis. The creation and updating of the application are synchronized with the TranspVis database.

4.4. Technical Considerations

We employ the client–server architecture for the implementation after conducting research on the most applicable architectures. On the server-side (back-end), where data persist and are processed, we use the Django Framework and Django Rest API (https://www.djangoproject.com/ [accessed on 10 November 2022]) to create the REST API that the front-end will consume. The database is based on PostgreSQL (https://www.postgresql.org/ [accessed on 10 November 2022]), and all required and processed data will be consistently stored in it, with the Django Framework handling all transactions and data processing. For the client-side (front-end) portion of our data-driven visual analytics visualization, we selected React Library and D3 (https://d3js.org/ [accessed on 10 November 2022]) as a client-side (front-end) solution that makes the visualization possible for our requirements, enables the implementation of the specification, and enables the addition of new advanced specifications. We use JSON format on the front-end to visualize and manipulate data sent from the database using D3. This will make it simple to implement and maintain the visualization criteria and specifications. The back-end (https://github.com/abdennour001/transpvis-front, accessed on on 10 November 2022) and front-end (https://github.com/abdennour001/transpvisback, accessed on on November 2022) code for TranspVis is accessible on GitHub. Figure 9 summarizes all these technical considerations.

5. Evaluation

We conducted a case study evaluation of TranspVis to demonstrate how the tool assists domain experts in gaining insights from datasets.

5.1. Experiment Data

In this section, we describe how we extract the data required for the representation of the transparency framework (categories, keywords, and their relationships), as well as the source of these data. We focus on the WhatsApp and AWS case studies. We use a transparency framework on WhatsApp and AWS privacy policies to gain a thorough understanding of the framework, and we carry it out using the manual process outlined below.
  • Understand the transparency framework: This is performed by identifying its various components: categories, keywords, their relationships, types of relationships, etc.
  • Define the information source: Next, we identify a source of information that we should focus on in order to obtain the most valuable information for an in-depth study on transparency. This step concludes with the identification of a trustworthy source of information that satisfies our requirements, namely the privacy policies of these two companies, which meet all of our transparency requirements.
  • Understanding the privacy policies: In this step, we investigate the privacy policies of (WhatsApp (https://www.whatsapp.com/legal/updates/privacy-policy/ [accessed on 1 December 2021]) and AWS (https://aws.amazon.com/privacy/ [accessed on 1 December 2021])) using their official privacy policy pages.
  • Transparency framework applications: We extract necessary data and information after understanding the companies’ privacy policies by following a set of steps validated by an expert [5]. The following are the steps to take:
    • Identifying stakeholders;
    • Identifying information element;
    • Generating SitReq specifications;
    • Generating Infolet specifications.
These steps are performed manually and validated by a transparency expert in both the WhatsApp and AWS case studies. The automation of this task necessitates a text mining process using NLP algorithms and would be a very interesting future work for a full automation of the process.

5.2. Case Study

To begin, we use the TranspLan language to modify both WhatsApp and AWS data. Following that, we conduct a case study using the TranspVis tool to compare the initial transparency framework represented in this paper [5] with the final representation of it using TranspVis, with the goal of improving this framework. This comparison is based on the completion of multiple ordered tasks on the two previously mentioned examples (i.e., WhatsApp and AWS).

5.2.1. TranspLan Language

Amazon Web Services Privacy Policy

We conduct a case study on information exchange within AWS in this section. AWS is an Amazon subsidiary that provides on-demand cloud computing platforms and APIs to customers. We use their privacy policy (https://aws.amazon.com/privacy/, [accessed on 1 December 2021), analyze it, and then construct the transparency model by identifying the various stakeholders and information elements with their types (data, process, and policy) and detect potential relationships between them. Finally, we construct the Shield diagram, as well as all of the SitReq and Infolet specifications.

Identifying Stakeholders

The experts manually identify and validate the following stakeholders based on the privacy policy:
  • Customers;
  • AWS team (the AWS service provider);
  • Amazon company;
  • Third-party service providers.

Identifying Information Elements

The following information elements are also identified based on the privacy policy specification:
  • Personal information (PI);
  • PI collection;
  • PI purpose;
  • Cookies;
  • PI sharing;
  • PI location;
  • PI security;
  • PI children.

Shield Diagram/Infolet/SitReq

For the AWS case study, the expert manually generates the Shield diagram specifications (e.g., see Appendix A, Figure A1), Infolet (e.g., see Appendix A, Table A2, Table A3, Table A4 and Table A5), and SitReq (e.g., see Appendix A, Figure A1).

WhatsApp Privacy and Security

We provide numerous examples of Infolet and SitReq for AWS. We go over information extraction in greater details for the WhatsApp privacy policy.

Identifying Stakeholders

Based on the privacy policy, the following stakeholders are identified:
  • Customers;
  • WhatsApp team.

Identifying Information Elements

Based on the privacy policy specification, the following information elements are also defined:
  • The personal messages (customers provide messages as data) (Data IE);
  • WhatsApp end-to-end message encryption system (what kind of security is provided in sending messages with WhatsApp) (Data IE);
  • The procedure of encrypting messages, (how WhatsApp encrypts messages with a lock, and only the recipient of the messages can unlock and read them using a special key, all of this being an automatic process) (Process IE);
  • The purpose of using end-to-end encryption (why WhatsApp uses end-to-end encryption, which is to ensure the security and the integrity of their customers’ communication model) (Policy IE);
  • The payment information provided by the customer (Data IE);
  • The payment information (card and bank numbers) security (how customers’ payment information are stored, which is shown to be stored as encrypted and in a highly secured network) (Process IE);
  • The location of end-to-end encrypted messages (what is the location of the customers’ messages, which is stated to be end-to-end encrypted messages being stored on customers’ device and not on WhatsApp servers after they are delivered) (Data IE).

Shield Diagram

We represent the Shield diagram for the WhatsApp case study in Appendix A Figure A2.

5.2.2. TranspVis Solution

Evaluating Common Criteria 

We evaluate the differences between the initial representation using TranspLan and the final representation using TranspVis based on the evaluation criteria and method described in [27]. These criteria are summarized below:
  • [C1] Visual encoding: We focus on visual structures and how TranspVis helps specialists analyze their datasets. For instance, experts search for keyword repetition, circle size/centralization (when adding multiple new keywords/relationships), readability (text appearance), and the detection of incoming and outgoing relationships.
  • [C2] Interactions: The synchronization of TranspVis could facilitate the analysis of Infolet and SitReq data by professionals.
  • [C3] Insights extraction: We examine whether TranspVis reflects any valuable insights from the dataset represented.

AWS TranspVis Encoding 

In this section, experts compare between the Shield diagram (Figure A1) and TranspVis system (Figure 10) for the AWS case study.
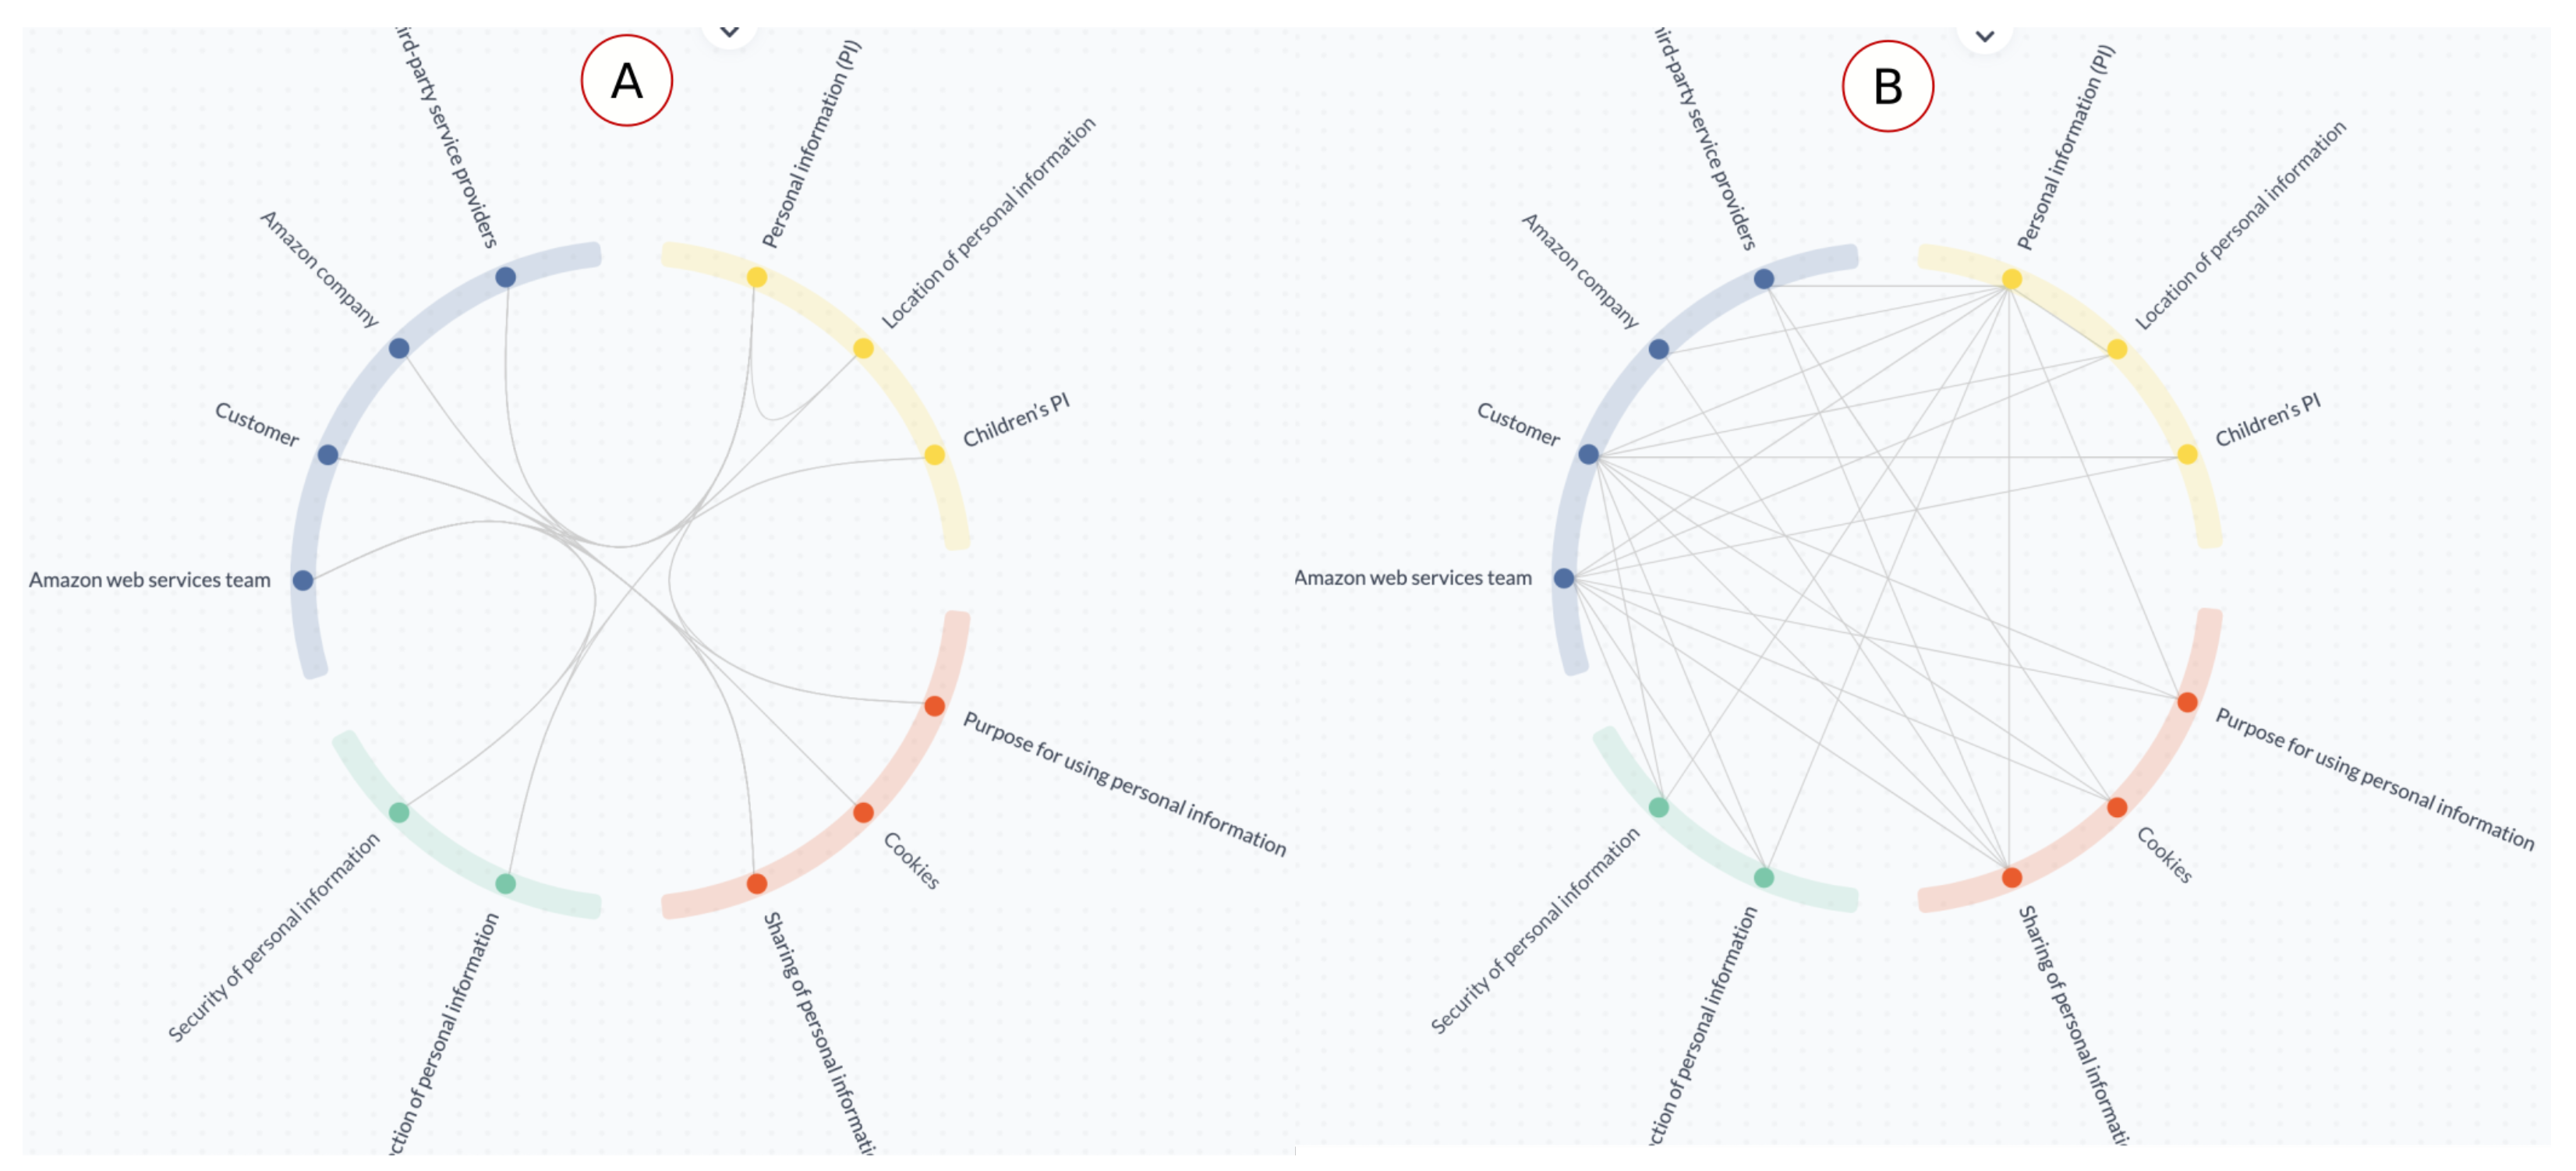
  • [C1] Visual encoding: The Customer stakeholder was repeated twice in the AWS Shield diagram, but in TranspVis, selecting the Customer stakeholder will show both incoming and outgoing relations without the need for repetition. Furthermore, the Shield diagram is larger than the circle in TranspVis. TranspVis centralizes all keywords into a circle and controls the increased number of keywords/relationships in such a way that readability is not affected. Colors can also be used to quickly identify keywords and relationships. TranspVis text is readable, especially with the ability to rotate the circle to focus on specific labels.
    Figure 10a shows, for example, categories colored by unique colors and keywords within each category. We can easily see the four categories and the relationships between them.
  • [C2] Interactions: Removing/adding new keywords in TranspVis is possible with only one click, but in the Shield diagram, to remove the AWS Team stakeholder, you should remove them twice. Furthermore, mouse-over/click actions can assist experts in analyzing incoming and outgoing relationships.
    For example, Figure 10b shows the mouse-over action in “Personal Information (PI)” keyword. Experts can easily identify PI outgoing relationships as “AWS team,” “Amazon company”, “Third-party service provider”, and “PI location”. “Customer”, “PI security”, “PI collection”, “Customers PI sharing”, and “Purpose for using customers PI” are the incoming relations.
  • [C3] Insights extraction: In TranspVis for AWS (as shown in Figure 10b), experts discover that “AWS team”, “Amazon company”, and “Third-party service provider” data are using “Personal Information (PI)” data, which may not be preferred by AWS users. These details were difficult for the expert to detect in the Shield diagram.

WhatsApp TranspVis encoding 

Similar to AWS, experts can also compare between the Shield diagram (Figure A2) and TranspVis system (Figure 11) for the WhatsApp case study.
  • [C1] Visual encoding: In the Shield diagram, the WhatsApp team stakeholder is repeated twice, and the customer stakeholder is repeated three times. All incoming and outgoing relationships in the TranspVis circles are linked to the unique appearance of these two stakeholders in the main circle. Other visual structure notes are the same as AWS visual encoding (see Figure 11).
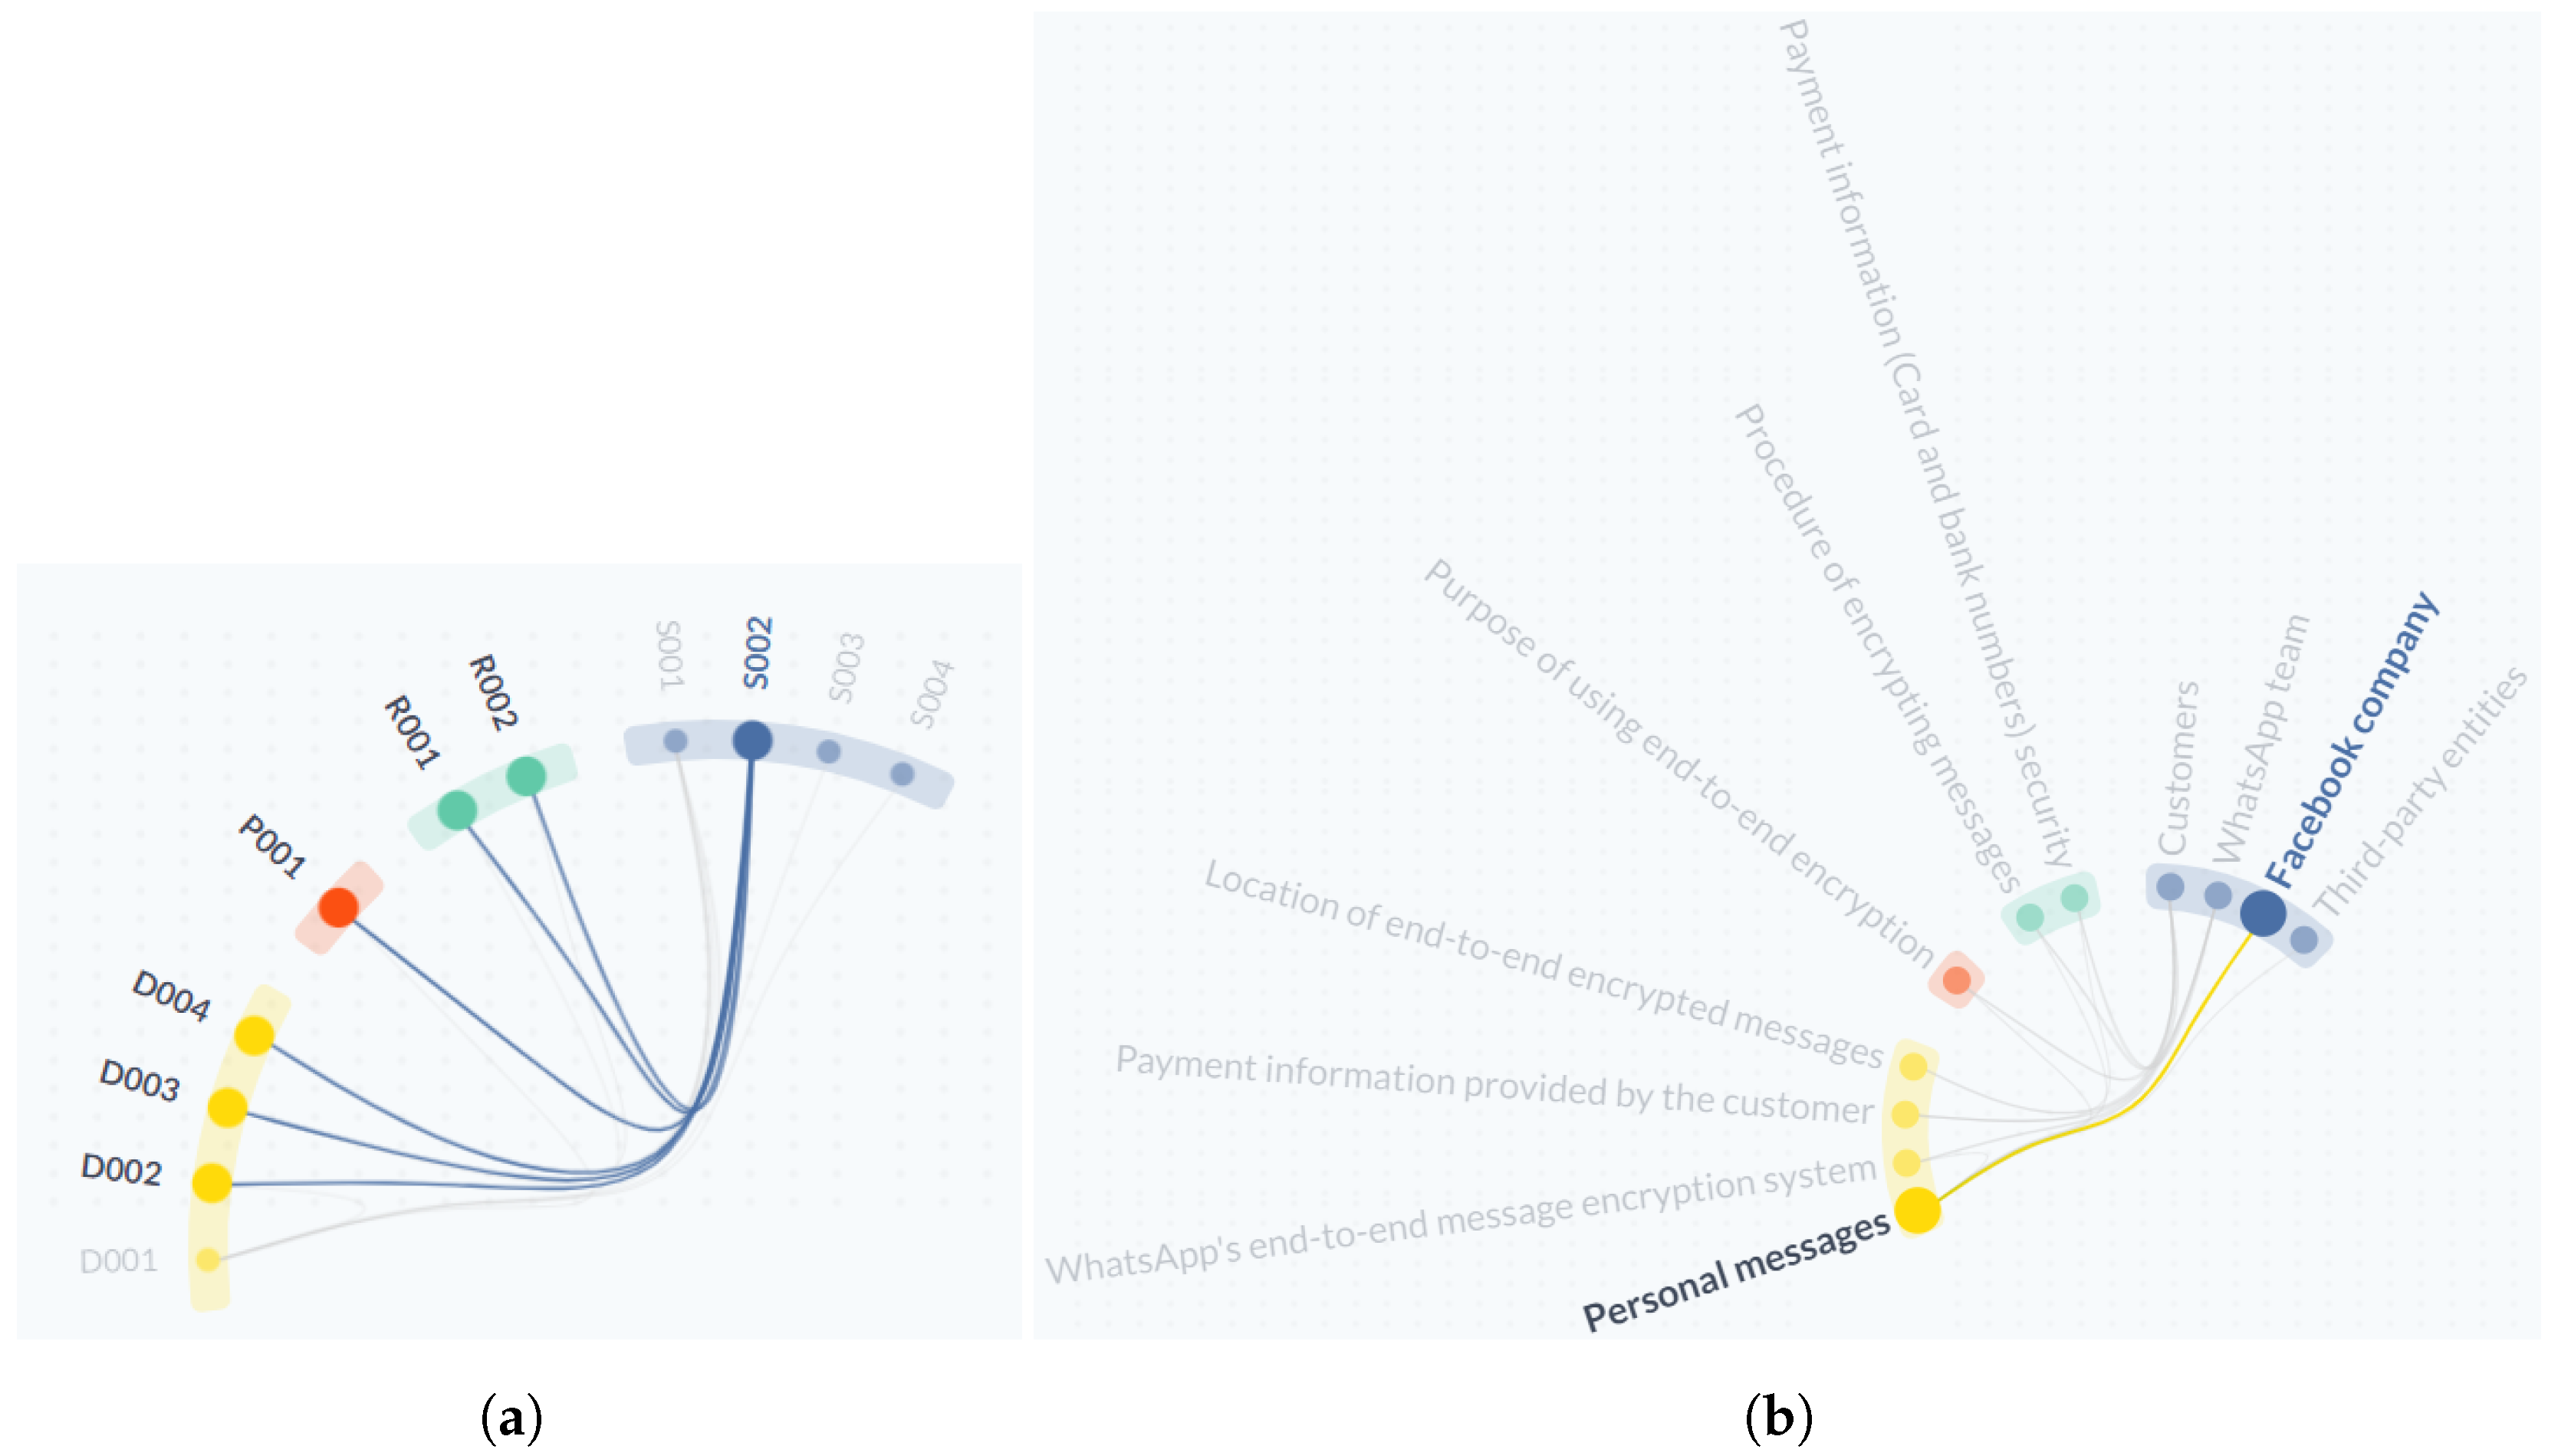
  • [C2] Interactions: “WhatsApp team” (S002) stakeholder is a source for six IEs, but the Shield diagram does not reflect this information easily. For TranspVis, in Figure 12a, it shows this information from a circle view by just selecting the “WhatsApp team” keyword.
  • [C3] Insights extraction: Expert can easily detect serious outgoing and incoming relations and keywords using TranspVis. For example, in Figure 12b, the expert can easily notice that “Facebook company” is a stakeholder in WhatsApp company and that it uses WhatsApp company “Personal messages”.
According to domain experts, TranspVis is an original visualization tool for business information system transparency requirement. It captures the essential elements of such requirements, such as stakeholders and data types for transparency. The simple yet potent visualization enables a comprehensive analysis of transparency stakeholders and their relationships to data elements. It permits a concise and exhaustive explanation of these transparency requirements. The tool also utilizes a variety of customization options to meet the visual requirements of its users.

6. Conclusions and Future Work

In this paper, we proposed TranspVis, a new visual tool. It combines several views, including “circle”, “Infolet”, and “SitReq”. It helps experts to represent transparency keywords and requirements, along with interactions that help them express their knowledge and update the transparency datasets. TranspVis is regarded by domain experts as an original tool that helps to visualize in a exceptional way business information systems’ transparency requirements. As case studies, TranspVis was evaluated using AWS and WhatsApp privacy datasets. We currently have a back-end or database that is filled or updated manually by experts. To automatically populate the TranspVis database, we intend to use a text mining approach as well as NLP (Natural Language Processing). Furthermore, we aim to use the circle view to add additional views and evaluate them with experts.

Author Contributions

Conceptualization, S.F.; data curation, S.F. and M.H.; methodology, S.M.; software, A.A. and H.B.; supervision, S.M. and M.H.; validation, S.F., M.H. and S.M.; writing—original draft, S.F.; writing—review and editing, S.F., M.H. and S.M. All authors have read and agreed to the published version of the manuscript.

Funding

This work is supported by Princess Nourah Bint Abdulrahman University Researchers Supporting Project number (PNURSP2022R196), Princess Nourah Bint Abdulrahman University, Riyadh, Saudi Arabia.

Institutional Review Board Statement

Not applicable.

Informed Consent Statement

Not applicable.

Data Availability Statement

Not applicable.

Acknowledgments

The authors would like to acknowledge the Princess Nourah Bint Abdulrahman University Researchers Supporting Project number (PNURSP2022R196), Princess Nourah Bint Abdulrahman University, Riyadh, Saudi Arabia.

Conflicts of Interest

The authors declare no conflict of interest.

Appendix A

Figure A1. Shield diagram for AWS terms and conditions.
Applsci 12 12423 g0a1
Table A1. AWS: SitReq specification for customers stakeholder.
Stakeholder’s Information Transparency REQuirements Specification (SitReq)
Stakeholder’s Name: Customer
IE LabelIE NameRelationshipRequirement DescriptionTransparency Requirement TypeTransparency Meaningfulness TypeStakeholders Involved
01Personal informationProducerCustomer should provide some personal information in order to use the AWS servicesOptionalDataAWS team
02PI collectionReceiver AWS team provides some processes about how they collect personal data of users CoerciveProcessAWS team
03PI using purposeReceiverAWS team provides policies and why they are using users personal informationCoercivePolicyAWS team
04CookiesReceiverAWS team provides policies about using users cookies, and how it worksCoercivePolicyAWS team
05PI sharingReceiverAWS team provides policies about why and how they are sharing users personal informationCoercivePolicyAWS team,
Amazon Company, Third-party
service providers
06Location of PIReceiverAWS team must provide data about the location of users personal informationCoerciveDataAWS team
07PI securityReceiverAWS team must provide policies about how they are securing personal informationCoercivePolicyAWS team
08PI childrenReceiverAWS team provides data about children use of the aws servicesCoerciveDataAWS team
Table A2. Infolet for Personal Information.
INFOrmation eLEment Transparency Specification (Infolet)
Information Element (IE) Label
01
Information Element (IE) Name
Personal information
Information Element (IE) Type
Process
Information Element Description
This information element contains the customer’s personal information.
This includes name, email address, physical address, and payment records,
such as credit card and bank account numbers,
as well as other related contact information.
List of Other Information Elements Using This Information Element
(2) PI collection
(3) Purpose for using PI
(5) PI sharing
Information Element Creator/Authority
Customer
Information Element Provider
Customer
List of Stakeholders Receiving Information Element and Information Element Provision Type
N/A
List of Stakeholders Requesting Information Element and Information Element Request Type
N/A
List of Stakeholders with Restricted Access to Information Element and Restriction Type
N/A
Information Element Notes
N/A
Table A3. AWS: Infolet for PI collection.
INFOrmation eLEment Transparency Specification (Infolet)
Information Element (IE) Label
02
Information Element (IE) Name
PI collection
Information Element (IE) Type
Process
Information Element Description
This information element contains how the AWS team collects information about customers,
using the information provided by them, automatic information, or information from public sources.
List of Other Information Elements Using This Information Element
(4) The purpose for using PI
(5) PI sharing
Information Element Creator/Authority
AWS team
Information Element Provider
AWS team
List of Stakeholders Receiving Information Element and Information Element Provision Type
N/A
List of Stakeholders Requesting Information Element and Information Element Request Type
N/A
List of Stakeholders with Restricted Access to Information Element and Restriction Type
N/A
Information Element Notes
N/A
Table A4. AWS: Infolet for PI sharing.
INFOrmation eLEment Transparency Specification (Infolet)
Information Element (IE) Label
05
Information Element (IE) Name
PI sharing
Information Element (IE) Type
Policy
Information Element Description
This information element contains how personal information sharing works, AWS uses other
third-party service providers, but they make sure that personal information is secure and share
only related data.
List of Other Information Elements Using This Information Element
N/A
Information Element Creator/Authority
AWS team
Information Element Provider
AWS team
List of Stakeholders Receiving Information Element and Information Element Provision Type
Customer
List of Stakeholders Requesting Information Element and Information Element Request Type
N/A
List of Stakeholders with Restricted Access to Information Element and Restriction Type
N/A
Information Element Notes
N/A
Table A5. AWS: Infolet for PI children.
INFOrmation eLEment Transparency Specification (Infolet)
Information Element (IE) Label
08
Information Element (IE) Name
PI children
Information Element (IE) Type
Data
Information Element Description
This information element says that AWS offerings are not meant for children. If a customer is under 18,
only with the intervention of a parent or guardian can they use AWS Offers.
List of Other Information Elements Using This Information Element
N/A
Information Element Creator/Authority
AWS team
Information Element Provider
AWS team
List of Stakeholders Receiving Information Element and Information Element Provision Type
Customer
List of Stakeholders Requesting Information Element and Information Element Request Type
N/A
List of Stakeholders with Restricted Access to Information Element and Restriction Type
N/A
Information Element Notes
N/A
Figure A2. Shield diagram for the WhatsApp use case.
Applsci 12 12423 g0a2

References

  1. Hosseini, M.; Shahri, A.; Phalp, K.; Ali, R. A modelling language for transparency requirements in business information systems. In Proceedings of the International Conference on Advanced Information Systems Engineering, Ljubljana, Slovenia, 13–17 June 2016; Springer: Berlin/Heidelberg, Germany, 2016; pp. 239–254. [Google Scholar]
  2. Casey, S. How millennial are you? PM World J. 2015, 4, 239–254. [Google Scholar]
  3. Castells, M. End of Millennium, The Information Age: Economy, Society and Culture; John Wiley & Sons, Ltd.: New York, NY, USA, 1998; Volume 3. [Google Scholar]
  4. Kim, M.; Ly, K.; Soman, D. A Behavioural Lens on Consumer Privacy; Rotman School of Management: Toronto, ON, Canada, 2015; pp. 1–40. [Google Scholar]
  5. Hosseini, M.; Shahri, A.; Phalp, K.; Ali, R. Engineering transparency requirements: A modelling and analysis framework. Inf. Syst. 2018, 74, 3–22. [Google Scholar] [CrossRef]
  6. Fekete, J.; van Wijk, J.J.; Stasko, J.T.; North, C. The Value of Information Visualization. In Information Visualization—Human-Centered Issues and Perspectives; Springer: Berlin/Heidelberg, Germany, 2008; pp. 1–18. [Google Scholar]
  7. Fung, A. Infotopia: Unleashing the democratic power of transparency. Politics Soc. 2013, 41, 183–212. [Google Scholar] [CrossRef]
  8. Albu, O.B.; Flyverbom, M. Organizational transparency: Conceptualizations, conditions, and consequences. Bus. Soc. 2019, 58, 268–297. [Google Scholar] [CrossRef]
  9. Hosseini, M.; Shahri, A.; Phalp, K.T.; Ali, R. Transparency as a requirement. In Proceedings of the Joint Proceedings of REFSQ-2015 Workshops, Research Method Track, and Poster Track colocated with the 21st International Conference on Requirements Engineering: Foundation for Software Quality (REFSQ), Essen, Germany, 23–26 March 2015. [Google Scholar]
  10. Hosseini, M.; Shahri, A.; Phalp, K.; Ali, R. Towards engineering transparency as a requirement in socio-technical systems. In Proceedings of the 2015 IEEE 23rd International Requirements Engineering Conference (RE), Ottawa, ON, Canada, 24–28 August 2015; IEEE: Piscataway, NJ, USA, 2015; pp. 268–273. [Google Scholar]
  11. Bannister, F.; Connolly, R. The trouble with transparency: A critical review of openness in e-government. Policy Internet 2011, 3, 1–30. [Google Scholar] [CrossRef]
  12. Keim, D.; Andrienko, G.; Fekete, J.D.; Görg, C.; Kohlhammer, J.; Melançon, G. Visual analytics: Definition, process, and challenges. In Information Visualization; Springer: Berlin/Heidelberg, Germany, 2008; pp. 154–175. [Google Scholar]
  13. Lavigne, V.; Gouin, D. Visual analytics for cyber security and intelligence. J. Def. Model. Simul. 2014, 11, 175–199. [Google Scholar] [CrossRef]
  14. Zhang, Y.; Zhang, J.; Zhang, B. Visual analysis of cybersecurity situational awareness. In Proceedings of the 2019 IEEE 10th International Conference on Software Engineering and Service Science (ICSESS), Beijing, China, 18–20 October 2019; IEEE: Piscataway, NJ, USA, 2019; pp. 685–688. [Google Scholar]
  15. Wang, X.; Chen, W.; Chou, J.; Bryan, C.; Guan, H.; Chen, W.; Pan, R.; Ma, K. GraphProtector: A Visual Interface for Employing and Assessing Multiple Privacy Preserving Graph Algorithms. IEEE Trans. Vis. Comput. Graph. 2019, 25, 193–203. [Google Scholar] [CrossRef] [PubMed]
  16. DeHart, J.; Stell, M.; Grant, C. Social Media and the Scourge of Visual Privacy. Information 2020, 11, 57. [Google Scholar] [CrossRef] [Green Version]
  17. Chou, J.K.; Wang, Y.; Ma, K.L. Privacy preserving visualization: A study on event sequence data. In Proceedings of the Computer Graphics Forum; Wiley Online Library: Hoboken, NJ, USA, 2019; Volume 38, pp. 340–355. [Google Scholar]
  18. Ghazinour, K.; Majedi, M.; Barker, K. A model for privacy policy visualization. In Proceedings of the 2009 33rd Annual IEEE International Computer Software and Applications Conference, Seattle, WA, USA, 20–24 July 2009; IEEE: Piscataway, NJ, USA, 2009; Volume 2, pp. 335–340. [Google Scholar]
  19. Ghazinour, K.; Albalawi, T. A usability study on the privacy policy visualization model. In Proceedings of the 2016 IEEE 14th International Conference on Dependable, Autonomic and Secure Computing, 14th International Conference on Pervasive Intelligence and Computing, 2nd International Conference on Big Data Intelligence and Computing and Cyber Science and Technology Congress (DASC/PiCom/DataCom/CyberSciTech), Auckland, New Zealand, 8–12 August 2016; IEEE: Piscataway, NJ, USA, 2016; pp. 578–585. [Google Scholar]
  20. Jutla, D.N.; Bodorik, P.; Ali, S. Engineering privacy for big data apps with the unified modeling language. In Proceedings of the 2013 IEEE International Congress on Big Data, Silicon Valley, CA, USA, 6–9 October 2013; IEEE: Piscataway, NJ, USA, 2013; pp. 38–45. [Google Scholar]
  21. Cook, K.A.; Thomas, J.J. Illuminating the Path: The Research and Development Agenda for Visual Analytics; IEEE Computer Society Press: Piscataway, NJ, USA, 2005. [Google Scholar]
  22. Sedlmair, M.; Meyer, M.; Munzner, T. Design study methodology: Reflections from the trenches and the stacks. IEEE Trans. Vis. Comput. Graph. 2012, 18, 2431–2440. [Google Scholar] [CrossRef] [PubMed] [Green Version]
  23. Silva, S.; Santos, B.S.; Madeira, J. Using color in visualization: A survey. Comput. Graph. 2011, 35, 320–333. [Google Scholar] [CrossRef]
  24. Gramazio, C.C.; Laidlaw, D.H.; Schloss, K.B. Colorgorical: Creating discriminable and preferable color palettes for information visualization. IEEE Trans. Vis. Comput. Graph. 2016, 23, 521–530. [Google Scholar] [CrossRef] [PubMed]
  25. Popleteev, A.; Louveton, N.; McCall, R. Colorizer: Smart glasses aid for the colorblind. In Proceedings of the 2015 Workshop on Wearable Systems and Applications, Florence, Italy, 18 May 2015; pp. 7–8. [Google Scholar]
  26. Zhou, H.; Xu, P.; Yuan, X.; Qu, H. Edge bundling in information visualization. Tsinghua Sci. Technol. 2013, 18, 145–156. [Google Scholar] [CrossRef]
  27. Munzner, T. A nested model for visualization design and validation. IEEE Trans. Vis. Comput. Graph. 2009, 15, 921–928. [Google Scholar] [CrossRef] [PubMed]
Figure 1. TranspVis database structure.
Applsci 12 12423 g001
Figure 2. TranspVis: Amazon Web Services (AWS) condition: (A) overview information of AWS transparency components, (B) control tools, (C) color encoding of transparency components, (D) detailed information in each transparency component, (E) circle view of transparency requirements, (F) Infolet/SitReq forms.
Applsci 12 12423 g002
Figure 3. AWS keywords’ visual encoding using a circle.
Applsci 12 12423 g003
Figure 4. (A): AWS Infolet related to the keyword “Personal information”, (B): AWS SitReq related to customers.
Applsci 12 12423 g004
Figure 5. AWS Infolet circle related to the keyword “Personal information”.
Applsci 12 12423 g005
Figure 6. Full text representation (A) and ID representation (B).
Applsci 12 12423 g006
Figure 7. Using edge bundling technique (A) to reduce edge crossing (B).
Applsci 12 12423 g007
Figure 8. Sub-circle (A) from total circle (B) visual encoding.
Applsci 12 12423 g008
Figure 9. Technical architecture of the solution.
Applsci 12 12423 g009
Figure 10. TranspVis: (a) Circle view of AWS keywords and (b) mouse-over action of “Personal Information” in AWS keywords.
Applsci 12 12423 g010
Figure 11. TranspVis: Circle view of WhatsApp keywords.
Applsci 12 12423 g011
Figure 12. TranspVis: (a) Selecting “WhatsApp team” keyword and (b) mouse-over action of “Personal messages” in WhatsApp keywords.
Applsci 12 12423 g012
Publisher’s Note: MDPI stays neutral with regard to jurisdictional claims in published maps and institutional affiliations.

