Abstract
With the wide spread of massive open online courses ( MOOC ), millions of people have enrolled in many courses, but the dropout rate of most courses is more than 90%. Accurately predicting the dropout rate of MOOC is of great significance to prevent learners’ dropout behavior and reduce the dropout rate of students. Using the PH278x curriculum data on the Harvard X platform in spring 2013, and based on the statistical analysis of the factors that may affect learners’ final completion of the curriculum from two aspects: learners’ own characteristics and learners’ learning behavior, we established the MOOC dropout rate prediction models based on logical regression, K nearest neighbor and random forest, respectively. Experiments with five evaluation metrics (accuracy, precision, recall, F1 and AUC) show that the prediction model based on random forest has the highest accuracy, precision, F1 and AUC, which are 91.726%, 93.0923%, 95.4145%, 0.925341, respectively, its performance is better than that of the prediction model based on logical regression and that of the model based on K-nearest neighbor, whose values of these metrics are 91.395%, 92.8674%, 95.2337%, 0.912316 and 91.726%, 93.0923%, 95.4145% and 0.925341, respectively. As for recall metrics, the value of random forest is higher than that of KNN, but slightly lower than that of logistic regression, which are 0.992476, 0.977239 and 0.978555, respectively. Then, we conclude that random forests perform best in predicting the dropout rate of MOOC learners. This study can help education staff to know the trend of learners’ dropout behavior in advance, so as to put some measures to reduce the dropout rate before it occurs, thus improving the completion rate of the curriculum.
1. Introduction
In recent years, massive open online courses (MOOCS) have received widespread attention. Because of their numerous resources and the excellent resources from many famous universities and the appearance of platforms such as edX, Coursera and Udacity, MOOCS have become more and more popular all over the world. However, due to the lower binding force of MOOC compared with the traditional classroom, many students have abandoned their learning courses due to some internal or external factors, resulting in a waste of educational resources. In order to reduce the occurrence of this phenomenon, researchers have focused on the research of MOOC learners’ dropout behavior prediction, expecting to accurately find out the learners with dropout risk, and take intervention measures in advance to enable them to persist in learning, so as to improve the completion rate of the course [1]. Therefore, predicting MOOC learners’ dropout tendency based on learning behavior has become a hot topic in MOOC big data analytics [2] and educational data mining research [3] field nowadays.
MOOCs dropout prediction aims to find out the possibility of quitting the course at a certain time in the future based on learners’ current learning behavior records [4]. Many scholars have been studying the problem of MOOCs learners dropping out of school. Some researchers used traditional classification methods such as logical regression LR [5,6,7], KNN [6], SVM [7,8,9] to establish prediction models. Lu Xiaohang et al. extracted 19 features from three perspectives of click stream, homework test and forum behavior on the basis of courses data, regarded the whole learning cycle of learners as a time series, built a sliding window model combined with machine learning algorithm to dynamically predict the dropout rate of learners [8]. Kloft et al. extracted 19 student behavior characteristics which could be represented as single real numbers from click stream data, comprehensively ran logical regression and linear SVM methods to predict students’ dropout behavior in the coming weeks, and concluded that adding forum data to the prediction in the previous weeks can effectively improve the prediction accuracy [7]. Liang et al. used three classification features, namely, enrollment feature (Features characterizing learner’s behavior in particular course), user feature (Features characterizing learner’s behavior in platform) and course feature (Features characterizing course profile), to build Gradient Boosting Decision Tree model to predict the probability of students dropping out of school in the next 10 days [9]. Other researchers used neural network methods such as CNN [3,10,11] and LSTM [11,12] to predict dropout behavior. Literature [10] designed a simple feature matrix based on time series, combining time information with students’ behavior characteristics, and using convolutional neural network model to predict dropout. The proposed CNN model considers the local correlation of learning behaviors and improves the dropout prediction accuracy. Literature [12] regarded dropout as a time series prediction problem, constructed a time series of student behavior based on student click streams and forum data, and used LSTM to predict whether students would drop out of school. LSTM network outperforms other models in terms of AUC score. Literature [11] comprehensively considered the advantages of CNN and LSTM, proposed a hybrid network structure CLMS Net composed of CNN, LSTM and SVM. The proposed model can automatically extract features from student behavior data, and enhance the performance of dropout prediction.Although the above methods can obtain a good prediction effect, they have not analyzed the factors that affect MOOC learners’ dropout behavior from a statistical perspective. Wang Mengmeng et al. [13] analyzed the factors affecting MOOC learners’ turnover from three aspects: learners’ own factors, curriculum related factors and technical factors, and proposed specific strategies to stimulate and maintain MOOC learners’ learning motivation combining with the ten principles of online learning motivation and stimulation proposed by relevant scholars [14]. Yang et al. [15] explored the impact of forum posting and social network behavior on school dropout from the perspective of social network analysis. The above work focused on the theoretical analysis of the influencing factors of MOOC dropout, but lacked quantitative analysis of each factor. In general, although there are many studies on the dropout rate, there is no standardized research method recognized by the academic community, and most of the studies are still in the process of exploration [5].
In this research, we select the 2013 Spring curriculum data on the HarvardX platform, use statistical methods to conduct quantitative analysis on the factors that may affect MOOC learners’ dropout behavior, and make feature selection based on the statistical analysis results. Then, we establish prediction models for MOOC learners’ dropout behavior using three traditional prediction models in machine learning: logical regression, K-nearest neighbor algorithm and random forest algorithm(a decision tree model based on bagging framework). The model with high prediction performance is selected through experimental comparison to predict the dropout behavior. This research can enable the teaching staff and managers to discover the learners’ dropout behavior tendency in advance and make appropriate intervention as soon as possible, and make learners better adapt to the learning process, thereby reducing the dropout rate, improving the quality of teaching, and achieving better teaching results [16].
The main contributions of this study are: (1) dividing the factors that affect learners’ dropout behavior into two categories: learners’ own characteristics and learners’ learning behaviors for statistical analysis; (2) conducting feature selection based on statistical analysis of factors affecting dropout behavior; (3) establishing learner dropout behavior models using logistic regression, random forest and K-nearest neighbor models, respectively; (4) carrying out extensive experiments on the data set of the Harvard X platform, train and test the three prediction models, and drawing the conclusion that the random forest prediction effect is better than the other two models.
The remainder of this paper is organized as follows: The second section introduces the dataset and methodology. The third section presents the results of the study. The fourth part fulfills the discussion, followed by the conclusion in the last section.
2. Method
2.1. Method Description
This paper uses the curriculum data on the HarvardX platform, select gender, age, source country, academic qualification, active times, the video played time, cumulative course days, the number of forum posts from the two aspects of learners’ own characteristics and learning behavior, to conduct statistical analysis on the factors that affect learners’ final completion of the curriculum. Randomly select 75% of the data set as the training sample, and the remaining 25% as the test set. Based on the results of the above statistical analysis, Viewed, Exploded, Final_ cc_cname_DI, LoE_ DI, gender, age, events, ndays_ act, nplay_ video, chapters, nforum_Posts, duration were used as independent variables, and drop_out was used as the dependent variable to predict the dropout rate. L1 regularization is used for parameter selection, and logical regression, K-nearest neighbor algorithm and random forest model, which are more traditional prediction models in machine learning, are fitted to establish prediction model for MOOC dropout rate. The models are trained and predicted. Accuracy, precision, recall, F1 and AUC are utilized as evaluation metrics to compare the performance of the three prediction models. Then, we can choose the better one to analyze and predict MOOC learners’ dropout behavior. The framework of proposed dropout prediction method is shown in Figure 1.
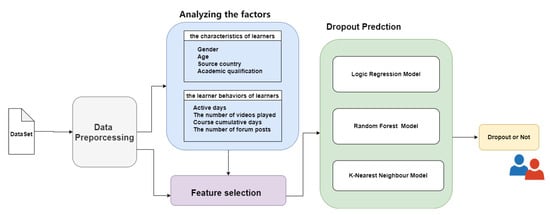
Figure 1.
The framework of proposed dropout prediction method.
2.2. Dataset
2.2.1. Data Description
May 2014, Harvard University and Massachusetts Institute of Technology jointly released the sorted open data of 16 courses on the edX platform for the 2012–2013 academic year for global researchers [17]. This is also the first large-scale MOOC open data, providing data support for researchers to deeply analyze and study MOOC learners and courses [18]. Here we used a more cleaner and concise version of this edX dataset from Kaggle for our experiments [19]. There are 416,921 rows 21 columns of original data in this Kaggle dataset including the basic information and learning behavior of learners from 2012 to 2013 on HarvardX and MitX platforms. It includes 21 columns, including course name, semester, number of students, number of videos watched, number of forum posts, etc. (see Table 1 for details). This research selects the 2013 spring course PH278x on the HarvardX platform randomly. The total number of students in this course is 25,269.

Table 1.
Columns in the dataset.
2.2.2. Data Preprocessing
Quick glancing at the whole data set, we can see that there are 1100 missing values in the gender column. Considering that the data set has 25,269 rows in total, the number of rows with missing values is relatively smal (4.35%, less than 10%), and the missing values are completely independent of other data, namely the missing value is of type Missing Completely At Random (MCAR), then we delete these rows directly [20,21,22]. last_event_DI minus start_time_DI to obtain the value of the duration column. Encode the semester and gender variables with one-pot method, delete the ID type data such as userid_ID, perform z-score normalization for the numerical variables. Check the distribution of variables, there is no significant outliers. After all of these operations, there are 241,6921,992 lines of data remained. The descriptive statistics about the numerical attributes of the model is as Table 2, and the descriptive statistics about the classes of the dependent variable is as Table 3 shown:
Table 2.
The descriptive statistics about the attributes of the model.
Table 3.
The descriptive statistics about the classes of the dependent variable.
2.3. Prediction Models
In this paper, we use the following three models to predict the dropout rate: logistic regression, random forest and k-nearest neighbor. The following are their descriptions, respectively.
2.3.1. Logistic Regression
Logistic regression model is a kind of generalized linear model, which is basically the same form as the multiple linear regression analysis model, and both of them have . Logistic regression uses sigmoid function to convert the predicted value generated by linear regression model into [0,1] interval value [23]. Binary logistic regression model is a classification model, and its distribution is as follows:
where , w and b are weights and offset values. Given an input vector x, you can find the value of and the value of . By comparing the size of the two values, you can divide x into the category with larger value.
The process of MOOC learners’ dropout behavior prediction based on logistic regression model is as follows: the first step is to define the range of logistic regression superparameters, the second step is to create a new logistic regression object, the third step is to set AUC score as the model measurement standard, the fourth step is to cross verify the grid search to select the optimal superparameters, the fifth step is to use the optimal superparameters to fit the model on the training set, and the sixth step is to use the fitted model to predict on the test set. Figure 2 is the flow chart of MOOC learners’ dropout behavior prediction based on logistic regression model.
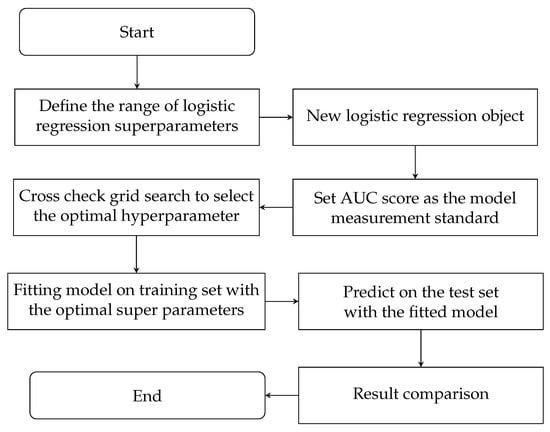
Figure 2.
Logistic Regression model prediction flowchart.
2.3.2. K Nearest Neighbor
KNN is one of the most commonly used classification algorithms. The idea of the algorithm is as follows: if most of the k most similar (k nearest neighbors) samples in the feature space belong to a certain category, the sample is classified into that category. KNN classification algorithm includes training set and test set. When new test data comes, the classification results can be predicted according to the training dataset [24]. The training and prediction process of MOOC learner dropout behavior prediction model based on K-nearest neighbor is as follows: the first step is to define the k-nearest neighbor superparametric range; the second step is to create a new k-nearest neighbor object, and the third step is to set AUC score as the model metric; the fourth step is to cross verify the grid search and select the optimal super parameters; the fifth step is to fit the model on the training set with the optimal super parameters; step 6 use the fitted model to predict on the test set. Figure 3 is the flow chart of MOOC learners’ dropout behavior prediction based on K-nearest neighbor:
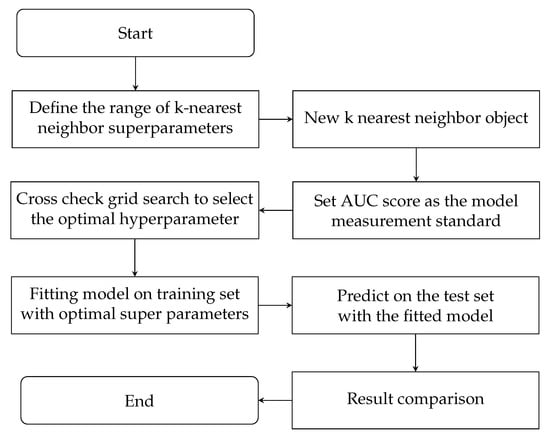
Figure 3.
Prediction flow chart based on K-nearest neighbor model.
2.3.3. Random Forest
Random forest is a combined classification model composed of many decision tree classification models. It can ensemble a variety of decision rules to learn from data sets. Each decision tree classification model has voting rights to obtain the optimal classification results. This algorithm is widely used in multidimensional data and has good performance [25].
The randomness of random forest is reflected in the random selection of data sets and the random selection of features to be selected. Random selection of data sets refers to taking samples with return from the original data set to construct a sub data set, and the data volume of the sub data set is the same as that of the original data set. Elements in different sub datasets can be repeated, and elements in the same sub dataset can also be repeated. Similar to the random selection of data sets, each splitting process of the subtree in the random forest is to randomly select some features from all features, and then select the optimal feature from these randomly selected ones.
The construction process of random forest algorithm is as follows: (1) Use bootstrap method to select n samples from the original training set by sampling with replacement, take N times in total, and generate N training sets.; (2) Select features and train the decision tree model for N training sets, respectively.; (3) For a single decision tree model, suppose the sample set contain M feature attributes, randomly select m attributes from M attributes as a subset (m < M), and select the optimal features from the subset with minimum Gini index to split.; (4) Repeat the above steps, establish multiple decision trees to form a random forest, use N decision trees for classification prediction, and follow the voting mechanism to determine the prediction result of dropout rate. The key of decision tree learning is how to choose the best feature to split. This work uses “Gini index” as the index of decision tree to choose the best feature.
Gini index is calculated as:
The importance of feature in node m, that is, the change of index before and after node m branching is,
where, represents the fractional statistics of the variable , represent the indexes of the two new nodes after branching, respectively.
If the node of the feature in the decision tree is in the set M, the importance of the feature in the tree i is
Assuming that there are n trees in RF, the importance of features in RF is defined as
2.4. Evaluation Metrics
The accuracy, precision, recall, F1, Area Under roc Curve (AUC) are used to evaluate the benefits and drawbacks of the model. The definitions are as follows:
Accuracy is the most commonly used evaluation index, where TP (True Positive) is the number of positive samples predicted as positive classes by the model, TN (True Negative) is the number of negative samples predicted as negative classes by the model. P + N is the number of all samples.
where FP (False Positive) stands for negative samples predicted as positive by the model.
where FN (False Negative) is the number of negative samples predicted as positive by the model.
The F1 score indicator combines the results of the outputs of precision and recall. The value range of F1 score is from 0 to 1. 1 represents the best output of the model, and 0 represents the worst output of the model.
The result of AUC shows how many pairs of positive samples scored higher than negative samples. Classify the set of samples with known positive and negative values, and sort them from high to low probability. refers to the sorting of the ith positive sample. represents positive and negative sample pairs, in which M refers to the number of positive samples and N is the number of negative samples.
3. Result
3.1. Analysis on the Factors of MOOC Learners’ Dropout Behavior
In this work, we define a learner with dropout behavior if he has a zero grade value. Add a dropout column in the dataset according to the grade column. If the grade column has a zero value, then the dropout is labeled “0”, otherwise it is labeled “1”. This paper analyzes the dropout behavior from two aspects: the characteristics of learners and their different learning behaviors. (1) From the characteristics of learners, including gender, age, different countries and regions, and educational background. (2) From the different learning behaviors of learners, including active times, video playing time, cumulative days of courses, and number of forum posts.
3.1.1. Analysis from the Characteristics of Learners
- (1)
- Relationship between dropout and gender
Gender differences may lead to different energies and interests between male and female. In order to explore the impact of gender on learners’ dropout behavior, this paper compares the number of boys’ dropout with that of girls. The analysis results are shown in Table 4. It can be seen that the dropout rate of male students is 88%, slightly higher than that of female students, which is 87.2%. There is not much difference between these two, so gender factors have little impact on the drop out rate.
Table 4.
Number and proportion of dropouts by gender.
- (2)
- Relationship between dropout and age
Age differences will lead to differences in learners’ energy, interest, time investment, and even academic qualifications. Therefore, this paper analyzes dropout behavior from the perspective of age. In order to explore the influence of age on learners’ dropout behavior, this paper compares the number of dropouts at different ages. From the statistical data, the average age of dropout students is 28.404701, and the average age of non dropout students is 28.537043. The average age of both is 28 years old, and the age distribution of students who drop out of school and students who do not drop out is basically the same.; It is also obvious from the box diagram (Figure 4) and the violin diagram (Figure 5) that there is not much difference between the two. Therefore, age has little effect on dropout behavior.
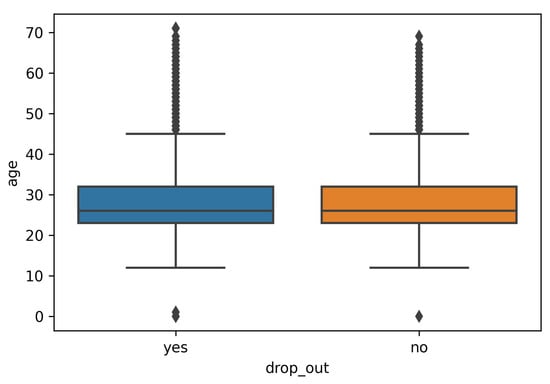
Figure 4.
Box plot of dropout and age statistics.
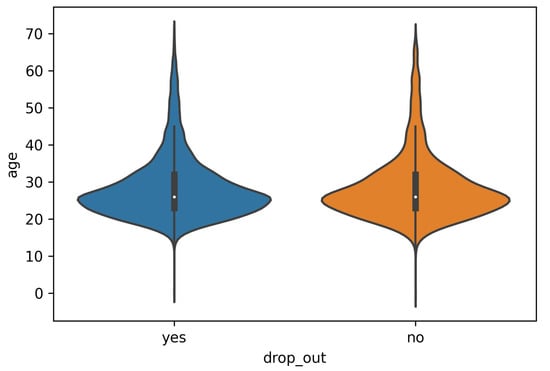
Figure 5.
Violin plot of dropout and age statistics.
- (3)
- Comparison of student dropout in different countries
Different countries and regions where learners live, different national conditions and different learning requirements in MOOC may lead to different academic pressure and interests of learners. Therefore, this paper chooses to analyze the impact of national factors on dropout behavior. In order to explore the impact of different countries and regions on learners’ dropout behavior, this paper compares the number of dropouts in various countries and regions. From the following statistics of the number of students in Figure 6, the United States and India have the largest number of students in PH278X; judging from the dropout rate of this course, which is shown in Table 5, China has the highest dropout rate.
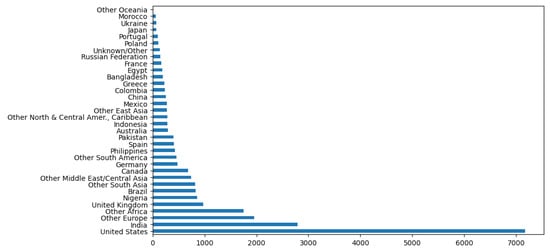
Figure 6.
Comparison of the number of total students in different countries.
Table 5.
Dropout rates of students in different countries.
- (4)
- Comparison of dropouts among students with different academic qualifications
Different levels of knowledge will lead to different learning speeds and interests. In addition, too slow learning speed is likely to lead to dropout behavior [26,27]. Therefore, this paper discusses the influence of academic factors on dropout behavior. Table 6 and Figure 7 show the statistical results of the dropout rate of students with different academic qualifications. According to the statistical results, the dropout rate of students with different academic qualifications are both more than 80%. The dropout rate of students with doctorate degree is the lowest, which is 84.6%. The dropout rate of students with secondary degree is the highest, which is 88%. The gap is not obvious. Therefore, the educational background has a limited influence on dropout behavior.
Table 6.
Dropout rate among students with different academic qualifications.
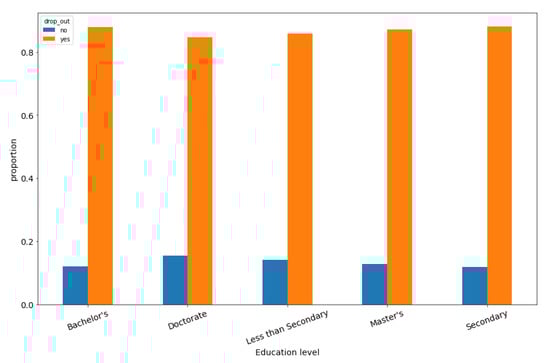
Figure 7.
Dropout rate among students with different academic qualifications.
3.1.2. Analysis from the Learners’ Learning Behavior
- (1)
- Relationship between dropout and active times
We analyze the active times of learners in a period of time (40 days). In terms of the average active times of dropout students and students who normally complete their studies, the average active times of students who normally complete their studies in 40 days is 10.444 days, while the average active times of dropout students is 2.469 days, as shown in Figure 8. The results show that the active times of students is an important factor affecting dropout, and students who are inactive for a long time are likely to drop out.
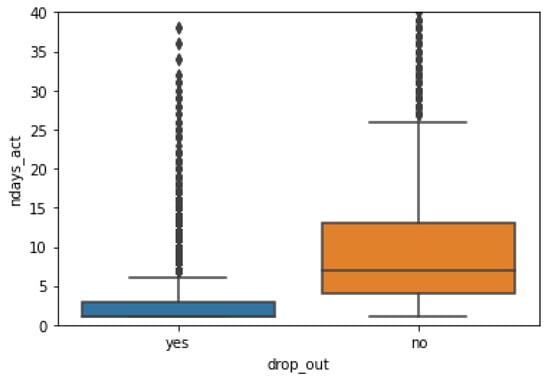
Figure 8.
Average active days of dropout students and non-dropout students.
- (2)
- The relationship between dropout and the number of videos played
Playing video is an important way for learners to acquire knowledge in MOOC. Therefore, this paper counts the number of videos played to analyze its relationship with dropout behavior. The statistical results show that the average number of videos played by students who drop out of school is only 8.105305, while the average number of videos played by students who complete their study is 95.507208. Therefore, generally speaking, students who rarely play videos are more likely to drop out of school. Average number of videos played by dropout students and non-dropout students is shown as Figure 9.
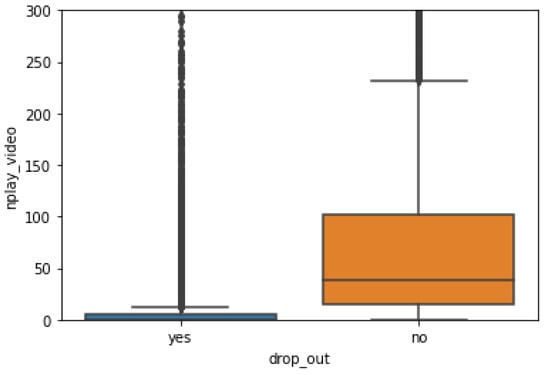
Figure 9.
Average number of videos played by dropout students and non-dropout students.
- (3)
- Course cumulative days and dropout comparison
Course cumulative days refer to the days accumulated from the beginning to the end of the course. After statistical analysis, the average learning days of dropout students are 47.189276 days, and the average learning days of students who have completed the course are 96.334563. It is obvious from Figure 10 that the average learning days of students who complete the course are 2x times more than those of students who dropout the course. From this, we can conclude that the longer students continue to study, the less likely they are to drop out of school.
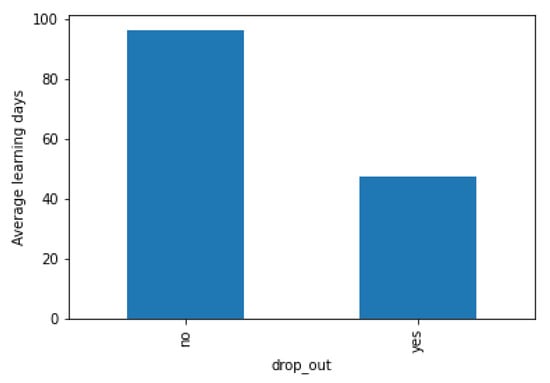
Figure 10.
Comparison of average learning days between dropout students and students who normally complete their studies.
- (4)
- The relationship between droppout and the number of forum posts
In the MOOC learning process, because there is no face-to-face communication, learners have to attend classes alone, and their questions may not be answered. Learners’ loneliness will reduce their learning experience and engagement [28]. Posting on the forum helps to reduce learners’ loneliness [29], so we can start from the number of posting on the forum to analyze the dropout rate. Statistical analysis shows that the average number of Posts posted on the forum by students who normally complete their studies in course PH278X is 0.008716, while the number of students who drop out is 0.001133, indicating that students generally rarely post on the forum, and the proportion of Posts posted by students who dropout the course is less than the average number of students who complete their studies. Because both students who complete their studies and students who drop out seldom post, the number of posts may not effectively predict students’ dropout.
3.2. Prediction Results of MOOC Learners’ Dropout Behavior
3.2.1. Prediction Model Parameter Setting
The optimal parameters adjusted through the five-fold cross-validation are as follows:
For Logical regression model, the optimal parameter C selected based on AUC score is 1.0, the penalty is l2, and the solver is saga. The average auc score corresponding to the model of optimal parameter training is 0.7730286887835808.
For K-nearest neighbor model, the optimal parameter selected based on AUC score: the number of neighbors K is 46, and the average AUC score corresponding to the optimal parameter training model is 0.905862470667496.
For Random forest model, the optimal parameters selected based on the AUC score: classweight is None, max_depth is 11, and ’n_estimators’ is 200. The average test AUC score corresponding to the model trained with the optimal parameters is 0.9247321467242857.
3.2.2. Prediction Results
The comparison data of different models prediction effects is shown in Table 7. The best performance of the experimental results is shown in bold. It can be seen from the table that although the recall rate of MOOC learner dropout behavior prediction model based on random forest is slightly lower than that of LR model, it has the highest accuracy, precision, F1 value and AUC value among the three models, namely accuracy = 0.917260, accuracy = 0.930923, F1 = 0.954145, AUC = 0.925341. Therefore, considering the five performance evaluation metrics: accuracy, precision, recall, F1 and AUC comprehensively, we can conclude that the MOOC learner dropout behavior prediction model based on random forest has better prediction performance than the model based on logical regression and the model based on K-nearest neighbor. That is, random forest has the best performance in predicting the dropout rate of MOOC learners.
Table 7.
Comparison of different models prediction effect.
The ROC curve of model prediction effect comparison is shown in Figure 11. It can be seen from Figure 11 that the ROC curve of random forest surrounds the ROC curve of k nearest neighbor and the ROC curve of logistic regression, and the ROC curve of KNN includes the ROC curve of logistic regression. Therefore, the area under the ROC curve, that is, the AUC score of random forest is greater than that of k nearest neighbor and greater than that of logistic regression, which is consistent with the AUC result calculated above. The higher the AUC score, the better the prediction effect of the model, that is to say, the prediction effect of the random forest model is better than that of the k-nearest neighbor model, and better than that of the logistic regression model.
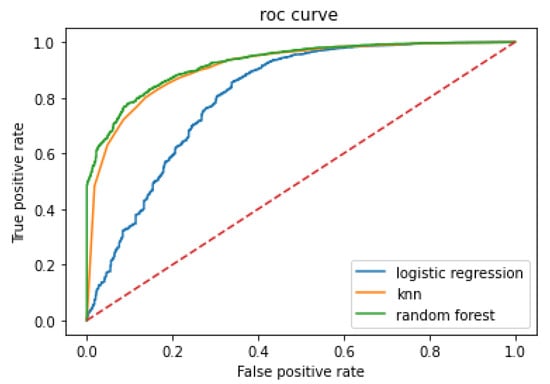
Figure 11.
ROC curve of model prediction effect comparison.
4. Discussion
In previous work, some scholars used traditional classification methods such as logical regression LR [5,6,7], KNN [6], and SVM [7,8,9] to establish prediction models. Some scholars also use neural network methods such as CNN [3,10,11] and LSTM [11,12] to predict dropout behavior. Although the above methods have achieved good results in predicting the dropout rate, they have not statistically analyzed and visualized the factors affecting MOOC learners’ dropout behavior. Some other scholars theoretically analyzed the strategies to maintain MOOC learning motivation [13] and explored the impact of forum posting and social network behavior on dropout [15]. However, their work focus on the theoretical analysis of the influencing factors of MOOC dropout, lacking a quantitative analysis of each factor.
This paper selects gender, age, source country, academic qualification, active time, video playing time, course cumulative days, and the number of forum posts to analyze learners’ dropout behavior, from the two aspects of learners’ own characteristics and learning behavior. The analysis results show that the dropout behavior is related to factors including the source country, the active time, the video playing time, and the cumulative learning days. Specifically, the dropout rate of students whose source country is China is relatively high. This may be because learners from China are restricted by objective conditions such as language and network access, which affects their learning behavior on the EdX platform. Students with less active time, fewer videos playing time, and fewer cumulative learning days are more likely to drop out of MOOC, which indicates that students’ online participation is more accurate and objective in measuring their learning behavior [30]. However, gender, age, academic qualification, and the number of forum posts have little impact on the dropout behavior. Earlier, Taylor also pointed out in his work [5] that the number of forum posts had little influence on dropout behavior.
The MOOC dropout rate prediction method proposed in this paper uses three common machine learning methods to predict the dropout rate on the basis of statistical analysis and visualization of various factors in the data set. The experimental results show that the overall prediction results of the three models are significantly better than those of the models without statistical analysis steps. Although the prediction algorithm used in this study is relatively traditional, it has achieved good prediction results. This shows the importance of statistics and analysis of various factors that may cause dropout. In addition, the dropout behavior defined in this paper refers to the total score of 0 during the whole learning period. However, the dropout behavior defined in the previous literature refers to learners do not have any online learning activities for seven consecutive days. The author believes that MOOC learners are mostly part-time learners, that is, they usually do online learning while working (or completing their offline learning). It is normal that there is no learning activity for the whole week occasionally. This may be another reason why the results of this paper are better than other works.
In addition to the above analyzed factors, there are many other factors that affect the dropout behavior of MOOC learners, such as teachers’ teaching factors (teachers’ accents, teaching contents, etc.), which cannot be fully covered in this paper, but the unselected factors may have a great impact on the dropout rate. In future work, we will investigate how other factors from multiple sources can be combined to enhance the dropout prediction of MOOCs and explore other machine learning models to further improve the accuracy of dropout prediction.
Finally, we hope that the definition and analysis method of dropout used in this paper can have some reference significance for the follow-up research. The proposed MOOC dropout rate prediction method can enable teaching staff and managers to quickly determine learners’ dropout behavior tendencies.
5. Conclusions
To prevent students’ dropout behavior and reduce the dropout rate, this paper studies the prediction of MOOC dropout. First of all, using the curriculum data on the Harvard X platform, we selected gender, age, source country, academic qualification, active times, video playing time, cumulative course days, and number of forum posts from the two aspects of learners’ self-characteristics and learning behavior to statistically analyze the factors that affect learners’ completion of the course. Then, according to the results of statistical analysis, feature selection is carried out, and MOOC dropout rate prediction models based on logical regression, K-nearest neighbor algorithm, and random forest algorithm are established. At last, accuracy, precision, F1 and AUC are used to compare the performance of the three prediction models. The experimental results show that the accuracy of random forests is the highest among the three models, with an accuracy of 0.917260, a precision of 0.930923, F1 0.954145, and AUC 0.925341. The prediction effect of random forests is better than that of k-nearest neighbor model and logical regression model.
Although we have analyzed many factors that may affect the final completion of MOOC from two aspects: learners’ own characteristics and learners’ behavior, there are still many factors that affect MOOC learners’ dropout behavior, which cannot be fully covered in this paper. In future work, we will study how to combine other factors, such as teachers’ teaching factors, to enhance MOOC’s dropout prediction, and explore more machine learning models to further improve the accuracy of dropout prediction.
Author Contributions
All authors significantly contributed to the scientific study and writing. Z.C. and S.Z. contributed to the overall idea, model formulation and analysis; Z.C. conributed to the writing of the manuscript; L.S. contributed to the process of refining research ideas. All authors have read and agreed to the published version of the manuscript.
Funding
This research is supported by the Foundation of Shandong Jiaotong University, grant number Z201529, the Horizontal Project (60000101174) and the Key project of art science in Shandong Province in 2022 (L2022Z06170162).
Institutional Review Board Statement
Not applicable.
Informed Consent Statement
Not applicable.
Data Availability Statement
Publicly available datasets were analyzed in this study. These data are not curated by our team and are available in: https://www.kaggle.com/datasets/kanikanarang94/mooc-dataset?select=big_student_clear49_third_version.csv (accessed on 15 March 2022).
Conflicts of Interest
The authors declare no conflict of interest.
Abbreviations
The following abbreviations are used in this manuscript:
| MOOC | Massive open online courses |
| KNN | K-nearest Neighbor |
| LR | Logistic Regression |
| RF | Random Forest |
References
- Liu, R. A Study on the Prediction Model of Students’ MOOC Dropout. Master’s Thesis, Central China Normal University, Wuhan, China, 2017. [Google Scholar]
- Zheng, Y.; Yin, B. Big Data Analytics in MOOCs. Ubiquitous Computing and Communications; Dependable, Autonomic and Secure Computing. Pervasive Intelligence and Computing. In Proceedings of the 2015 IEEE International Conference on Computer and Information Technology, Liverpool, UK, 26–28 October 2015; pp. 681–686. [Google Scholar] [CrossRef]
- Xu, C.; Zhu, G.; Ye, J.; Shu, J. Educational Data Mining: Dropout Prediction in XuetangX MOOCs. Neural Process. Lett. 2022, 54, 2885–2900. [Google Scholar] [CrossRef]
- Xia, S.; Nannan, W.; Lei, Z.; Jing, C.; Jun, F. MOOCs dropout rate prediction method based on deep learning. Comput. Eng. Sci. 2019, 41, 893–899. [Google Scholar] [CrossRef]
- Taylor, C. Stopout Prediction in Massive Open Online Courses. Master’s Thesis, Massachusetts Institute of Technology, Cambridge, MA, USA, 2014; p. 120. [Google Scholar]
- Li, W.; Gao, M.; Li, H.; Xiong, Q.; Wen, J.; Wu, Z. Dropout Prediction in MOOCs Using Behavior Features and Multi-View Semi-Supervised Learning. In Proceedings of the 2016 International Joint Conference on Neural Networks (IJCNN), Vancouver, BC, Canada, 24–29 July 2016; pp. 3130–3137. [Google Scholar] [CrossRef]
- Kloft, M.; Stiehler, F.; Zheng, Z.; Pinkwart, N. Predicting MOOC Dropout over Weeks Using Machine Learning Methods. In Proceedings of the EMNLP 2014 Workshop on Analysis of Large Scale Social Interaction in MOOCs, Association for Computational Linguistics, Doha, Qatar; 2014; pp. 60–65. [Google Scholar] [CrossRef]
- Lu, X.; Wang, S.; Huang, J.; Chen, W.; Yan, Z. Predicting Dropout Rates of MOOCs with Sliding Window Model. Data Anal. Knowl. Discov. 2017, 1, 67–75. [Google Scholar] [CrossRef]
- Liang, J.; Yang, J.; Wu, Y.; Li, C.; Zheng, L. Big Data Application in Education: Dropout Prediction in Edx MOOCs. In Proceedings of the 2016 IEEE Second International Conference on Multimedia Big Data (BigMM), Taipei, Taiwan, 20–22 April 2016; pp. 440–443. [Google Scholar] [CrossRef]
- Wen, Y.; Tian, Y.; Wen, B.; Zhou, Q.; Cai, G.; Liu, S. Consideration of the Local Correlation of Learning Behaviors to Predict Dropouts from MOOCs. Tsinghua Sci. Technol. 2019, 25, 336–347. [Google Scholar] [CrossRef]
- Wu, N.; Zhang, L.; Gao, Y.; Zhang, M.; Sun, X.; Feng, J. CLMS-Net: Dropout Prediction in MOOCs with Deep Learning. In Proceedings of the ACM Turing Celebration Conference—China, Association for Computing Machinery, ACM TURC ’19, Chengdu, China, 17–19 May 2019. [Google Scholar] [CrossRef]
- Fei, M.; Yeung, D.Y. Temporal Models for Predicting Student Dropout in Massive Open Online Courses. In Proceedings of the 2015 IEEE International Conference on Data Mining Workshop (ICDMW), Washington, DC, USA, 14 November 2015; pp. 256–263. [Google Scholar] [CrossRef]
- Wang, M.; Xu, X. An Analysis of Learning Motivation Strategies of MOOC Learners. Surv. Educ. 2016, 5, 89–91. [Google Scholar] [CrossRef]
- Bonk, C.; Khoo, E. Adding Some TEC-VARIETY: 100+ Activities for Motivating and Retaining Learners Online; Learning & Technology Library: Waynesville, NC, USA, 2014. [Google Scholar]
- Yang, D.; Sinha, T.; Adamson, D.; Rose, C.P. “Turn on, Tune in, Drop out”: Anticipating Student Dropouts in Massive Open Online Courses. In Proceedings of the NIPS- DDE 2013: NIPS Workshop on Data Driven Education, Lake Tahoe, Nevada, USA, 9 December 2013; p. 9. [Google Scholar]
- Qiu, L. Research on MOOCS Learner’s Dropout Prediction Model Using Behavioral Data. Ph.D. Thesis, Central China Normal University, Wuhan, China, 2019. [Google Scholar]
- HarvardX. HarvardX Person-Course Academic Year 2013 De-Identified Dataset, Version 3.0; Harvard: Cambridge, MA, USA, 2014. [Google Scholar] [CrossRef]
- Wang, P. Learning Analysis of Learners Based on edX Open Data. Mod. Educ. Technol. 2015, 25, 86–93. [Google Scholar]
- Mooc Dataset. Available online: https://www.kaggle.com/datasets/kanikanarang94/mooc-dataset?select=big_student_clear_third_version.csv/ (accessed on 10 March 2022).
- Network, A.P. How to Deal with Data Missing in Empirical Papers. Available online: http://www.cnfzw.cn/article/CC2F18BEC4.html (accessed on 25 September 2022).
- Kang, H. The Prevention and Handling of the Missing Data. Korean J. Anesthesiol. 2013, 64, 402–406. [Google Scholar] [CrossRef] [PubMed]
- Tamboli, N. All You Need to Know about Different Types of Missing Data Values and How to Handle It. Available online: https://www.analyticsvidhya.com/blog/2021/10/handling-missing-value/ (accessed on 25 July 2022).
- Jingjing, C.; Hu Zewen, R.P. Research on the identification of potential “excellent” papers in the field of artificial intelligence based on decision tree and logistic regression model. Inf. Sci. 2022, 40, 90–96. [Google Scholar] [CrossRef]
- Wang, X.-Y.; Tang Qingling, J.X. N-r pulse signal discrimination simulation research based on KNN classification algorithm. Electron. Meas. Technol. 2022, 45, 164–170. [Google Scholar] [CrossRef]
- Danfeng, J.; Tengteng, W.; Liming, W.; Li, W. Research on odor perception classification based on random forest. Electron. Meas. Technol. 2022, 45, 99–103. [Google Scholar] [CrossRef]
- Reading Horizons. Poor Reading Skills Lead More Students to Dropout of School Than Poverty. Available online: https://www.readinghorizons.com/blog/post/2011/04/20/poor-reading-skills-are-responsible-for-more-dropouts-than-poverty/ (accessed on 20 April 2011).
- Baggett, L. Two Behaviors Linked to High School Dropout Rates. Available online: https://news.uga.edu/two-behaviors-linked-high-school-dropout-rates/ (accessed on 12 March 2018).
- Mizani, H.; Cahyadi, A.; Hendryadi, H.; Salamah, S.; Retno Sari, S. Loneliness, Student Engagement, and Academic Achievement during Emergency Remote Teaching during COVID-19: The Role of the God Locus of Control. Humanit. Soc. Sci. Commun. 2022, 9, 305. [Google Scholar] [CrossRef] [PubMed]
- Andy, A. Studying How Individuals Who Express the Feeling of Loneliness in an Online Loneliness Forum Communicate in a Nonloneliness Forum: Observational Study. JMIR Form. Res. 2021, 5, e28738. [Google Scholar] [CrossRef] [PubMed]
- Dass, S.; Gary, K.; Cunningham, J. Predicting Student Dropout in Self-Paced MOOC Course Using Random Forest Model. Information 2021, 12, 476. [Google Scholar] [CrossRef]
Disclaimer/Publisher’s Note: The statements, opinions and data contained in all publications are solely those of the individual author(s) and contributor(s) and not of MDPI and/or the editor(s). MDPI and/or the editor(s) disclaim responsibility for any injury to people or property resulting from any ideas, methods, instructions or products referred to in the content. |
© 2023 by the authors. Licensee MDPI, Basel, Switzerland. This article is an open access article distributed under the terms and conditions of the Creative Commons Attribution (CC BY) license (https://creativecommons.org/licenses/by/4.0/).