Article

Damage Location Diagnosis of Frame Structure Based on a Novel Convolutional Neural Network

School of Mechanical and Equipment Engineering, Hebei University of Engineering, Handan 056038, China
*
Author to whom correspondence should be addressed.
Appl. Sci. 2022, 12(23), 12411; https://doi.org/10.3390/app122312411
Submission received: 13 November 2022 / Revised: 24 November 2022 / Accepted: 2 December 2022 / Published: 4 December 2022
(This article belongs to the Section Computing and Artificial Intelligence)

Abstract

:
In the case of strong noise, when the damage occurs at different locations of the frame structure, the fault vibration signals generated are relatively close. It is difficult to accurately diagnose the specific location of the damage by using the traditional convolution neural network method. In order to solve this problem, this paper proposes a novel convolutional neural network. The method first uses wavelet decomposition and reconstruction to filter out the noise signal in the original vibration signal, then uses CEEMDAN (Complete Ensemble Empirical Mode Decomposition with Adaptive Noise Analysis) to decompose the filtered signal to highlight the feature information in the filtered signal. Finally, a convolution neural network combined with WDCNN (First Layer Wide Convolution Kernel Deep Convolution Neural Network) and LSTM (Long Short-Term Memory Network) is used to achieve the accurate classification of the signal, so as to achieve the accurate diagnosis of the damage location of the frame structure. Taking the four-story steel structure frame of Columbia University as the research object, the fault diagnosis method proposed in this paper is used to carry out experimental research under strong noise conditions. The experimental results show that the accuracy of the fault diagnosis method proposed in this paper can reach 99.97% when the signal-to-noise ratio is −4 dB and the objective function value is reduced to 10−4. Therefore, the fault diagnosis method proposed in this paper has a high accuracy in the strong noise interference environment; it can realize a high precision diagnosis of the damage location of the frame structure under a strong noise environment. The contribution and innovation of this paper is to propose a novel fault diagnosis method based on the convolutional neural network, which solves the problem of accurate damage location diagnosis of frame structures under strong noise environment.

1. Introduction

With the continuous development of China’s machinery and construction industry, the frame structure is used in various construction sites with large equipment. The safety and stability of the frame structure will have a direct impact on the safety of personnel on the construction site and the stable operation of equipment. The failure of the frame structure is often caused by corrosion or external force impacting the bolts and beams in a certain part. Therefore, it is necessary to place multiple vibration sensors on the frame structure to collect the vibration data of specific parts of frame structure in real time. When the damage occurs in some parts of the frame structure, the damage location can be diagnosed by signal processing based on the collected vibration data.
For structural health monitoring and fault diagnosis problems, common methods before the emergence of deep learning include Fourier transform [1,2], wavelet analysis [3,4], principal component analysis (PCA) [5,6], support vector machine (SVM) [7,8], artificial neural network (ANN) [9,10], etc. Although the above traditional fault diagnosis methods have been widely used in different fields due to their intuitive operation, with the arrival of the big data era, facing the problem of fault diagnosis under the condition of massive data, diverse features, and strong noise, traditional methods are difficult to ensure the efficiency and accuracy of fault diagnosis. The composition of the frame structure is complex, so there are many kinds of data to be used in fault diagnosis of the frame structure. In addition, due to the large amount of noise brought in by the complex and changeable environment of the construction site, and the heavy and huge frame structure, the overall vibration caused by the structural damage is often weak. When using traditional signal processing methods to diagnose the fault of the frame structure, it is difficult to separate the effective information features.
In recent years, with the rapid development of artificial intelligence, due to the learning characteristics of autonomous mining, the inherent hidden features of data from massive data, deep learning has attracted in-depth research from researchers in various countries and has made fruitful achievements in natural language processing [11,12,13], text information retrieval [14,15,16], image processing [17,18,19], computer vision [20,21,22], and other fields. With the maturity of deep learning theory, it has also been widely used in the field of structural health monitoring. Yu et al. used the improved bird swarm algorithm to optimize the two-dimensional convolutional neural network to evaluate the torsional capacity of RC beams [23]. In order to overcome the influence of measurement noise and incomplete data on damage feature extraction, Guo et al. proposed a new method based on depth learning [24]. In order to solve the inaccuracy caused by data anomaly in structural health monitoring, Bao et al. proposed a data anomaly detection method based on computer vision and deep learning [25]. In order to overcome the shortcomings of the existing technology of surface crack diagnosis of the concrete structure and improve the detection accuracy, Yu et al. proposed an automatic recognition method for surface condition identification of concrete structures based on vision by using depth learning theory [26]. To solve the problem of data anomaly in the data preprocessing stage of structural health monitoring, Tang et al. proposed a data anomaly detection method based on the convolutional neural network [27]. Abdeljaber et al. adopted a two classification method with multiple 1DCNNs (one-dimensional continuous neural network) to study the fault diagnosis of the grandstand model and the four floor structure model, respectively [28]. However, due to the large number of times of manual data processing required for signal classification of multiple measurement and control positions with multiple 1DCNNs and the poor anti-noise interference ability of 1DCNN, efficient fault diagnosis cannot be carried out. Facing the problem of poor anti-noise ability of the ordinary one-dimensional convolutional neural network, Zhang proposed a one-dimensional convolutional neural network model with strong anti-noise ability, named WDCNN (first layer wide resolution kernel deep convolution neural network) [29]. This model increased the number of extracted effective features by increasing the overall perception field of the neural network, thus improving the recognition ability of the neural network. However, it is difficult to effectively identify the fault type when WDCNN is used to classify the vibration data with similar fault conditions.
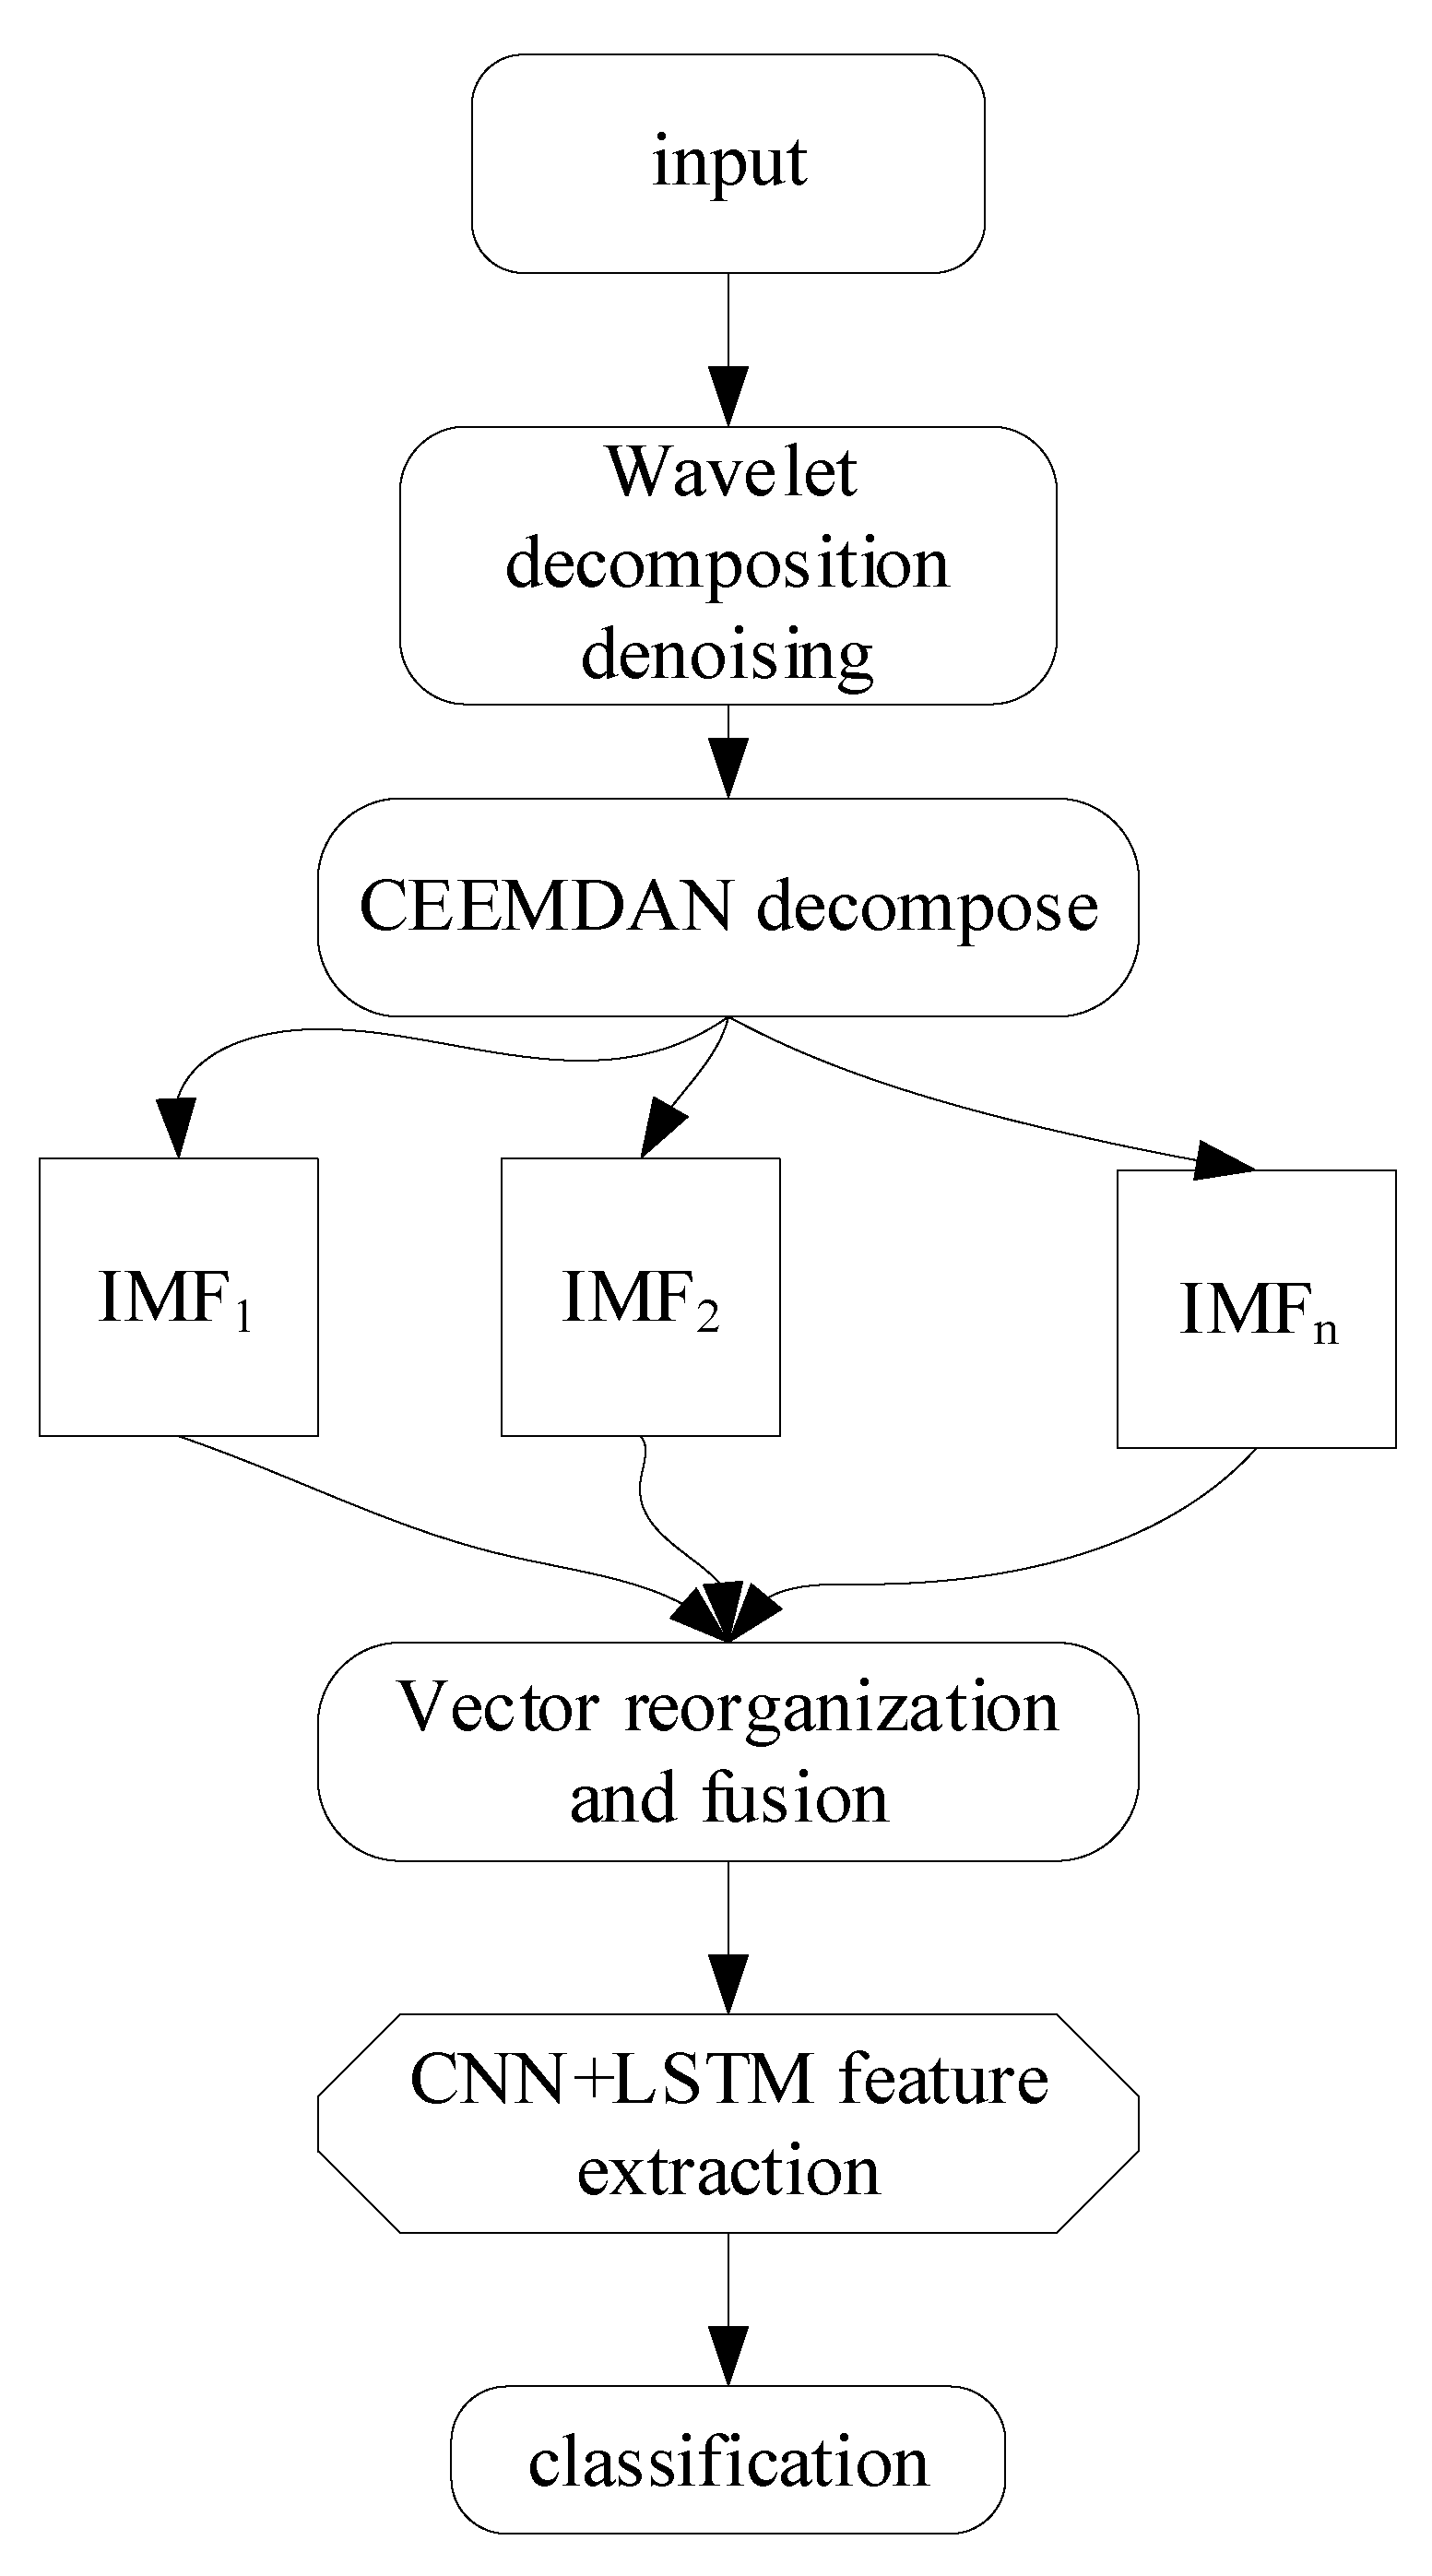
In order to accurately diagnose the damage location of the frame structure in the strong noise environment according to the weak vibration signal, this paper proposed a novel fault diagnosis method based on the convolutional neural network. The basic principle of this method is: firstly, wavelet decomposition and reconstruction [30] is used to denoise the vibration data collected by the acceleration sensor; then CEEMDAN [31] (complete ensemble empirical mode decomposition with adaptive noise analysis) is used to decompose the reconstructed signal at multiple scales, highlight the characteristic information of the vibration signal, and increase the length of sample data; finally, WDCNN and LSTM [32] (Long Short-Term Memory Network) are used to extract the features of reconstructed signals and the correlation features between signals. Taking the building frame structure model of Columbia University [33] as the research object, the damage location diagnosis research was carried out in the strong noise environment by using the method proposed in this paper, and compared with 1DCNN and WDCNN under the same experimental conditions. The research results verified the high accuracy and strong anti-noise ability of the method proposed in this paper. The contribution and innovation of this paper is to propose a novel fault diagnosis method based on the convolutional neural network, which solves the problem of accurate damage location diagnosis of the frame structures under a strong noise environment.

2. Description of Building Frame Structure Model

The building frame structure model studied in this study is the four-story steel structure frame built by Columbia University, as shown in Figure 1 [33]. It can be seen from the figure that the frame structure of the building is divided into four sides: east, south, west, and north; the structure distribution on each side is the same, and the same code is used for the same location. Fifteen accelerometers were placed on the frame structure. Starting from the first floor, three accelerometers were installed on each floor: one was in the west, one was in the east, and the other was near the central column. In addition, No.1 to No.3 accelerometers were placed on the ground floor and the rest were placed on the top of each floor. In this paper, five damage locations of the building frame structure were selected for experimental research. Since four surfaces of the building frame structure were numbered with numbers 1~12, five damage locations were selected as shown in Table 1.
It can be seen from Table 1 and Figure 1 that the damage cases 2–5 of the building frame structure model do not damage the main support column and beam structure, so the difference of vibration data of damage cases 2–5 is not very obvious. Because the vibration exciter is located at the top of the building model, when the frame structure of the building model is damaged, the most stable part is the bottom layer. Therefore, in this paper, the vibration data of the acceleration sensor on the ground floor were selected for the fault diagnosis research of the building model, because in this case, the collected data are less affected by noise, and it is convenient to install the acceleration sensor on the ground floor. When this method is extended to larger frame structures, fault diagnosis can be carried out quickly.

3. Fault Diagnosis Process

When the frame structure is damaged, it is very important to make a quick and clear judgment of the damaged location. The neural network has a strong ability of adaptive feature extraction, so it is efficient to use the neural network for fault diagnosis of the frame structure. In this study, the reconstructed signals were obtained by wavelet decomposition and reorganization of the raw vibration data, and then the reconstructed signals were decomposed and combined by CEEMDAN to increase the length of training samples, and finally the dataset required for training the neural network was obtained. The fault diagnosis process of the building frame structure by using wavelet + CEEMDAN + WDCNN + LSTM is shown in Figure 2.

3.1. Adaptive Wavelet Denoising

During the use of the building frame structure, it is often affected by vibration due to the existence of various surrounding traffic tools, construction machinery, natural wind, and other factors. Therefore, there are strong noise interference signals in the original vibration signals collected during the damage diagnosis of the structural frame, and these strong noise signals belong to low-frequency noise signals [34]. Because the wavelet coefficients of noise signals are small, and the signals with large wavelet coefficients contain a lot of feature information, this paper used adaptive wavelet to decompose and reconstruct the original signals. Adaptive wavelet can automatically select an appropriate threshold, retain the signal whose wavelet coefficient is greater than the threshold, and zero the signal whose wavelet coefficient is less than the threshold, so as to obtain a reconstructed signal with the same length as the original signal. Therefore, using adaptive wavelet decomposition and reconstruction can effectively filter the low-frequency noise signals in the original vibration signals [35]. The principle of wavelet decomposition and reorganization is shown in Figure 3.
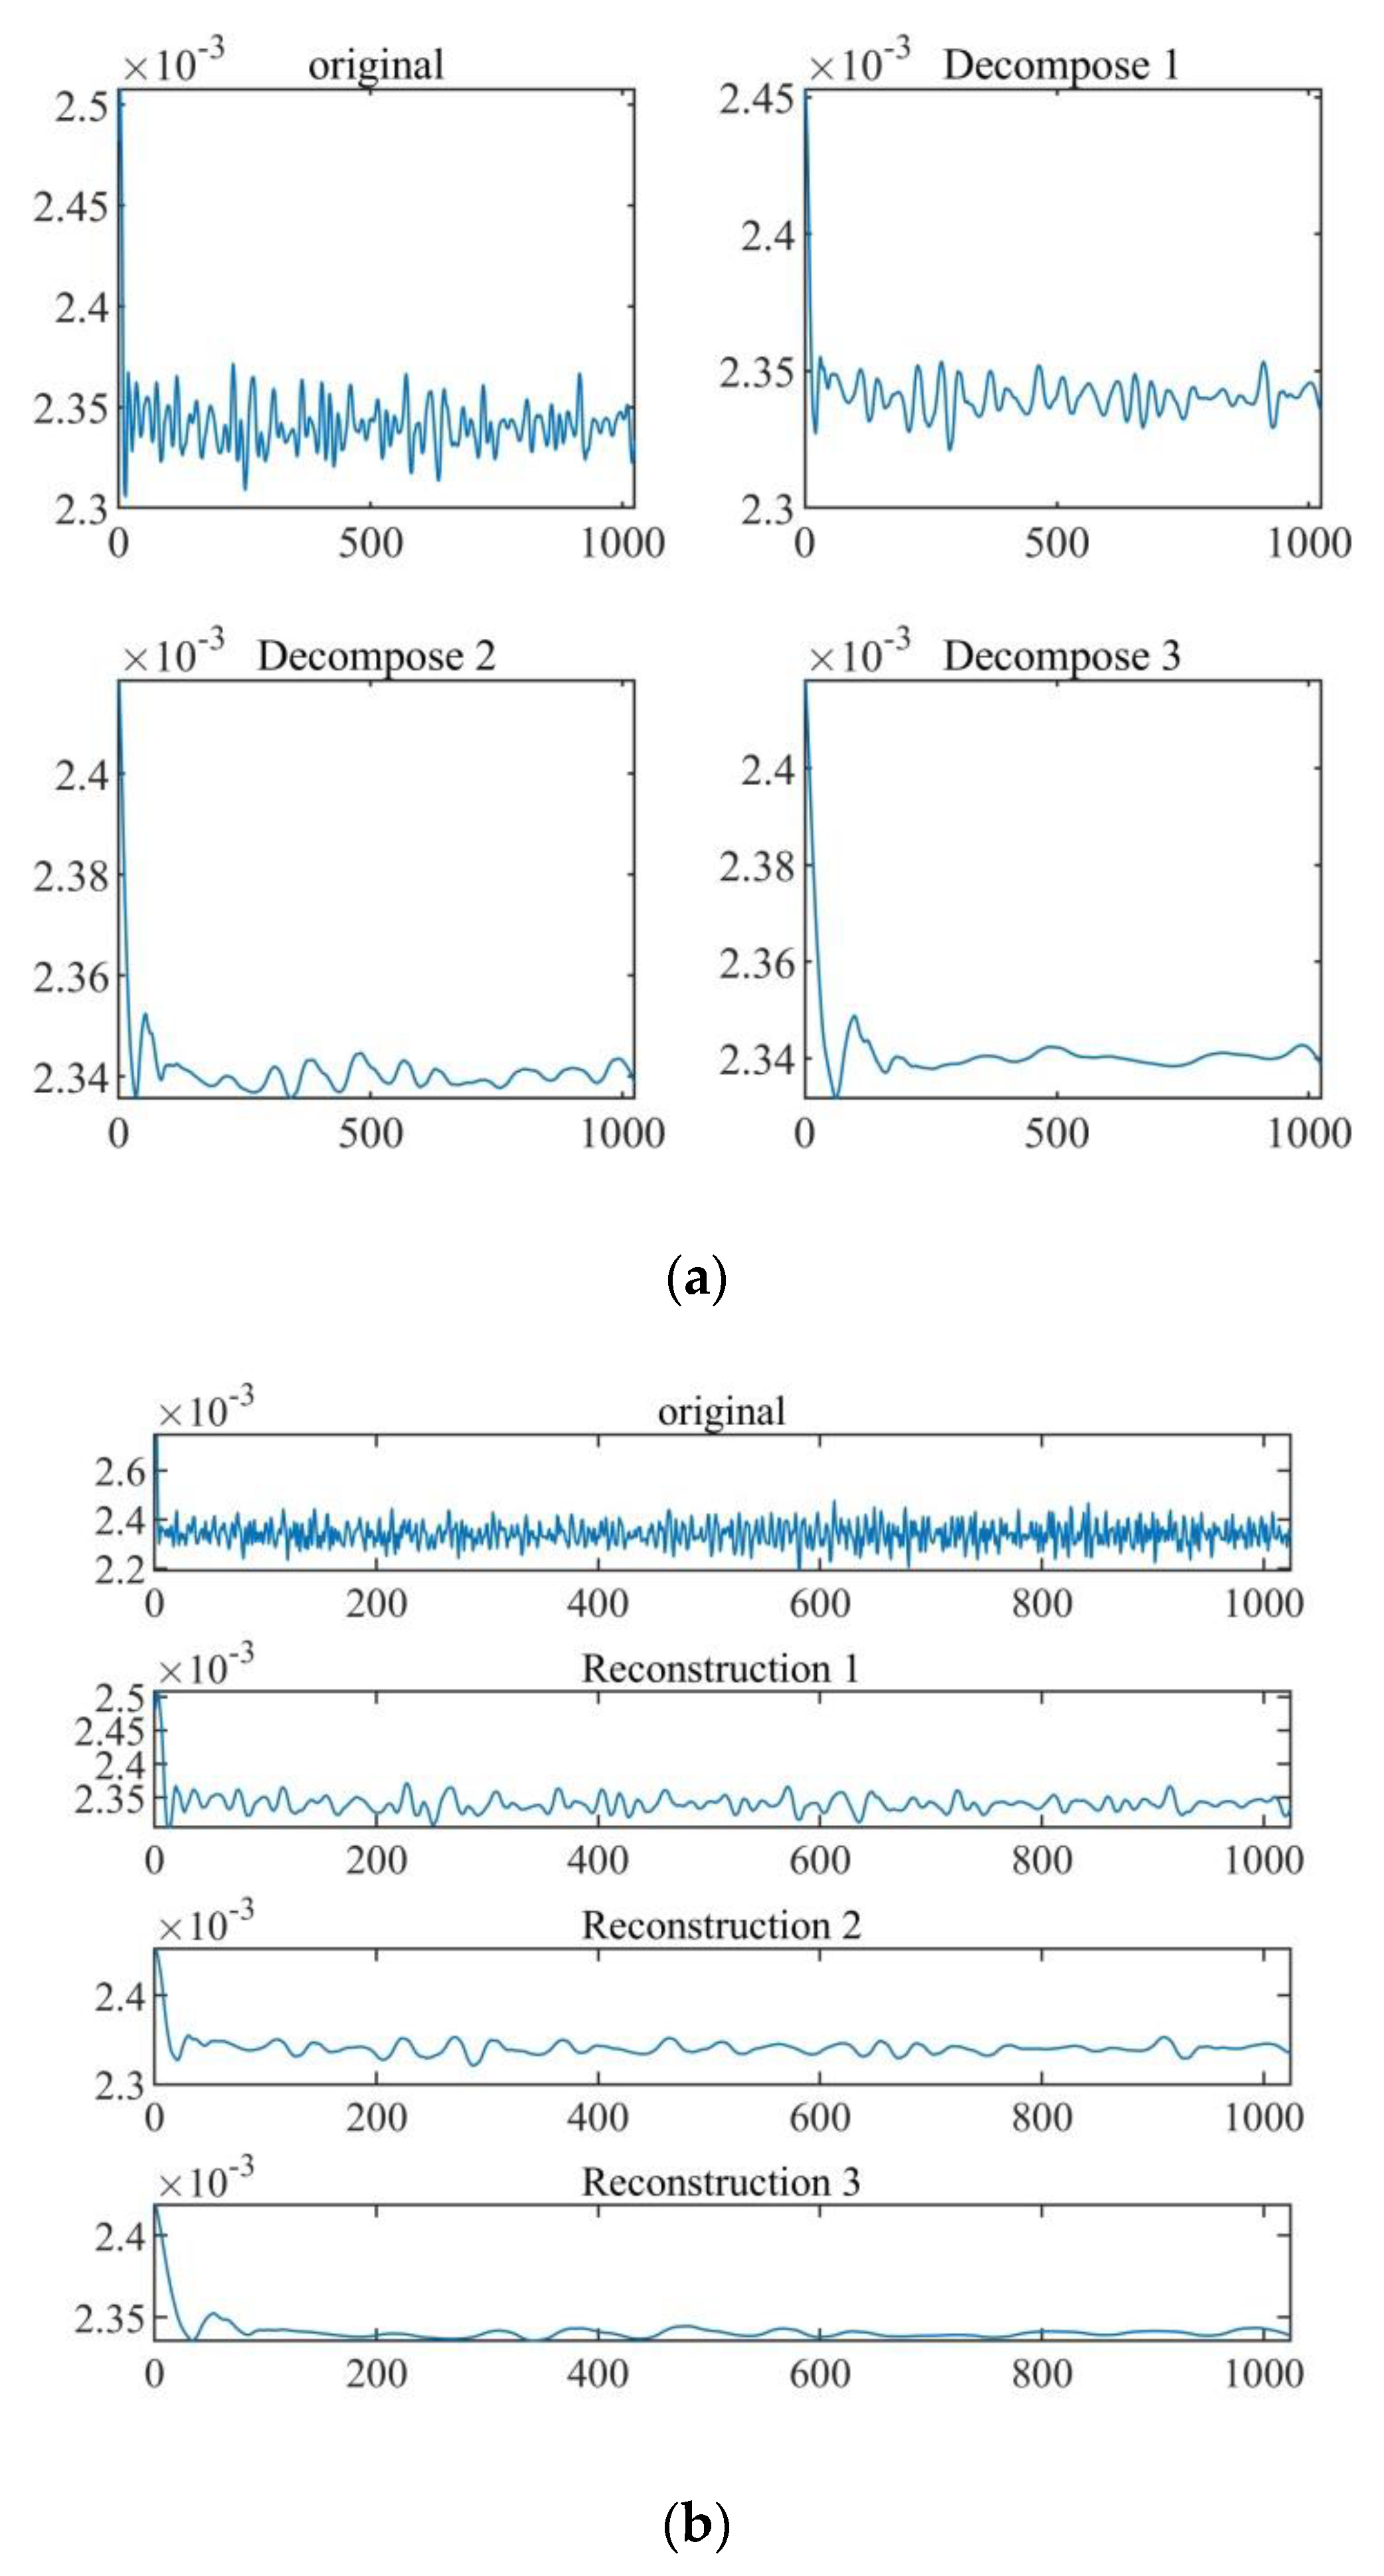
The wavelet decomposition and recombination can filter out part of the low frequency characteristic information while filtering out the low frequency noise signal. Therefore, decomposing the vibration signal to an appropriate level will help to remove the low frequency noise signal, while retaining the low frequency characteristic information to the maximum extent, so as to achieve the purpose of not affecting the recognition rate of the convolutional neural network. The results of multi-level decomposition of the original signal by using wavelet decomposition and reconstruction are shown in Figure 4. It can be seen from the figure that the reconstructed signals are quite different from the original signal. The greater the number of decomposition levels, the greater the difference between the reconstructed signals and the original signals, and the more obvious the loss of features.

3.2. CEEMDAN

In the process of wavelet de-noising, because part of the low-frequency feature information was filtered out, it is necessary to use the method of multi-scale modal decomposition to highlight the feature information in the reconstructed signals. EMD is the most commonly used multi-scale decomposition method, but it has the problem of mode aliasing. In order to solve this problem, an EEMD decomposition method was proposed by adding Gaussian white noise with positive distribution to the original signals [36]. Although EEMD can theoretically remove the Gaussian noise signal whose average value is zero, it cannot completely remove the added noise in practice. In order to solve the defects of EEMD and make EEMD adaptive to the noise added in the original data, so as to completely eliminate the added noise, CEEMDAN (Adaptive EEMD) was generated. The algorithm of CEEMDAN is as follows.
(1)
Add Gaussian white noise signal obeying the normal distribution to the original signal
x i ( t ) = x ( t ) + ε 0 w i ( t ) ,   i = 1 , 2 , 3 T
where x ( t ) is the original signal sequence, T is the number of times to add noise, and ε 0 is the standard deviation of noise.
(2)
Calculate the first natural mode component IMF 1 ( t ) by using the EEMD algorithm
IMF 1 ( t ) = 1 I i = 1 I IMF i 1 ( t )
(3)
Calculate the first residual margin r 1 ( t )
r 1 ( t ) = x ( t ) I M F 1 ( t )
(4)
E i ( w i ( t ) ) is defined as the i-th IMF component after EEMD, ε j is the standard deviation of noise. The second IMF can be obtained by decomposing the sequence r 1 ( t ) + ε 1 E 1 ( w i ( t ) ) .
IMF 2 ( t ) = 1 I i = 1 I E 1 ( r 1 ( t ) + ε 1 E 1 ( w i ( t ) ) )
(5)
The calculation formula for the k-th residual component (k = 2, 3... K, K is the highest decomposition order) can be written as follows.
r k ( t ) = r k - 1 ( t ) I M F k ( t )
Therefore, the k + 1-th IMF component can be obtained by Equation (6) as follows.
IMF k + 1 ( t ) = 1 I i = 1 I E 1 ( r k ( t ) + ε k E k ( w i ( t ) ) )
(6)
Repeat steps 4–6 until the residual signal cannot be decomposed and the residual signal R(t) satisfies the relationship
R ( t ) = x ( t ) k = 1 K I M F k ( t )
So, the original signal can be expressed as
x ( t ) = R ( t ) + k = 1 K I M F k ( t )
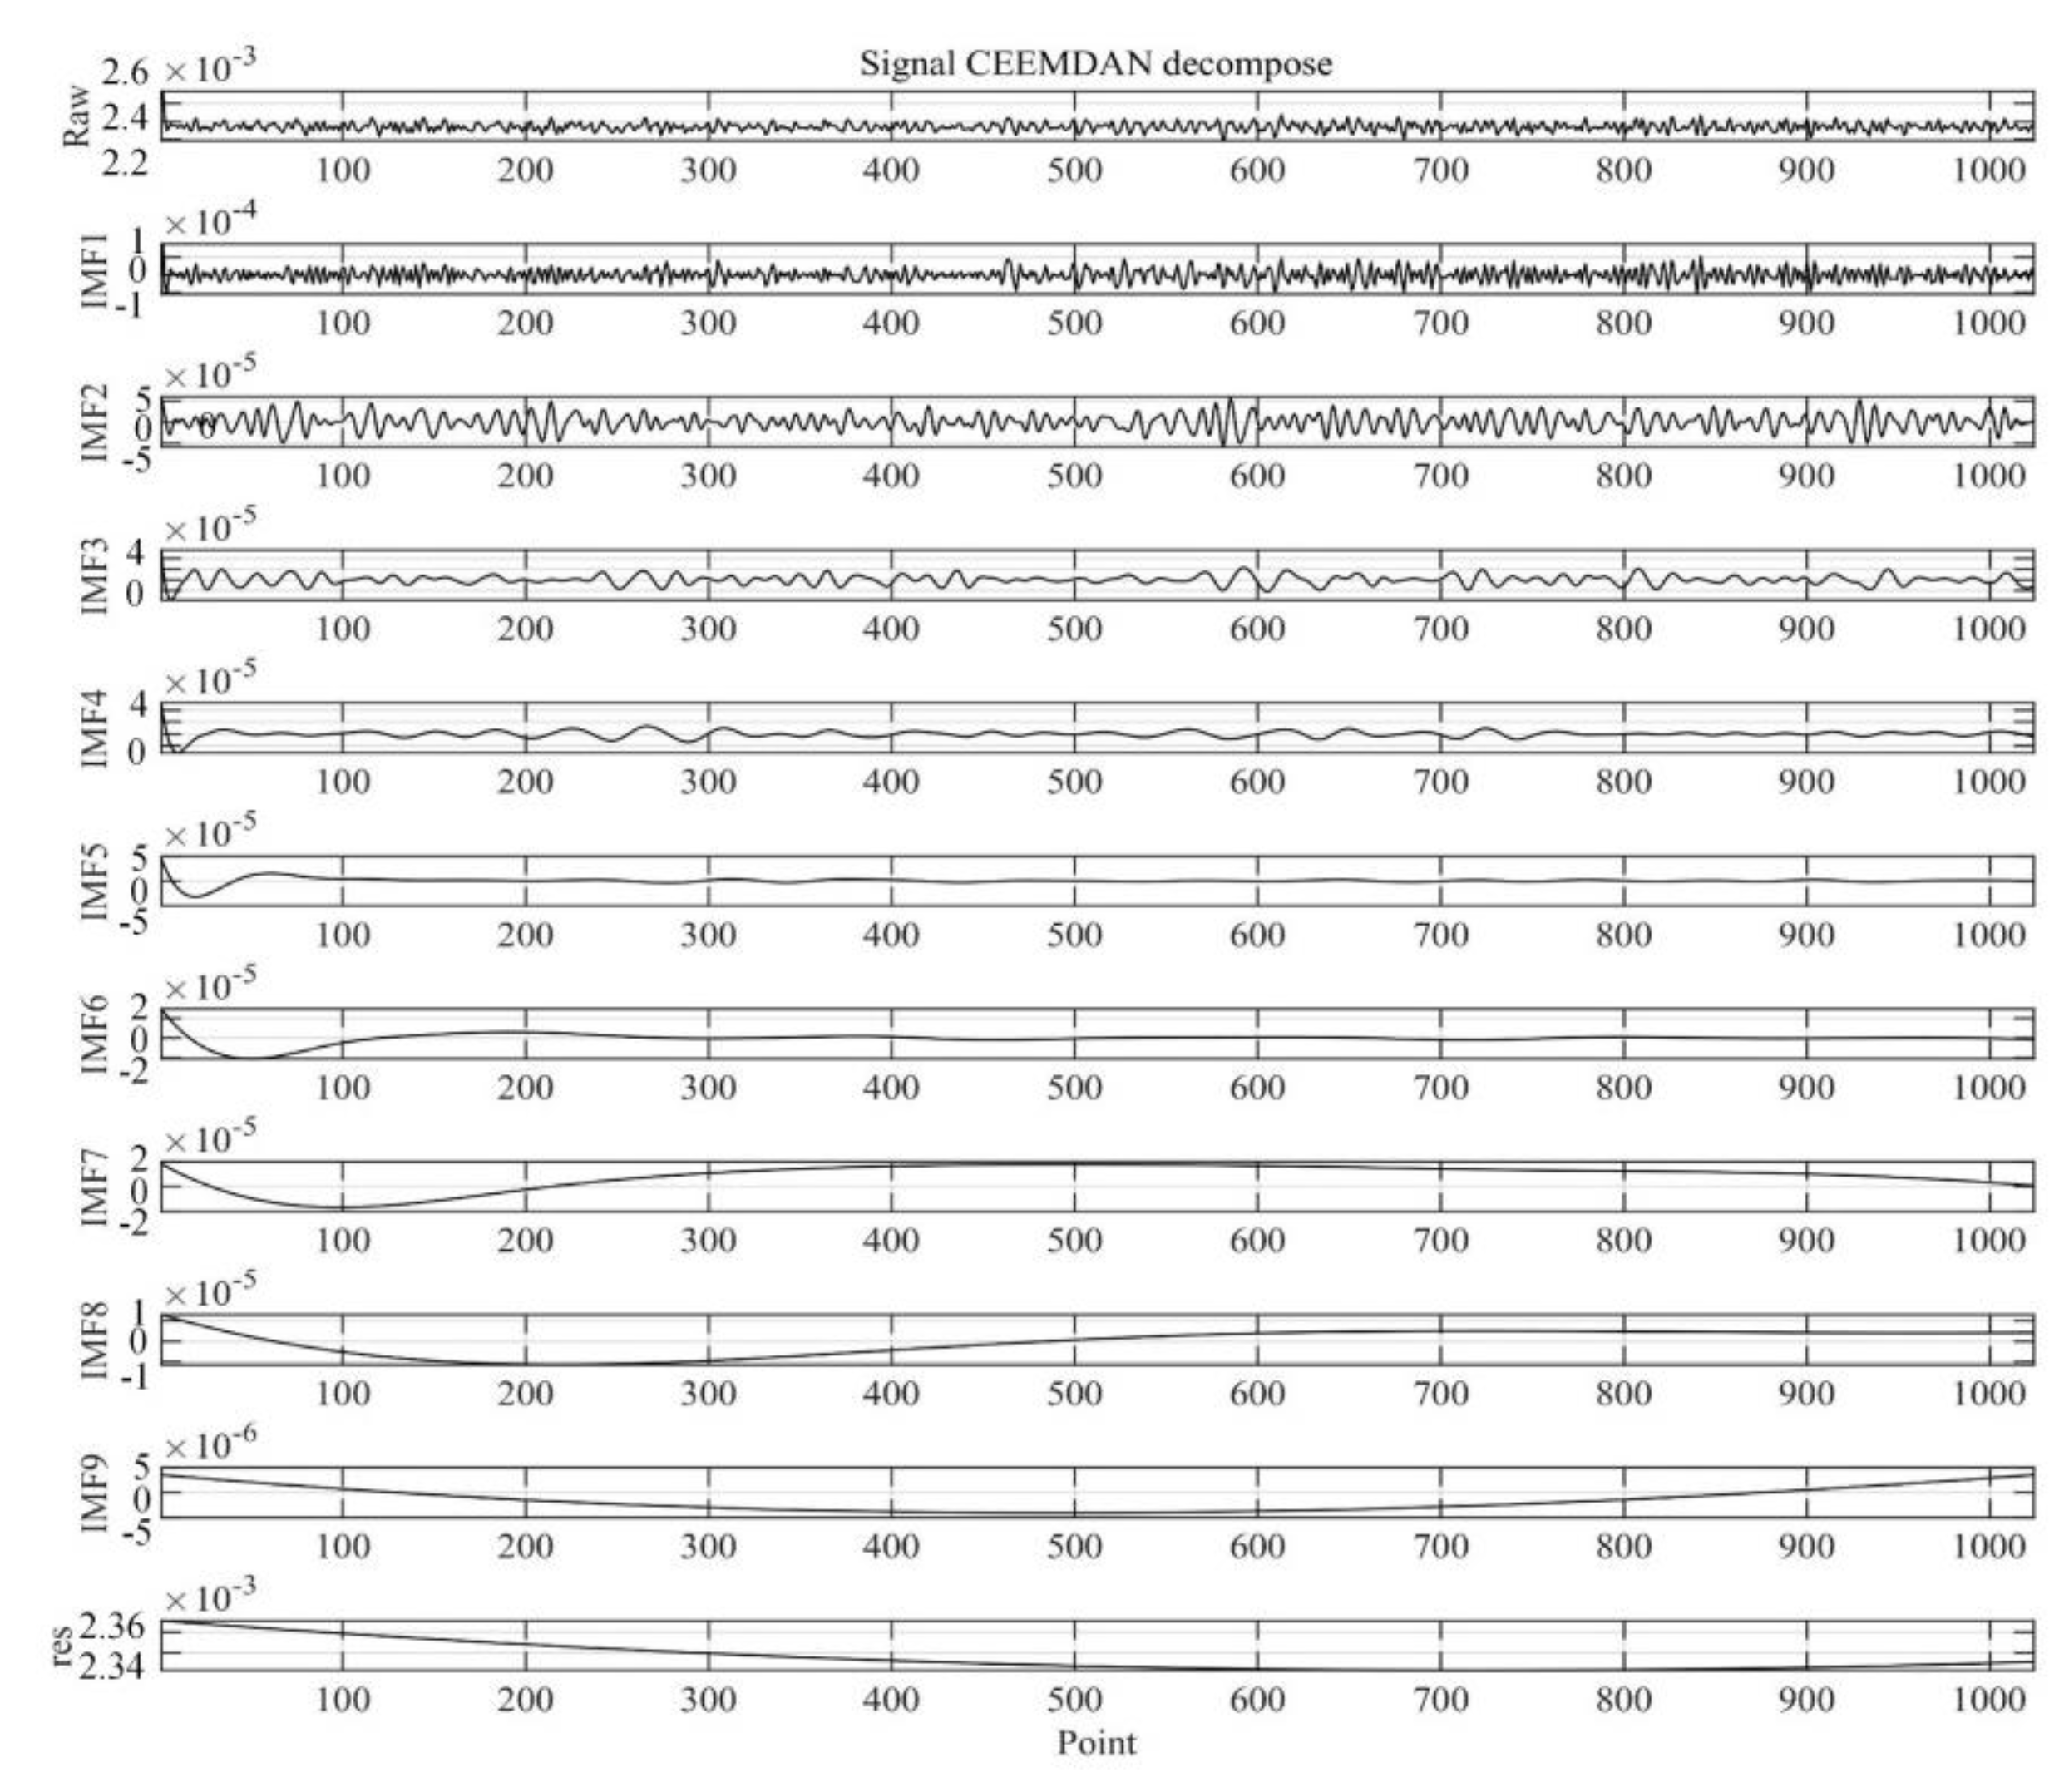
The original signals were decomposed by using CEEMDAN as shown in Figure 5.

3.3. Vector Reorganization and Fusion

It can be seen from Figure 5 that nine IMF components are generated from the decomposition of the original signal by using CEEMDAN, the change trend of IMF components 5–9 is relatively simple, and their digital characteristics are significantly reduced. Therefore, this paper adopted IMF components 1–4 as the composite dataset for reconstruction and fusion. The principle can be seen in the following formula:
[ IMF 11   IMF 21 IMF 12   IMF 22 IMF 1 n IMF 1 N   IMF 2 N IMF K 1 IMF K 2 IMF K n IMF K N ] T Transpose [ IMF 11 IMF 12 IMF 1 n IMF 21 IMF 22   IMF 2 n IMF k 1   IMF k 2 IMF k n IMF K 1 IMF K 2 IMF K n IMF 1 K IMF 2 K IMF k K IMF K N ] Tensor   expansion
[ IMF 11 IMF 12 IMF 1 n IMF 1 K ] [ IMF 21 IMF 22 IMF 2 n IMF 2 K ] [ IMF 11 IMF 12 IMF 1 n IMF 1 K ] r e s h a p e [ IMF K 1 IMF K 2 IMF K n IMF K N ]  
[ IMF 11   IMF 12   IMF 1 K ] [ IMF 21   IMF 22   IMF 2 K ] [ IMF K 1   IMF K 2     IMF K N ] Dimension   reduction [ IMF 11   IMF 12   IMF 1 K   IMF 21   IMF 22 IMF 2 K IMF K 1   IMF K 2     IMF K N ] Form   a   sample X 1
where IMFkn represents the n-th point of the k-th IMF component, k = 1,2 K (in this paper, K is 4), n = 1, 2… 1024.

3.4. WDCNN

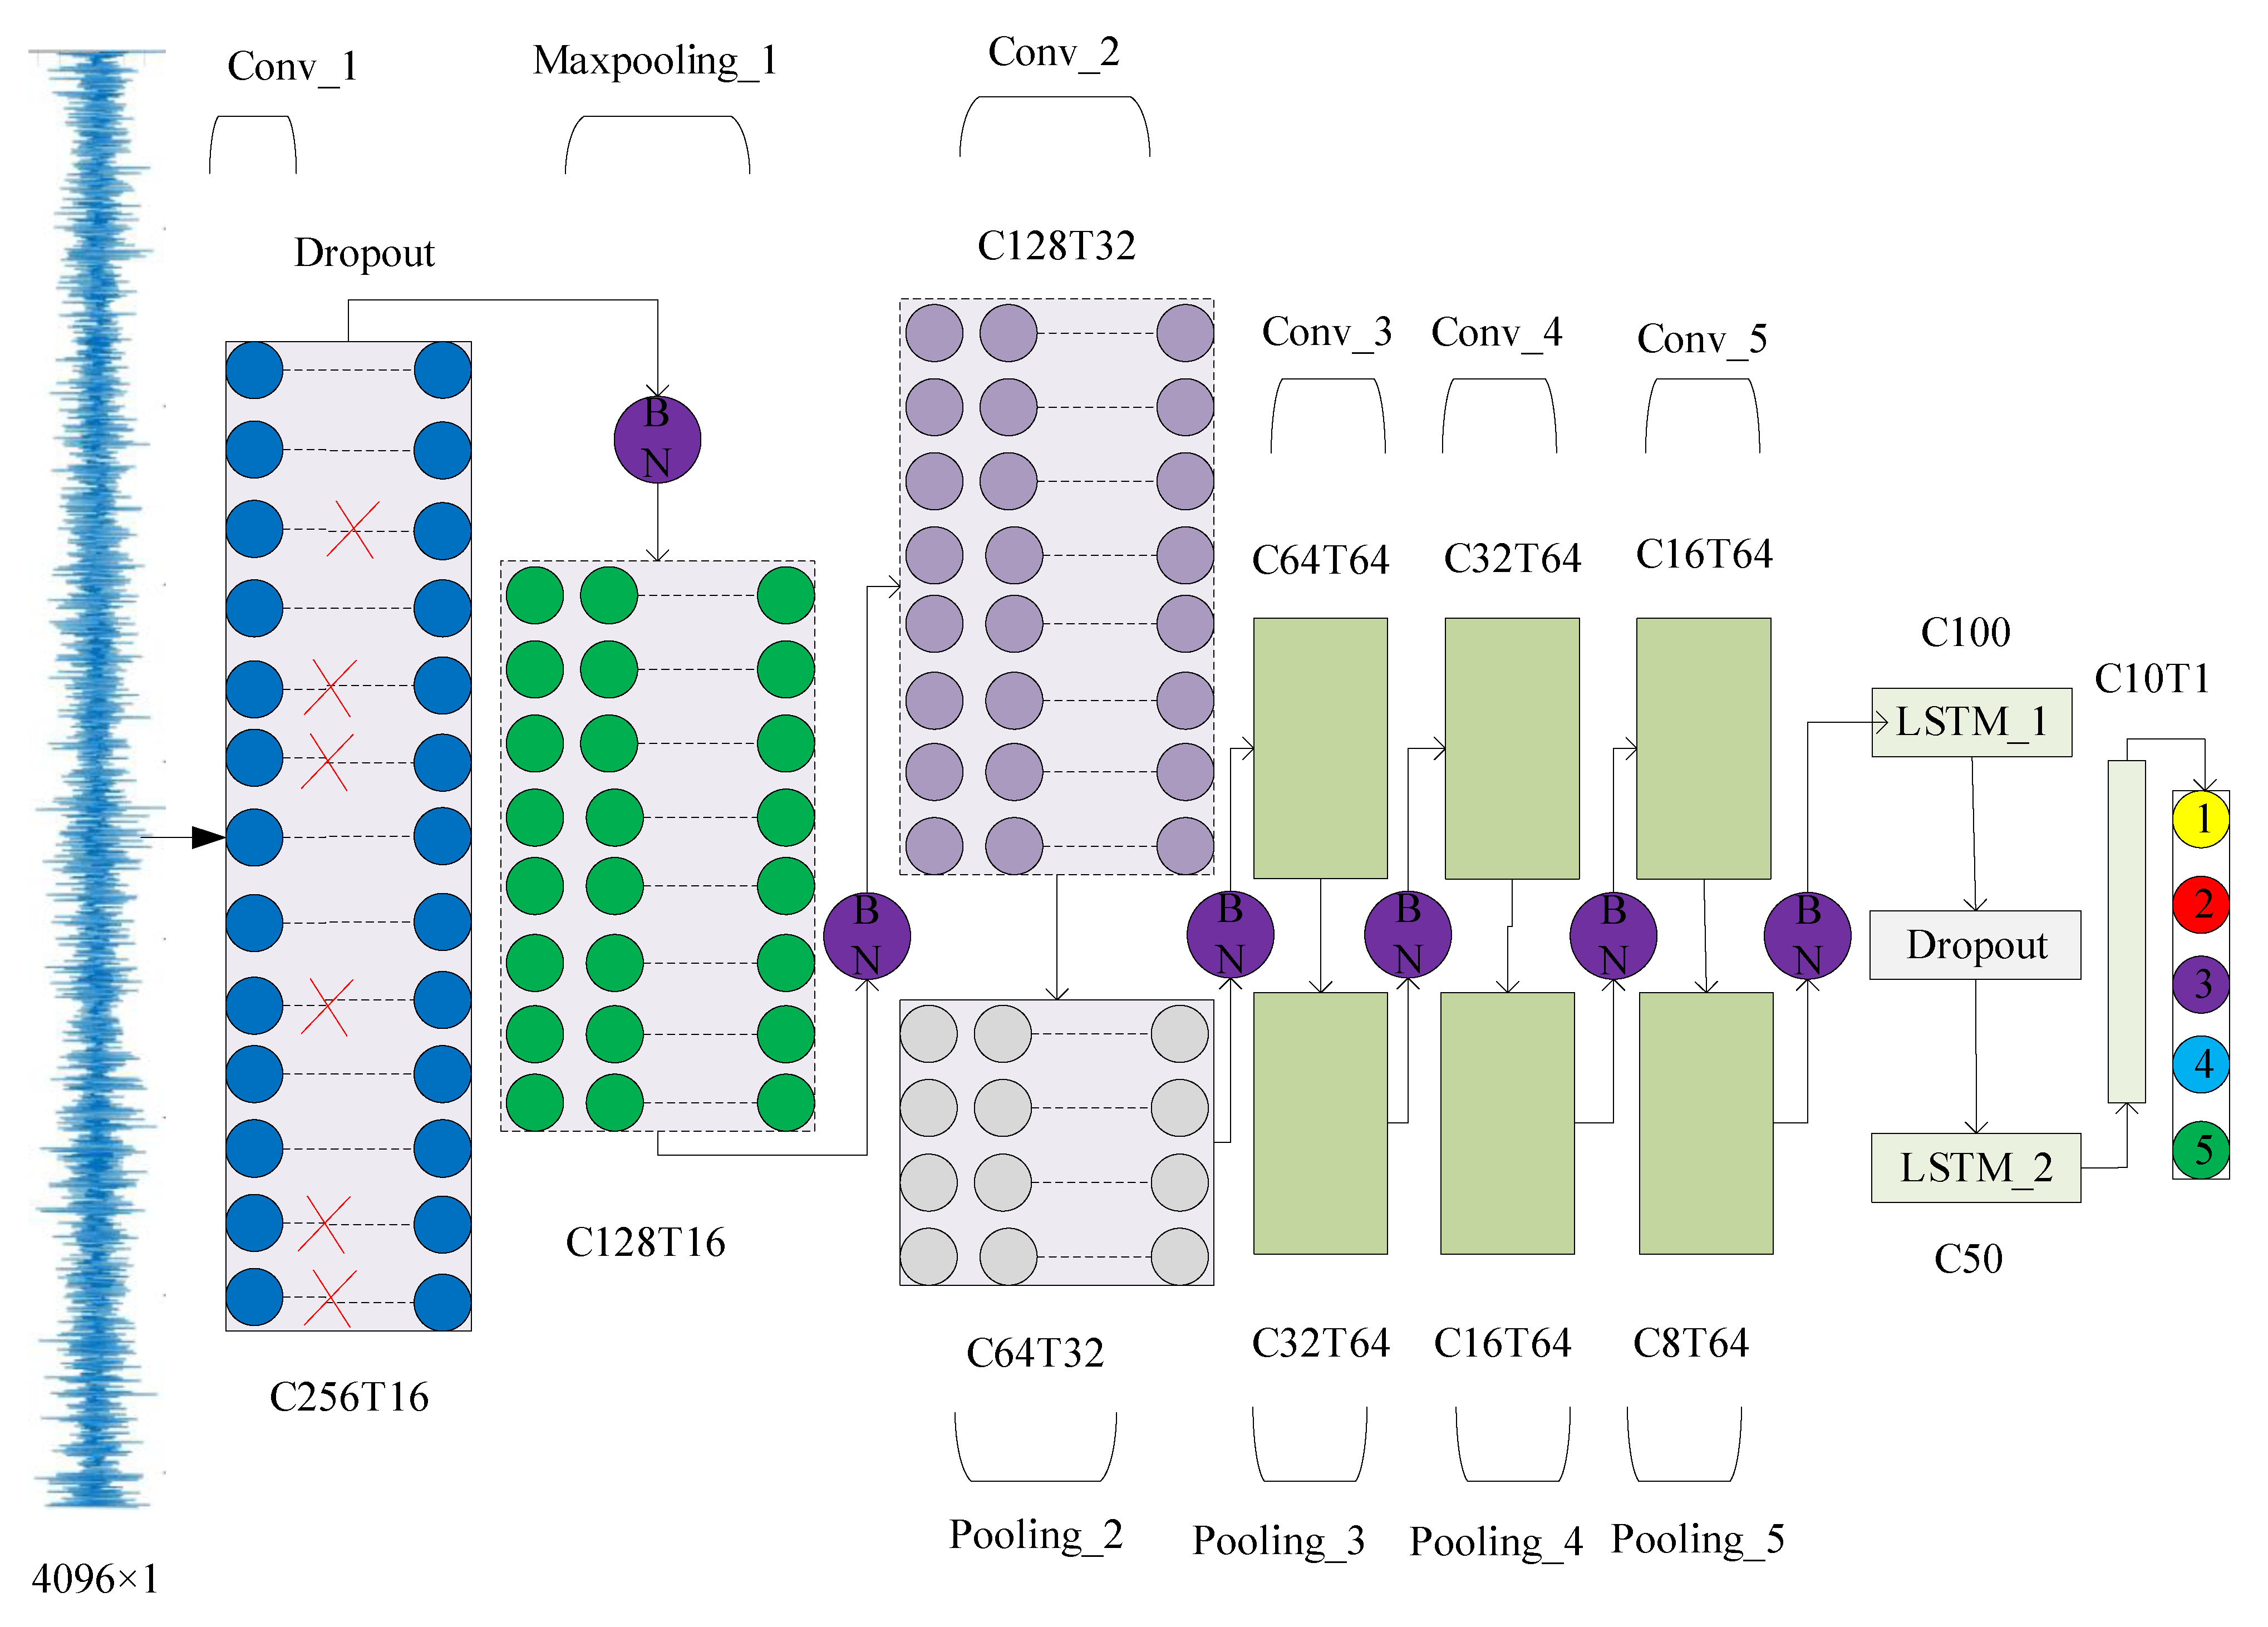
The convolution neural network has the ability to extract invisible digital features, while the feature extraction ability and final recognition rate of the convolutional neural network depend on the size of the perception field of vision of the convolutional neural network. The larger the perception fields of vision, the higher the feature capture ability and recognition efficiency of the convolutional neural network. The WDCNN proposed by Zhang Wei has a wide receptive field and has high recognition ability in feature extraction of vibration data. In addition, Zhang Wei et al. adopted a topology structure of one layer of the large convolution layer followed by multiple layers of the small convolution layer, which makes WDCNN itself have a high anti-noise ability [37]. In addition, this paper selected the first four IMF decomposed by CEEMDAN as a training sample, which made the length of a single training sample become 4096. Therefore, this paper increased the convolution step size of the first convolution layer from 8 to 16 on the basis of WDCNN, which doubled the perception field of the first convolution layer of WDCNN. The WDCNN model and its output parameters adopted in this paper are shown in Figure 6.
In WDCNN, the network parameters are fitted by the forward propagation of the convolution layer, and the network parameters are feedback and modified by the back propagation. The forward propagation formula of the convolution layer is as follows
x i l = b k l + i = 1 N l 1 ( W i k l 1 × S i l 1 )
where x k l is the input of the k-th neuron in the l-th layer; b k l is the deviation of the k-th neuron in the l-th layer; S i l 1 is the output of the i-th neuron in the (l-1)-th layer; W i k l 1 is the weight of the i-th neuron in the (l-1) layer.

3.5. LSTM

CNN has a strong feature extraction ability, which can extract the digital features of vibration signals. However, because CNN trains and fits the weights of neural networks in batches with batch_size as the unit [38], it splits the characteristics of vibration data in terms of time, resulting in incomplete feature extraction. In addition, since CEEMDAN decomposes vibration data in multiple dimensions, there is a strong correlation between each IMF. Therefore, it is necessary to adopt the Long Short-Term Memory Network (LSTM) to capture the correlation information between each component, enhance the recognition ability of the network, and improve the accuracy of fault diagnosis of building frame structures. The LSTM structure is shown in Figure 7.
Compared with RNN, LSTM is more flexible in state updating, and can adopt forgetting gate to lose part of memory information randomly. The update formula of LSTM is as follows.
i t = σ (   W i   [ h t 1 , x t ] + b i )
o t = σ (   W o [ h t 1 , x t ] + b o )
f t = σ (   W f [ h t 1 , x t ] + b f )
C t = f t C t 1 + i t t a n h ( W c   [ h t 1 , x t ] + b c )
h t = o t t a n h ( C t )
where x t is the input data at time t, ht is the output data of LSTM, Wi, Wo, and Wf represent the weight coefficients of input gate, output gate, and forgetting gate, respectively, bi, bo, and bf are bias vectors. With such a gate structure, the LSTM neural network has the ability to maintain long-term storage information and can effectively increase the length of memory. Therefore, it is suitable for extracting correlation features between reconstructed signals.
In this paper, a two-layer LSTM was adopted to replace the full connection layer of WDCNN and a dropout layer was added between the two-layer LSTM, so that the time data transmission of the two-layer LSTM can be lost immediately according to a certain probability, so as to increase the generalization ability of the network. At the same time, the Adam adaptive optimization algorithm [39] was adopted to optimize weight parameters of the overall network.

4. Experimental Results

4.1. Neural Network Training

Taking the four-story steel frame structure of Columbia University as the research object, the experiment research was carried out using the fault diagnosis method proposed in this paper. The experimental data obtained from the open-source data of the four-story steel frame structure fault diagnosis are published by Columbia University. The training of the convolutional neural network proposed in this paper was carried out on a laptop with an Intel Corei7-4710MQ CPU and NVIDIA GT940M 2G GPU. The structure parameters of the model network used in experiments can be seen in Table 2. In the experiment, the data processing and convolutional neural network operating environments are Tensorflow 2.4.8, Keras 3.4.2, and Python 3.8.0.
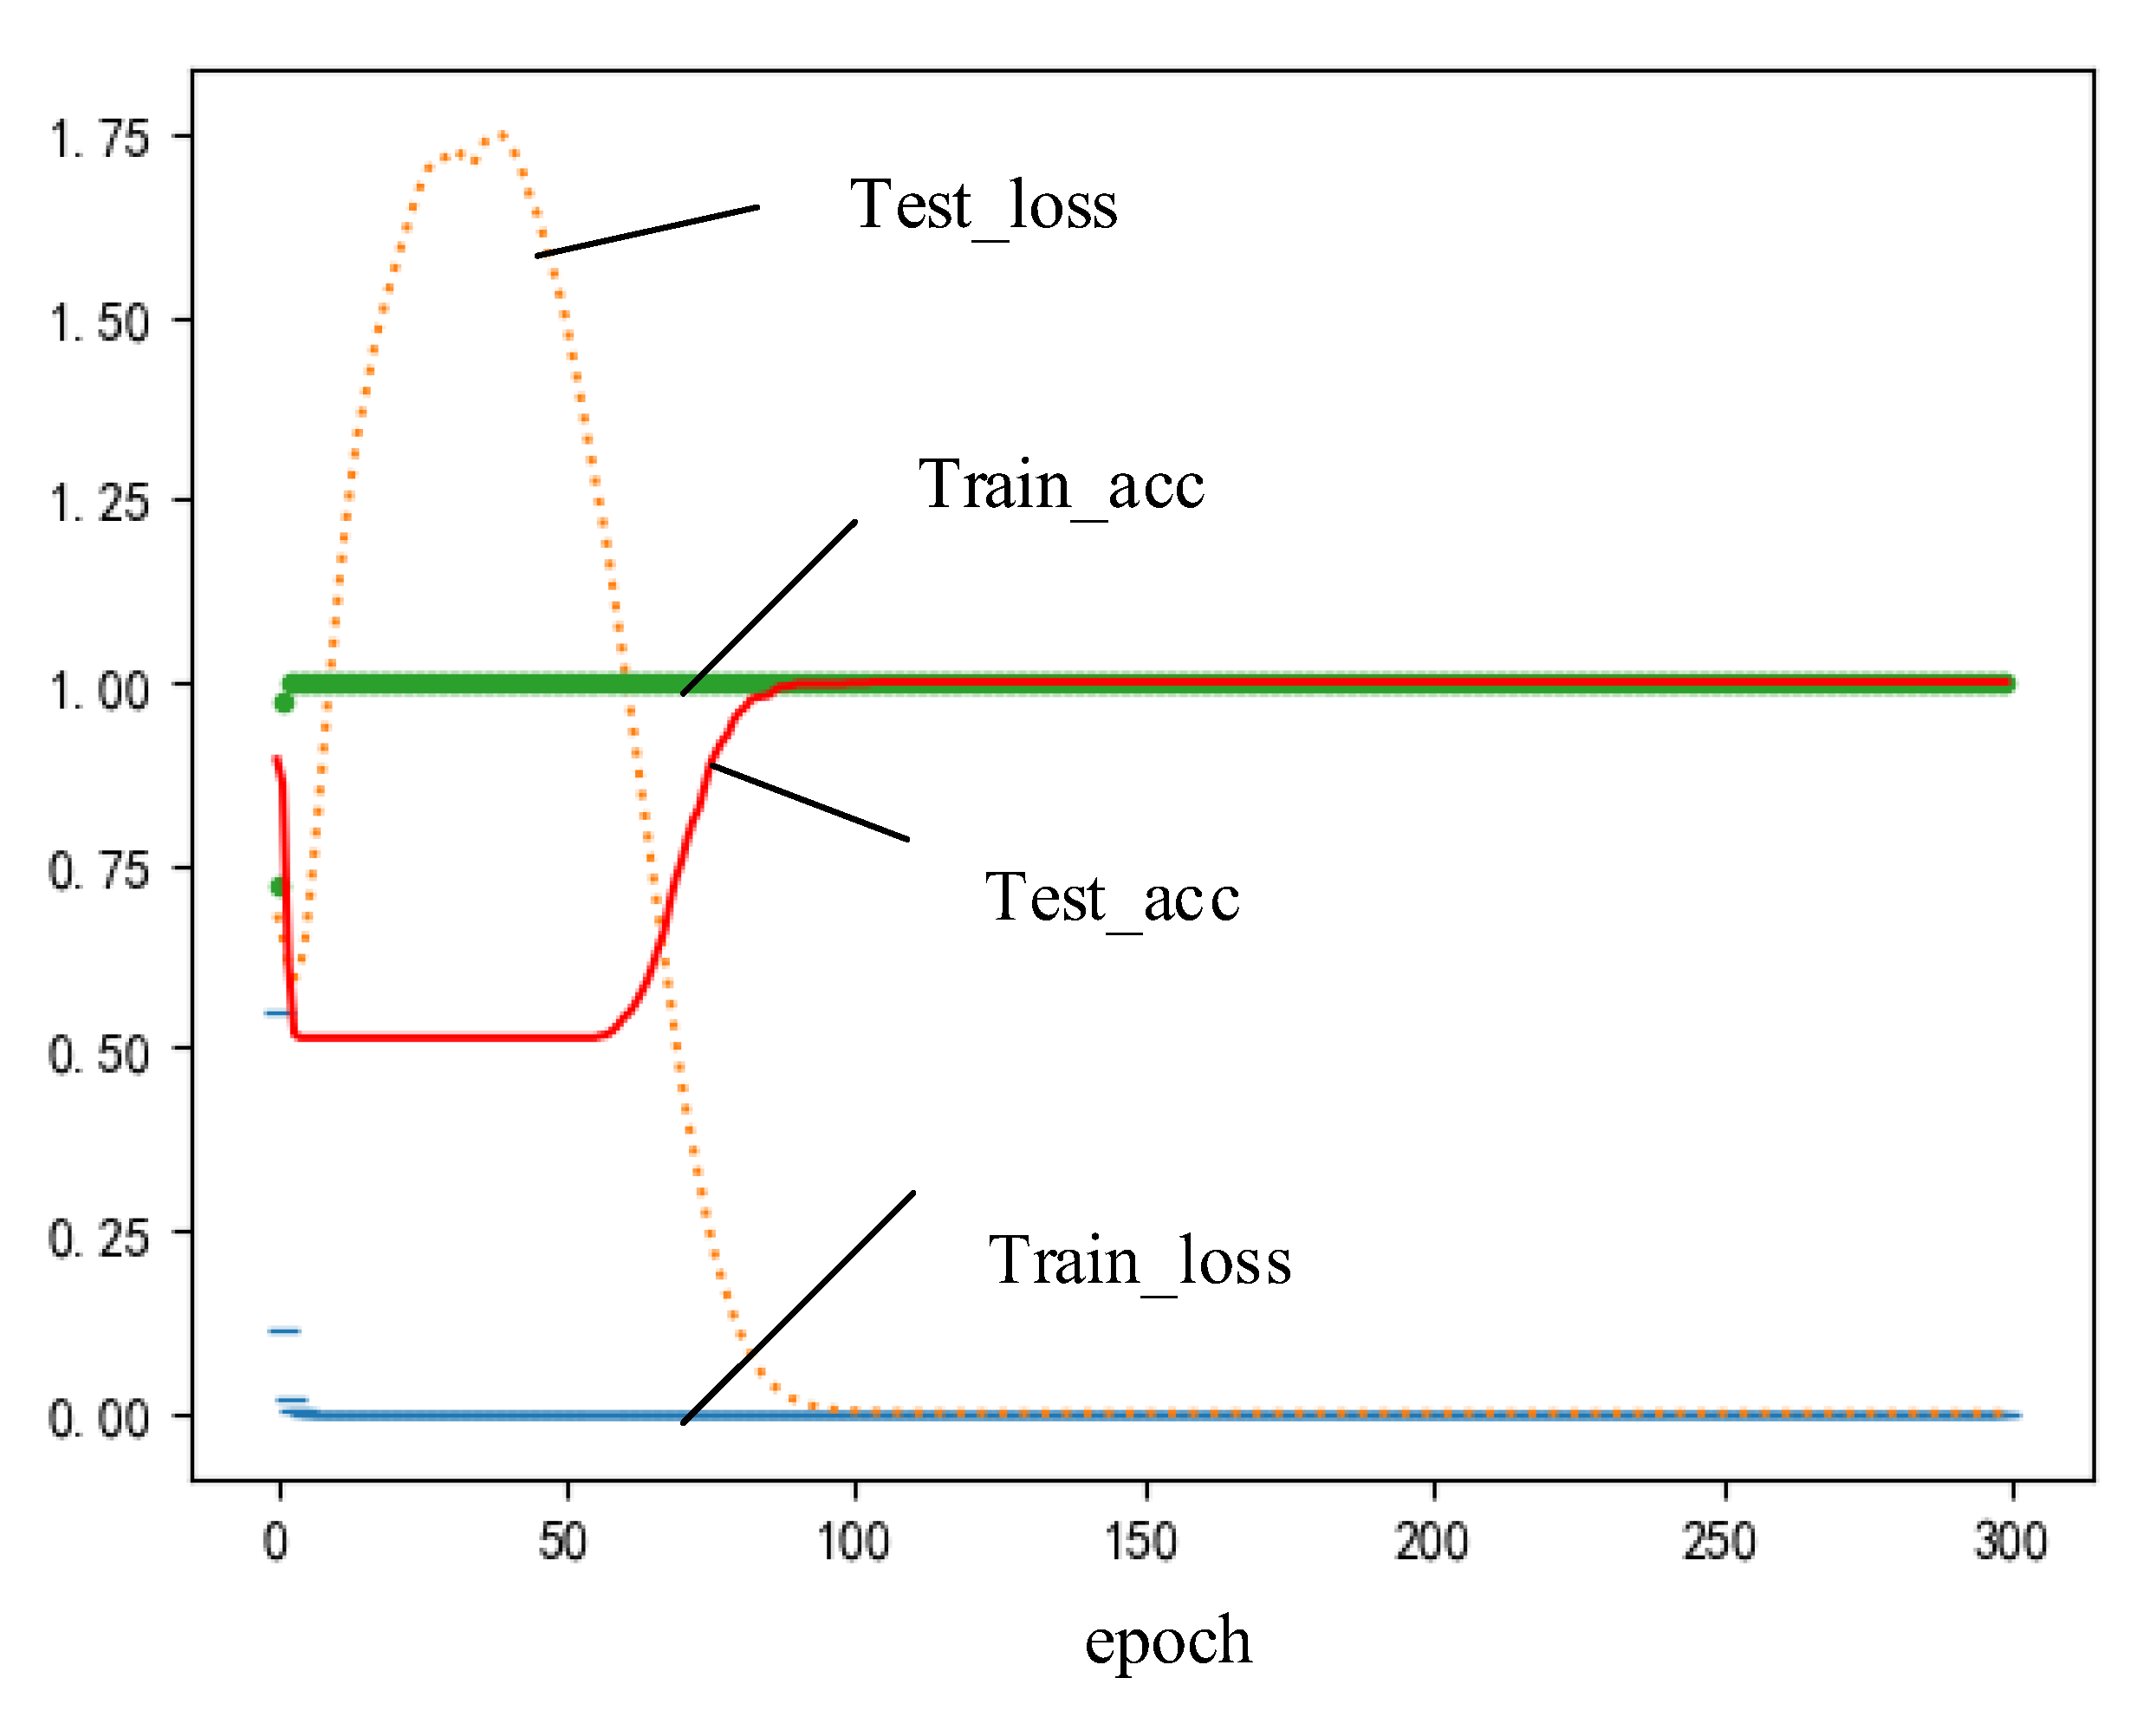
The training curve of the neural network contains information on the convergence rate, whether the network has been fitted, and whether the network is stable after training convergence. Five damage cases provided by Columbia University were used in this paper, and the data of each case contained 24,000 points. In order to get more abundant training samples, the sliding window data enhancement method was adopted in this paper. The window length is 1024, and the sliding step length is 24. Therefore, 957 original data samples of each case were obtained. A total of 4785 training samples were generated under five damage cases, 70% of samples were used for training the neural network and 30% of samples were used for testing the neural network. During training, the learning rate of the Adam algorithm is 0.001, the batch_size is 128, the dropout is 0.6, and the training epoch is 300. The training curve is shown in Figure 8.
As can be seen from Figure 8, there is an over fitting phenomenon before the training epoch is 100. With the increase of training epoch, the curve gradually converges smoothly; the values of loss function of the training set and test set converge to around 0. At the same time, the accuracy rate of the training set and test set reaches 100%, and there is no local gradient jump phenomenon.

4.2. Confusion Matrix

The training curve of the neural network can directly see the fitting of the network, and simply judge the training accuracy of the neural network. The confusion matrix of the network training can calculate the correct rate, recall rate, and error rate of the trained neural network. The confusion matrix obtained by the training neural network is shown in Figure 9.
As can be seen from Figure 9, it can be concluded that the correct rate is 100% and the recall rate is also 100%, which can draw a conclusion that the diagnosis result is more reliable. The calculation formula of training accuracy is as follows.
A c c u r a c y = T P + T N T P + T N + F P + F N = 1 + 1 + 1 + 1 + 1 1 + 1 + 1 + 1 + 1 = 100 %
where TP is the number of samples predicted to be positive, TN is the number of samples predicted to be negative, and TP + TF + FP + FN is the number of all samples. The recall rate can be calculated as follows.
A i = TP i TP + FP j
where Ai is the recall rate of classification i (i = 1,2,… 5), TPi is the correct rate of classification i, FPj is the probability of classification j (j = 1, 2, 3, 4). According to the above formula, Ai = 100%.

4.3. Comparison of Experimental Results under Noise Conditions

Since wavelet decomposition can filter out part of the low-frequency characteristic information while filtering out low-frequency noise signals, selecting the appropriate level of wavelet decomposition and reconstruction will directly affect the accuracy of the whole fault diagnosis result. Therefore, in this paper, the original vibration signals were decomposed by five levels of wavelet decomposition and reconstruction, and the comparative experimental research was carried out in the case of each level of wavelet decomposition and reconstruction combined with the neural network, thus the most reasonable level of wavelet decomposition and reconstruction was obtained. In addition, in order to verify the advantages of the methods proposed in this paper, under the same conditions (different signal-to-noise ratio, the signal-to-noise ratio is −4 dB, −2 dB, 0 dB, 2 dB, and 4 dB, respectively, the definition of signal-to-noise ratio can be found in [37]), comparative experiments were conducted by using WDCNN, WDCNN + LSTM, CEEMDAN + WDCNN + LSTM, and the methods proposed in this paper. The accuracy and objective function values (Loss) of the fault diagnosis of the test set can be seen in Table 3 and Table 4.
From the experimental results in Table 3 and Table 4, it can be seen that adding LSTM to WDCNN can extract the time characteristics of vibration signals, effectively linking the characteristics of front and rear vibration signals, and CEEMDAN can effectively highlight the characteristics of vibration signals, making the signal characteristics collected by the convolutional neural network more comprehensive. Compared with the method of the five level wavelet decomposition plus CEEMDAN + WDCNN + LSTM, it can be seen that the higher the level of wavelet decomposition and reorganization, the more serious the loss of characteristic information of the reconstructed signal. Therefore, adopting the 1-level wavelet decomposition and reorganization not only effectively filters the low-frequency noise signal, but also retains the characteristic information of the signal to the greatest extent.

4.4. TSNE Cluster

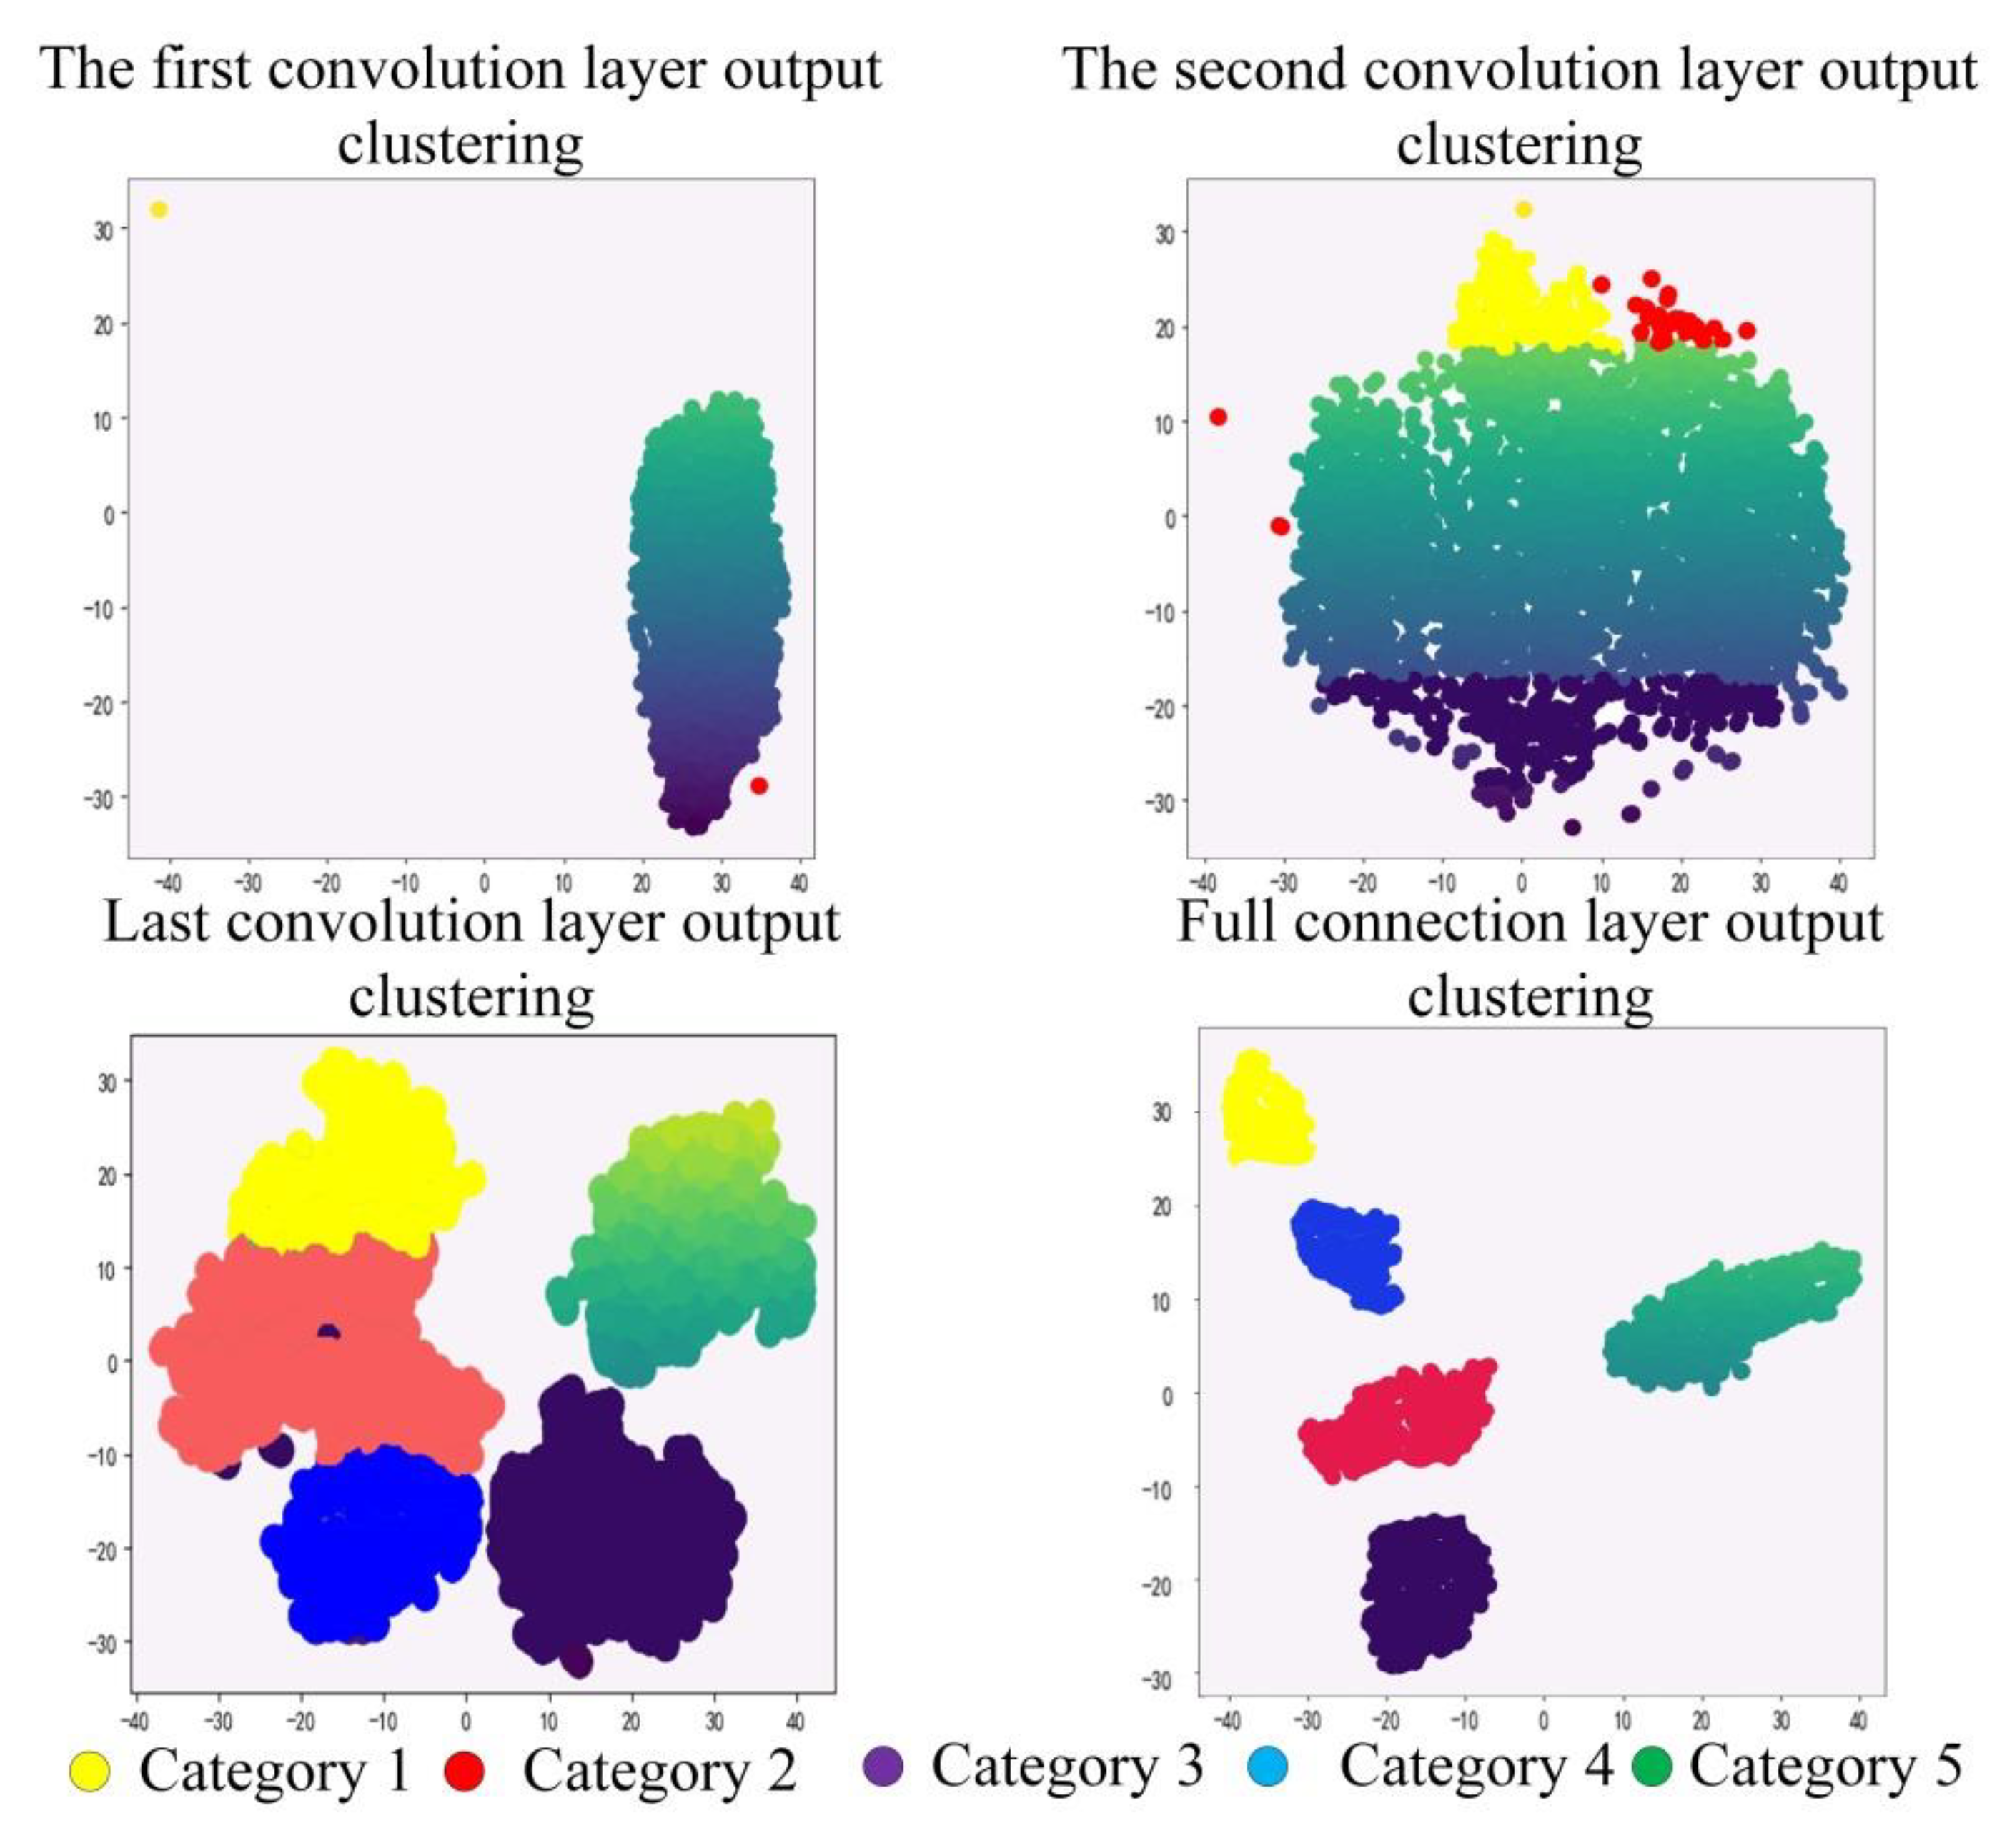
TSNE clustering can reduce the output dimension of the specified convolution layer, pooling layer, activation layer, and full connection layer, so as to convert it into a one-dimensional scatterplot, intuitively showing the changes of datasets in the network [40]. Figure 10 is the TSNE clustering results of the damage location diagnosis of the building frame structure by using the method proposed in this paper under the condition of no noise.
It can be seen from Figure 10 that the vibration data after the first convolution layer are relatively concentrated and mixed, resulting in the characteristic information of case 1, case 2, and case 4 being completely covered by the characteristic information of case 3 and case 5; after the second convolution layer, the characteristic information of each damage case is partially separated; after all convolution layers of WDCNN, the characteristic information of five damage cases is clearly separated, and after two layers of LSTM, the characteristic information of five damage cases is completely and clearly separated, which indicates that LSTM captures the correlation characteristic information between reconstructed signals.

5. Conclusions

In this paper, in order to solve the problem of damage location diagnosis of the frame structure under a strong noise environment, firstly a wavelet multi-scale decomposition was used to filter the low- frequency noise in the original vibration signal, and CEEMDAN was used to decompose and restructure the signal, which highlighted the differences between the vibration signals with small differences. Then, WDCNN was used to extract the digital features of the reconstructed signal, and the two-layer LSTM was used to extract the correlation information between the reconstructed signals. Taking the four-story steel structure frame of Columbia University as the research object, the fault diagnosis method proposed in this paper is used to carry out experimental research under strong noise conditions. The following conclusions can be drawn.
(1).
The fault diagnosis method for strong noise proposed in this paper can effectively filter the low frequency noise and highlight the feature information in the denoised signals.
(2).
The WDCNN + LSTM network model proposed in this paper can effectively extract the feature information in signals and the correlation feature information between signals, so it has a higher diagnostic accuracy.
(3).
Compared with other methods, the damage location diagnosis method proposed in this paper for the building frame structure has strong anti-noise ability and accuracy, and the accuracy can still reach 99.97% when the signal-to-noise ratio is –4 dB. Therefore, the method proposed in this paper has strong advantages in anti-noise and can be used for fault diagnosis of frame structures under a strong noise environment.
The conclusions of this paper were obtained when Gaussian white noises were added to the original data, but in the actual environment, the noise is complex. Therefore, in the next research, we will study the damage location diagnosis of the frame structure in different noise environments. In addition, only five damage locations of frame structures were diagnosed in this paper, and there are at least nine damage situations in the open-source data provided by Columbia University. Therefore, the types of damage locations will be expanded in the next research.

Author Contributions

H.X.: Formal analysis, Investigation, Methodology, Writing—original draft and Writing—review and editing. C.C.: Funding acquisition, Methodology, Project administration, Formal analysis, and supervision. Y.C.: Formal analysis, Software, Validation and Writing—review and editing. All authors have read and agreed to the published version of the manuscript.

Funding

This work was supported by the Nature Science Foundation of Hebei Province grant no. E2020402060, and Key Laboratory of Intelligent Industrial Equipment Technology of Hebei Province (Hebei University of Engineering) under Grant 202204 and 202206.

Institutional Review Board Statement

Not applicable.

Informed Consent Statement

Not applicable.

Data Availability Statement

Not applicable.

Conflicts of Interest

The authors declare no conflict of interest.

References

  1. Melhem, H.; Kim, H. Damage detection in concrete by Fourier and wavelet analyses. J. Eng. Mech. 2003, 129, 571–577. [Google Scholar] [CrossRef]
  2. Gao, R.X.; Yan, R. Non-stationary signal processing for bearing health monitoring. Int. J. Manuf. Res. 2006, 1, 18–40. [Google Scholar] [CrossRef]
  3. Smith, C.; Akujuobi, C.M.; Hamory, P.; Kloesel, K. An approach to vibration analysis using wavelets in an application of aircraft health monitoring. Mech. Syst. Signal Process. 2007, 21, 1255–1272. [Google Scholar] [CrossRef]
  4. Hou, Z.; Noori, M.; Amand, R.S. Wavelet-based approach for structural damage detection. J. Eng. Mech. 2000, 126, 677–683. [Google Scholar] [CrossRef] [Green Version]
  5. Malhi, A.; Gao, R.X. PCA-based feature selection scheme for machine defect classification. IEEE Trans. Instrum. Meas. 2004, 53, 1517–1525. [Google Scholar] [CrossRef]
  6. Park, S.; Lee, J.-J.; Yun, C.-B.; Inman, D.J. Electro-mechanical impedance-based wireless structural health monitoring using PCA-data compression and k-means clustering algorithms. J. Intell. Mater. Syst. Struct. 2008, 19, 509–520. [Google Scholar] [CrossRef]
  7. Konar, P.; Chattopadhyay, P. Bearing fault detection of induction motor using wavelet and Support Vector Machines (SVMs). Appl. Soft. Comput. 2011, 11, 4203–4211. [Google Scholar] [CrossRef]
  8. Saravanan, N.; Siddabattuni, V.K.; Ramachandran, K. A comparative study on classification of features by SVM and PSVM extracted using Morlet wavelet for fault diagnosis of spur bevel gear box. Expert. Sys. Appl. 2008, 35, 1351–1366. [Google Scholar] [CrossRef]
  9. Jayaswal, P.; Verma, S.; Wadhwani, A. Application of ANN, fuzzy logic and wavelet transform in machine fault diagnosis using vibration signal analysis. J. Qual. Maint. Eng. 2010, 16, 190–213. [Google Scholar] [CrossRef]
  10. Wang, D.; Huang, S. Health monitoring and diagnosis for flexible structures with PVDF piezoelectric film sensor array. J. Intell. Mater. Syst. Struct. 2000, 11, 482–491. [Google Scholar] [CrossRef]
  11. Otter, D.W.; Medina, J.R.; Kalita, J.K. A survey of the usages of deep learning for natural language processing. IEEE Trans. Neural Netw. Learn. Syst. 2020, 32, 604–624. [Google Scholar] [CrossRef] [PubMed] [Green Version]
  12. Young, T.; Hazarika, D.; Poria, S.; Cambria, E. Recent trends in deep learning based natural language processing. IEEE Comput. Intell. Mag. 2018, 13, 55–75. [Google Scholar] [CrossRef]
  13. Wu, S.; Roberts, K.; Datta, S.; Du, J.; Ji, Z.; Si, Y.; Soni, S.; Wang, Q.; Wei, Q.; Xiang, Y.; et al. Deep learning in clinical natural language processing: A methodical review. J. Am. Med. Inform. Assoc. 2020, 27, 457–470. [Google Scholar] [CrossRef] [PubMed]
  14. Abbasiantaeb, Z.; Momtazi, S. Text-based question answering from information retrieval and deep neural network perspectives: A survey. Wiley Interdiscip. Rev. Data Min. Knowl. Discov. 2021, 11, e1412. [Google Scholar] [CrossRef]
  15. Hahn, U.; Oleynik, M. Medical information extraction in the age of deep learning. Yearb. Med. Inform. 2020, 29, 208–220. [Google Scholar] [CrossRef]
  16. Daga, I.; Gupta, A.; Vardhan, R.; Mukherjee, P. Prediction of likes and retweets using text information retrieval. Procedia Comput. Sci. 2020, 168, 123–128. [Google Scholar] [CrossRef]
  17. Jiao, L.; Zhao, J. A survey on the new generation of deep learning in image processing. IEEE Access 2019, 7, 172231–172263. [Google Scholar] [CrossRef]
  18. Lee, D.; Lee, J.; Ko, J.; Yoon, J.; Ryu, K.; Nam, Y. Deep learning in MR image processing. Investig. Magn. Reson. Imaging 2019, 23, 81–99. [Google Scholar] [CrossRef]
  19. Hatt, M.; Parmar, C.; Qi, J.; El Naqa, I. Machine (deep) learning methods for image processing and radiomics. IEEE Trans. Radiat. Plasma Med. Sci. 2019, 3, 104–108. [Google Scholar] [CrossRef]
  20. Voulodimos, A.; Doulamis, N.; Doulamis, A.; Protopapadakis, E. Deep learning for computer vision: A brief review. Comput. Intell. Neurosci. 2018, 2018, 7068349. [Google Scholar] [CrossRef]
  21. Chai, J.; Zeng, H.; Li, A.; Ngai, E.W. Deep learning in computer vision: A critical review of emerging techniques and application scenarios. Mach. Learn. Appl. 2021, 6, 100134. [Google Scholar] [CrossRef]
  22. Guo, J.; He, H.; He, T.; Lausen, L.; Li, M.; Lin, H.; Shi, X.; Wang, C.; Xie, J.; Zha, S.; et al. GluonCV and GluonNLP: Deep learning in computer vision and natural language processing. J. Mach. Learn. Res. 2020, 21, 1–7. [Google Scholar]
  23. Yu, Y.; Liang, S.; Samali, B.; Nguyen, T.N.; Zhai, C.; Li, J.; Xie, X. Torsional capacity evaluation of RC beams using an improved bird swarm algorithm optimised 2D convolutional neural network. Eng. Struct. 2022, 273, 115066. [Google Scholar] [CrossRef]
  24. Guo, T.; Wu, L.; Wang, C.; Xu, Z. Damage detection in a novel deep-learning framework: A robust method for feature extraction. Struct. Health Monit. 2020, 19, 424–442. [Google Scholar] [CrossRef]
  25. Bao, Y.; Tang, Z.; Li, H.; Zhang, Y. Computer vision and deep learning–based data anomaly detection method for structural health monitoring. Struct. Health Monit. 2019, 18, 401–421. [Google Scholar] [CrossRef]
  26. Yu, Y.; Samali, B.; Rashidi, M.; Mohammadi, M.; Nguyen, T.N.; Zhang, G. Vision-based concrete crack detection using a hybrid framework considering noise effect. J. Build. Eng. 2022, 61, 105246. [Google Scholar] [CrossRef]
  27. Tang, Z.; Chen, Z.; Bao, Y.; Li, H. Convolutional neural network-based data anomaly detection method using multiple information for structural health monitoring. Struct. Control Health Monit. 2019, 26, e2296. [Google Scholar] [CrossRef] [Green Version]
  28. Abdeljaber, O.; Avci, O.; Kiranyaz, S.; Boashash, B.; Sodano, H.; Inman, D.J. 1-D CNNs for structural damage detection: Verification on a structural health monitoring benchmark data. Neurocomputing 2018, 275, 1308–1317. [Google Scholar] [CrossRef]
  29. Zhang, W. Research on Bearing Fault Diagnosis Algorithm Based on Convolutional Neural Network. Master Thesis, Harbin Inst. Technol, Haerbing, China, 2017. [Google Scholar]
  30. Lu, Z.; Zhang, P.; Zhang, Z.; Yan, J.; Han, Q. A baseline correction algorithm of infrared spectrum based on the optimal decomposition level of wavelet. Infrared 2020, 41, 30–35. [Google Scholar]
  31. Tang, J.; Li, Y.; Gao, X. Denoising method of GNSS deformation monitoring based on CEEMDAN. Geod. Geodyn. 2021, 41, 408–412. [Google Scholar]
  32. Xiong, Z. Analysis and forecast of RMB exchange rate based on CEEMDAN and LSTM. Math. Stat. Manag. 2022, 41, 19. [Google Scholar]
  33. Dyke, S.J. Experimental phase II of the structural health monitoring benchmark problem. In Proceedings of the 16th ASCE Engineering Mechanics Conference, Seattle, WA, USA, 16–18 July 2003. [Google Scholar]
  34. Li, X.; Zhu, H.; Liu, H. Fault diagnosis of rolling bearing based on CEEMDAN Hilbert CNN. J. Qingdao Univ. Sci. Technol. 2021, 42, 97–103. [Google Scholar]
  35. Bi, X.; Zhong, J.; Zhang, D.; Zhou, D.; Ruan, Y. Partial discharge denoising algorithm based on improved singular value and empirical wavelet decomposition. Power Grid Technol. 2021, 45, 4957–4963. [Google Scholar]
  36. Liu, Z.; Yan, B.; Liu, C.; Nie, S.; Song, Y. Fault feature extraction of rolling bearing based on CEEMDAN-FastICA. Modul. Mach. Tool Autom. Process. Technol. 2021, 62, 61–65. [Google Scholar]
  37. Zhang, W.; Li, C.; Peng, G.; Chen, Y. A deep convolutional neural network with new training methods for bearing fault diagnosis under noisy environment and different working load. Mech. Syst. Signal Process. 2018, 100, 439–453. [Google Scholar] [CrossRef]
  38. Lai, C.; Wei, X. Research on training methods of convolutional neural network. Inf. Comput. 2019, 31, 103–104. [Google Scholar]
  39. Meng, C.; Song, J.; Sun, M. Research on improved gesture recognition technology based on CNN. Mod. Electron. Technol. 2020, 43, 128–131. [Google Scholar]
  40. Yang, B.; Li, Q.; Chen, L.; Zhu, Z. Research on bearing fault diagnosis based on RESNET and domain adaptation. Meas. Control Technol. 2021, 40, 31–39. [Google Scholar]
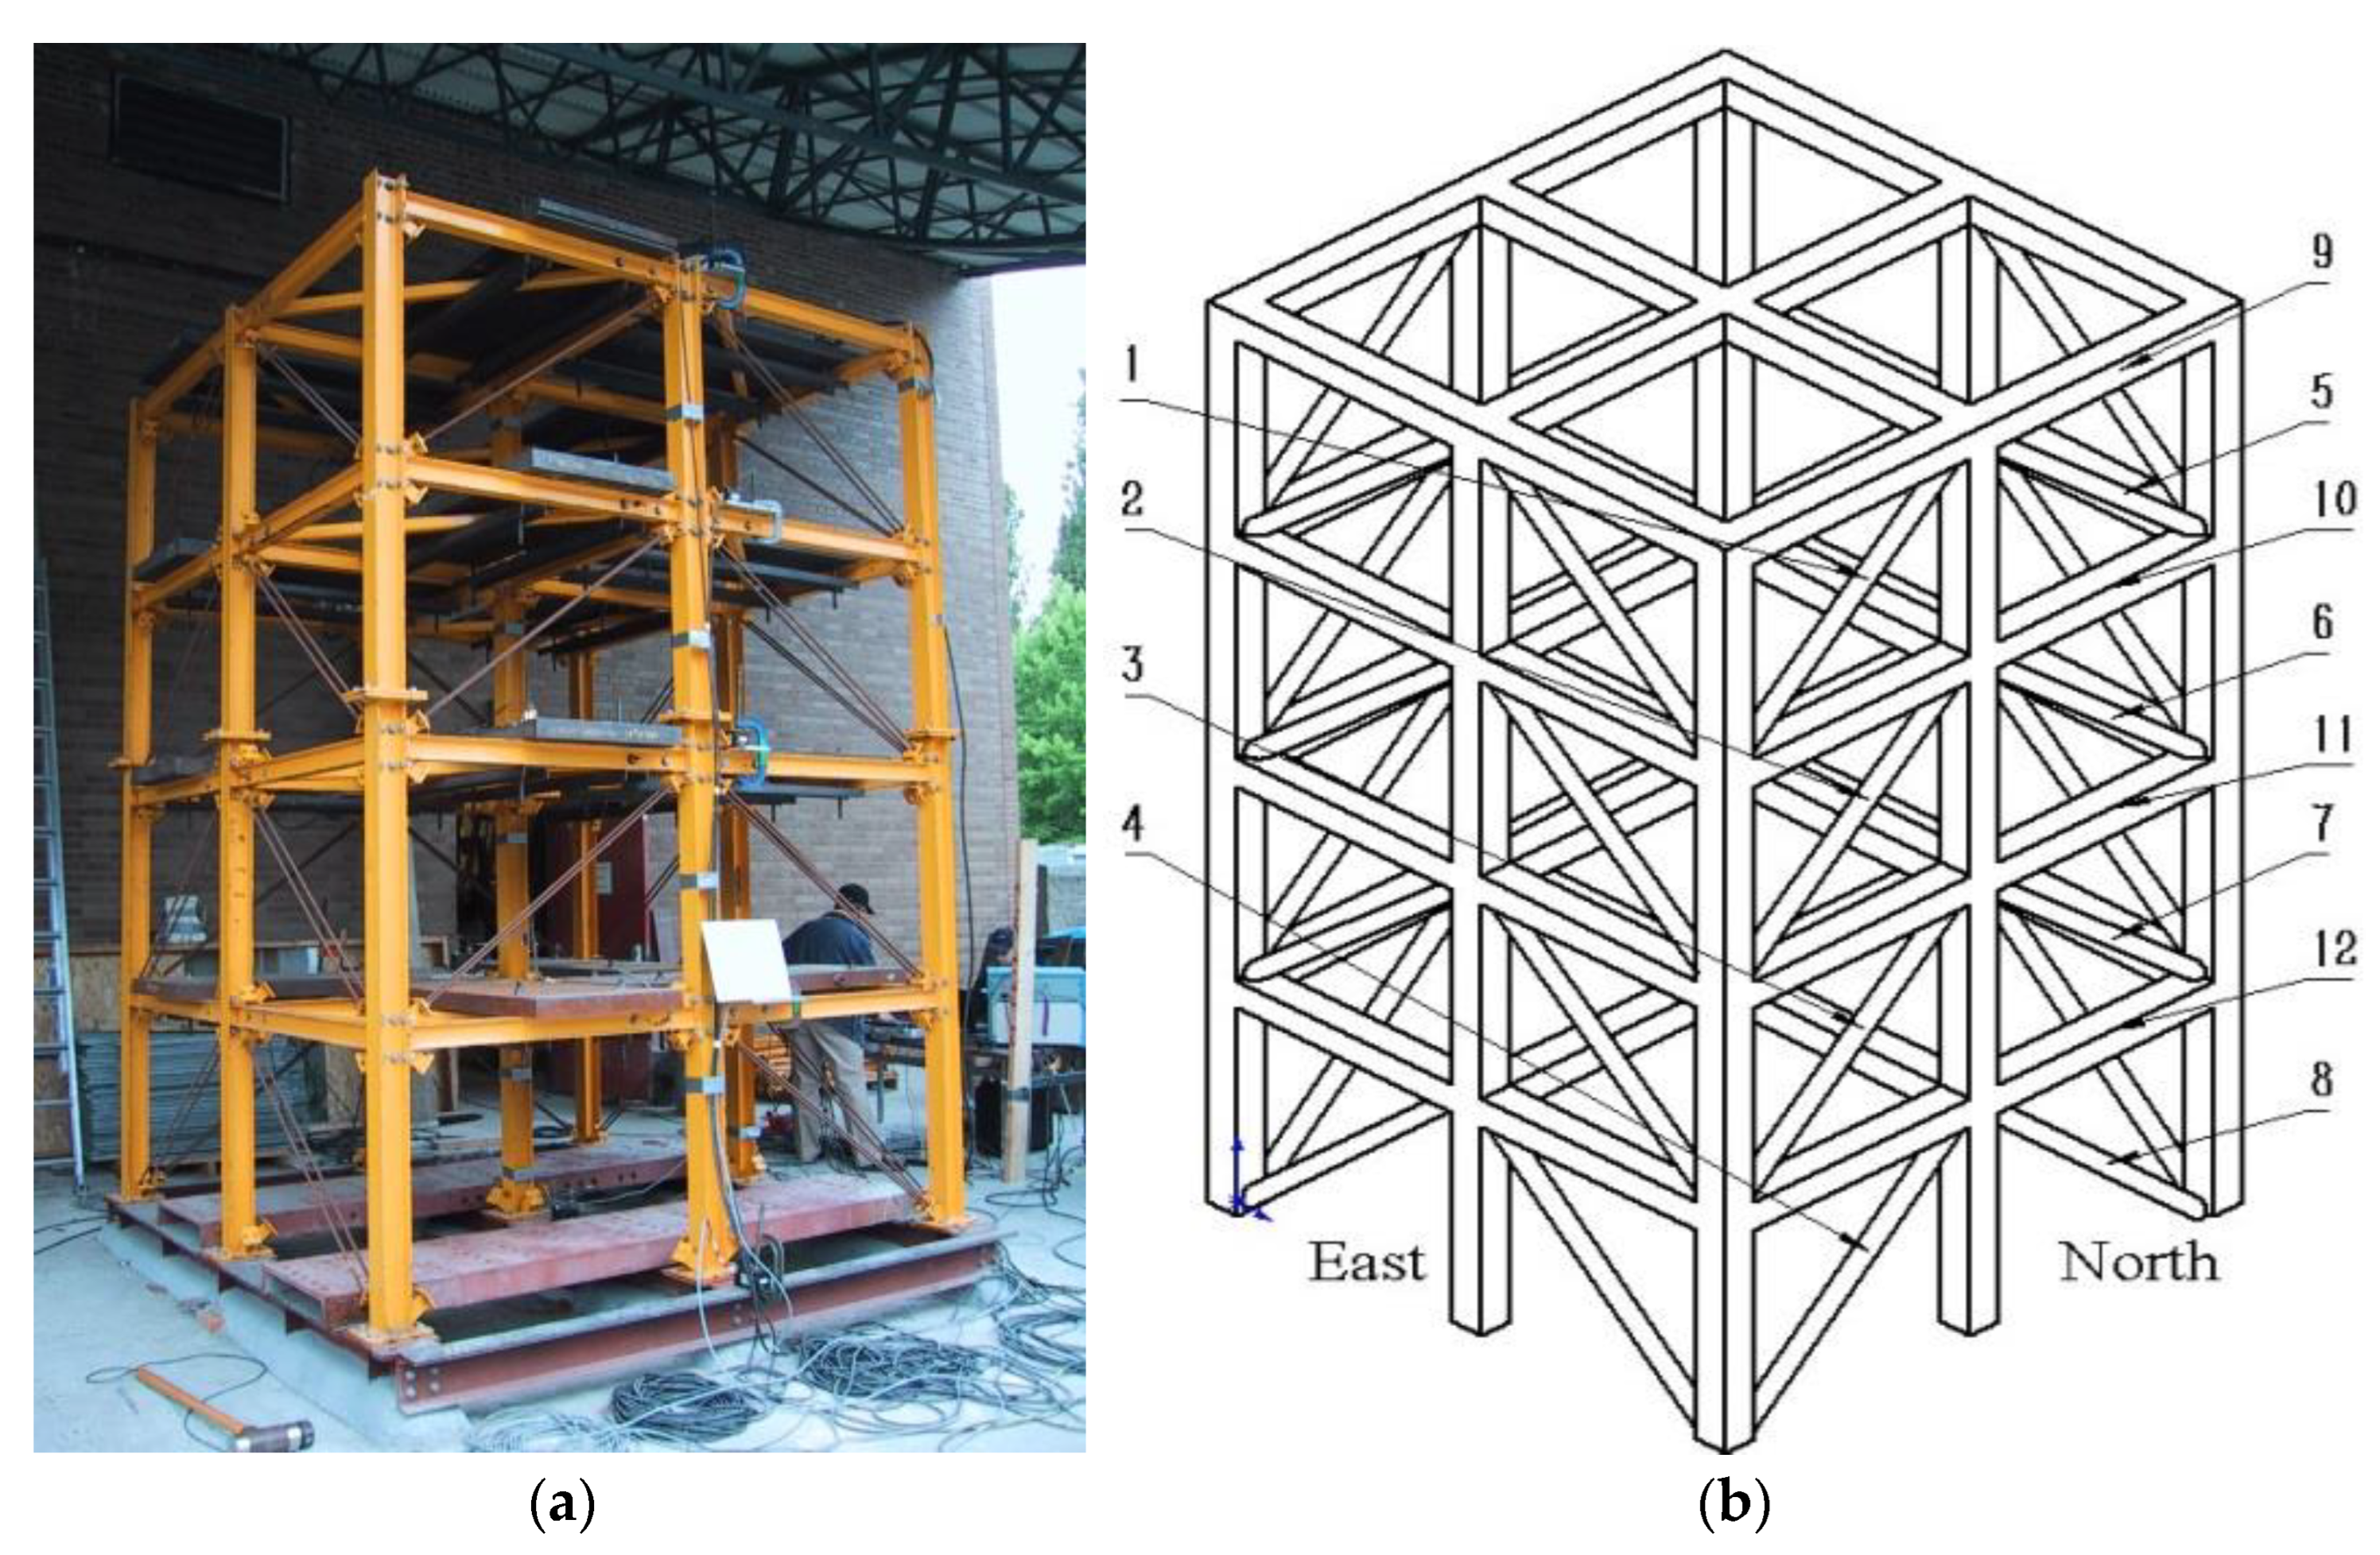
Figure 1. Building frame structure model. (a) Picture of frame structure, (b) 3D model of frame structure.
Applsci 12 12411 g001
Figure 2. Fault diagnosis process of building frame structure.
Applsci 12 12411 g002
Figure 3. Principle of adaptive wavelet decomposition and recombination.
Applsci 12 12411 g003
Figure 4. Wavelet decomposition and reconstruction of signals. (a) Decomposition signals, (b) reconstructed signals.
Applsci 12 12411 g004
Figure 5. CEEMDAN decomposition of vibration signal.
Applsci 12 12411 g005
Figure 6. WDCNN model and its output parameters.
Applsci 12 12411 g006
Figure 7. LSTM structure.
Applsci 12 12411 g007
Figure 8. Training curve.
Applsci 12 12411 g008
Figure 9. Confusion matrix.
Applsci 12 12411 g009
Figure 10. TSNE clustering results.
Applsci 12 12411 g010
Table 1. Five damage locations.
CasesSpecific Damage Locations
1No damage
2Remove structures numbered 1–8 on the east side
3Remove structures numbered 1–4 on the east side
4Remove structures numbered 1 and 4 on the east side
5Remove structure numbered 1 on the east side
Table 2. Structure parameters of model network.
Layer TypeKernel SizeStrideChannel SizeOutput SizePadding
Convolution1641616256 × 16yes
Pooling12216128 × 16yes
Convolution23132128 × 32yes
Pooling 2223264 × 32yes
Convolution 3316464 × 64yes
Pooling 3226432 × 64yes
Convolution 4316432 × 64yes
Pooling 4226416 × 64yes
Convolution 5316416 × 64yes
Pooling 522648 × 64yes
LSTM1100 1100 × 1
Dropout0.6
LSTM250 150 × 1
Desne10 110 × 1
Softmax5 15
Table 3. Accuracy.
Table 3. Accuracy.
MethodNo Noise−4 dB−2 dB0 dB2 dB4 dB
WDCNN0.77990.43640.53210.657870.65230.7012
WDCNN + LSTM0.98640.88010.88360.89320.98020.9863
CEEMDAN + WDCNN
+ LSTM
0.99980.98540.98990.96030.99870.9991
1-level Wavelet decomposition + the proposed method1.00000.99971.00001.00001.00001.0000
2-level Wavelet decomposition + the proposed method0.99950.99370.99510.99860.99910.9997
3-level Wavelet decomposition + the proposed method0.99910.99210.99450.99830.99860.9993
4-level Wavelet decomposition + the proposed method0.99870.99170.99370.99790.99810.9989
5-level Wavelet decomposition + the proposed method0.99400.99160.99230.99680.99810.9987
Table 4. Loss.
Table 4. Loss.
Noise SituationNo Noise−4 dB−2 dB0 dB2 dB4 dB
WDCNN0.24563.17142.53210.757870.62560.6213
WDCNN + LSTM0.07850.12650.10130.09650.07980.0776
CEEMDAN + WDCNN
+ LSTM
0.00010.00340.00230.00030.00030.0001
1-level Wavelet decomposition + the proposed method1.6 × 10−63.5 × 10−48.1 × 10−56.0 × 10−51.1 × 10−59.7 × 10⁻⁶
2-level Wavelet decomposition + the proposed method0.00710.01700.01460.00760.00740.0071
3-level Wavelet decomposition + the proposed method0.01640.01870.01670.01560.01110.0166
4-level Wavelet decomposition + the proposed method0.02110.03910.03600.02610.03860.0226
5-level Wavelet decomposition + the proposed method0.04360.06450.05370.05080.05010.0512
Publisher’s Note: MDPI stays neutral with regard to jurisdictional claims in published maps and institutional affiliations.