1. Introduction
For many years, the abnormal vibration of the machine-tool structure has been a concern of the industry and an undesired phenomenon during machining processes, which are often due to improper design of the structure. When an improperly designed machine-tool structure is fabricated, stresses will usually be concentrated on some parts or locations, which result in insufficient structural stiffness and strength, and it can often only be utilized under worse cutting conditions.
Since the structural components are often widely joined in the form of bolted connection, and the contact interface has different degrees of friction, tensile and compressive stresses, the local rigidity and damping of the contact interface are discontinuous and have a complex nonlinear dynamic response. Therefore, the modal parameters relating to contact interface of the bolted connection have great significance for the dynamic research of the machine-tool structure.
Usually, the machining vibrations will be transmitted to the ground by machine-tool parts. The vibration transmitted reversely back from the ground and the interference vibration of the motor-driver may be regarded as the main sources of the vibration of the whole machine-tool. Hence, the vibration of the machine tool must be suppressed to reduce the dynamic error during machining processes. Among them, the bending or torsion vibration usually represents the most common vibration mode of the whole machine-tool, and the dynamic characteristics of the bending or torsion vibration are largely affected by the rigidity of the foundation interface. Therefore, the correct structural design and rigidity identification are very important.
Kono et al. (2015) came up with a new procedure to adjust the machine-tool support based on its contact stiffness, without the usage of anchor bolts. The idea is to adjust the three-support placement on a rectangular base so that the first natural frequency of the machine-tool is elevated, making the overall stiffness higher, but still preventing the machine-tool from rolling over. For starters, a small-medium sized machine-tool model is designed, and the bulk stiffness on the base is calculated. The main protocol is to choose an appropriate placement for the first two supports based on the bulk stiffness previously calculated. Usually, the first two supports are placed in either the left or the right side, while the remaining will be placed across the two, with size proportional to the preload. Through FEA, this method is proven to improve the support stiffness up to the stiffness when four-support is used [
1].
Kono et al. (2013) broadened the scope of the contact stiffness configuration suggested by Shimizu et al., aimed at defining the contact stiffness in both normal and tangential directions of the surface of machine-tool support. The contact stiffness is mainly acquired as the result of multiplying the unit contact stiffness with the real contact area. After thoroughly analyzing the concrete’s contact stiffness and the interactions with various metals, such as S50C, SS400, and FC250, Kono et al. concluded that the stiffness on the contact area between the machine-tool support and floor is measurable. They found that concrete is the main source of contact stiffness between metal and concrete surfaces, wherein unit contact stiffness is less than 0.1 of metals [
2].
Kono and Mori (2018) established a procedure to assess the floor stiffness based on the model developed for machine-tool support subject to the preload on the contact surface due to difficulty to duplicate the existing floor to measure support stiffness. After establishing the preload–stiffness relationship for the model on the floor, the natural frequency is calculated in terms of translational vibration in the vertical direction, disregarding the insignificant effect of bulk stiffness. The preload–stiffness relationship is acquired from the calculation on the model with various weight. The contact stiffness coefficient is then established by placing the model into the data from the observation. The difference in surface topography is observed by comparing two types of floor texture using the proposed mechanism. The contact stiffness of the floor covered with glass coating is 455% higher in contrast to the floor covered with polymer [
3].
Mori et al. (2015) combined the support stiffness model into finite element analysis in order to obtain the rocking vibration mode simulation. The support stiffness model acts as a base in calculating the support stiffness of a prototype from a machining center. The support placement in the simulation is decided based on the stiffness tuning technique. In the simulation to obtain the rocking vibration, the support stiffness is modelled as three-dimensional springs, based on the previous calculation. As verification, a comparison is made between the simulation with the developed model, the simulation without support stiffness, and an experiment. Results show that the natural frequency of the simulation without support stiffness differs above 19%, in contrast to the one with support stiffness, which is under 10%. The rocking vibration modes obtained from the simulation are in parallel with the one obtained from the experiment, showing a higher accuracy obtained when the support stiffness model is involved in FEA [
4].
Yang et al. (2003) enhanced the joint parameter identification procedure by combining the substructure synthesis procedure and the frequency response function (FRF), suggesting a matrix form for the joint model. This procedure is applied in the finite element method on a beam with one end constrained, proving that the joint parameters could be identified using only two measurement points. Results show that FEM is capable of modelling and simulating a properly identified joint parameter on a constrained beam, which also has been verified with an experiment, giving an accurate result that highly influences the parameters. The screw joint rotational stiffness has been found in a sensitive region, while the translational stiffness result is not as accurate, but not so influential towards the simulation result. This method is able to improve the FRF simulation accuracy in the high frequency region due to the cross-coupled term found between the translational and rotational stiffness of the suggested matrix form model [
5].
Liu et al. (2019) investigated the effect of a pretightening sequence of anchor bolts on the pretightening state based on the influence of elastic interaction. The anchor bolt pretightening force calculation model is developed analytically, and it is applicable to the three-bolt joint and the n-bolt joint. The structural deformation of a machine bed is expressed in various pretightening sequences by developing an analytical–deformation model. The discrete strain values are designated as the boundary conditions of the model. The particle swarm optimization method is applied to define any unclear correlation parameters. This enables various machine bed configurations to be measured analytically. Finally, two conventional pretightening sequences of anchor bolts are applied for large lathe bed installation as the verification method. After comparison with the result calculated with an autocollimator, the anticipated deformation of the guideway in various pretightening steps showed good consistency. A uniform deformation of the machine bed could be assured from the pretightening sequence from the middle to the sides. In short, the procedure of pretightening for anchor bolts heavily affects the quality of machine bed installation [
6].
Chang et al. (2020) combined MSTMM (transfer matrix method for multibody systems) and fractal theory, while developing an advanced model, to calculate joint interfacial contact stiffness. In order to facilitate plastic interaction issue, the Stronge contact model is applied, improving the translational model. Similarly, the elastic interaction force is facilitated through the application of the Hertz theory. The domain extension factor is also applied in order to facilitate microcontact size distribution. By combining these three theories, an enhanced translational contact stiffness model and the first rotational contact stiffness model are established. The dynamic model for the ultra-precision machine-tool is also arranged by joining both the transfer matrix method for multibody systems and fractal theory. After observation, the joint between the column and lathe bed is more sensitive due to the maximum vibration displacement of the two joint surfaces, which rise up to 1.74% and 2.90%, respectively, when the preload of both joints is decreased by 15%. In conclusion, when the preload is decreased, the interfacial joint will vibrate more strongly [
7].
Wang et al. (2017) incorporated the influence of the surface roughness interaction onto the fractal contact stiffness model, especially for mechanical joints. The surface deformation is assessed based on the elastic theory. Hertz contact theory and fractal theory are both applied to obtain further derivation concerning the relationship between surface stiffness, normal load, and contact area. A fractal model is then used to observe the effect of the contact surface roughness, acquiring fractal smoothness. After taking the derivative of the total load, the normal contact stiffness of the mechanical joint is formed, and the fractal parameters are investigated with the intention to enhance the joints’ rigidity. As the fractal dimension D rises, the fractal surface roughness inclines, resulting in escalation of both the joint stiffness and the effect of contact surface roughness, which also enhances the effect of the normal contact stiffness. The developed model is also able to represent the real load–stiffness relationship [
8].
Jorobata and Kono (2020) introduced a new approach called the cutter mark cross (CMC) method in order to make the real contact area become uniformly distributed and to also enhance the contact stiffness. The waviness condition required to make the real contact area become uniformly distributed is determined based on the plastic deformation, enabling one to control the distribution of real contact area. An experiment was then conducted as the verification, discovering the influence of the contact stiffness on the distribution of real contact area. This method is effective in improving both horizontal and vertical contact stiffness up to grinding finished quality. The stiffness in the outer perimeter is also bigger than in the centre [
9].
Zhao et al. (2018) observed the effect of preload on bolted joints on the natural frequencies, and its correlation to contact stiffness, proposing a new estimation procedure for the contact stiffness of bolted joints. Research shows that the rise of the preload on the surface with bolted joints also increases the first six modes of natural frequencies. The first natural frequency increased with the increasing of number of loading due to work-hardening from numerous loading–unloading cycles. A thin layer element acting as the surface contact stiffness is used in the FEM simulation, exhibiting similar a result to when the stiffness of the thin layer elements is changed. After examining the differences of the natural frequency in both experiments and FE, the quantitative regularity of bolted joints’ contact stiffness is determined. The relation between contact stiffness and bolt preload is assessed while also incorporating the significance of each natural frequency. After verification with experimental data, the error of the all-natural frequency estimation is less than 3%, while the error related to contact stiffness estimation is less than 5% [
10].
Li et al. (2021) introduced a prospective non-linear modelling of bolted joint interface by enhancing the Iwan micro-slip model, which is also used in a quasi-static experiment to classify the micro-slip model parameters. The annularly shared spatial dispersion along the bolted joint contact surface influence the development of a new density function of the critical sliding force. The collaboration between the new critical sliding force density function, the Iwan micro-slip model, and the residual shear stiffness on the interface during macro-slip and separation are used to establish an enhanced micro-slip model. The developed micro-slip model is incorporated, along with the macro-slip model, replicating the tensile and compressive stiffness of the bolted joint and surface friction, thus obtaining the non-linear model of the bolted connection. A procedure to determine the specification of the micro-slip model is then established by further investigation of the hysteresis loops produced from the quasi-static shear analysis on the bolted join interface. It is observed that when there is no macro-slip, the Iwan model discharged the most energy, followed by the improved micro-slip model, which then ended with the macro-slip model, which does not discharge energy. The reverse characteristic could be observed when macro-slip occurs, corresponding to the equivalent stiffness when there is no macro-slip. The contact pressure dispersion has no important influence on the characteristic of the micro-slip hysteresis, therefore it could be viewed as constant [
11].
Shamoto et al. (2014) came up with a new procedure to forecast the contact stiffness and friction damping coefficient of bolted joints using an analytical method. Due to an unrealistic calculation period for a sticking/sliding contact surface, a torsional contact model over the bolted joint was proposed. The calculation algorithm is then arranged, firstly by solving the linear problem for the contact stress distribution. The torsional deformation is then obtained and analysed via the finite element method. The more complicated non-linear contact problems are then solved, one at a time, by linearly incorporating the FEM result. In the proposed method, the essential factors are: structural dimensions, bolt clamping force, material properties, and friction coefficient between the bolted joint [
12].
Tsai et al. (2020) investigated the analysis procedure for statistical contact pressure and stiffness distribution occurring between the shaft and bearing, as subject to the size distribution of the T&F (tolerance and fit) specification. The pressure distribution is analysed based on the T&F specification by a probability density function and convolution, while the contact pressure and stiffness occurring on the mating surface are analysed based on the interference. The illustration is made based on a 50 mm roller bearing on a Ø50H6/k5 transition fitting. Analysis showed clearance fit is highly possible, with a 0.5 µm gap expected, indicating contact stiffness loss, not as initially intended. In order to solve this condition, two methods applied: tighten the tolerance of the inner ring bearing, or increase the dimensional deviation of the shaft diameter. By tightening the inner ring bearing tolerance, the probability of interference through fabrication cost increases. Similarly, by increasing the dimensional deviation of the shaft diameter, the interference increases, while precision grade and fabrication cost are kept steady [
13].
Xu et al. (2014) suggested a procedure developed to predict the stiffness and stress distribution of a spindle-holder taper joint when it is subjected to clamping and centrifugal force. The conventional 7/24 taper joint of the BT50 spindle-holder is utilized to forecast the von-Mises stress on the contact surface of the model developed by FEM. The study shows that the von-Mises stress of the model is distributed non-linearly due to the holder’s clamping force. The end of the holder experienced a lot of stress when subjected to high speed of centrifugal force. Various clamping forces are applied, as well as stiffness, in both axial and radial directions, along with observed hysteresis cycles. Finally, the contact characteristics could be estimated. The suggested model is beneficial in determining the characteristics of the spindle-holder taper joint when subjected to various force circumstances during the machining process [
14].
Du et al. (2015) suggested utilizing an ultrasonic vibration for measuring the contact stiffness and pressure distribution occurring on a spindle–holder joint. The ultrasonic reflection coefficient resulting from ultrasonic transducer scanning on the taper joint leads to the estimation of the nominal contact area. Afterwards, the stiffness distribution and global radial stiffness are calculated. The ultrasonic reflection is then converted into contact pressure by a developed calibration curve. Finally, the influence of angle fitting error and clamping force were investigated and rooted to the developed ultrasonic method. As the characteristic developed based on a 7/24 taper joint, a commonly used BT 40 taper joint was studied. The clamping force increased as the contact area, contact pressure and contact stiffness rose. To the contrary, the angle fitting error rose with the decreasing of contact area, influencing both pressure and stiffness at the big end of the taper joint, which increased rapidly compared to the small end of the taper joint. During this period, the global radial stiffness firstly increased, followed by decrease. The global radial stiffness is better paired with a larger angle fitting error that is still in a permissible range (+0” to +26”). Angle fit error greater than +36” is also not suitable for a practical application of a taper joint due to the small contact pressure occurring on the small end [
15].
Since the rigidity of the ground footing interface is related to various factors, it is not easy to solve. With different stacking and moving positions of the subsystems, the stiffness of each footing along each direction will always be altered. Based on the previous studies, the methods used to estimate and adjust the interface stiffness of a machine-tool are highly complicated and impractical for industrial application. Therefore, a simple estimation and adjustment method for interface stiffness is necessary. A more suitable method to ensure that the appropriate rigidity can be properly adjusted should be developed, and, finally, the relevant interface stiffness should be identified. Therefore, it is necessary to constantly try to estimate and adjust the interface stiffness for obtaining the best dynamic characteristics of the whole machine-tool.
Therefore, estimation and adjustment of the interface contact stiffness of a three-axis machine-tool are investigated in this study. The contact model for each different contact interface is established firstly, and the initial value of the estimated stiffness on each different contact interface is calculated by the static analysis and deformation formula in the mechanics of material. The interface that has a great impact on the natural frequency variation of the whole machine-tool is determined through the comparisons between FMA and EMA results, subsequently, as each different contact interface of the initially estimated stiffnesses is prescribed on the interfaces. Finally, the adjusted method proposed in this study is applied for the stiffness adjustment on the main object interface, i.e., footing interface in this study. The error of the natural frequencies of the whole machine-tool between FMA and EMA is less than 5% after being completely adjusted, which indicates that the proposed method for footing interface stiffness adjustment is feasible and practical.
3. Approach Methods and Procedures
This study mainly focuses on the development of an adjustment method of the interface contact stiffness in the machine-tool. Among them, the contact interface manner can be further divided into three kinds, such as the linear–rail contact interface, the bolt locking interface, and the footing interface. Firstly, both the geometrical model simplification and the FE mesh convergence are performed to ensure the quality and efficiency for numerical analysis. Then, the hammer impact experiment on each subsystem of casting iron and the whole machine-tool for EMA is carried out. In addition, the deformation and strain of each contact surface, when subjected to the weights stacked above, are calculated by static analysis, in which the relationship between the stress and strain of the material is assumed, fulfilling Hooke’s law. Finally, the initial interface stiffness values at each contactor or joint interface may be estimated accordingly by the formula in the mechanics of material, and they are substituted into the interfaces of the whole machine-tool model for FMA, and the most influential interface stiffnesses are selected for further repeated adjustment by the proposed method until the error converges within the allowable range.
3.1. Experimental Modal Analysis
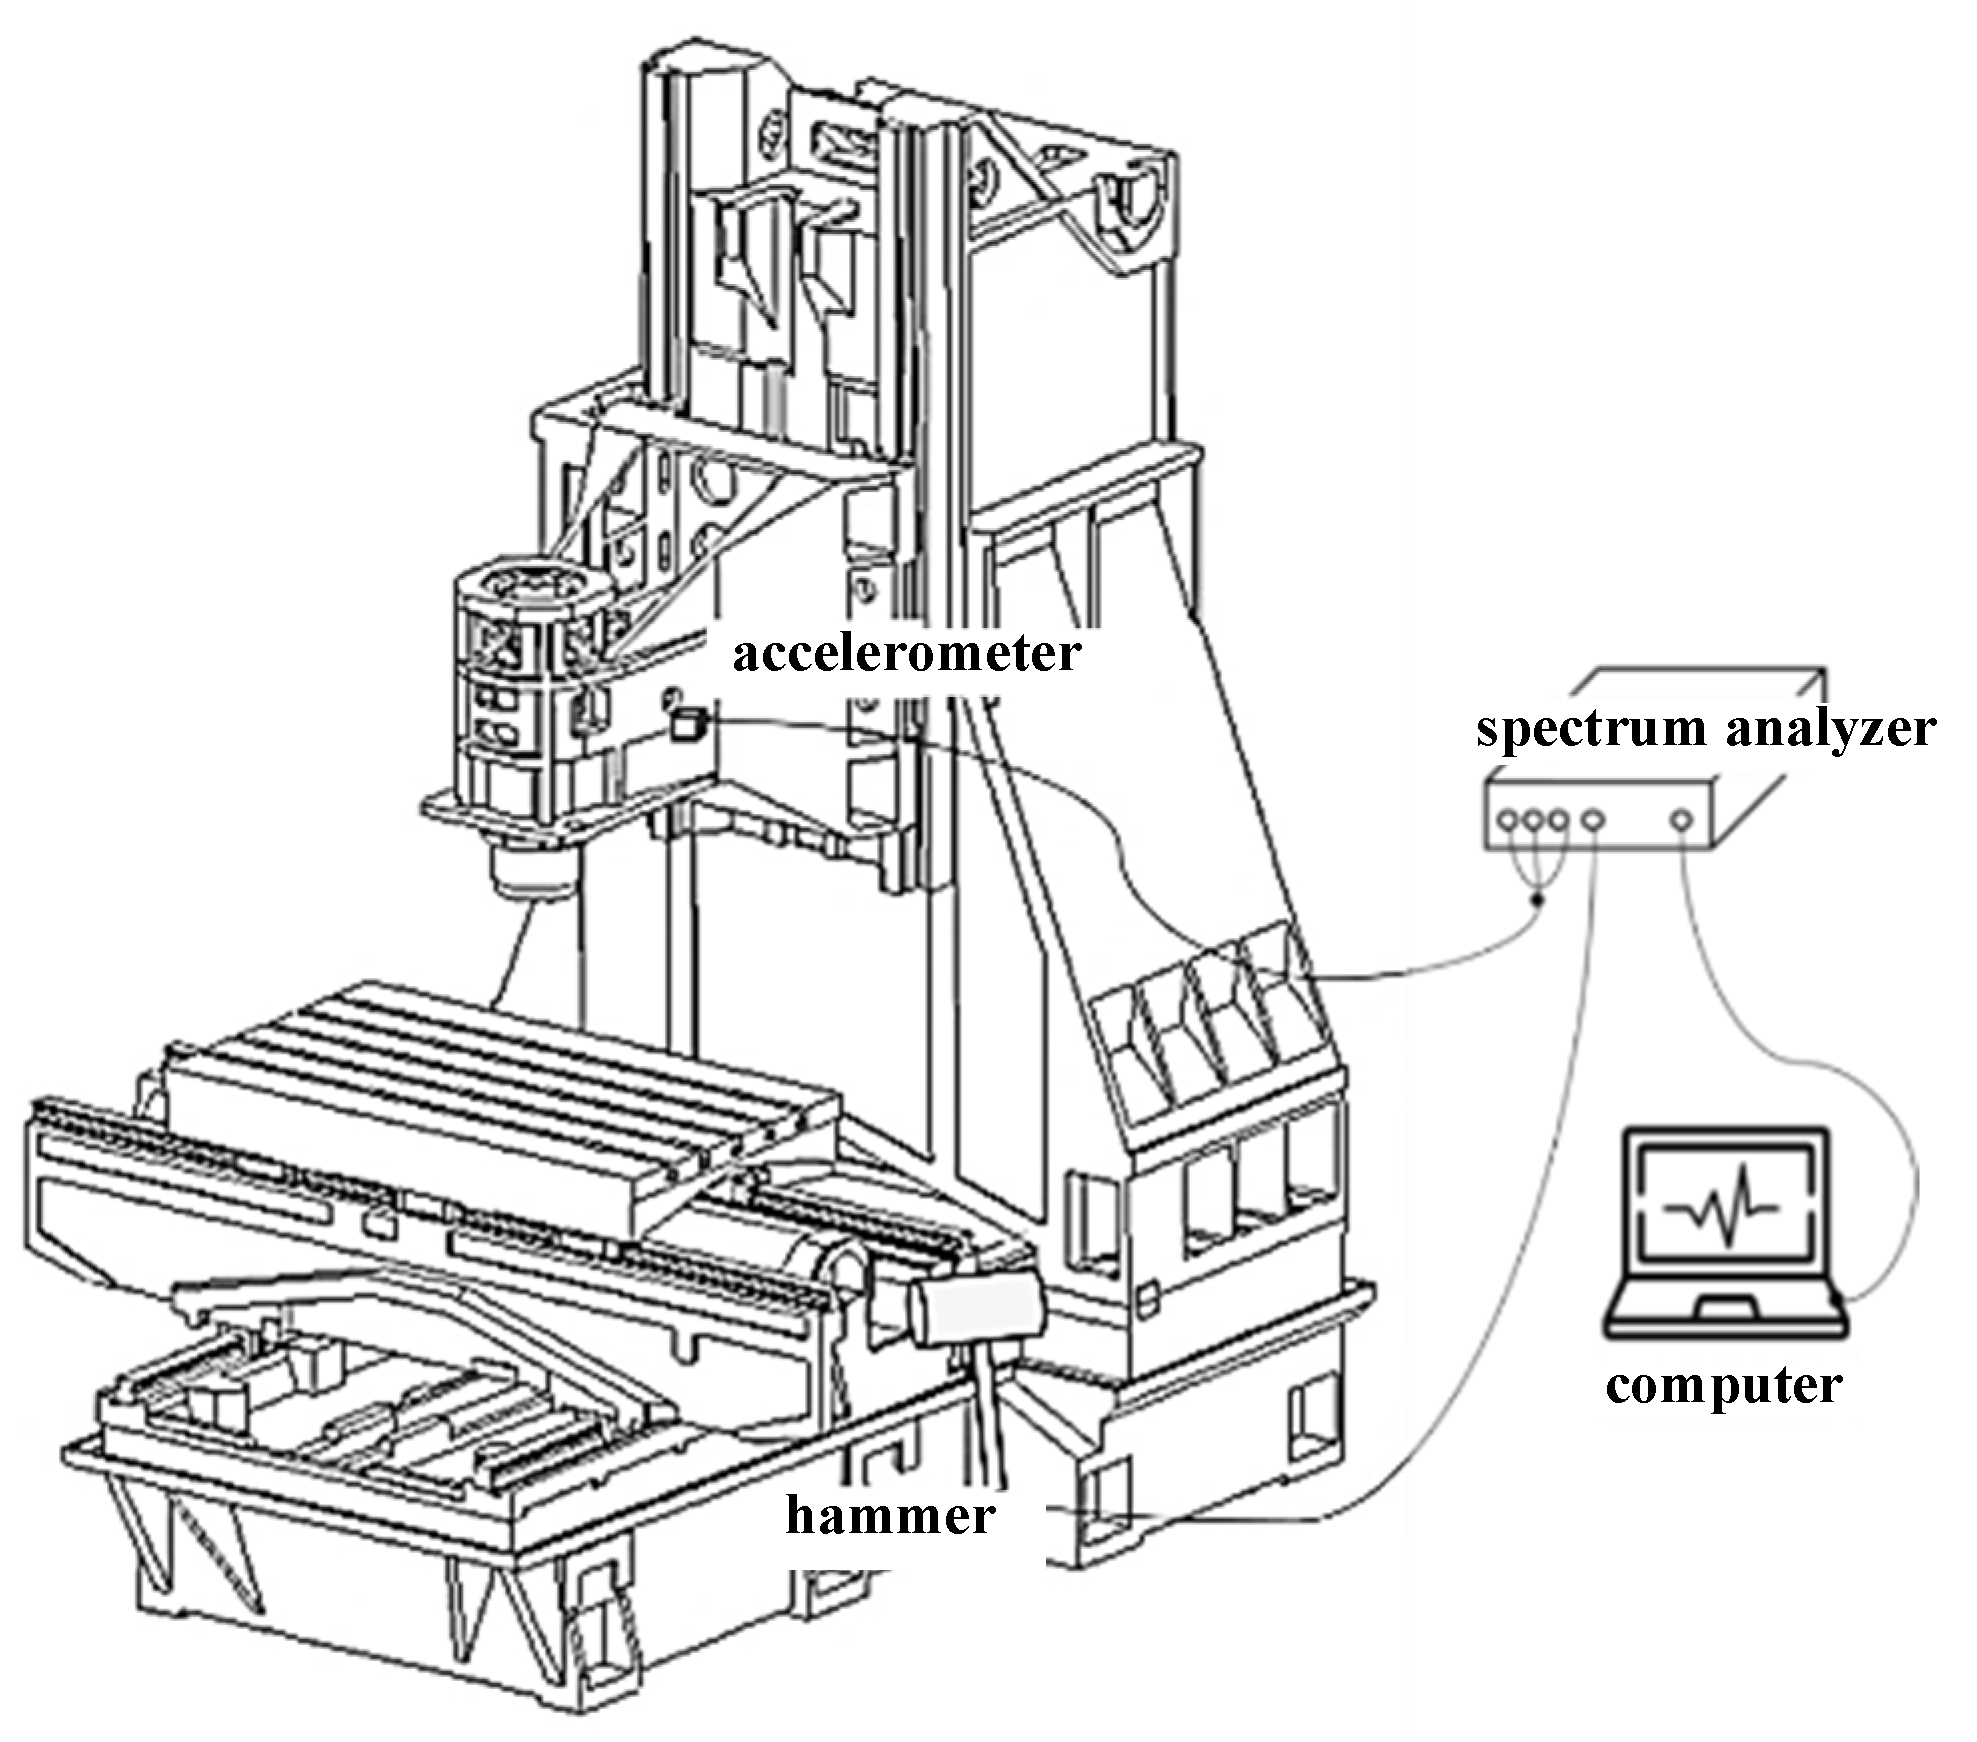
EMA is based on the state where the input/output signals of the system are known and utilizes the complete data of excitation (input) and response (output) for modal parameters identification and analysis. When the structure is stationary, the structure is excited by hammer impact, and the frequency response function between any two points is obtained by measuring the excitation force and response of the measuring point through the performance of a fast Fourier transform with a spectrum analyzer. The curve fitting is performed on the frequency response function obtained from the experiment by the modal analysis theory. As a result, the modal parameters of the structure can be obtained from the analysis results, and the corresponding modal shape of the structure can be established accordingly. The schematic diagram of the experimental set-up on a three-axis machine-tool is shown in
Figure 5. Here, the small size (B&K 2302-5) and large size (B&K 8208) of the impact hammer were used for impulse on a single subsystem and a whole machine-tool, respectively. Also, the signal acquisition and analyses of the system response were accompanied by a triaxial accelerometer (B&K 4506B) and spectrum analyzer (B&K 3560C), respectively. The single input and single output methods are adopted for structure excitation and response acquisition in this study, in which the single subsystem was suspended for excitation at free-free state while the whole-machine was placed on the floor.
3.2. Numerical Modal Analysis
FMA is carried out by the finite element method. The finite element method may divide the imported geometrical model into a finite number of elements. Each element is connected through nodes, and the characteristics of the entire structure are represented by a matrix form according to the energy rule. On behalf of the computer, the modal parameters of the structure are obtained after calculation. Therefore, the finite element method is often used in the design and development of the structure and the performance prediction after the optimization of the structure design. Furthermore, the data obtained by the finite element model under different states/conditions can be used as a reference for future structural modifications. The modal analysis method is used to predict the structural characteristics, which may avoid the expense of performing the test after the completion of the solid structure and can effectively reduce the production cost of the industry.
3.3. Geometrical Model Simplification
Before the FE analysis is carried out, the external features of the geometrical model are usually simplified, and the assembly holes or fillets and chamfers for part decoration, etc. are the simplified locations. The main purpose of this action is to reduce the geometrical model features that will not affect the analysis results and to ensure that the mesh operation can also be carried out smoothly. In the processes of simplification, it is necessary to pay attention regarding whether the geometrical model has broken surfaces. The broken surfaces and too many small features of the geometrical model may become the reason why the subsequent finite element meshing cannot be performed. In order to confirm whether the simplification is reasonable, a preliminary FMA can be performed on the geometrical model before and after the simplification. The natural frequency difference is used as a criterion for judging whether the simplified procedure should be performed or not. The results of the natural frequency difference before and after the model simplification of the saddle subsystem are shown in
Table 1.
3.4. Convergence Analysis
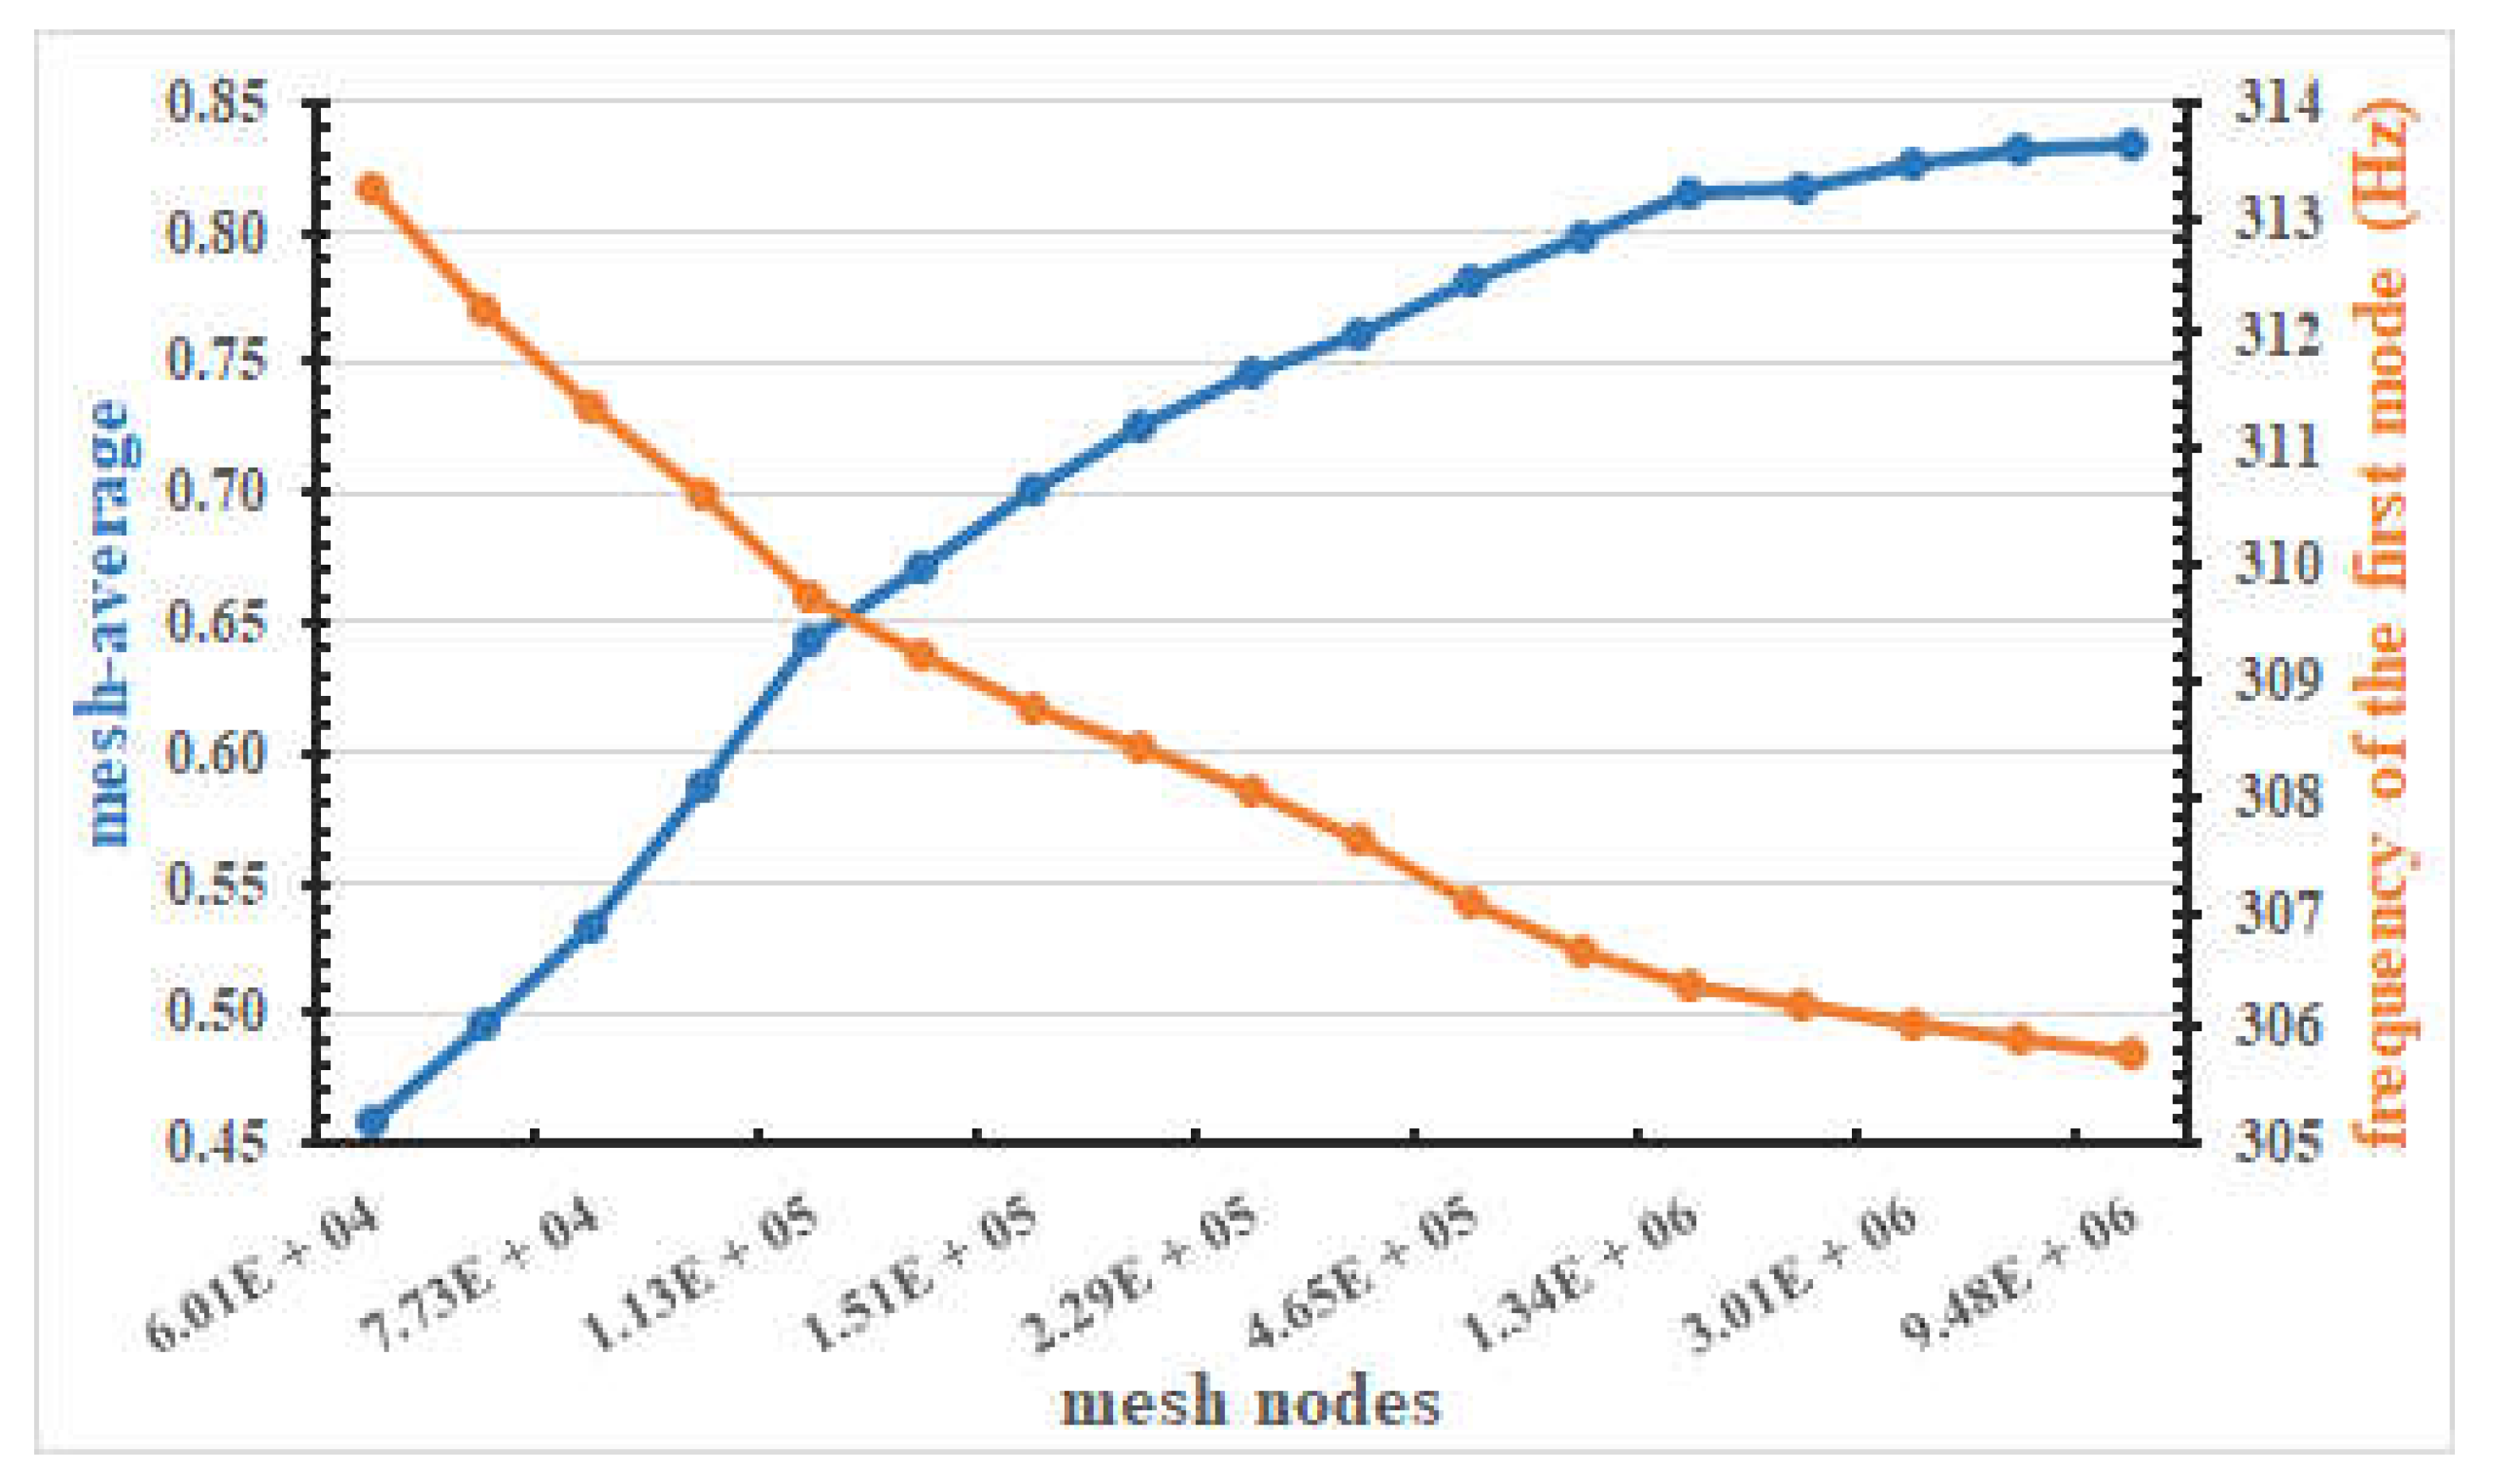
In order to ensure the stability of the FMA results, it is necessary to carry out a convergence analysis to find out the suitable element mesh size for different FE models of the body. In finite element analysis, the finer mesh will cause the computer to spend a lot of resources to solve the problem, and using a smaller mesh to grid the geometrical model may lead to unstable analysis results in the case of determining whether the solution will converge or not. In the ANSYS Workbench, the tetrahedral element is selected in the finite element mesh of the model, and the body sizing may be gridded sequentially in descending manner (element size from 50 mm to 7.5 mm in this study), and the related parameters of mesh-average and mesh nodes are deduced accordingly. Furthermore, the convergences of the 1st mode natural frequency results and the mesh-average associated with different element sizes are always noted as an index for mesh convergence judgement. The mesh-average parameter in the software for element mesh quality index is finally integrated as the basis for the selection and examination of a suitable element size fulfilling convergent demand.
Figure 6 shows the relationship between mesh-average, 1st mode natural frequency, and the number of nodes for the saddle subsystem. When the element mesh size is smaller than a certain size, the analysis results will begin to stabilize, that is, the natural frequency difference of the 1st mode shown in
Table 1 will begin to converge within a certain range. The tendency of mesh-average also approaches a certain value simultaneously. The suitable element mesh size is different from the various volume and construction of the part or subsystem, but the suitable mesh size and corresponding mesh nodes may be determined based on the parameter of the mesh-average. Usually, it can be found that the natural frequency difference of all parts or subsystems of the whole machine-tool falls within 1% when the mesh-average is around 0.8, approximately.
3.5. Identification of Material Parameter
Before the EMA is performed, the material of the analysis model will be assumed to be casting iron (FC300). Therefore, when compared with the EMA results, it can be found that there is a certain error in the FMA results. Therefore, it is necessary to modify the material property settings in analysis software for each part. The material parameter settings in analysis software are the material properties, such as density, Young’s modulus, and Poisson’s ratio. The material density is obtained by dividing the actual weight of the casting iron by the volume of the three-dimensional geometrical model, and the remaining material parameters may be obtained by using the optimization method, which is provided by the analysis software. The natural frequency obtained by EMA is set as the objective function, and the Young’s modulus and Poisson’s ratio are set as the modulation functions. The approximate material parameters of the actual material properties may be determined through the optimization procedures.
3.6. Interface Contact Model
Since the three-axis machine-tool is composed of several key parts, the interface joint stiffnesses has a certain effect on the dynamic characteristics of the whole machine-tool. Therefore, the interface stiffness identification should be carried out essentially for the interface of the joint parts. The static and modal analyses on the FE model are performed by the analysis software to find out the interaction relationship among the contact interfaces and the dynamic characteristics of the whole machine-tool structure, respectively. First, the initial value of interface stiffness is calculated for each contact surface by static analysis. These initial values of interface stiffness are set on each different interface in the analytic model for FMA in sequence. From the analysis results, the interface that has the greatest impact on the natural frequency variation of the whole machine-tool can be determined consequently. This interface is regarded as the main adjustment object, and the interface parameters may be identified by the proposed method in this study in interface stiffness adjustment processes.
Since the machine-tool is progressively assembled together through part stacking, there are different forms of contact interface of the joint parts. The contact interface can be divided into footing–ground contact interface, column–base bolted joint interface, and the contact interface of the slide block and the rail for the saddle/work table/head subsystem combination. This section defines the interface contact models for the combination of each contact interface, as shown in
Figure 7. As mentioned above, the initial stiffness value of the interface is calculated by a simple formula through the stacked self-weights, inducing reaction force on the interfaces.
4. Result and Discussion
The results of FMA and those of EMA were compared and verified, the differences between these two results were analyzed, and the former’s model was usually modified based on the latter’s results.
4.1. Model Verification
The natural frequency results between FMA and EMA of all key parts or subsystems of the whole machine-tool are all mostly below 5%, and the numerical modal shapes of all these single parts or subsystems basically may match those of experimental analyses well. It is indicated that the three-dimensional geometrical model has dynamic characteristics, being similar to the real model, and the degree of freedom of the model is verified to be sufficient. Hence, these three-dimensional geometrical models are used for subsequent analyses.
4.2. Evaluation of the Footing Interface Stiffness
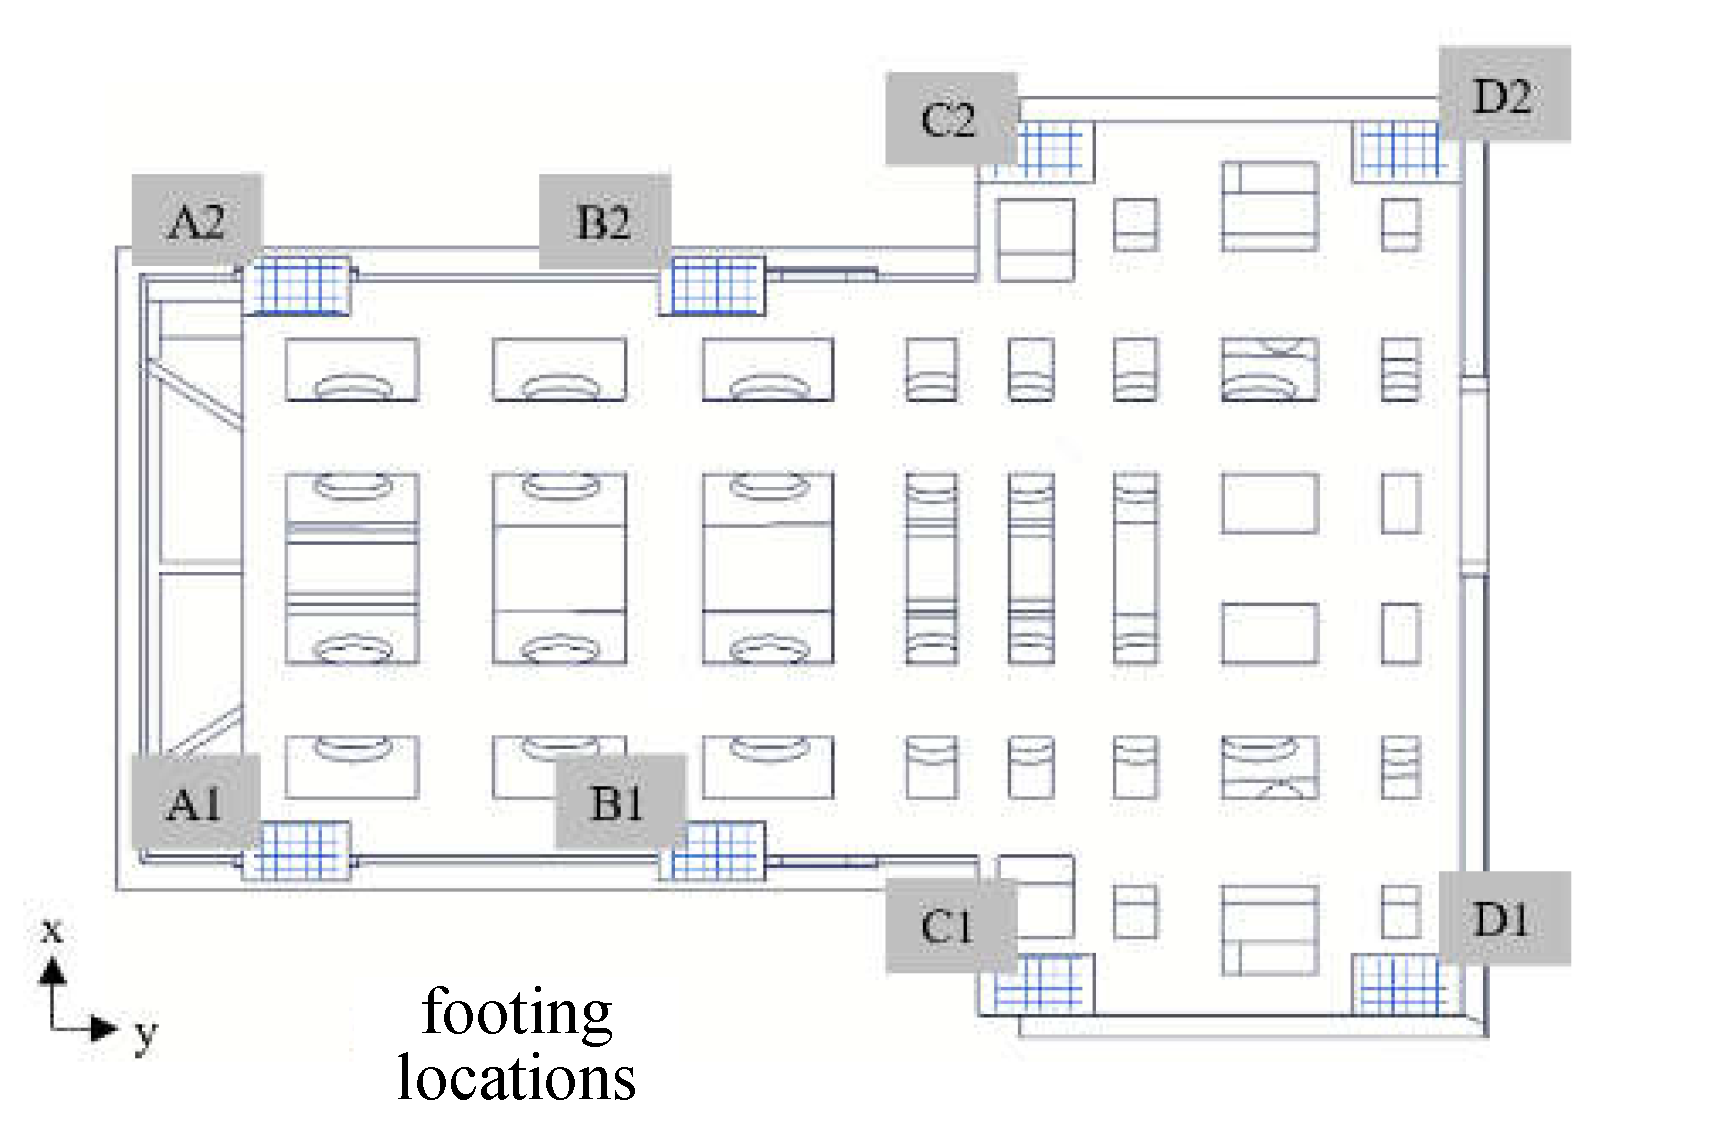
Individual assumptions are made in this study for each footing location of the footing–ground contact interface, which is different from the previous study of the complete fixing, or wherein the same interface stiffness values were set for all footings. Through the analysis, it can be determined that loadings on each footing may be different when suffering from the self-weights stacked above in the whole machine-tool, i.e., the loading on each footing will be different due to the temporarily moving positions of the stacking subsystems. Therefore, interface stiffness with different values for each footing location is assumed for numerical analysis in this study, as shown in
Figure 8, in which there are, in total, eight footing locations beneath the base subsystem. The footing locations are noted with the following numbering: A1, A2, B1, B2, C1, C2, and D1, D2, respectively. The purpose of this assumption is to approach the real contact behavior investigation so that a better finite element model can be explored.
4.3. Estimation of the Interface Stiffness
The initial value of the interface stiffness is estimated by the deformation formula in the mechanics of material, i.e., the static analysis is performed on the three-dimensional geometrical model after pre-processing, and the gravitational acceleration of −9.8 m/s
2 is applied along the Z direction of the FE model. The reaction force on each interface is thus deduced, which in turn is regarded as an external force applied on the interface. The deformation is induced consequently by this external force application. Based on the above concept, the results of deformation and strain on each interface can be obtained from the static analysis, and the initial values of the interface stiffness are thus estimated by the deformation formula in the mechanics of the material. Taking the interface stiffness of the footing as an example, the change, γ, of the natural frequency of the whole machine-tool between the simulation results with the estimated interface stiffness and those without the interface stiffness, is shown in
Table 2. Thus, the change,
γ, of the natural frequency obtained from the FMA, is defined as
4.4. Influence of Each Different Interface Estimated Stiffness
The interface stiffnesses of all contact surfaces obtained from the preliminary estimation are used for further analysis, i.e., the initial values of the interface stiffness for each different contact surfaces is set on the corresponding interface in the analysis software for FMA, and the contact interface that has the greatest impact on the overall natural frequency variations of the whole machine-tool may be determined, which may be regarded as the main object for interface stiffness adjustment. The change of the natural frequency of the whole machine-tool caused by different individual interface stiffness addition is shown in
Table 2. Here, the change, γ, of the natural frequency, is calculated from Equation (4).
After comparisons are made from this table, it can be observed that the addition of the footing interface to the whole machine-tool FE model has the greatest impact on the natural frequency variations of the whole machine-tool. On the contrary, the additions of the other interface stiffnesses result in no significant variations on the natural frequencies of the whole machine-tool. Therefore, it is reasonable to speculate that the stiffness of the footing interface is the interface that mainly affects the dynamic characteristics of the machine-tool structure.
4.5. Contact Stiffness Adjustment
In the numerical modal analysis module of the analysis software, all contact interfaces are established by the corresponding contact models for each different joint interface, and the initial stiffness values estimated are substituted into these models just mentioned above. The parameterization function of the software should be used for footing interface adjustment. The stiffness values of the footing in all directions are set by parameterization methods. As a result, the parameterized footing stiffness value becomes the input of the simulation system, and the natural frequency analysis result is the output of the simulation system.
The finite element model is constructed from the design drawings, and there are some differences with the real structure. Moreover, this study does not account for the interface stiffness for the lead screw and transmission shaft. Hence, the corresponding results of the modal shape between FMA and EMA of the whole machine-tool model will be slightly different. Therefore, based on the modal shape results of the experimental modal analysis, the corresponding modal shapes are determined from the first 12 modes of the FMA results, with very similar vibration manner to EMA for this existing difference. The related error deduced between them is defined in Equation (5).
Table 3 shows the comparisons of the natural frequency of the whole machine-tool between these two analyses for the six corresponding modes.
It can be observed that the mode numbers are not exactly the same in terms of correspondence, while the EMA and FMA have the similar modal shapes. The calculation results of FMA do not just fall within the first six modes corresponding to those of EMA exactly in this study, which is presumed to be the reason for the boundary condition setting or some uncertain factors in the simulation. This results in modal shapes obtained from FMA that may not match those of the same mode number of EMA properly due to the setting of the boundary conditions, which cannot completely fit the real situations. Therefore, the corresponding mode numbers shown in
Table 3 will be referred for the error comparison between EMA and FMA as the footing interface stiffness is adjusted in the subsequent analysis.
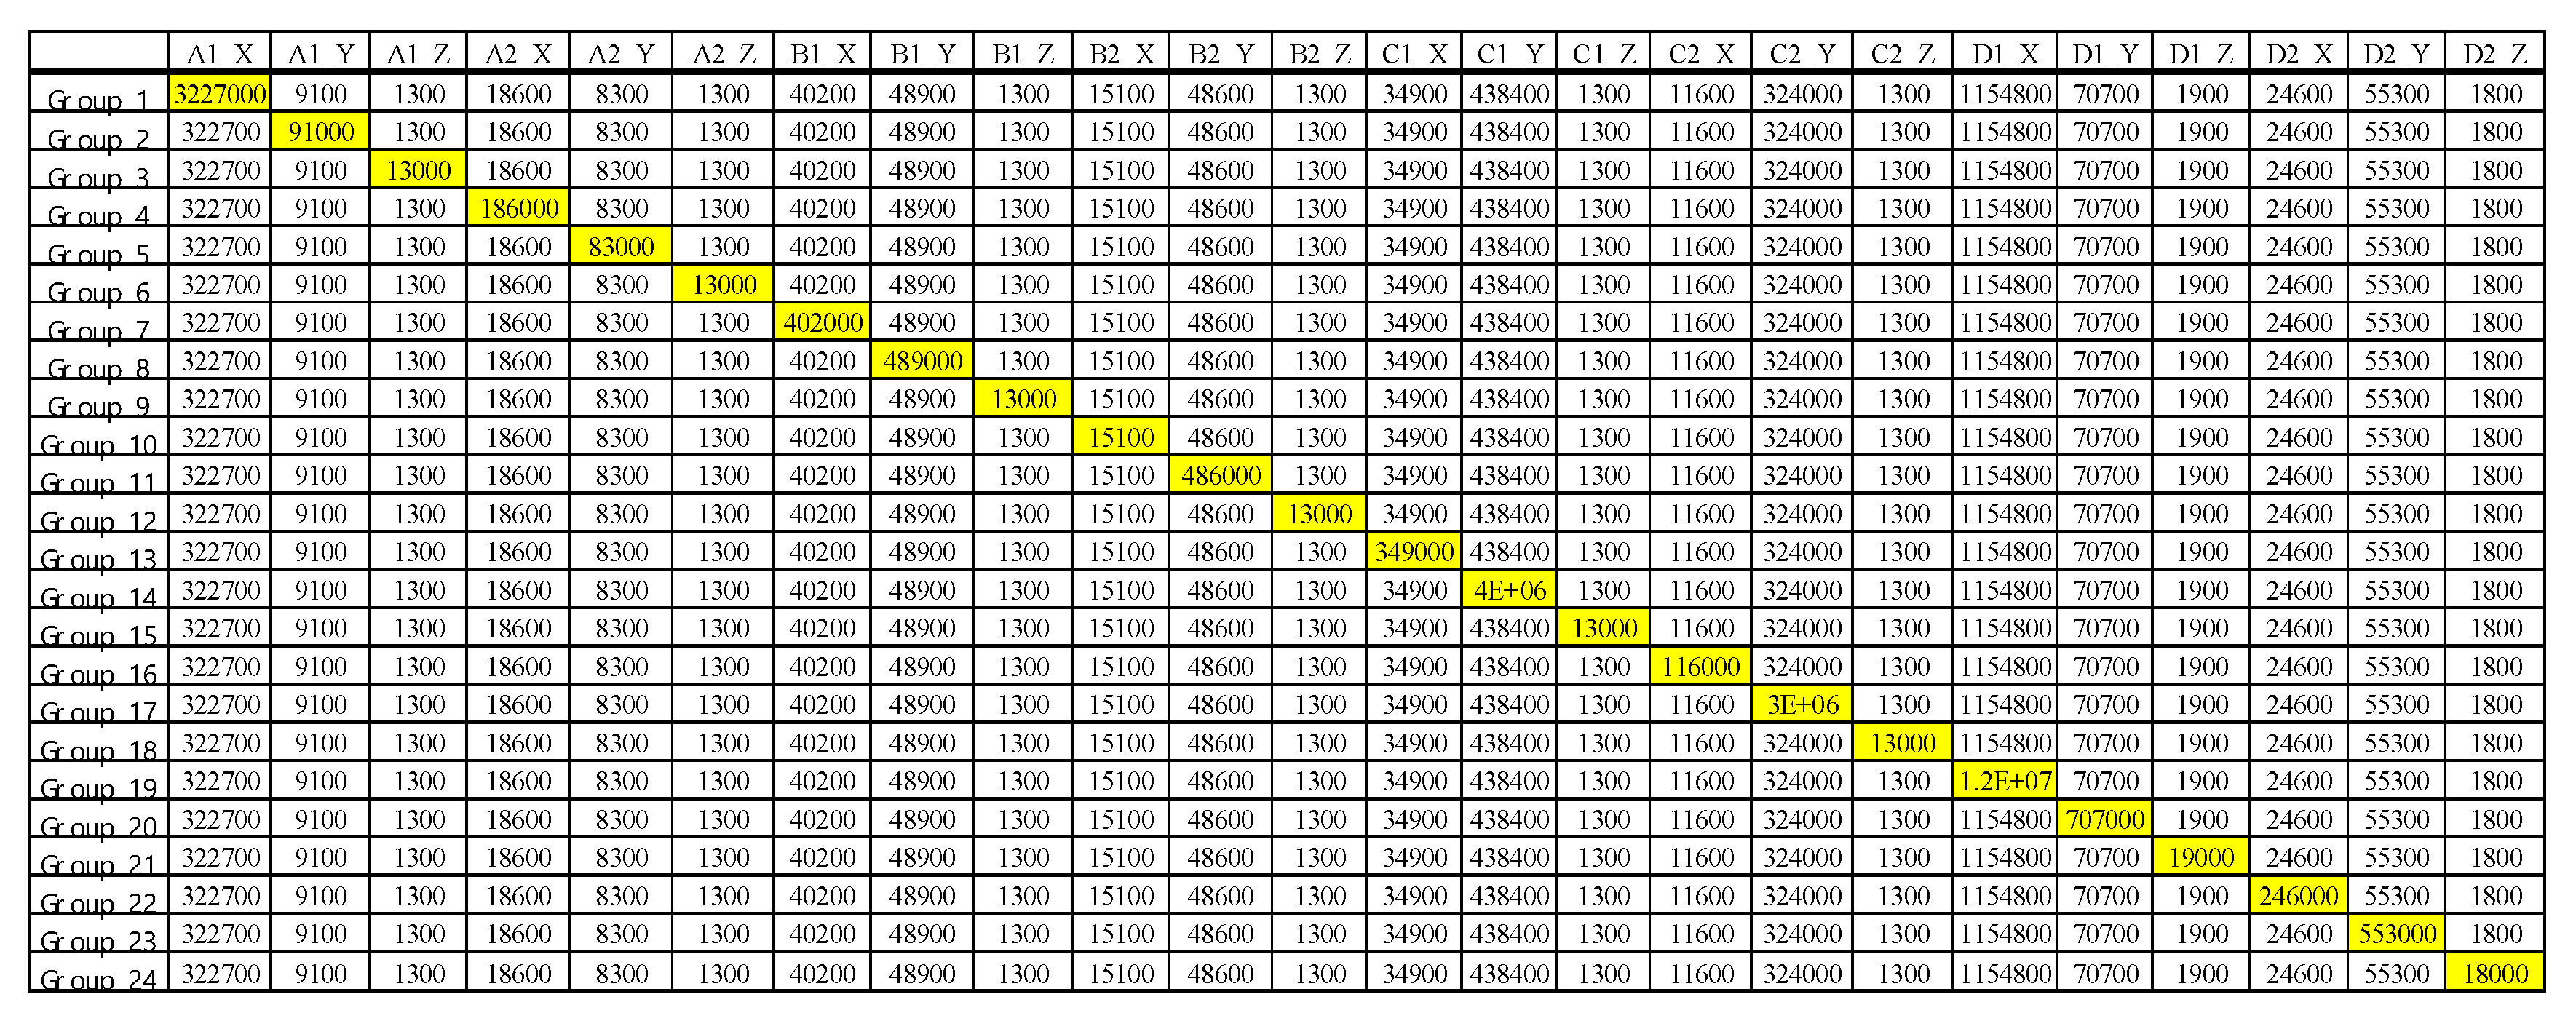
The interface stiffness adjustment method applied at this stage may not only improve the shortcomings of the traditional try-and-error method, but it also may be easy in use. The proposed adjustment method may make the adjustment toward the solution processes and make the error converge logically. In this specific methodology, the estimated stiffness of the footings is multiplied by different certain values, which may be used as the input of the simulation system. The natural frequency resulting from FMA under different multiple multiplications are obtained, that is, there are 24 groups of FMA results for each adjustment step of one multiple multiplication, since there are eight footings in this study, and each footing possesses three stiffness values along the X, Y and Z directions, respectively. The variation,
φ, of the natural frequency obtained from the FMA is defined as
The variation of the natural frequency obtained from FMA is calculated by Equation (6), which is defined as the difference between the simulation result after adjustment and before adjustment, and then this is divided by the simulation result before adjustments. The yellow mark in
Figure 9 shows the footing stiffnesses after a multiple of 10
1 multiplications, which interprets only one footing direction, which is adjusted in one group for each adjustment step of footing stiffness.
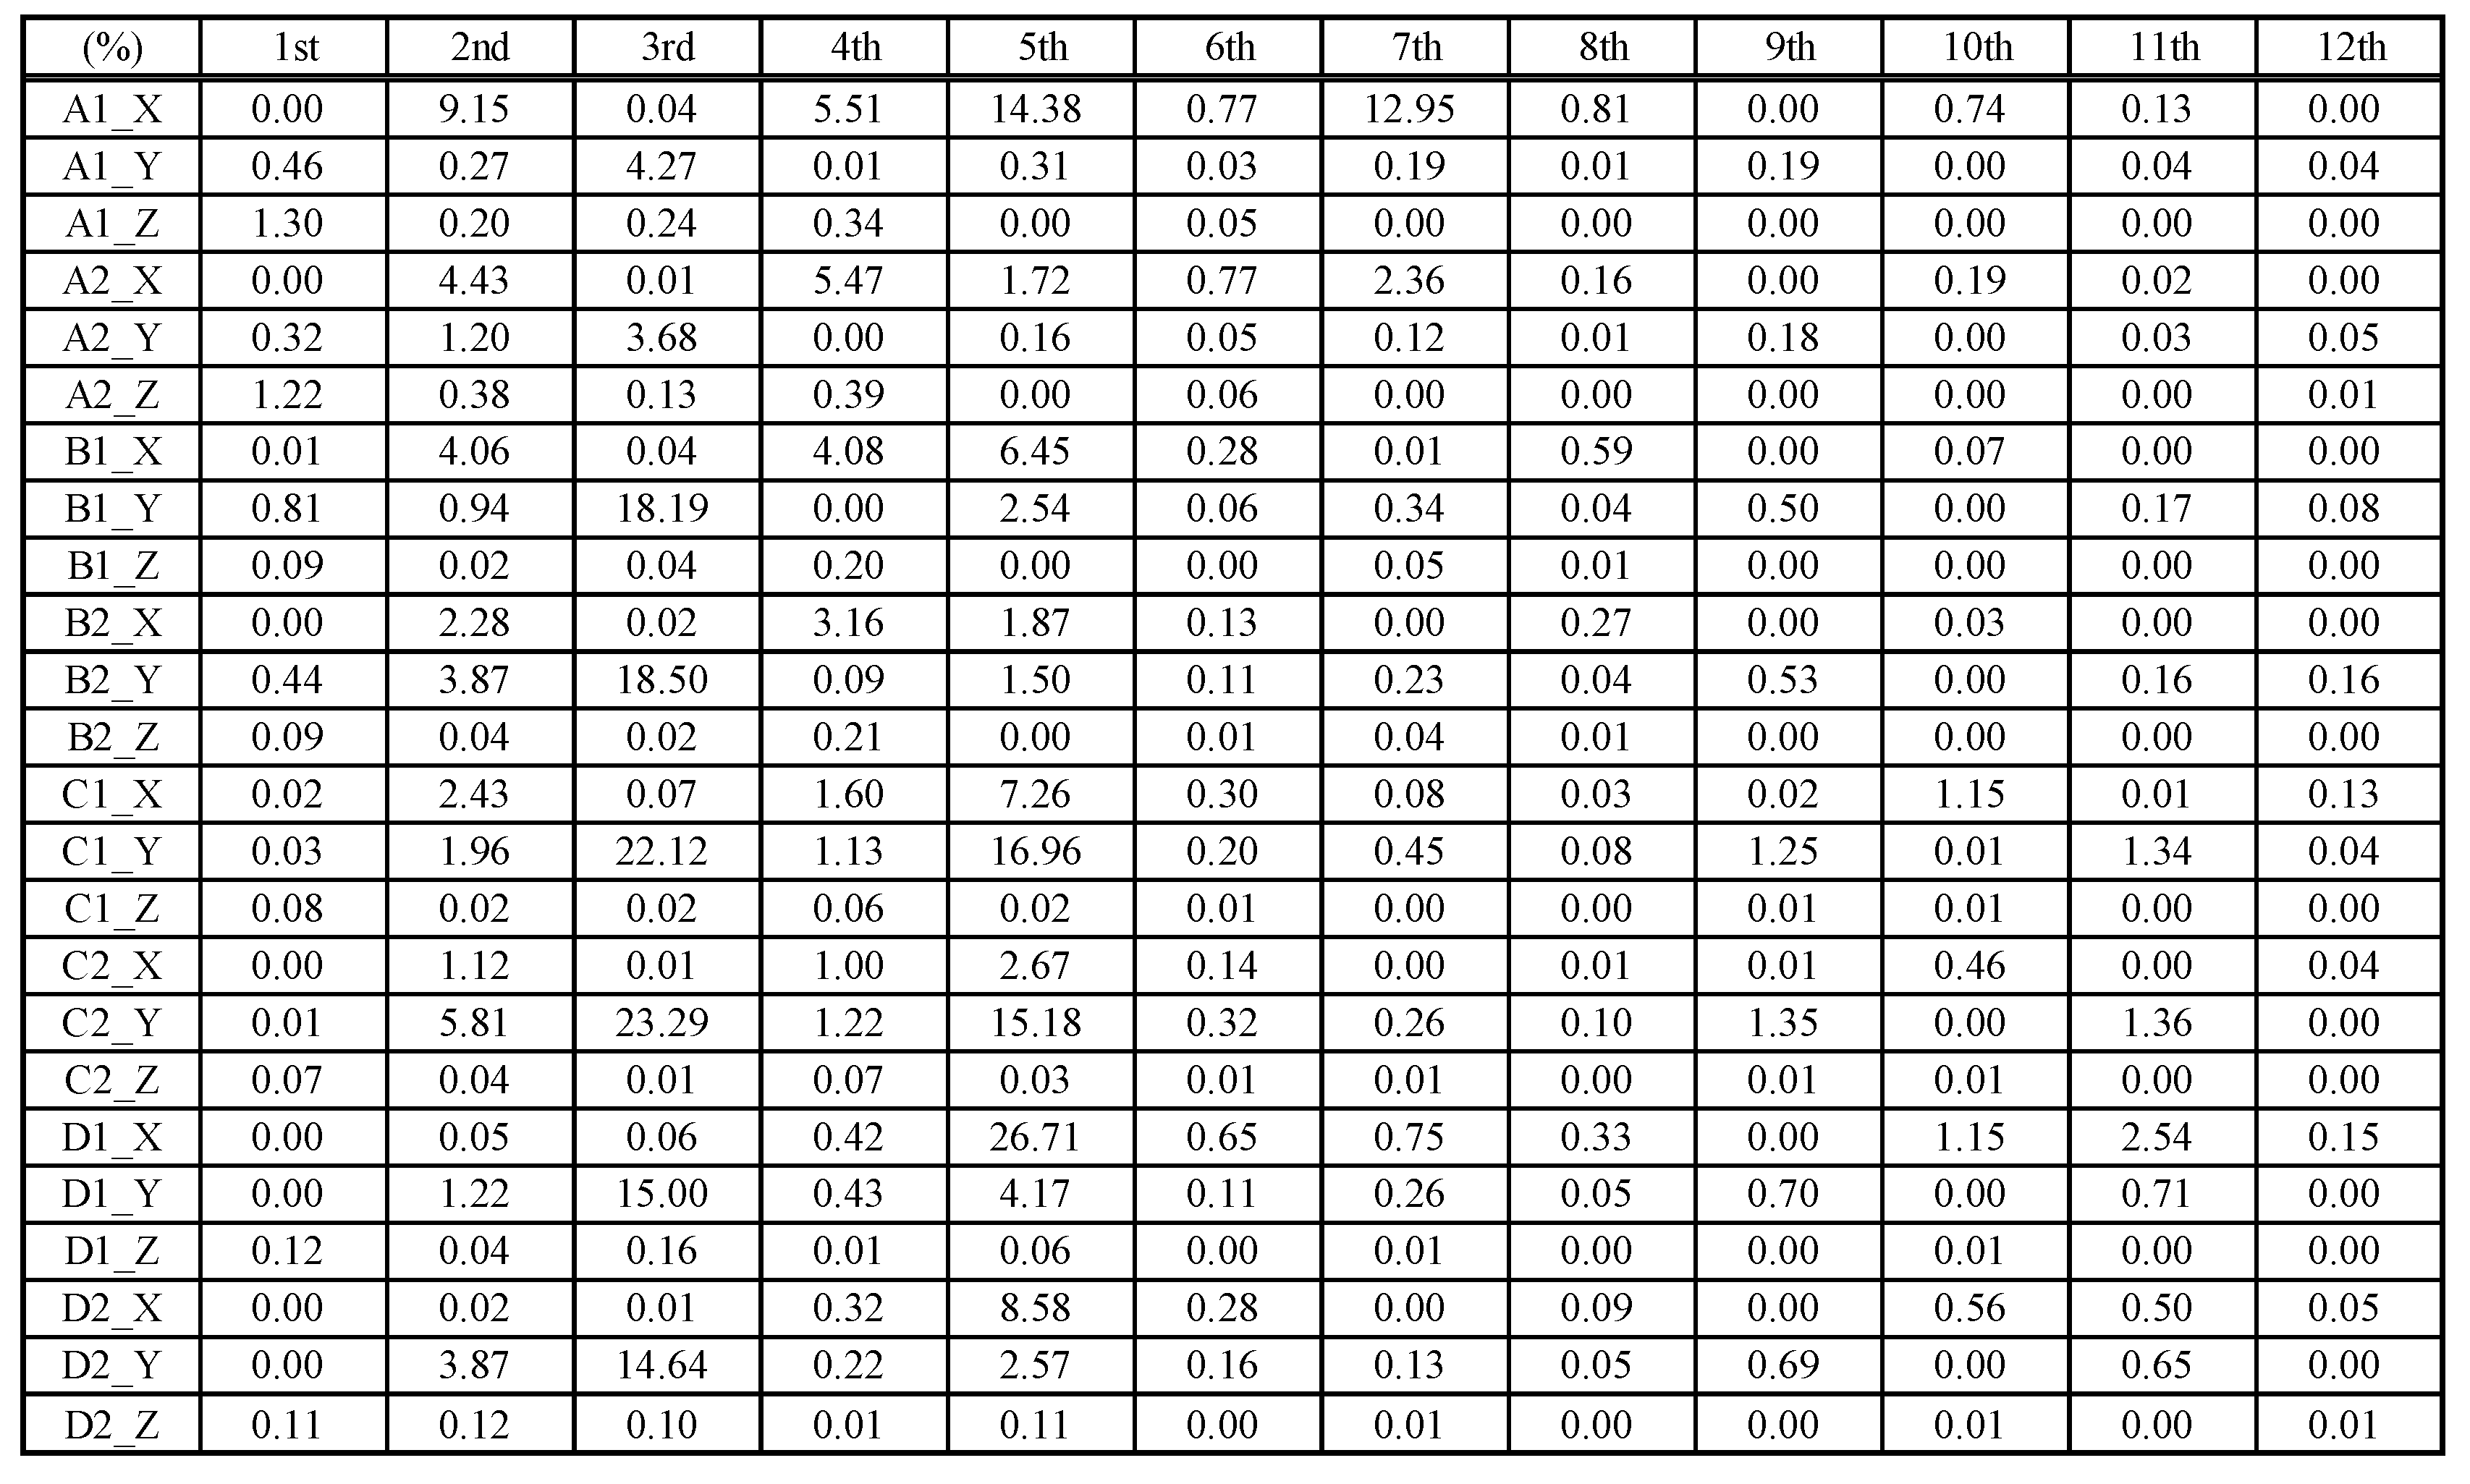
Figure 10 shows the natural frequencies corresponding to different modes and different footings resulting from FMA after the estimated stiffness is multiplied by 10
1. The variation shown in
Figure 11 is a case of taking this multiple of 10
1 multiplications. Note that only one estimated footing stiffness is varied for each adjustment step.
It can be observed that the stiffness values of the footings after 10
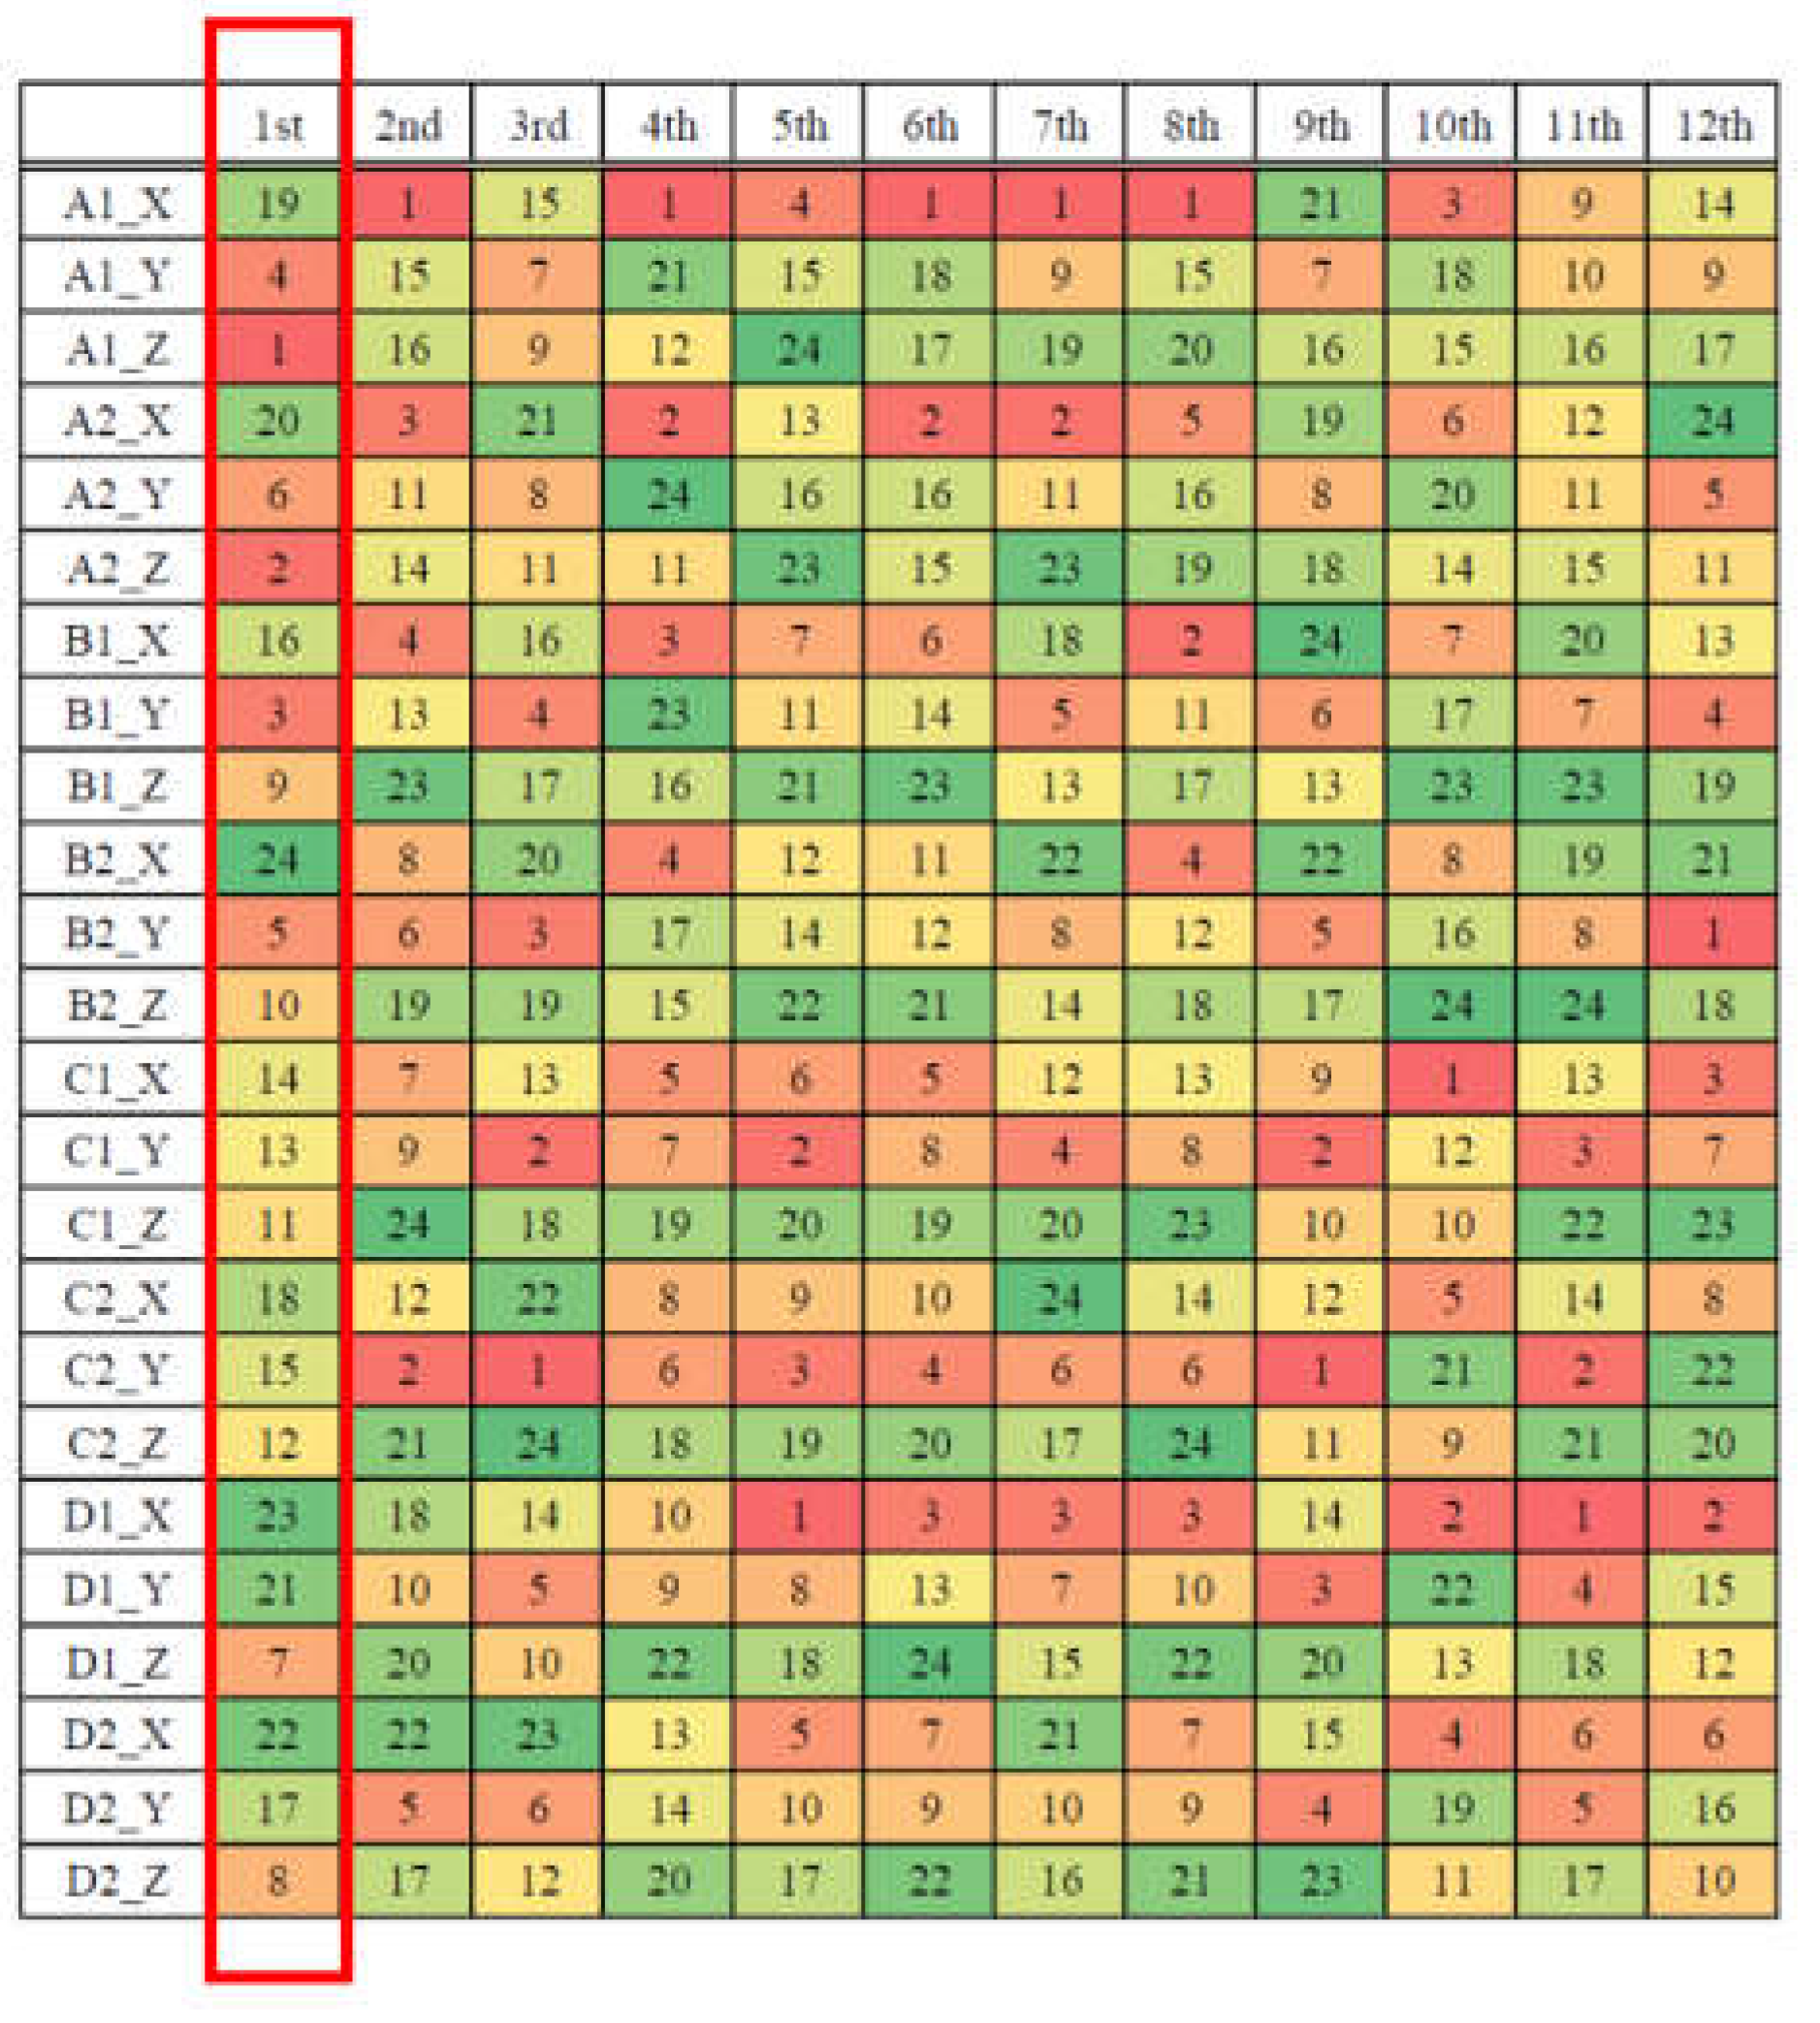
1 multiplication adjustment results in the natural frequencies corresponding to different modes and different footings from FMA. It can be found that the variation of the footing stiffness value at different locations and different directions has no obvious regularity in the influence of the natural frequency of each mode, and the variation is also quite different. Therefore, the display of the analysis data is switched to a specific color presentation that can clearly understand the ranking of the influence level among different footings. The variation ranking corresponding to different modes of the analysis results are shown in
Figure 12.
It can be observed that, when the estimated footing stiffnesses were performed by a multiple of 101 multiplications, the first four ranking stiffness values that affect the first-mode natural frequency are the Z-direction of the A1 footing, the Z-direction of the A2 footing, the Y-direction of the B1 footing, and the Y-direction of the A1 footing, respectively.
By adjusting the stiffness values of each footing along three directions, the increase up or decrease down of each mode’s natural frequency for each adjustment step is obtained. The adjustment multiples used in this study are 10
1, 10
3, 10
5, 10
−1, and 10
−3. The footing number and direction of the first four ranking footings of the natural frequency are affected significantly and are recorded at each adjustment step. The variation of the natural frequency is defaulted as it increases up, but, if the adjusted results of the natural frequency are reversed (decrease down), the letters for the locations and directions of the footing will be expressed in red. Total adjusted results for different multiples just mentioned above are shown in
Table 4,
Table 5,
Table 6,
Table 7 and
Table 8, respectively. In each table, the footing that has the same number and direction is marked by a same color circle of line. The adjustment of the above corresponding multiples in the table should be performed on those footings which possess a relatively larger number of circles.
It can be observed that, when the adjustment is a 101 multiplication, the natural frequency will be increased due to the adjustment of the footing stiffnesses. However, when the multiples are 103 and 105, the 1st, 6th, 8th, and 10th modes of the natural frequency will be decreased down due to these multiple magnifications of the footing stiffness adjustments. This indicates that the multiplication tendencies of the footing stiffness adjustments may be different from the variation trends (increase up or decrease down) of the natural frequencies, which are those obtained from FMA. Therefore, these generalized results are helpful for adjusting the interface stiffnesses of the footings.
From
Table 3, it can be noted that the sign and magnitude of the error between the simulation results and experimental results, and the adjustment guidance of the footing stiffness, are dominated by this error-related information. For example, if the error sign is positive between FMA and EMA for the first corresponding mode of the natural frequency, this means that the first-mode natural frequency of the FMA is higher than that of the corresponding EMA mode, i.e., the first mode of the EMA. The number and direction (expressed by red in
Table 4,
Table 5,
Table 6,
Table 7 and
Table 8) of the footings that affect the first mode of the natural frequency toward decrease down should be selected for adjustment, and so on. Conversely, if the error sign is negative for the second corresponding mode (2nd of EMA to 3rd of FMA) of the natural frequency, the number and direction (expressed by black in
Table 4 to
Table 8) of the footings that affect the first mode of the natural frequency toward increase up should be selected for adjustment, and so on. The adjustment procedures are repeated until the natural frequencies obtained from FMA are very close to those of EMA, and then the interface stiffness adjustment procedures may be regarded completely. That is, the error between FMA and EMA results of the whole machine-tool after adjustment fall within an allowable range. The comparison of the natural frequency of the whole machine-tool between FMA and EMA after adjustment on estimated footing stiffness is shown in
Table 9.
Figure 13 shows the comparisons of the natural frequencies of the whole machine-tool between FMA and EMA for the situations of no interface stiffness consideration, and before and after adjustment of footing stiffnesses. The error of the natural frequencies of the whole machine-tool is very large when the interface stiffness is not considered in FMA, while those errors may fall into a convergent range of 5% after the footing stiffnesses are adjusted by the methodology proposed in this study.
Table 10 shows the final state of the interface stiffnesses for different locations and directions of footings. There are, in total, 13 estimated stiffnesses on footing locations, and directions are kept invariantly, and the other 11 footings are adjusted by the proposed method in this study. This illustrates that the footings along the z-direction suffer from most of the weights of the machine-tool, and the contact stiffnesses are larger than the other footings, consequently.
