Article

Analysis of All-Optical Generation of Graphene Surface Plasmons by a Frequency-Difference Process

by
Rui Dias
1,
José C. Viana Gomes
2 and
Mikhail I. Vasilevskiy
2,3,*
1
Centre of Physics—CF-UM-UP and Laboratório de Física para Materiais e Tecnologias Emergentes (LaPMET), University of Minho, Campus of Gualtar, 4710-374 Braga, Portugal
2
Department of Physics, University of Minho, Campus of Gualtar, 4710-374 Braga, Portugal
3
Theory of Quantum Nanostructures Group, International Iberian Nanotechnology Laboratory, 4715-330 Braga, Portugal
*
Author to whom correspondence should be addressed.
Appl. Sci. 2022, 12(23), 12376; https://doi.org/10.3390/app122312376
Submission received: 27 September 2022 / Revised: 22 November 2022 / Accepted: 29 November 2022 / Published: 3 December 2022
(This article belongs to the Section Optics and Lasers)

Abstract

:
The generation of graphene surface plasmons (SPs) by a frequency-difference nonlinear (NL) process caused by the interaction of two optical beams was experimentally demonstrated several years ago by measuring the differential reflectance of the probe beam. However, the understanding of these results requires much larger second-order optical conductivities of graphene than calculations performed so far can yield. In this work, we carefully calculate the relevant NL conductivities and show that, indeed, the experimental observations of the differential reflectance must have originated from physical processes beyond the coherent frequency-difference generation of SPs described by the density-matrix perturbation theory approach, presumably by hot-electron effects. We also suggest an alternative way of detecting optically generated SPs, which can be feasible at lower powers of the optical pulses. Such additional experiments are expected to help understand the remaining discrepancy between the theory and the existing experimental data.

1. Introduction

Graphene, a monolayer-thick transparent conductor, is known to support evanescent waves called surface plasmons (the correct name for these excitations that involve charge density oscillations and the associated electromagnetic field is “surface plasmon-polariton”, we abbreviate it for convenience) (SPs) [1]. Since the optical conductivity of graphene can be tuned electrically by adjusting the Fermi energy, making the SPs’ electrical control feasible, it gave rise to a broad field of intense research named graphene plasmonics [1,2,3,4,5]. Graphene SPs, occurring in the THz-to-IR spectral range, are characterized by large in-plane wavevectors, beyond the light cone, and cannot be excited directly by propagating electromagnetic (EM) waves because the conditions of energy and momentum matching cannot be fulfilled for an SP and a propagating photon.
Even though several methods of SP excitation by light do exist, such as using the attenuated total internal reflection (ATR) configuration, different kinds of grating, or just a symmetry-breaking object placed in the vicinity of the graphene sheet [5], all-optical generation of SPs in homogeneous graphene would be highly desirable [6,7]. Several years ago, it was proposed theoretically [8] to use two optical beams with slightly different frequencies to generate SPs via a frequency-difference (DF) nonlinear (NL) process. A similar idea exploiting a four-wave mixing process was presented in Ref. [7]. Graphene had been predicted and demonstrated to have a strong third-order nonlinearity (the Kerr effect) in the THz-to-IR spectral range [9,10,11,12,13,14], with a number of potentially interesting effects following from this, such as the third [11] and also higher-order [15] harmonics generation, optical bistability [16], saturable absorption [17], etc. The reason is the Dirac-type electronic energy spectrum of graphene [9]. Although it is a centrosymmetric material where the second-order conductivity (or susceptibility) should vanish by symmetry [18], this restriction can be bypassed if one uses oblique optical beams with non-zero and unequal in-plane components of the wavevector, thus breaking the symmetry (see Figure 1). Indeed, second-harmonic generation signals were observed for suspended graphene, caused by curvature fluctuations over the graphene sheet [19]. Another possibility to leverage the second-order nonlinearity is, for instance, to use the surface asymmetry of a dual-layer graphene heterostructure, which has been shown to enable to the generation of a difference-frequency signal at THz frequencies [20].
The idea illustrated in Figure 1 was implemented experimentally in Ref. [6] and investigated further in subsequent articles [21,22]. These experiments used graphene on top of SiO 2 and two femtosecond laser pulses, a pump, and a probe, to excite the SPs. The probe wavelength was fixed at λ a = 615 nm while the pump wavelength, λ b , was varied between 615 and 545 nm. By recording the differential reflectivity of the probe, at the condition of energy and in-plane momentum matching for plasmons (see Supplementary Information (SI)), a resonance associated with the SP generation was observed [6,21], as had been predicted theoretically [8]. By recording the differential reflectivity of the probe, at the condition of energy and in-plane momentum matching for plasmons (see Supplementary Information (SI)), a resonance associated with the SP generation was observed [6,21]. However, contrary to what was predicted theoretically [8], this resonance appeared as a narrow signal, symmetric with respect to the pulse peak, on top of a broader asymmetric band which was also observed outside of the plasmon resonance. This asymmetric temporal variation of the differential reflectance was tentatively attributed to hot-electron effects [21] and it is not well understood so far. Even though the relation of the observed resonant peak in the differential reflectance to the generation of graphene surface plasmons looks doubtless, its quantitative explanation is lacking. Several authors [8,22,23] used the density-matrix perturbation theory to calculate the graphene’s nonlinear response for DF generation, but there is a strong disagreement between the experimentally observed magnitude of the resonance and the published theoretical predictions. Theoretical values of the second-order conductivity calculated specifically for the scheme of Figure 1 in Refs. [8,22,23] differ by orders of magnitude from the experimental data and also between themselves [22].
In this work, we carefully recalculate the relevant NL conductivities and the differential reflectance of the probe beam (which actually involves two second-order processes) and compare our calculated results to the experimental data of [6] and to the previous calculations. The derived analytical formulae for the second-order conductivities are verified by numerical calculations. We will assume that the incident optical fields are monochromatic plane waves characterized by well-defined frequencies, ω a = 2 π c / λ a and ω b = 2 π c / λ b , wavevectors and incidence angles, so that the in-plane wavevector projections are q j = ( 2 π / λ j ) ε 1 sin θ j e x for j = a , b , as shown in Figure 1. Throughout the article, we call the fields a and b the probe and pump, respectively. Electric current and the corresponding electromagnetic field oscillating with the difference frequency ω = ω b ω a and wavevector q = q b q a = ( q a + q b ) e x represent the DF excitation, which can be resonant with intrinsic surface plasmons of the doped graphene.
The article is organized as follows. In Section 2.1 we present our formalism and final expressions for the second-order conductivities and compare the one describing the SP generation with those obtained in the previous calculations [8,22,23]. In Section 2.2, explicit formulae for the differential transmittance and reflectance measured in experiments [6,21] are presented based on the results of Section 2.1. In Section 3, we compare our calculated optical spectra representing the NL effects with the experimental data and also outline an alternative way of detecting the optically generated SPs (Section 3.2). The last section is devoted to a summary and concluding remarks. All detailed derivations are left for Supplementary Information (SI).

2. Materials and Methods

We begin with the calculation of the second-order nonlinear conductivity of graphene. This calculation requires taking into account non-local effects, otherwise, the second-order response vanishes, as we shall see.

2.1. Second-Order Conductivities

We work within the Dirac cone approximation and use the density matrix formalism to calculate the second-order nonlinear conductivity, as it was done in the previous works (the work [22] used a tight-binding Hamiltonian, which is equivalent to the Dirac-cone approximation in the vicinity of the Dirac point) [8,23]. The Hamiltonian of the electrons coupled to the electromagnetic field is taken in the so-called velocity (or A ) gauge [24,25]:
H ^ = v F σ · p + e c A ( t , r ) ,
where v F is the Fermi velocity (a material parameter), σ = ( σ x , σ y ) , σ i is the ith Pauli matrix, p is the usual momentum operator, and A ( t , r ) is the vector potential (the electric field is given by E = 1 c ( A / t ). Using the density-matrix perturbation theory [18] with the second term in (1), we find a general expression for the DF conductivity (see SI for details):
σ kji Ω , Ω p , Ω q = e 3 2 ω q ω p S nml v m n , ( q + p ) k v lm , p j v nl , q i ω lm ω p i γ lm f ( ε m ) f ( ε l ) ω nm ω p + ω q i γ nm + e 3 2 ω q ω p S nml v mn , ( q + p ) k v nl , p j v lm , q i ω lm ω q i γ lm f ( ε m ) f ( ε l ) ω nm ω p + ω q i γ nm e 3 2 ω q ω p S nml v mn , ( q + p ) k v nl , p j v lm , q i ω nl ω p i γ nl f ( ε l ) f ( ε n ) ω nm ω p + ω q i γ nm e 3 2 ω q ω p S nml v mn , ( q + p ) k v lm , p j v nl , q i ω nl ω q i γ nl f ( ε l ) f ( ε n ) ω nm ω p + ω q i γ nm
where Ω p = ( ω p , p ) , Ω q = ( ω q , q ), and Ω = ( ω p + ω q , p + q ) , with ω p and ω q denoting the frequencies of the fields and p and q the respective in-plane wavevectors. The sums are over different states near the Dirac point and
v mn , q j = m | v j e i r · q | n
are the matrix elements of the spatially modulated velocity components. Here ω mn = ε n ε n / is the energy difference between states | m and | n and f ( ε n ) is the occupation number of state | n , at equilibrium described by the Fermi–Dirac function. Finally, γ nm are phenomenological damping parameters for transitions between states | n and | m .
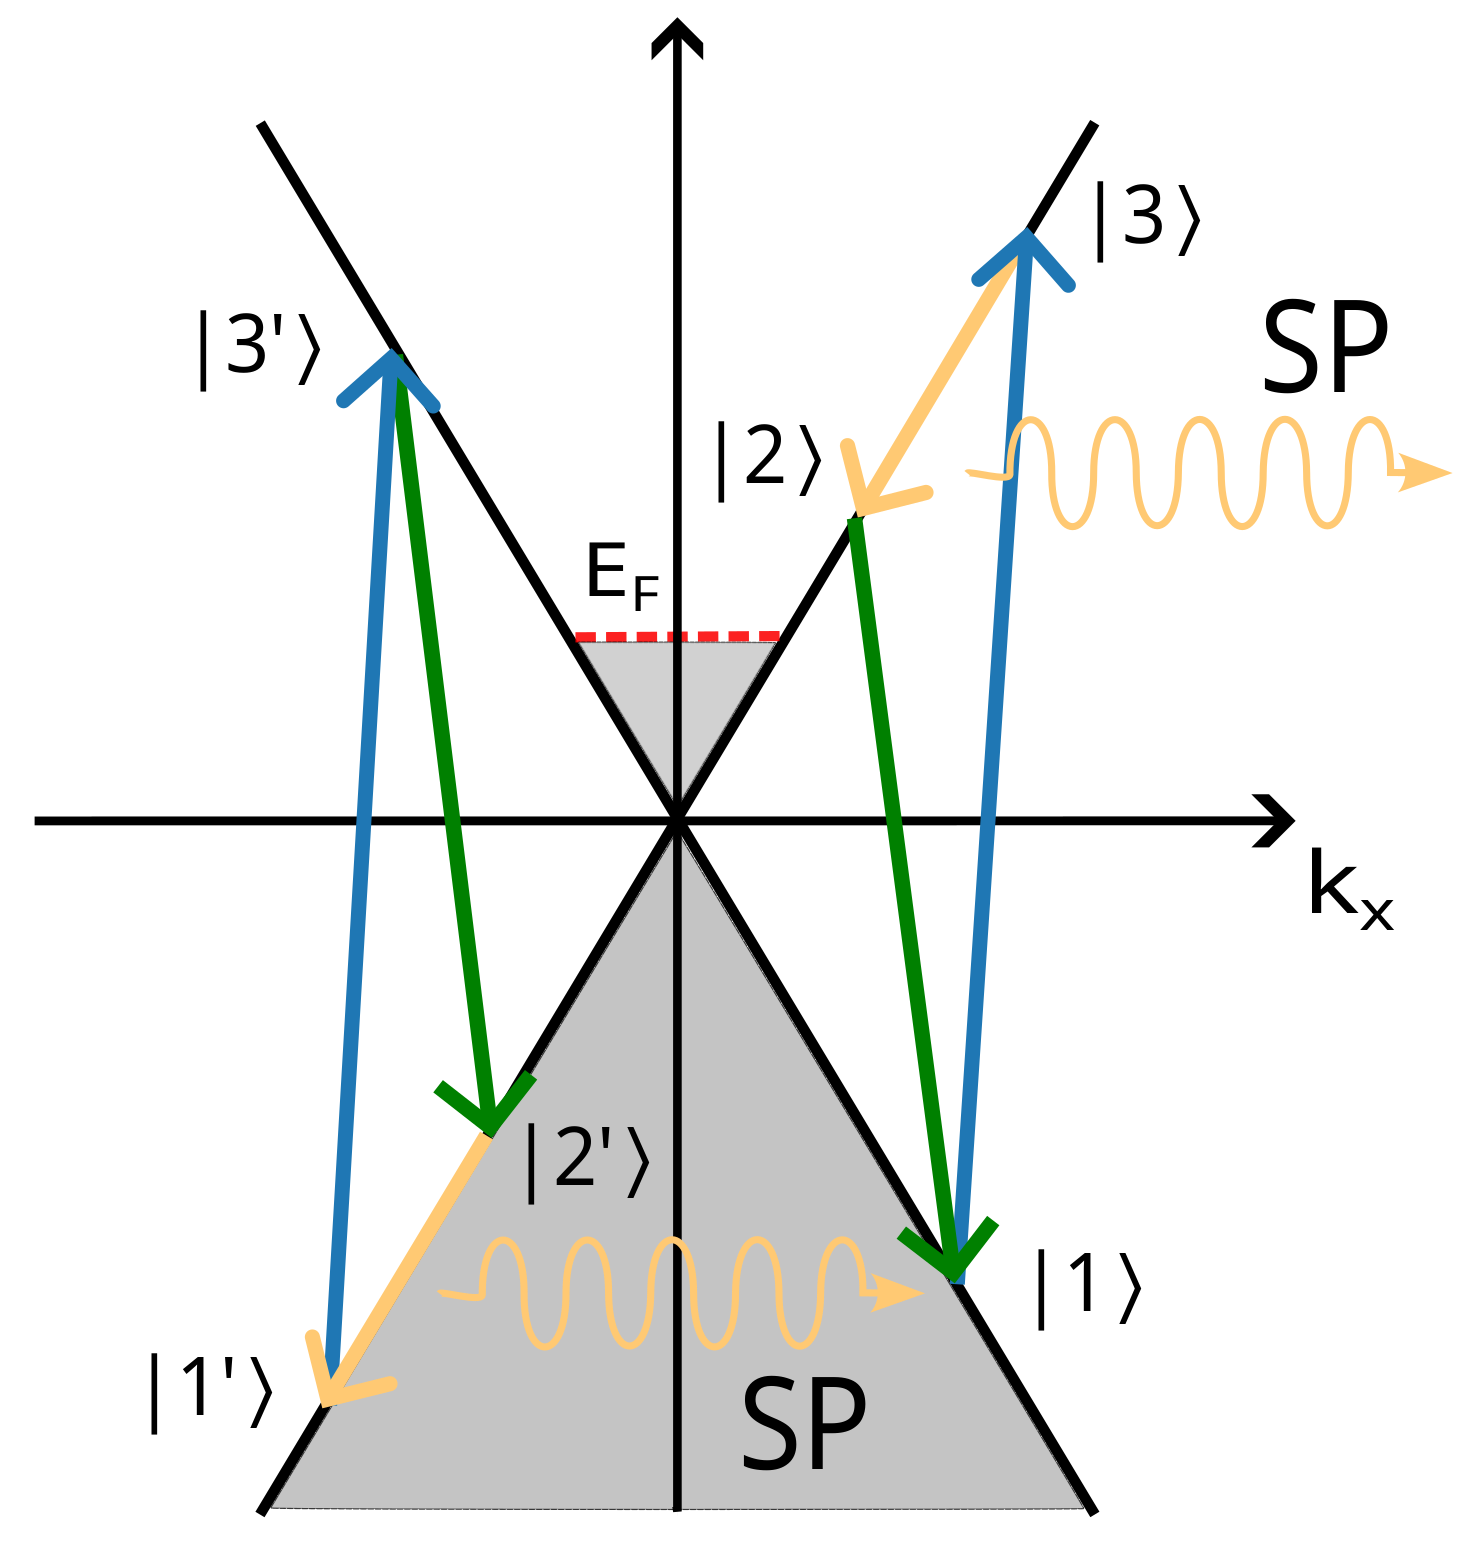
The relevant transitions for DF generation are shown in Figure 2, which represent two channels [8]: Channel 1 with transitions between the states
| 1 = | 1 , k 1 , | 2 = | 1 , k 2 , | 3 = | 1 , k 3 ,
and the intraband transition in the conduction band, and Channel 2 involving the states
| 1 = | 1 , k 1 , | 2 = | 1 , k 2 , | 3 = | 1 , k 3 ,
with the intraband transition in the valence band.
For the case of DF generation of the field oscillating with the frequency ω = ω b ω a , we have Ω = ( ω , q ) and Ω a , b = ( ω a , b , q a , b ) , the only relevant component of the conductivity tensor, for the experimental arrangement of Figure 1, is the one with i = j = k = x , and the general expression (2) takes the form:
σ xxx Ω , Ω b , Ω a = e 3 2 ω b ω a S 123 v 23 , q x v 31 , q b x v 12 , q a x ω 32 ω i γ 32 f ( ε 1 ) f ( ε 3 ) ω 31 ω b i γ 31 f ( ε 2 ) f ( ε 1 ) ω 12 + ω a i γ 12 + e 3 2 ω b ω a S 1 2 3 v 1 2 , q x v 3 1 , q b x v 2 3 , q a x ω 2 1 ω i γ 2 1 f ( ε 3 ) f ( ε 2 ) ω 2 3 + ω a i γ 2 3 f ( ε 1 ) f ( ε 3 ) ω 3 1 ω b i γ 3 1 ,
where we retained only resonant terms. Evaluation of the matrix elements of the modulated velocity operator (3) can be done in different ways, the most straightforward is considering the velocity operator v = v F σ (see SI for details). In principle, in the A -gauge one has to calculate them with the full Hamiltonian including the interaction [24,25]. However, in our case, the interaction operator commutes with e i r · q and we can use the unperturbed Hamiltonian (without A ). The matrix elements contain Kronecker δ -s that cancel out two summations in Equation (6) and yield the conservation of momentum q = q b q a .
To compute (6), we expand the matrix elements v mn , q j , the energy differences, ω nm , and the Fermi–Dirac distributions to the first order in the wavevectors q j and q . For example, for a state | n = | 1 , k with k = k + q j , then:
f ( ε n ) = f c ( ε k ) f c ( ε k ) + ε k f ( ε k ) q j · k ε k
We denote by f c ( ε ) the distribution function for the electrons in the conduction band and by f v ( ε ) = f c ( ε ) the one for electrons in the valence band. Additionally, for simplicity, we set equal all phenomenological damping constants, γ nm = γ . With these approximations, considering both channels the lowest order term in the conductivity is proportional to q. At zero temperature, the following analytical expression is obtained:
σ xxx Ω , Ω b , Ω a δ q , q b q a e 3 v F 2 E F 3 ω b ω a π 2 2 ω F ω a 2 ω F ω a 2 + γ 2 q A ( ω , q , γ ) ,
where
A ( ω , q , γ ) = π ( ω + i γ ) ( v F q ) 4 ( v F q ) 2 + 2 ( ω + i γ ) 2 1 v F q ω + i γ 2 1 π 4 1 ( ω + i γ )
is an auxiliary function, which is independent of q in the limit q 0 .
Figure 3 shows the behavior of the real and imaginary parts of σ xxx Ω , Ω b , Ω a as functions of ω and q, for two values of the Fermi energy. The results obtained by the analytical formula (8) are confirmed by direct numerical evaluation of Equation (6). In the left panel, for a fixed value of q, the real part of the conductivity peaks at ω v F q , and the imaginary part becomes considerable for frequencies ω < v F q . An important feature of Equation (8) for the second-order conductivity σ xxx Ω , Ω b , Ω a is that it goes to zero as q 0 , as it should for a centrosymmetric material. This physically meaningful feature was lacking in the results of Refs. [8,23]. The reason for this probably is the problem with intraband matrix elements for the r operator, first pointed out by Blount [26]. The analytical formula derived in Ref. [22], although showing the correct limiting behavior for q 0 , is somewhat different from ours and we were not able to reproduce it following the steps indicated in the supporting material of that article. Let us emphasize that the points in Figure 3 represent the results of direct numerical evaluation of Equation (6), performed without approximations such as expansions in terms of wavevectors, so we believe that these spectra are correct within the model and approach used. It is the imaginary part of the conductivity that is important to describe the SP generation process, so we have from Figure 3 a | Im σ xxx Ω , Ω b , Ω a |   3 esu 10 16 Am / V 2 for ω = 50 ps 1 . Even though it is larger than the value calculated in Ref. [22], it is below the experimentally estimated value [6] by some 3 orders of magnitude. We shall discuss the possible cause of this discrepancy in Section 3.
Similar calculations can be carried out for the conductivities oscillating with the frequencies ω b and ω a , representing the DF destruction/generation of the pump and probe photons, respectively. Our analytical expressions, obtained with the same approximations as Equation (8), are:
σ xxx ( 2 ) Ω b , Ω a , Ω δ q , q b q a e 3 v F 2 E F 3 ω a ω π 2 q 2 ω F ω a i γ A ( ω , q , γ ) ;
σ xxx Ω a , Ω b , Ω δ q , q b q a e 3 v F 2 E F 3 ω b ω π 2 q 2 ω F ω a i γ A ( ω , q , γ ) .
We notice that
1 ω a | σ xxx Ω a , Ω b , Ω |   1 ω b | σ xxx ( 2 ) Ω b , Ω a , Ω |   1 ω | σ xxx Ω , Ω b , Ω a | .
This relation can be used for numerical estimates of the former [6]. We also verified Equations (10) and (11) by direct numerical evaluation.

2.2. Reflection Coefficients of the Optical Beams

The reflection coefficients of the optical beams are affected by the SP generation and this is how the latter was detected in Ref. [6]. Here we shall calculate the “perturbed” reflection and transmission coefficients using the results of the previous section. We consider a situation similar to the experiments [6], with graphene cladded by two dielectrics with dielectric constants ε 1 = 1 and ε 2 = 2.4 and two p polarised optical waves impinging on it. We define the reflection and transmission coefficients as r j = E j R / E j I and t j = E j T / E j I ( j = a , b ). The calculation is carried out in a standard way and follows Ref. [5], where the graphene conductivity (entering boundary conditions for the magnetic field) now includes an NL term. If only the second-order processes that correspond to the DF generation are considered, the transmission coefficients are (see SI for details):
t a = t a ( 0 ) 1 2 t a ( 0 ) | t b ( 0 ) | 2 π 2 i σ xxx ( 2 ) Ω a , Ω b , Ω σ xxx ( 2 ) Ω , Ω b , Ω a | E b I | 2 cos 2 θ b T ε 1 c ω D ( ω , q ) cos θ a T ;
t b = t b ( 0 ) 1 + 2 t b ( 0 ) | t a ( 0 ) | 2 π 2 i σ xxx ( 2 ) Ω b , Ω a , Ω σ xxx ( 2 ) Ω , Ω b , Ω a | E a I | 2 cos 2 θ a T ε 1 c ω D ( ω , q ) cos θ b T
where t j ( 0 ) denotes the transmission coefficient in the absence of the second pulse,
t j ( 0 ) = 2 ( ε 1 / k jz I ) sec θ j T cos θ j I ( ε 1 / k jz I ) + ( ε 2 / k jz T ) + 4 π i ω j σ ( 1 ) ( ω j ) ,
k jz I ( T ) denotes the z component of the incident (transmitted) wave,
D ( ω , q ) = ε 2 κ 2 + ε 1 κ 1 + 4 π i ω σ ( 1 ) ( ω , q ) ,
σ ( 1 ) is the linear conductivity of graphene (taken according to the Drude model for SPs and accounting for interband transitions [5] for the optical beams) and κ m = q 2 ε m ω 2 / c 2 ( m = 1 , 2 ). The corresponding reflection coefficients are given by:
r j = 1 sec θ j I cos θ j T t j ( j = a , b )
with θ j I and θ j T being the incidence and transmission angles.
Notice that the condition
Re D ( ω , q ) = 0
determines the SP dispersion relation [27]. We can see from Equations (13) and (14) that there is a transfer of energy between the two optical fields, which is mediated by the SP field formed in the vicinity of graphene and, therefore, is resonant under the condition (18). This process, in spite of being due to the second-order response of graphene, is, in fact, of the third-order in optical fields.

3. Results and Discussion

3.1. Calculated Optical Spectra

Figure 4 presents the spectral variation of the normalized differences in the reflectance, Δ R = R R 0 , transmittance, Δ T = T T 0 , and absorbance, Δ A = A A 0 (the quantities with the subscript 0 correspond to the absence of the second beam), for the situation presented in Supplementary Material of Ref. [6] where θ a I = 20 and θ b I = 40 . All these spectra show the SP resonance at ω SP = 177 ps 1 . The reflectance of the probe beam in Figure 4 shows a dip at resonance, but it could be a peak if θ a I were larger than the Brewster angle (situation corresponding to Figure 2 of Ref. [6]) because Δ R a ( r a ( 0 ) Δ r a + r a ( 0 ) Δ r a ) , r a ( 0 ) is nearly real and changes its sign at the Brewster angle, while its variation owing to the NL effect, Δ r a , does not. The differential transmittance spectrum of the probe beam has a resonance peak for any θ a I and the absorbance is diminished at resonance (Figure 4, right). At the same time, the absorbance of the pump beam is increased (and Δ A b > | Δ A a | ) because of the SP-mediated photon downconversion ( b a ) and plasmon-related losses.
The chosen value of the intensity of the pump, I b = 10 16 erg cm 2 s 1 , approximately correspond to the fluence of 0.1 mJ/cm 2 and pulse duration of 0.1 ps, mentioned in Ref. [6]. From Figure S1 of Supplementary Material of that article, we can find the depth of the resonant minimum of Δ R / R 0 of 1.6 · 10 3 , while our calculations predict a value of the order of 10 9 at the SP resonance. Since Δ R is quadratic in the second-order conductivity, our calculated result for it is lower than the value extracted from the experiment in Ref. [6] by roughly 3 orders of magnitude, as already mentioned in Section 2.1. It means that some important effect was not included in the model used in our calculations (it could be a thermal nonlinearity [21,22]) or the perturbative approach is not valid because of the high intensity of the pump pulse.

3.2. How to Detect the Optically Generated SPs?

As pointed out in the previous section, the differential reflectance method [6,21] relies on a process that is of the third order with respect to the optical fields. Considering the optical beams as plane waves, it seems that the variation of the reflection coefficients of these beams is small and consequently hard to detect unless very high intensities of the pump beam are used. Then other (non-electronic) types of nonlinearity can arise, for instance, due to photothermal effects [22], which is less interesting from the point of view of applications. Thus, it might be preferable to try and detect the optically generated surface plasmons using another route. Time-resolved THz spectroscopy is a powerful technique in the spectral range relevant to graphene SPs [28] and it could help detect the flux of plasmons escaping from the optical spots where they were generated. Below we shall evaluate this flux.
Let us assume for simplicity that the optical beams are focused by cylindrical lenses so that the system is uniform along the y-direction. As a first approximation, we neglect the uncertainty of the in-plane components of the wave vectors k a and k b ( q a and q b ) as if they were plane waves. In this situation, the energy flux in the x direction associated with the generated SPs, per unit length along y, is (see SI for details):
J = q ω 16 π m = 1 , 2 ε m κ m 3 | E m , x ( ω , q ) | 2 | D ( ω , q ) | 2 ,
with D ( ω , q ) defined by Equation (16). At the plasmon resonance, the evanescent field is strongly enhanced and the energy flux increases.
Since SPs are dissipated because of the Ohmic losses, we can neglect the inverse process of optical photon generation with the propagation of SPs. Thus, the flux (19) is responsible for the removal of energy from the optical beams. If the incident energy fluxes are J a ( I ) , J b ( I ) (per unit length along y), and if both reflected and transmitted beams a and b are measured, it should be possible to detect a variation of the total energy of both optical beams since, at the plasmon resonance, it should be diminished by J because of the energy conservation,
J a ( I ) + J b ( I ) = J a ( R ) + J a ( T ) + J b ( R ) + J b ( T ) + L a + L b + J ,
where L stands for losses associated with the transmission and reflection of the optical beams at the graphene-covered surface, which are related to Re σ ( 1 ) ( ω a , b ) and, therefore, can be evaluated. Detection of a positive difference between the left-hand side and the parenthesis in the right-hand side of (20) will indicate the SP generation, J > 0 . Another possibility is to try to detect the SP flux by converting it into propagating THz light, as was done in the first demonstrations of graphene surface plasmons [2,3]. Yet another possibility to detect the generated plasmons is to measure the electric current arising due to the heating up of charge carriers in graphene, following SP decay [29]. The advantage of detecting the SP flux using either of these approaches, instead of relying on the plasmon-assisted down-conversion of probe photons is that the variation is a second-order process with respect to the optical fields, consequently, it should require lower intensities of the optical beams.

4. Concluding Remarks

Summarizing all the aforesaid, we would like to emphasize that the calculated value of the second-order conductivity of optically pumped graphene is too low (by approximately 3 orders of magnitude) to explain the experimental results of all-optical generation of surface plasmons [6,21]. An alternative approach to the detection of the resonantly generated SPs can be tried as discussed in Section 3.2. The presence of an incoherent part in the measured differential reflectance signal also indicates that the nonlinear optical coupling to plasmons in graphene cannot be described perturbatively through the electronic nonlinearity, as suggested in some recent publications [15,30,31]. In particular, the hot-electron model proposed to describe non-equilibrium electrons generated with strong, ultrafast light pulses [30] can be an alternative approach. It can explain the background signal present in the results of Ref. [6], but probably not the coherent part of the differential transmittance because hot electrons lose their phase memory when become thermalized. So, the situation remains rather puzzling, and additional experiments are required to find further insights.

Supplementary Materials

The following supporting information can be downloaded at: https://www.mdpi.com/article/10.3390/app122312376/s1, detailed calculation of the NL-conductivities and reflection coefficients.

Author Contributions

R.D. and M.I.V. conceived the ideas and performed the calculations. J.C.V.G. contributed to the understanding and discussion of the results. All authors have read and agreed to the published version of the manuscript.

Funding

This research was funded by the Portuguese Foundation for Science and Technology (FCT) through project Ref. PTDC/NAN-OPT/29265/2017 “Towards high speed optical devices by exploiting the unique electronic properties of engineered 2D materials”, the European Commission within the project “Graphene-Driven Revolutions in ICT and Beyond” (Ref. No. 696656), and the Strategic Funding UID/FIS/04650/2020.

Institutional Review Board Statement

Not applicable.

Informed Consent Statement

Not applicable.

Data Availability Statement

Not applicable.

Acknowledgments

The authors are thankful to Nuno Peres for helpful discussions. M.I.V. wishes to acknowledge the hospitality of the Physics Department of the University of Ottawa.

Conflicts of Interest

The authors declare no conflict of interest.

References

  1. Gonçalves, P.A.D.; Peres, N.M.R. An Introduction to Graphene Plasmonics; World Scientific: Singapore, 2016. [Google Scholar]
  2. Fei, Z.; Rodin, A.S.; Andreev, G.O.; Bao, W.; McLeod, A.S.; Wagner, M.; Zhang, L.M.; Zhao, Z.; Dominguez, G.; Thiemens, M.; et al. Gate-tuning of graphene plasmons revealed by infrared nano-imaging. Nature 2012, 487, 82. [Google Scholar] [CrossRef] [PubMed] [Green Version]
  3. Chen, J.; Badioli, M.; Alonso-González, P.; Thongrattanasiri, S.; Huth, F.; Osmond, J.; Spasenovic, M.; Centeno, A.; Pesquera, A.; Godignon, P.; et al. Optical nano-imaging of gate-tunable graphene plasmons. Nature 2012, 487, 77. [Google Scholar] [CrossRef] [PubMed] [Green Version]
  4. Grigorenko, A.N.; Polini, M.; Novoselov, K.S. Graphene plasmonics. Nat. Photon. 2012, 6, 749. [Google Scholar] [CrossRef]
  5. Bludov, Y.V.; Ferreira, A.; Peres, N.M.R.; Vasilevskiy, M. A Primer on Surface Plasmon-Polaritons in Graphene. Int. J. Mod. Phys. B 2013, 27, 1341001. [Google Scholar] [CrossRef] [Green Version]
  6. Constant, T.J.; Hornett, S.M.; Chang, D.E.; Hendry, E. All-optical generation of surface plasmons in graphene. Nat. Photon. 2016, 12, 124. [Google Scholar] [CrossRef] [Green Version]
  7. Tao, J.; Dong, Z.; Yang, J.K.W.; Wang, Q.J. Plasmon excitation on flat graphene by spolarized beams using four-wave mixing. Opt. Express 2015, 23, 7809. [Google Scholar] [CrossRef] [Green Version]
  8. Yao, X.; Tokman, M.; Belyanin, A. Efficient Nonlinear Generation of THz Plasmons in Graphene and Topological Insulators. Phys. Rev. Lett. 2014, 112, 055501. [Google Scholar] [CrossRef] [PubMed] [Green Version]
  9. Mikhailov, S.A. Non-linear electromagnetic response of graphene. EPL 2007, 79, 27002. [Google Scholar] [CrossRef] [Green Version]
  10. Hendry, E.; Hale, P.J.; Moger, J.; Savchenko, A.K.; Mikhailov, S.A. Coherent Nonlinear Optical Response of Graphene. Phys. Rev. Lett. 2010, 105, 097401. [Google Scholar] [CrossRef] [Green Version]
  11. Hong, S.Y.; Dadap, J.I.; Petrone, N.; Yeh, P.C.; Hone, J.; Osgood, R.M., Jr. Optical third-harmonic generation in graphene. Phys. Rev. X. 2013, 3, 021014. [Google Scholar] [CrossRef]
  12. Cheng, J.L.; Vermeulen, N.; Sipe, J.E. Third order optical nonlinearity of graphene. New J. Phys. 2014, 16, 053014. [Google Scholar] [CrossRef]
  13. Mikhailov, S.A. Quantum theory of the third-order nonlinear electrodynamic effects of graphene. Phys. Rev. B 2016, 93, 085403. [Google Scholar] [CrossRef] [Green Version]
  14. Ooi, K.J.A.; Tan, D.T.H. Nonlinear graphene plasmonics. Proc. Math. Phys. Eng 2017, 473, 20170433. [Google Scholar] [CrossRef] [PubMed] [Green Version]
  15. Hafez, H.A.; Kovalev, S.; Deinert, J.C.; Mics, Z.; Green, B.; Awari, N.; Chen, M.; Germanskiy, S.; Lehnert, U.; Teichert, J.; et al. Extremely efficient terahertz high-harmonic generation in graphene by hot Dirac fermions. Nature 2018, 561, 507. [Google Scholar] [CrossRef] [PubMed]
  16. Peres, N.M.R.; Bludov, Y.V.; Santos, J.E.; Jauho, A.P.; Vasilevskiy, M.I. Optical bistability of graphene in the terahertz range. Phys. Rev. B 2014, 90, 125425. [Google Scholar] [CrossRef] [Green Version]
  17. Bianchi, V.; Carey, T.; Viti, L.; Li, L.; Linfield, E.H.; Davies, A.G.; Tredicucci, A.; Yoon, D.; Karagiannidis, P.G.; Lombardi, L.; et al. Terahertz saturable absorbers from liquid phase exfoliation of graphite. Nat. Commun. 2017, 8, 15763. [Google Scholar] [CrossRef]
  18. Boyd, R.W. Nonlinear Optics; Academic Press: Boston, MA, USA, 2008. [Google Scholar]
  19. Lin, K.H.; Weng, S.W.; Lyu, P.W.; Tsai, T.R.; Su, W.B. Observation of optical second harmonic generation from suspended single-layer and bi-layer graphene. APL 2014, 105, 151605. [Google Scholar] [CrossRef]
  20. Yao, B.; Liu, Y.; Huang, S.W.; Choi, C.; Xie, Z.; Flor Flores, J.; Wu, Y.; Yu, M.; Kwong, D.L.; Huang, Y.; et al. Broadband gate-tunable terahertz plasmons in graphene heterostructures. Nat. Photon. 2018, 12, 1749. [Google Scholar] [CrossRef] [Green Version]
  21. Constant, T.J.; Hornett, S.M.; Chang, D.E.; Hendry, E. Intensity dependences of the nonlinear optical excitation of plasmons in graphene. Phil. Trans. R. Soc. A 2017, 375, 20160066. [Google Scholar] [CrossRef] [Green Version]
  22. Tollerton, C.J.; Bohn, J.; Constant, T.J.; Horsley, S.A.R.; Chang, D.E.; Hendry, E.; Li, D.Z. Origins of All-Optical Generation of Plasmons in Graphene. Sci. Rep. 2019, 9, 3267. [Google Scholar] [CrossRef]
  23. Wang, Y.; Tokman, M.; Belyanin, A. Second-order nonlinear optical response of graphene. Phys. Rev. B 2016, 94, 195442. [Google Scholar] [CrossRef] [Green Version]
  24. Ventura, G.B.; Passos, D.J.; Lopes dos Santos, J.M.B.; Viana Parente Lopes, J.M.; Peres, N.M.R. Gauge covariances and nonlinear optical responses. Phys. Rev. B 2017, 96, 035431. [Google Scholar] [CrossRef] [Green Version]
  25. Passos, D.J.; Ventura, G.B.; Lopes, J.M.V.P.; Santos, J.M.B.L.d.; Peres, N.M.R. Nonlinear optical responses of crystalline systems: Results from a velocity gauge analysis. Phys. Rev. B 2018, 97, 235446. [Google Scholar] [CrossRef] [Green Version]
  26. Blount, E. Formalisms of Band Theory. Solid State Phys. 1962, 13, 305. [Google Scholar] [CrossRef]
  27. Bludov, Y.V.; Vasilevskiy, M.I.; Peres, N.M.R. Mechanism for graphene-based optoelectronic switches by tuning surface plasmon-polaritons in monolayer graphene. EPL 2010, 92, 68001. [Google Scholar] [CrossRef] [Green Version]
  28. Ulbricht, R.; Hendry, E.; Shan, J.; Heinz, T.F.; Bonn, M. Carrier dynamics in semiconductors studied with time-resolved terahertz spectroscopy. Rev. Mod. Phys. 2011, 83, 543. [Google Scholar] [CrossRef] [Green Version]
  29. Doukas, S.; Sharma, P.; Goykhman, I.; Lidorikis, E. Electrical detection of graphene plasmons for mid-infrared photodetection and chemical sensing: A computational study. APL 2022, 121, 051103. [Google Scholar] [CrossRef]
  30. Mikhailov, S.A. Theory of the strongly nonlinear electrodynamic response of graphene: A hot electron model. Phys. Rev. B 2019, 100, 115416. [Google Scholar] [CrossRef] [Green Version]
  31. Pogna, E.A.A.; Tomadin, A.; Balci, O.; Soavi, G.; Paradisanos, I.; Guizzardi, M.; Pedrinazzi, P.; Mignuzzi, S.; Tielrooij, K.J.; Polini, M.; et al. Electrically Tunable Nonequilibrium Optical Response of Graphene. ACS Nano 2022, 16, 3613. [Google Scholar] [CrossRef] [PubMed]
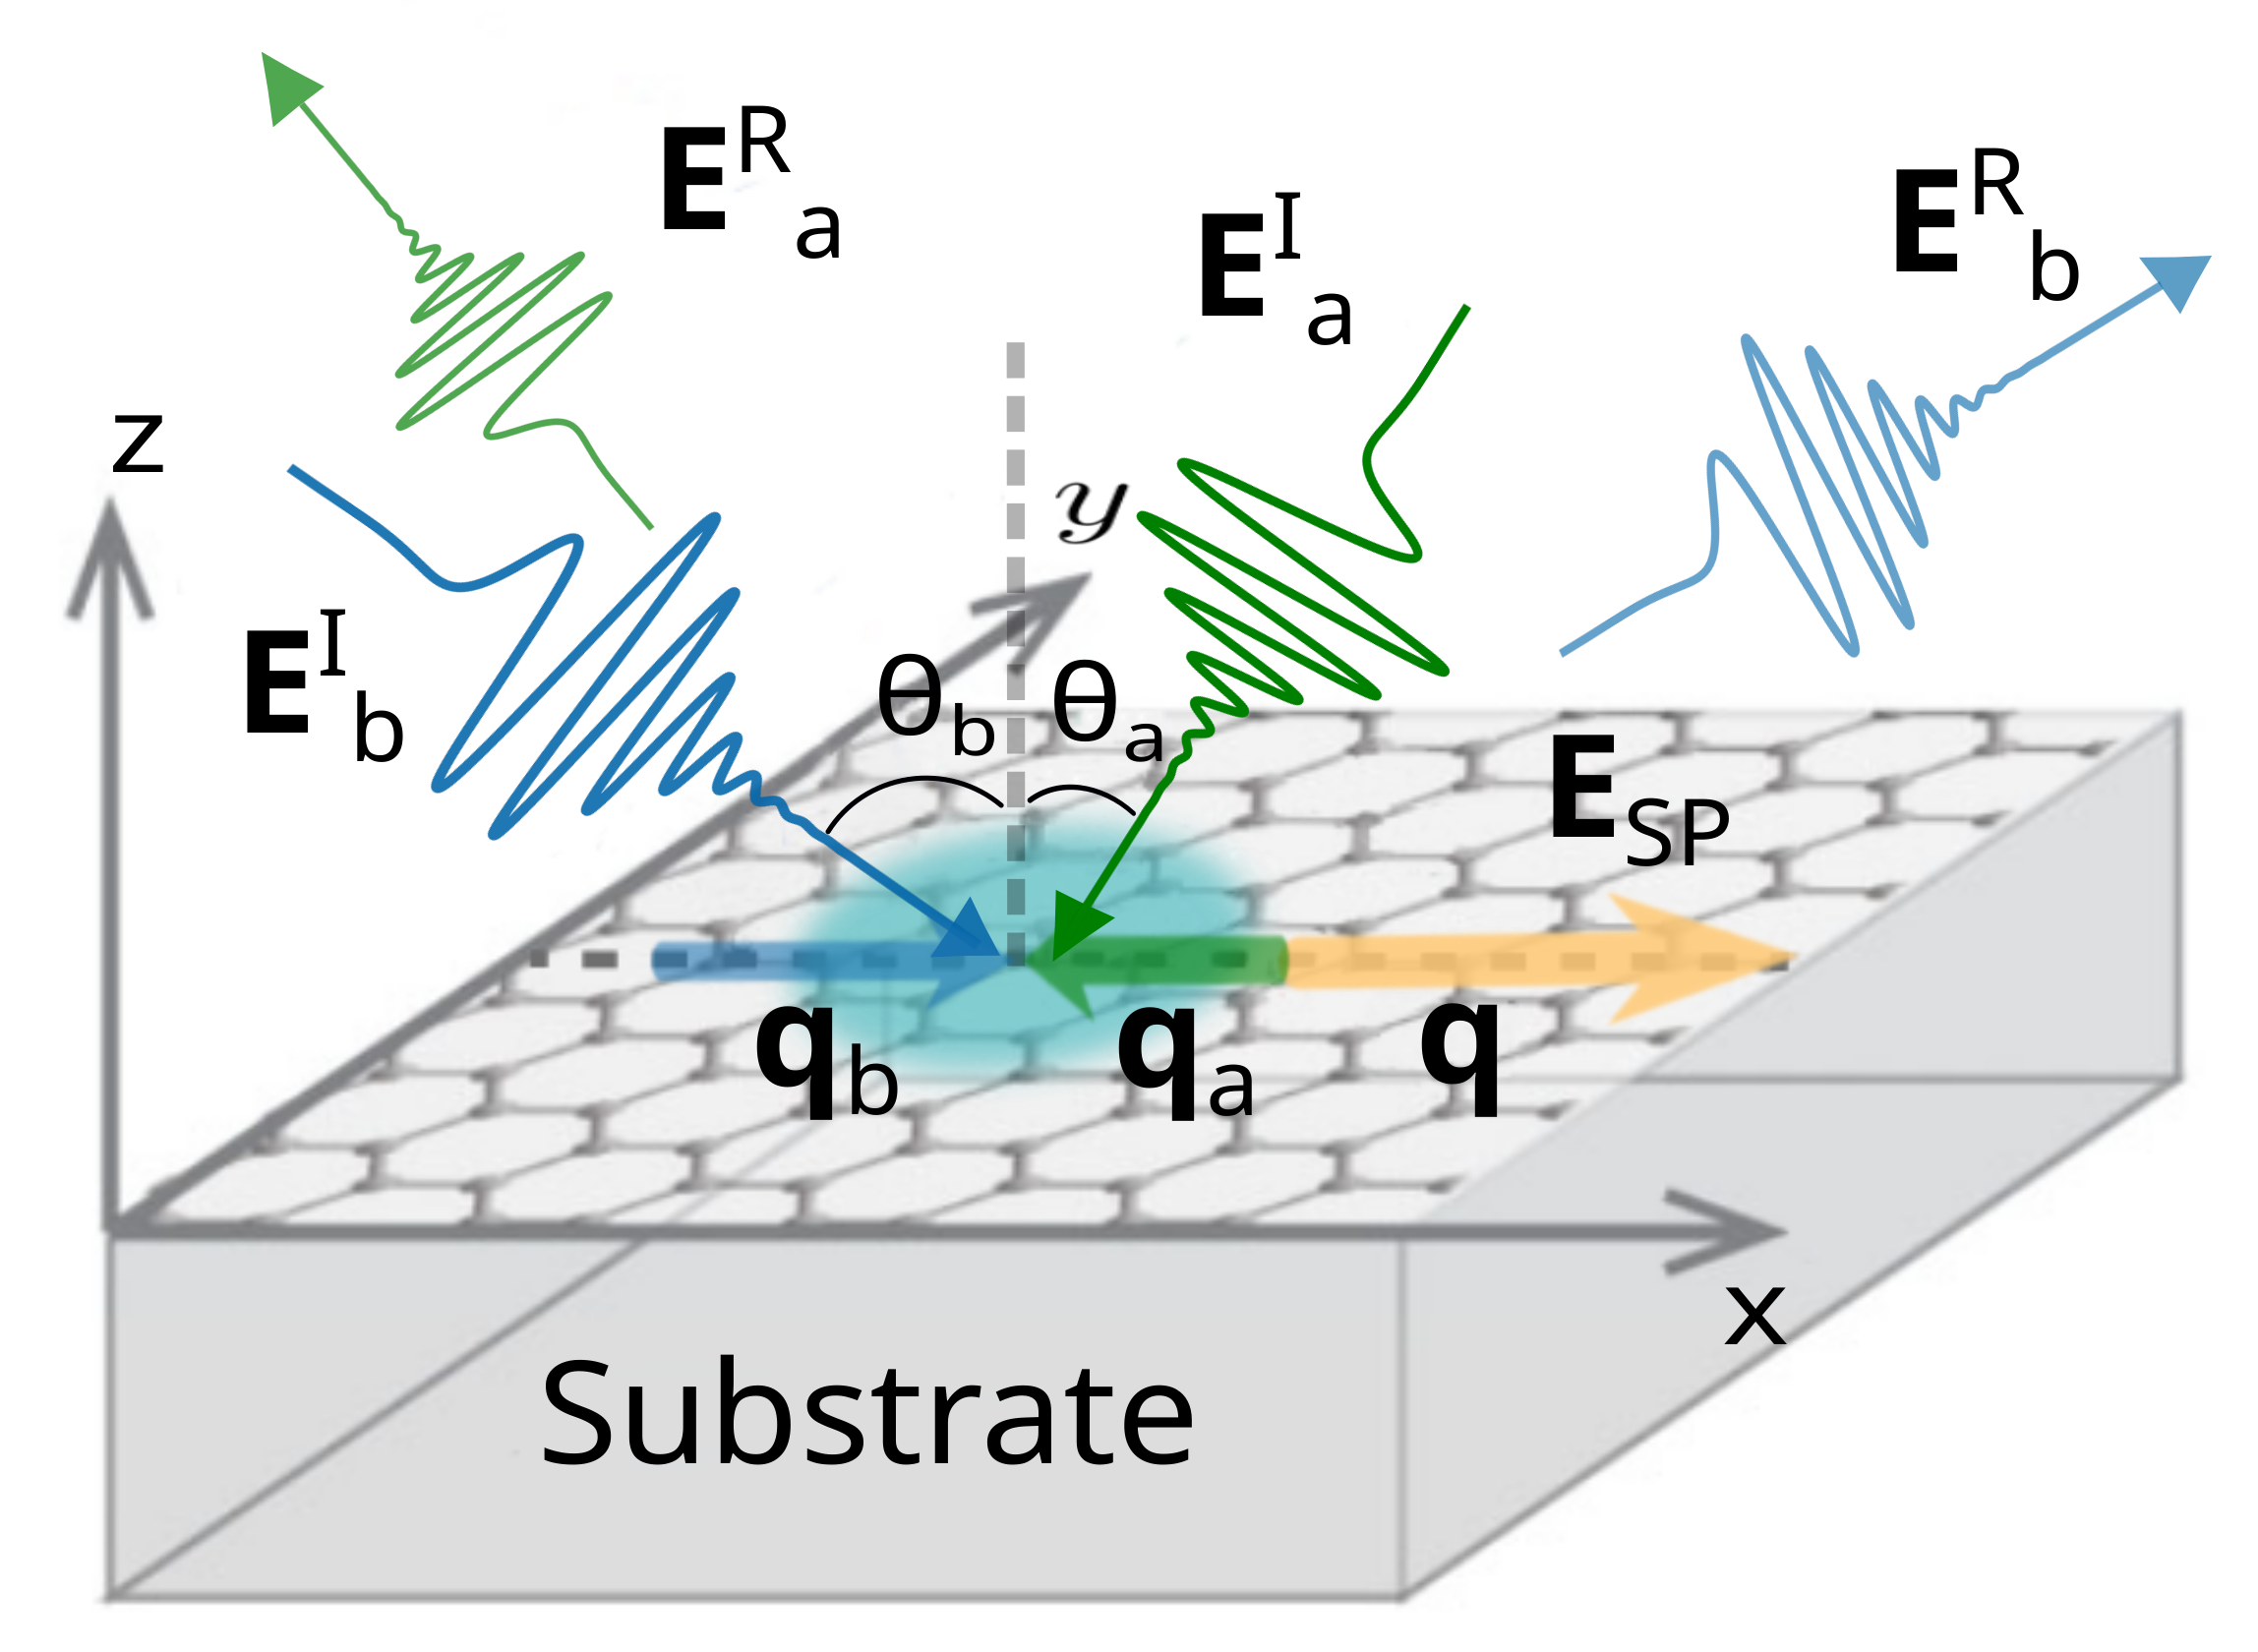
Figure 1. Schematics of all-optical generation of surface plasmons via a frequency-difference NL process of interaction of two optical beams, a and b, represented by their electric fields E a , b , including the incident and reflected ones. E SP represent the surface plasmon field.
Applsci 12 12376 g001
Figure 2. Transitions and states considered in the calculation of the conductivity for DF generation at frequency ω : Channel 1 (right) and Channel 2 (left). For the process of generation of probe photons ( ω a ), the green and yellow arrows are inverted.
Applsci 12 12376 g002
Figure 3. Real and imaginary parts of σ xxx Ω , Ω b , Ω a plotted vs ω (left panel) and q (right panel). The solid and dashed lines were calculated using expression (8) with Fermi levels E F = 300 and 500 meV, respectively. The triangles and squares are numerical calculations of expression (6). In the right panel, θ b was fixed at 40 , while in the left plot, ω was fixed at 94 ps 1 . In both cases ω a = 3065 ps 1 , γ = 10.6 meV , and θ a = 20 .
Applsci 12 12376 g003
Figure 4. Differential reflectance (left, solid lines), transmittance (left, dashed lines), and absorbance (right) of the pump (blue curves) and probe (green curves) beams as functions of ω . Here the Fermi energy E F = 500 meV, θ a I = 20 , and θ b I = 40 , while other parameters are the same as in Figure 3. The plasmon resonance is observed at approximately ω SP = 80 ps 1 . We assumed the same intensities for both optical beams, I a = I b = 10 16 erg cm 2 s 1 , in order to facilitate the comparison.
Applsci 12 12376 g004
Publisher’s Note: MDPI stays neutral with regard to jurisdictional claims in published maps and institutional affiliations.