Abstract
Development and population growth have made using shallow buried pipes in urban areas, highways, and subways inevitable. In this study, the performance and behavior of shallow unplasticized polyvinyl chloride (uPVC) pipes buried in sand reinforced with PET (polyethylene terephthalate) bottles produced by the end consumer filled with soil under static loads were investigated. The bottle reinforcement mattress filled with soil was vertically installed above the buried uPVC pipe inside the soil bed at the required depth; after that, backfilling was performed. The effects of the relative density of soil, placement depth, and the width of the soil-filled bottle-reinforced block were examined. The increase in relative density has shown a noticeable decrease in footing surface settlement and load transferred to the buried pipe. The test results have shown significant improvement in the ultimate bearing capacity of bottle-reinforced soil with a reduction in surface settlement. The backfill reinforced with soil-filled bottle block has shown a 71% improvement in ultimate bearing capacity. Additionally, the improvement in bearing capacity increases as the placement depth decreases and width increases. The optimum depth of placement and width of the bottle-reinforced mattress were 0.50 and 2.08 B. The proposed soil reinforcement method may be a good and relatively inexpensive alternative to traditional geosynthetic reinforcement while providing geotechnical and environmental benefits.
1. Introduction
Buried pipes are typically used to convey water, natural gases, etc. They are considered lifelines because they transport important substances [1]. The importance of pipeline ruptures is deemed to be economical, technical, and social. Several researchers concentrated on ways to protect buried polyvinyl chloride (PVC and uPVC) pipes under various conditions of loading. However, little research has been conducted on the protection of buried pipelines using recycled materials such as plastic. The authors of [2] studied the performance of strip footing under static loading reinforced with geocell and geotextile reinforcement. Various parameters were adopted in the experimental testing program, including reinforcement width, number of geotextile layers, and height of geocell below the model footing. The finding of the experiments showed improvement in ultimate bearing capacity and a reduction in footing surface settlement. Geosynthetic reinforcement reduces foundation settlement and improves the bearing capacities of foundations [3,4,5,6,7]. Beben D. [8] conducted laboratory experiments and numerical models to study the performance of buried structures such as tunnels, culverts, and bridges (corrugated steel plate structures). Various factors have been considered, including the nature of backfill soil, backfilling sequence, soil cover height, the effect of geotextile reinforced backfill, corrugated profiles, and the soil–structure interaction under different loading conditions. Numerous researchers have examined the protection of shallow buried pipes using geogrid-reinforced soil beds under static loading [9,10,11,12,13].
There is growing concern about the effect of plastic waste on the environment, recognizing the urgent need to reduce our plastic consumption. A clean and green way of reusing post-consumer polyethylene terephthalate (PET) bottles is by turning them into valuable building material—either directly or their polymer. An efficient and simple way of reusing discarded plastic bottles is in underground applications as soil reinforcement. The good mechanical characteristics of such discarded polymers make them a viable alternative to present geosynthetics such as geogrid, geocell, and geotextile. Not only would this reduce the pollution of the environment, but it would also improve soil properties while lowering polymer consumption as first-use geosynthetics, in addition to avoiding problems associated with incineration and the costs of their physical removal or recycling.
Improvement in soil mechanical properties and strength parameters due to the inclusion of the waste plastic bottle reinforcement has been studied by [14,15,16,17,18]. This literature studied the effect of using a mixture of crushed PET plastic bottle chips, PET fibers, or plastic sheets with soil as reinforcing elements. Currently, waste sand-filled PET plastic bottles are in use as a cheap construction material in some countries for the building of shelters (Figure 1a; source: UNHCR) and retaining walls (Figure 1b; source: Built it International), yet using plastic bottles in its original form for reinforcement of soil beds to improve their properties and to reduce environmental pollution is a relatively unfamiliar idea.
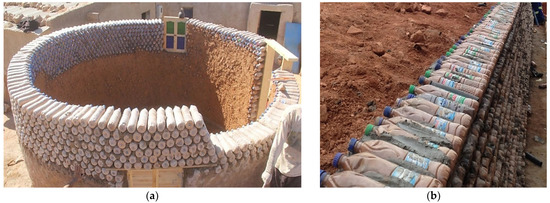
Figure 1.
Examples of sand-filled plastic bottles applications as a cheap construction material from network (a) refugee; (b) retaining wall.
There is not much available research on the role of uncrushed-form horizontally or vertically sliced plastic bottles in improving soil behavior and strength parameters [19,20,21,22] under static loads. Thus, the behavior of soils reinforced with waste plastic bottles under static loads needs further investigation.
Recently, Fattah and Mohammed Redha [23] conducted laboratory experiments on a PVC pipe buried in geocell-reinforced and unreinforced sand beds. The performance of pipes installed in sand bedding was studied, along with the various parameters that influence that performance. The findings of this research were presented in terms of the vertical crown pressure above the pipe, the surface settlement of the soil, and the crown’s displacement amplitude. It was concluded that the degree of compaction of the backfilled sand has a significant impact on the performance of the buried pipe. The vertical crown pressure above the pipe, surface settlement of the soil, and displacement amplitude all decrease by approximately 30%, 40%, and 15%, respectively, when the relative density of the sand increases from 30 to 60 percent.
Therefore, in the current study, a series of experimental tests were carried out to assess the influence of waste plastic bottles on the improvement of soil above buried uPVC pipe under static loads. The impact of PET bottle block placement depth and width on soil response was investigated. The applied load–surface footing settlement curves of PET bottle-reinforced beds were compared to that of unreinforced beds during testing.
2. Materials and Experimental Setup
2.1. Material Properties
2.1.1. Backfill and Infill Soils
The sand used in this study was ordered from AL-NAWAFITH Company in Al-Najaf. Table 1 shows the results of conventional soil tests performed on representative oven-dried samples. Sand does not contain fine particles or gravel particles, and soil is classified according to the Unified Soil Classification System (USCS) as SP. Figure 2 illustrates the grain size distribution curve for the adopted sand.

Table 1.
Properties of backfill and infill soils.
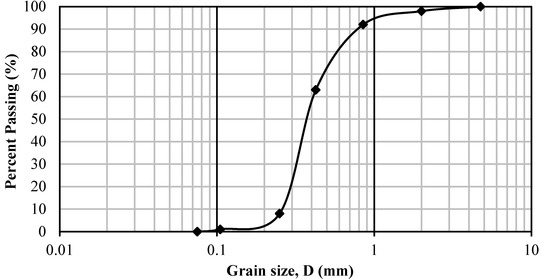
Figure 2.
Particle size distribution for backfill and infill soils.
2.1.2. uPVC Pipe
A 110 mm uPVC pipe with a wall thickness of 4.3 mm was adopted in the present study. This commercial pipe is widely used in local Iraqi markets for supplying water, agriculture, and sewage. Table 2 summarizes the pipe structural parameters as provided by the manufacturer.
Table 2.
Properties of the pipe.
2.1.3. PET (Polyethylene Terephthalate) Bottles
A sample of a used PET bottle filled with soil is shown in Figure 3. The outer diameter and height of the bottles were 52 and 140 mm, respectively. In order to establish a clean and green environment in the laboratory, plastic bottles were chosen from the local Iraqi market.
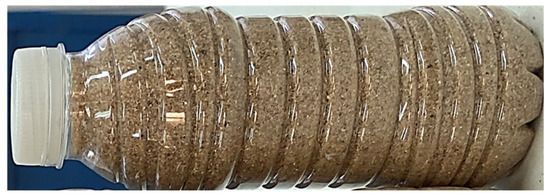
Figure 3.
Sample of soil-filled post-consumer PET bottle.
In the experiment, used PET bottles of the same size filled with soil were tied with polypropylene (PP) strips and cloth duct tape, positioned vertically, and used as a reinforcing layer to protect the buried uPVC pipe (Figure 4). The bottle cap is made of HDPE material and is usually tough enough to withstand the pressure induced within the bottle due to externally applied loads.
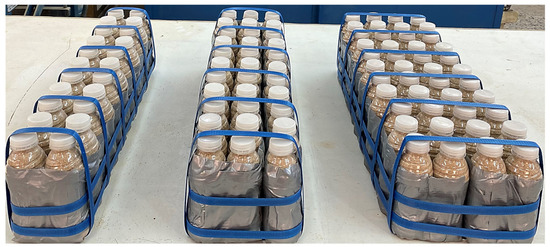
Figure 4.
Soil-filled post-consumer PET bottle mattresses.
2.1.4. Polypropylene (PP) Strips and Cloth Duct Tape
Several polypropylene (PP) strips and cloth duct tape (Figure 5) were used to keep the bottles together. When the bottles are loaded, this dramatically reduces their movement and inhibits lateral slipping. The PP strips selected were the kind that is usually used to keep boxes closed during shipment. Table 3 lists the characteristics of pp strips and cloth duct tape as given by the manufacturer businesses. Clamps (Figure 6) were utilized to link and fasten the two ends of each strip to generate tension while applying weight. During testing, no strip rupture was seen.
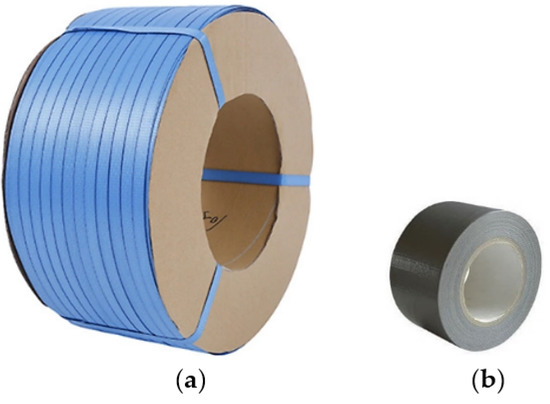
Figure 5.
(a) PP strip; (b) cloth duct tape.
Table 3.
Properties of PP strips and cloth duct tape.
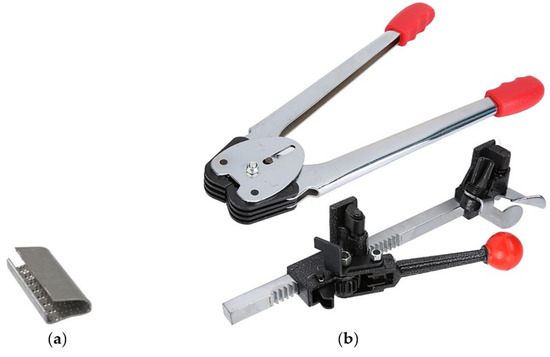
Figure 6.
(a) Strapping seals; (b) plastic packer machine.
2.2. Experimental Setup
A steel test container of 600 mm × 600 mm × 700 mm (width × length × depth) was used in the present study. The planar dimension is approximately 6 fold the width of the loading steel plate (B = 100 mm). A rigid foundation of a 20 mm thick steel plate with dimensions of 580 mm long (leaving 10 mm from each side of the foundation to avoid direct wall friction with the test container) and 100 mm wide was placed in the center of the container to apply uniform pressure to the sandy soil surface. An S-shaped load cell with a capacity of 50 kN was placed between the reaction frame and the loading ram to record the vertical applied pressure to the loading steel plate. An electromechanical sensor (Linear Variable Differential Transformer, LVDT) with a length of 50 mm was used to measure the settlement of the loading plate during the test. The load cell and LVDT were programmed by LabVIEW software and operated in the laboratory in order to guarantee the reliability of readings obtained with it. All instrumentation output data were read and collected using a twenty-four-channel digital data logger. Before each test, all measurement equipment was calibrated. Figure 7 illustrates the test setup schematic.
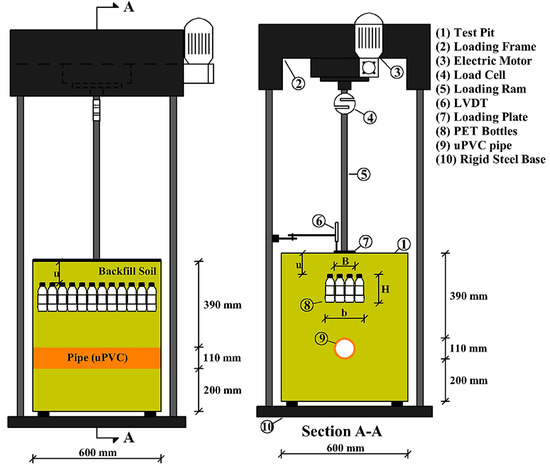
Figure 7.
Schematic illustration of the testing apparatus.
2.3. Test Preparation and Experimental Procedure
Experiments were conducted at relative densities of sandy soil bed, DR = 30, 60, and 80%, resulting in unit weights of 15.46, 16.63, and 17.51 kN/m3. The backfill soil was compacted to the required density by tamping with a rigid steel plate. After backfilling, the sand surface was leveled. The steel test container was filled with the sandy soil in two layers under the pipe (RD = 80% for all tests, resulting in unit weights of 17.51 kN/m3); each layer was approximately 100 mm thick; thus, the thickness of the sandy soil bed under the pipe was 200 mm. Over the pipe base level, the steel container was filled with five layers of thickness values as 110 mm, 90 mm, and 100 mm. The soil-filled bottles (tied with cloth duct tape and PP strips) were arranged referring to the experimental testing program. The longitudinal axis of the plastic bottles filled with sandy soil is perpendicular to the compacted soil surface. After preparing the soil in the testing container, the loading steel plate was centered on the surface of the soil underneath the loading ram, and the pressure and settlement sensors were connected. The pressure was then vertically applied to the model footing located at the surface of the soil under the software control system.
2.4. Testing Program
In this testing program, three sets of tests were carried out to examine the influence of the relative density of soil, soil cover above the bottle reinforcement layer (u), and the width of the bottle reinforcement zone (b) on the performance improvement of the soil backfill above the buried pipe. In addition, the effect of plastic bottle reinforcement on the surface settlement of the soil obtained as a function of vertically applied loads was evaluated. Three different relative densities of soil (DR = 30, 60, and 80%), three bottle placement depth ratios (u/B = 0.5, 1.0, and 1.5), and three reinforcement width ratios (b/B = 1.04, 1.56, and 2.08) were investigated. The model foundation was gradually loaded. Several replicate installations were conducted to verify the reproducibility of loading performance, instrumentation, and applied loading control. Table 4 lists the results of independent tests performed in total.
Table 4.
Experimental study plan.
3. Results and Discussion
The effect of different parameters and experimental testing results are presented in this section. Two non-dimensional parameters named bearing capacity ratio, BCR, and percentage reduction in settlement, PRS, are adopted, similar to the previous studies [2,30], to evaluate the increase in bearing capacity.
BCR compares the ultimate bearing capacity of the plastic bottle-reinforced sand (qreinf.) to that of the unreinforced sand (qunreinf.) at the same surface footing settlement and given by Equation (1).
PRS, defined by Equation (2), compares the settlement of the plastic bottle-reinforced sand (Sreinf.) to that of the unreinforced sand (Sunreinf.) at the same applied pressure.
Depending on the failure criterion stated by [31], the failure is defined for all model tests as the load causing a settlement equivalent to 10% of the width of the model footing. BCR value is calculated when S/B is equal to 10%. This is because (1) the footing settlement of a plastic bottle-reinforced bed is always lower than that of an unreinforced bed, and (2) most of the time, the foundation is designed for practical situations under certain circumstances; large settlements of basis are not accepted and are limited to small values. Nonetheless, the ultimate bearing capacity and BCR ratios reported at S/B = 10% for all tests with various reinforcement circumstances are summarized in Table 5.
Table 5.
Ultimate bearing capacity and BCR ratios for various reinforcement parameters (reported at S/B = 10%).
3.1. Bottles-Reinforcement Placement Depth (u/B) Effect
Figure 8a–c illustrates the vertical applied pressure-surface settlement of footing graphs with different relative densities for the unreinforced and plastic bottles reinforced beds at various placement depths (u/B). The values of reinforcement width and height ratios are b/B = 1.04 and H/B = 1.4 for all tests. The improvement of ultimate bearing capacity decreases as the placement depth ratio (u/B) increases without a distinct optimum value. Compared to more flexible reinforcements such as geogrid, geocell, and geotextile, the mechanism behind the improvement in the ultimate bearing capacity of soil bed brought about by relatively tough soil-filled plastic bottles appears to be different. By decreasing the shear stresses transported to the weaker soil beneath the subbase when the vertical loads are applied, the tension created in the flexible reinforcements increases bearing capacity [32]. The optimum covering soil thickness is necessary to enable soil-geosynthetic interaction and full deployment of ultimate reinforcement capacity. For the tough soil-filled plastic bottles utilized in this work, a thinner soil surface cover prevents more settlement at any given applied load because of compression in the soil above the reinforcement bottles [22]. However, lower (u/D) ratios are desirable with the configuration and plastic bottle reinforcement investigated. To maintain a leveled surface of the soil to which the applied loading can be applied, the ideal covering soil thickness is most likely that amount.
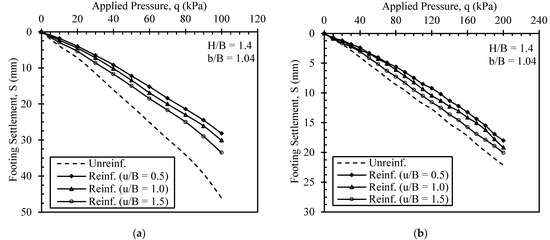
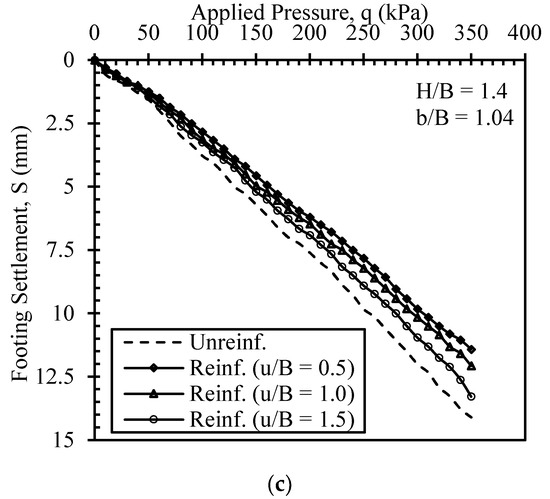
Figure 8.
Applied pressure with footing surface settlement curves for various placement depths reported at (a) DR = 30%, (b) DR = 60%, and (c) DR = 80%.
Nevertheless, the bottle-reinforced sand bed performs are better at lower u/B ratios because there is less soil between the model footing and the bottle reinforcement, decreasing the probability of lateral soil shear. Additionally, since the soil is so thin, there is little opportunity for compression. However, when soil covering increases, the bottle reinforcement’s contribution decreases because of less stress and, thus, less strain reaches the reinforcement. This means that the reinforcement has less of an effect on the overlying soil’s shear movement [22]. However, these results are in agreement with [33], who conducted that the decrease in cover depth leads to better performance of buried concrete pipes.
Referring to Figure 9a–c derived from Figure 8a–c, the variation in BCR and PRS with different reinforcement placement depth ratios at various relative densities is shown. The BCR values decrease as the placement depth ratio increases. However, the behavior is similar for PRS, with a more marked decrease as the placement depth ratio increases. This Increases in footing settlement value with increasing depth of the bottle reinforcement mattress are in line with the idea presented one paragraph earlier, and this is due to the soil above the bottle reinforcement mattress can shear more easily when the distance between the model footing and the bottle reinforcement mattress is higher.
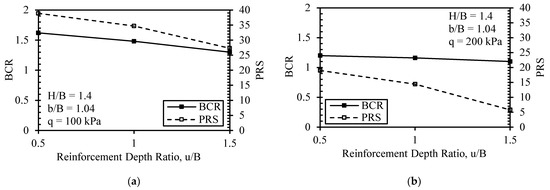
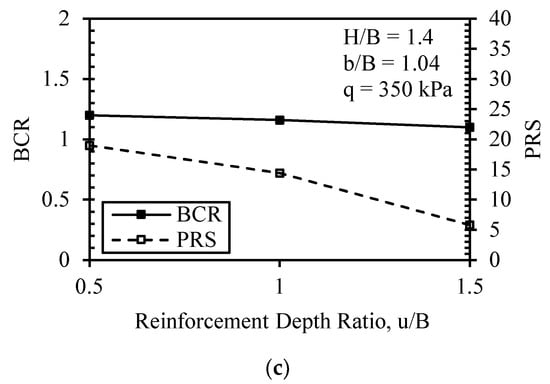
Figure 9.
Variation of BCR and PRS with different placement depths reported at (a) DR = 30%, (b) DR = 60%, and (c) DR = 80%.
3.2. Bottles-Reinforcement Width (b/B) Effect
Figure 10a–c presents the vertical applied pressure-surface settlement of footing graphs with different relative densities for the unreinforced and plastic bottle-reinforced beds at various plastic bottle reinforcement widths (b/B). The bed-reinforced width (b/B) of PET bottles was tested at a single u/B (at the optimum u/B derived from earlier test series) for three ratios. The height ratios (H/B) for all tests are 1.4. The unreinforced case was also plotted for comparison. The ultimate bearing capacity of the soil increases with increasing reinforcement width. In contrast to reinforcement placement depth, ultimate bearing capacity slightly increases with reinforcement width, probably because all widths of bottle reinforcement mattresses prohibit the shear stress from being transmitted on the underneath soil. So, the bearing capacity is not enhanced by increasing the bottle reinforcement width. However, when b/B increases, the rate of BCR vales increases, leading to a value of 1.71 (71% increase) at u/B = 0.5 due to the increased soil surface settlement at later stages of loading. The footing surface settlement decreases with increasing reinforcement width. Figure 11a–c illustrates the variation in BCR and PRS with a change in reinforcement width at various relative densities. The BCR values increase as the reinforcement width ratio increases. However, the behavior is the same for PRS.
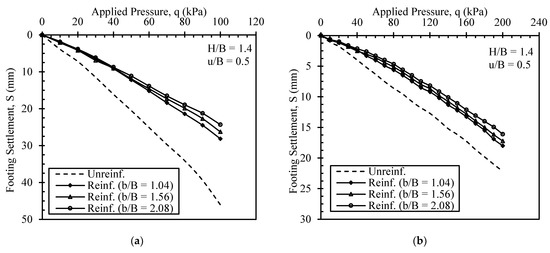
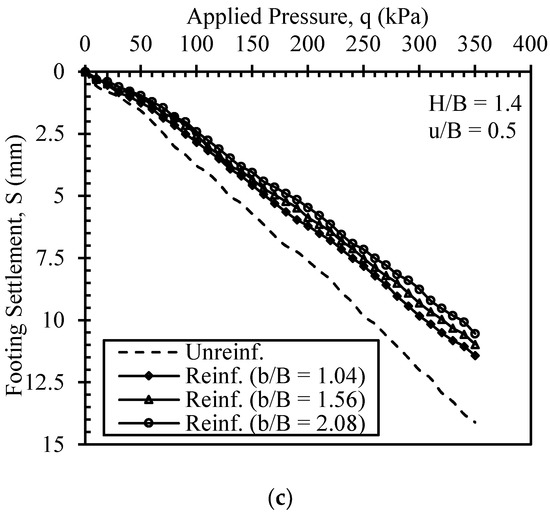
Figure 10.
Applied pressure with footing surface settlement curves for various reinforcement widths reported at (a) DR = 30%, (b) DR = 60%, and (c) DR = 80%.
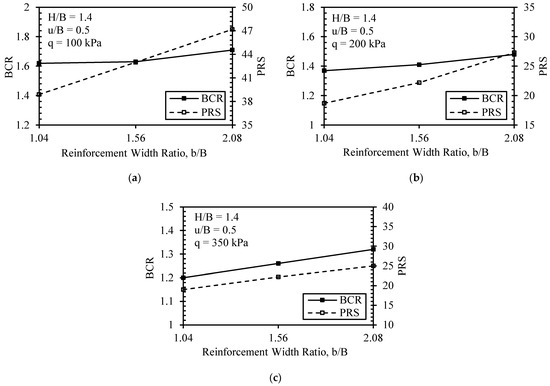
Figure 11.
Variation of BCR and PRS with different reinforcement widths reported at (a) DR = 30%, (b) DR = 60%, and (c) DR = 80%.
The present results are compatible with the findings of [20,22,34]. Thakare and Sonule [20] concluded that bearing capacity increases with the increase in the width of plastic water bottle reinforcement. In addition, Moghaddas Tafreshi et al. [22] mentions the improvement in the ultimate bearing capacity of soil due to the presence of plastic bottles, and that the reinforcement zone decreases as the depth of placement increases and width decreases. Abdelfateh et al. [34] found that increasing soil shear strength reduces pipe deflection under pressure due to an increase in soil strength and the relative stiffness of the pipe–soil system.
3.3. Relative Density of Backfill Soil (DR) Effect
Figure 12 depicts the effect of the relative density of the soil on the bearing pressure of a model footing supported on a bottle-reinforced sand bed. Figure 12a–e show how the applied load varies with the surface settlement on the unreinforced sand bed at a relative density of 80% (the dotted line in each of these diagrams represents a baseline load capacity that can be used to measure the performance improvements from the reinforcements) and the variation of the applied pressure on the model footing on a reinforced sand bed with the surface settlement at relative densities of 30, 60 and 80%. It is clear from this diagram that soil density has a significant impact on the footing’s bearing capacity and settlement. Increases in relative soil density resulted in more bearing pressure and less footing settlement than those seen with any of the reinforcing conditions, as seen by the stiffer pressure-settlement reactions. The shear strain created before failure in the failure zone increased due to this behavior [3]. This was because denser sand layers had higher reinforcing performance.
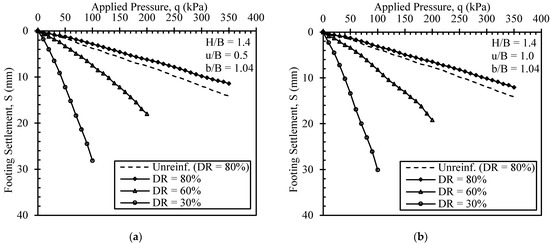
Figure 12.
Variation of applied pressure with footing surface settlement for different relative densities of soil, H/B = 1.4, and u/B; b/B = (a) 0.5; 1.04, (b) 1.0; 1.04, (c) 1.5; 1.04, (d) 0.5; 1.56, and (e) 0.5; 2.08, respectively.
Figure 12 also illustrates that higher applied pressure occurred at lower settlements as the relative density of the soil bed increased. For example, the ultimate bearing capacity values for relative densities of 30, 60, and 80% with bottle reinforcement (u/B = 0.5 and b/B = 2.08) were 45.3, 139, and 337.3 kPa at a settlement level (S/B) of 10%. Moreover, the footing surface settlement at a given bearing pressure decreased as the relative density of the soil increased [35]. A similar reduction in the soil surface settlement, irrespective of the reinforcement condition, has been reported by Moghaddas Tafreshi and Khalaj [36] from experimental tests on buried pipes backfilled with a geogrid-reinforced sand bed.
4. Summary and Conclusions
With the increased use of drinking water and soda drink bottles, there is a need for a green yet environmentally friendly approach to adopting PET plastic bottles. In this paper, the benefits of using mattresses made from used PET bottles filled with soil to improve foundation response under static loading were examined. The influence of bottle placement depth ratio (u/B) and reinforced mattress width ratio (b/B) was investigated. The following conclusions can be drawn from the reported results of the experimental work:
- ▪
- Tied soil-filled PET bottles perform best when located close to the loading steel plate. The soil bed’s ultimate bearing capacity increases as the bottle’s placement depth decreases.
- ▪
- As the width of the bottle’s reinforcement block increases, the ultimate bearing capacity of the soil slightly increases too. However, the improvement of the ultimate bearing capacity of bottle-reinforced soil’s bed due to increasing the width of bottle reinforcement mattresses is not significant.
- ▪
- The bearing capacity ratio (BCR) of the soil bed was improved by a factor of ~1.71 (resulting in an average 71% improvement in ultimate bearing capacity at RD = 30%), which, in turn, will reduce the surface settlement of backfilled soil and result in a firm soil bed above the buried pipe.
- ▪
- As the relative density of the bottle-reinforced soil bed increases, the bearing pressure increases (and the footing surface settlement decreases) due to the inclusion of a bottle reinforcement mattress. In addition, at a given applied pressure, the footing surface settlement decreases as the relative density of the sand bed increases.
- ▪
- The optimum placement depth and width of the bottle-reinforced mattress were 0.50 and 2.08 B, respectively.
Although the concept in this paper might be used in pursuit of some compaction to fill the bottles, practical field implementation might require more research. For such a technology to become more widely used, an automatic system for filling and arranging plastic bottles may be necessary. The adopted reinforcement system is reasonably best suited when the project site has relatively fine-grained soil and is not proper for subgrades in their original shape without treatment.
It is important to note that only a small number of experiments were conducted, utilizing only one backfill and infill soil, one plastic bottle dimension (in both total length and outer diameter), uPVC pipe’s mechanical properties and dimensions (i.e., wall thickness and diameter), and one size of loading steel plate. As long as the earth has acceptable high frictional properties, it is probably not too significant what kind of soil is put in the bottles. Even if cohesive plastic soil could be placed successfully into the bottles, it would probably not be preferred. While the frictional soil utilized in the research detailed in this study would have worked to prevent bottle deformation under the confining stress supplied by the confinement of the plastic bottle, such soil would allow gradual plastic deflections.
Author Contributions
Conceptualization, F.H.A.-A. and M.Y.F.; methodology, S.A.A.-H., F.H.A.-A. and M.Y.F.; software, S.A.A.-H.; validation, F.H.A.-A. and M.Y.F.; formal analysis, M.Y.F.; investigation, S.A.A.-H.; resources, S.A.A.-H., F.H.A.-A. and M.Y.F.; data curation, S.A.A.-H.; writing—original draft preparation, S.A.A.-H.; writing—review and editing, F.H.A.-A. and M.Y.F.; visualization, S.A.A.-H.; supervision, F.H.A.-A. and M.Y.F.; project administration, M.Y.F.; funding acquisition, Not applicable. All authors have read and agreed to the published version of the manuscript.
Funding
This research received no external funding.
Institutional Review Board Statement
Not applicable.
Informed Consent Statement
Not applicable.
Data Availability Statement
The data that have been used are confidential.
Acknowledgments
Sureat Alghazal Company supported this research in Baghdad. The authors would like to thank the staff of the Soil Mechanics Laboratory at the Civil Engineering Department of the University of Technology—Iraq for their help in the preparation of the experimental test setup and apparatus operation.
Conflicts of Interest
The authors declare no conflict of interest.
References
- Choo, Y.W.; Abdoun, T.H.; O’Rourke, M.J.; Ha, D. Remediation for buried pipeline systems under permanent ground deformation. Soil Dyn. Earthq. Eng. 2007, 27, 1043–1055. [Google Scholar] [CrossRef]
- Tafreshi, S.M.; Dawson, A.R. Comparison of bearing capacity of a strip footing on sand with geocell and with planar forms of geotextile reinforcement. Geotext. Geomembr. 2010, 28, 72–84. [Google Scholar] [CrossRef]
- Moghaddas Tafreshi, S.N.; Khalaj, O.; Halvaee, M.J.G.I. Experimental study of a shallow strip footing on geogrid-reinforced sand bed above a void. Geosynth. Int. 2011, 18, 178–195. [Google Scholar] [CrossRef]
- El Sawwaf, M.A. Behavior of strip footing on geogrid-reinforced sand over a soft clay slope. Geotext. Geomembr. 2007, 25, 50–60. [Google Scholar] [CrossRef]
- Deb, K.; Chandra, S.; Basudhar, P.K. Settlement response of a multilayer geosynthetic-reinforced granular fill–soft soil system. Geosynth. Int. 2005, 12, 288–298. [Google Scholar] [CrossRef]
- Shin, E.C.; Das, B.M. Experimental study of bearing capacity of a strip foundation on geogrid-reinforced sand. Geosynth. Int. 2000, 7, 59–71. [Google Scholar] [CrossRef]
- Wysokowski, A. Influence of single-layer geotextile reinforcement on load capacity of buried steel box structure based on laboratory full-scale tests. Thin-Walled Struct. 2021, 159, 107312. [Google Scholar] [CrossRef]
- Beben, D. Soil-Steel Bridges. In Design, Maintenance and Durability; Springer Nature: Cham, Switzerland, 2020. [Google Scholar]
- Thallak, S.G.; Saride, S.; Dash, S.K. Performance of surface footing on geocell-reinforced soft clay beds. Geotech. Geol. Eng. 2007, 25, 509–524. [Google Scholar] [CrossRef]
- Palmeira, E.M.; Andrade, H.K.P.A. Protection of buried pipes against accidental damage using geosynthetics. Geosynth. Int. 2010, 17, 228–241. [Google Scholar] [CrossRef]
- Alotaibi, E.; Omar, M.; Shanableh, A.; Zeiada, W.; Fattah, M.Y.; Tahmaz, A.; Arab, M.G. Geogrid bridging over existing shallow flexible PVC buried pipe–Experimental study. Tunn. Undergr. Space Technol. 2021, 113, 103945. [Google Scholar] [CrossRef]
- Aattah, M.Y.; Zbar, B.S.; Al-Kalali, H.H.M. Three-dimensional finite element simulation of the buried pipe problem in geogrid reinforced soil. J. Eng. 2016, 22, 60–73. [Google Scholar]
- Fattah, M.Y.; Zbar, B.S.; Al-Kalali, H.H.M. Experimental study on the effect of embedment depth of buried flexible pipe subjected to static load. Glob. J. Eng. Sci. Res. Manag. 2015, 2, 113–122. [Google Scholar]
- Ahmed, A.; Ugai, K.; Kamei, T. Investigation of recycled gypsum in conjunction with waste plastic trays for ground improvement. Constr. Build. Mater. 2011, 25, 208–217. [Google Scholar] [CrossRef]
- Dutta, S.; Mandal, J.N. Feasibility study on waste plastic water bottles as encasements of stone columns for ground improvement. In Proceedings of the International Symposium on Design and Practice of Geosynthetic-Reinforced Soil Structures, Bologna, Italy, 14–16 October 2013; pp. 379–388. [Google Scholar]
- Karmacharya, R.; Acharya, I.P. Reinforcement of Soil Using Recycled Polyethylene Terephthalate (PET) Bottle Strips. In Proceedings of the IOE Graduate Conference, Lalitpur, Nepal, 29–30 December 2017; Volume 5. [Google Scholar]
- Singh, J.; Sonthwal, V.; Rattan, J. Review on improvement of engineering properties of soil using waste plastic bottles strips (Polyethylene terephthalate). Int. J. Emerg. Technol. 2017, 8, 1–4. [Google Scholar]
- Peddaiah, S.; Burman, A.; Sreedeep, S. Experimental study on effect of waste plastic bottle strips in soil improvement. Geotech. Geol. Eng. 2018, 36, 2907–2920. [Google Scholar] [CrossRef]
- Jaya, A.D.; Sunil, A.; Joseph, M.; Varghese, M.; Veena, M. Soil Stabilization Using Raw Plastic Bottles. In Proceedings of the Indian Geotechnical Conference, Kochi, India, 15–17 December 2011; pp. 489–492. [Google Scholar]
- Thakare, S.W.; Sonule, S.K. Performance of plastic bottle reinforced soil. Int. J. Eng. Innov. Res. 2013, 2, 207. [Google Scholar]
- Dutta, S.; Nadaf, M.Á.; Mandal, J.N. An overview on the use of waste plastic bottles and fly ash in civil engineering applications. Procedia Environ. Sci. 2016, 35, 681–691. [Google Scholar] [CrossRef]
- Moghaddas Tafreshi, S.N.; Rafiezadeh Malekshah, A.; Rahimi, M.; Dawson, A.R. (2022). Bearing capacity improvement using soil-filled post-consumer PET bottles. Geosynth. Int. 2022, 29, 205–216. [Google Scholar] [CrossRef]
- Fattah, M.; Mohammed Redha, W.B. Protection of flexible pipes from dynamic surface stresses by Geocell-reinforced sand backfill. Int. J. Min. Geo-Eng. 2022, 56, 61–66. [Google Scholar]
- ASTM Committee D-18 on Soil and Rock. Standard Test Methods for Specific Gravity of Soil Solids by Water Pycnometer; ASTM International: West Conshohocken, PA, USA, 2006. [Google Scholar]
- ASTM Committee D-18 on Soil and Rock. Standard Test Methods for Maximum Index Density and Unit Weight of Soils Using a Vibratory Table; ASTM International: West Conshohocken, PA, USA, 2006. [Google Scholar]
- American Society for Testing and Materials. Standard Test Methods for Minimum Index Density and Unit Weight of Soils and Calculation of Relative Density; ASTM International: West Conshohocken, PA, USA, 2006. [Google Scholar]
- American Society for Testing and Materials Committee D18 on Soil and Rock. Standard Test Methods for Particle-Size Distribution (Gradation) of Soils Using Sieve Analysis; ASTM International: West Conshohocken, PA, USA, 2004. [Google Scholar]
- ASTM Committee D-18 on Soil and Rock. Standard Practice for Classification of Soils for Engineering Purposes (Unified Soil Classification System); ASTM International: West Conshohocken, PA, USA, 2011. [Google Scholar]
- D3080/D3080M; Standard Test Method for Direct Shear Test of Soils under Consolidated Drained Conditions. ASTM International: West Conshohocken, PA, USA, 2011.
- Omar, M.T.; Das, B.M.; Puri, V.K.; Yen, S.C. Ultimate bearing capacity of shallow foundations on sand with geogrid reinforcement. Can. Geotech. J. 1993, 30, 545–549. [Google Scholar] [CrossRef]
- Terzaghi, K. Theoretical Soil Mechanics; John Wiley and Sons Inc.: New York, NY, USA, 1943; Volume 314. [Google Scholar]
- Milligan, G.W.E.; Jewell, R.A.; Houlsby, G.T.; Burd, H.J. A new approach to the design of unpaved roads-part 1. Ground Eng. 1989, 22, 25–29. [Google Scholar]
- Fang, H.; Yang, K.; Li, B.; Tan, P.; Wang, F.; Du, X. Experimental and numerical study on mechanical analysis of buried corroded concrete pipes under static traffic loads. Appl. Sci. 2019, 9, 5002. [Google Scholar] [CrossRef]
- Abdelfateh, K.; Mohamed, B.; Fattah, M.Y. Numerical Modeling of the Pipeline Uplift Mechanism in Clay. Arch. Hydro-Eng. Environ. Mech. 2021, 68, 119–135. [Google Scholar] [CrossRef]
- Park, J.; Chung, Y.; Hong, G. Reinforcement Effect of a Concrete Mat to Prevent Ground Collapses Due to Buried Pipe Damage. Appl. Sci. 2020, 10, 5439. [Google Scholar] [CrossRef]
- Tafreshi, S.M.; Khalaj, O. Laboratory tests of small-diameter HDPE pipes buried in reinforced sand under repeated-load. Geotext. Geomembr. 2008, 26, 145–163. [Google Scholar] [CrossRef]
Publisher’s Note: MDPI stays neutral with regard to jurisdictional claims in published maps and institutional affiliations. |
© 2022 by the authors. Licensee MDPI, Basel, Switzerland. This article is an open access article distributed under the terms and conditions of the Creative Commons Attribution (CC BY) license (https://creativecommons.org/licenses/by/4.0/).