1. Introduction
Cities around the world are diverse, yet face similar challenges. Despite their sundry cultural, political, and economic trajectories, all cities must ensure livability for their residents, reduce their ecological footprint, and reinvent their economies to achieve welfare if they seek to be sustainable [
1]. Some cities have progressed in this transformation more than others. Hence, it is important to understand where each city stands and work within that context to present appropriate solutions.
As urban areas are intricate and complex social, economic, environmental, and political systems, developing these solutions requires robust and up-to-date data. This has become increasingly important, as many planning tools rely on the quality and availability of data to analyze the current state of a given city and then propose specific interventions based on the particular needs of the area [
2]. Nevertheless, creating and updating such datasets requires not only considerable financial and time investments, but in many cases requires appointing a specific entity (such as the Census authorities) to collect, process, handle, and publish the data. Consequently, many countries, especially Less Economically Developed Countries (LEDCs), are yet to develop such datasets, whilst More Economically Developed Countries (MEDCs), which already have datasets, encounter the continuous challenge of disaggregating and updating their data to understand and address upcoming challenges [
3].
One example of a very data-hungry sector of urban transformation is transportation accessibility. Assessing urban accessibility has become an important part of the urban agenda in many cities due to the transformative potential of such an approach. The concept explores “the extent to which the land-use-transport system enables (groups of) individuals or goods to reach activities or destinations by means of a (combination of) transport mode(s)” [
4]. This approach has also been supported recently by the “15 Minute City” concept, developed by Carlos Moreno [
5]. However, most of the tools used to measure urban accessibility require up-to-date and fine-grained urban data to perform the analysis. Such is the case with Urban Accessibility Computer (UrMoAC), a software program developed by the German Aerospace Centre (DLR) to compute accessibility measures [
6].
The objective of this study is to conduct a preliminary analysis of urban accessibility levels, using UrMoAC and public datasets, to main destinations in two study areas: Distrito Tec of the Technological Institute of Monterrey in Monterrey, Mexico, and the Stanford University District (i.e., Stanford District) in the San Francisco Bay Area in the United States of America. Both are university districts located in very large and important metropolitan areas within their countries. The significance of this work is rooted in its accounting of the current morphology of each city using open-source data and tools. The use of such accessible data allows for our proposed framework for automated urban accessibility analysis to be implemented in different urban centers, in this case impacted by university communities’ accessibility needs, which makes it a replicable and scalable study approach.
The computation of urban accessibility is performed only considering sustainable transportation modes, aiming to see how prepared each area is to shift from using cars as the main mode of transport to active mobility (walking or cycling). Due to the lack of data, it was not possible to compute measurements with public transport, as there is no General Transit Feed Specification (GTFS) [
7] data available for the city of Monterrey. Naturally, this is an important limitation of the current research, as commuting distances in both study areas go well beyond walkable or cyclable distances. Nevertheless, the results intend to demonstrate the immense capability of urban analysis tools to understand the current state of cities, as well as to identify underperforming areas based on the variables of interest. Additionally, social preference is discussed, as the authors of the paper are well aware that individuals tend to frequent certain destinations not only based on proximity, but also on preference [
8].
It has been noted in the urban accessibility field that most of the reported studies explore highly specific topics at particular scales. Although this type of approach is able to model to a certain extent urban accessibility, a multiscale approach is preferred since urban systems are not isolated and their dynamics are the result of a more complex network structure [
9]. Another important feature of our work is the transferable approach, validated with a comparison between different cities. It has been previously noted that a drawback of urban indicators is that they are often specific and not applicable to other cities [
10].
Examples of recent urban accessibility studies were presented in [
11,
12]. In [
11], an analysis of the urban accessibility of museums (for pedestrians) in Seoul was performed using travel angle and walking distance. The results of the study showed that, although museums were within walking distance (2 km), they were isolated from primary spaces where citizens walk. Although the study showed interesting results, the authors mentioned that future research should consider other traveling modes. In [
12], the availability of urban green spaces (UGSs) in Ilorin (Nigeria) within a 300 m distance was evaluated. The authors obtained an availability indicator as a ratio of the UGS area (in a ward) divided by the population of that ward. The results showed that there was an alarming lack of UGSs in the city, which should be addressed to follow the path of a sustainable and liveable city.
Contrary to the aforementioned studies, which focused on one travel mode, one scale of analysis, and one type of destination, one important remark is that our proposed work follows a multiscale approach since multiple scales (blocks, districts, city), travel modes (walking, bicycle), and types of destinations (schools, hospitals, parks) are included, as well as a comparison of all these factors between two cities of two different countries.
Finally, the research serves as a reflection of the importance of governments and decision-makers actively engaging and investing in developing high-quality datasets that enable academics and practitioners to understand how the urban structure of a given city is performing and the local community’s needs [
13]. The research also demonstrates the great value of having standardized tools and data formats to compare how different urban areas are performing in terms of urban accessibility [
14].
The structure of this article begins with the contextualization of the study areas in
Section 2.
Section 2.2 describes the methodology used, including the delimitation of the study areas and the software and the data used. With this information, the results obtained from each urban district are shown in
Section 3. Finally, a discussion is presented in
Section 4, and the conclusions derived from the study are presented in
Section 5.
2. Materials and Methods
2.1. Study Areas
Improving urban accessibility is a challenge that both MEDCs and LEDCs face in meeting the goals set by international treaties such as the Paris Agreement and the U.N.’s Sustainable Development Goals (SDGs) [
15]. Hence, transferable approaches that can standardize the performance of different cities, across socioeconomic statuses, are needed to determine the specific challenges of each city and understand how the cites as a whole are performing in this sense. This does not mean that the approach taken ignores the specific social, economic, political, and environmental dimensions of each study area, as they are incorporated in the analysis for each distinct community, as well as social preference factors that influence which destinations people tend to visit.
2.1.1. Distrito Tec, Monterrey, México
The Monterrey Metropolitan Area (MMA), located in the State of Nuevo León, Mexico, is comprised of 18 municipalities [
16]. According to the National Statistics and Geography Institute (INEGI, by its acronym in Spanish), the MMA had 5,341,177 inhabitants sprawling across a 7657 km
2 area in 2015.
The entire state of Nuevo León is characterized by concentrations of important and large-scale industrial facilities; 24% of the Gross Domestic Product (GDP) from the state comes from industry. Nuevo León also distinguishes itself by being one of the wealthiest states in the country, reaching a GDP per capita of USD 18,912, which is 88% higher than the national median [
17].
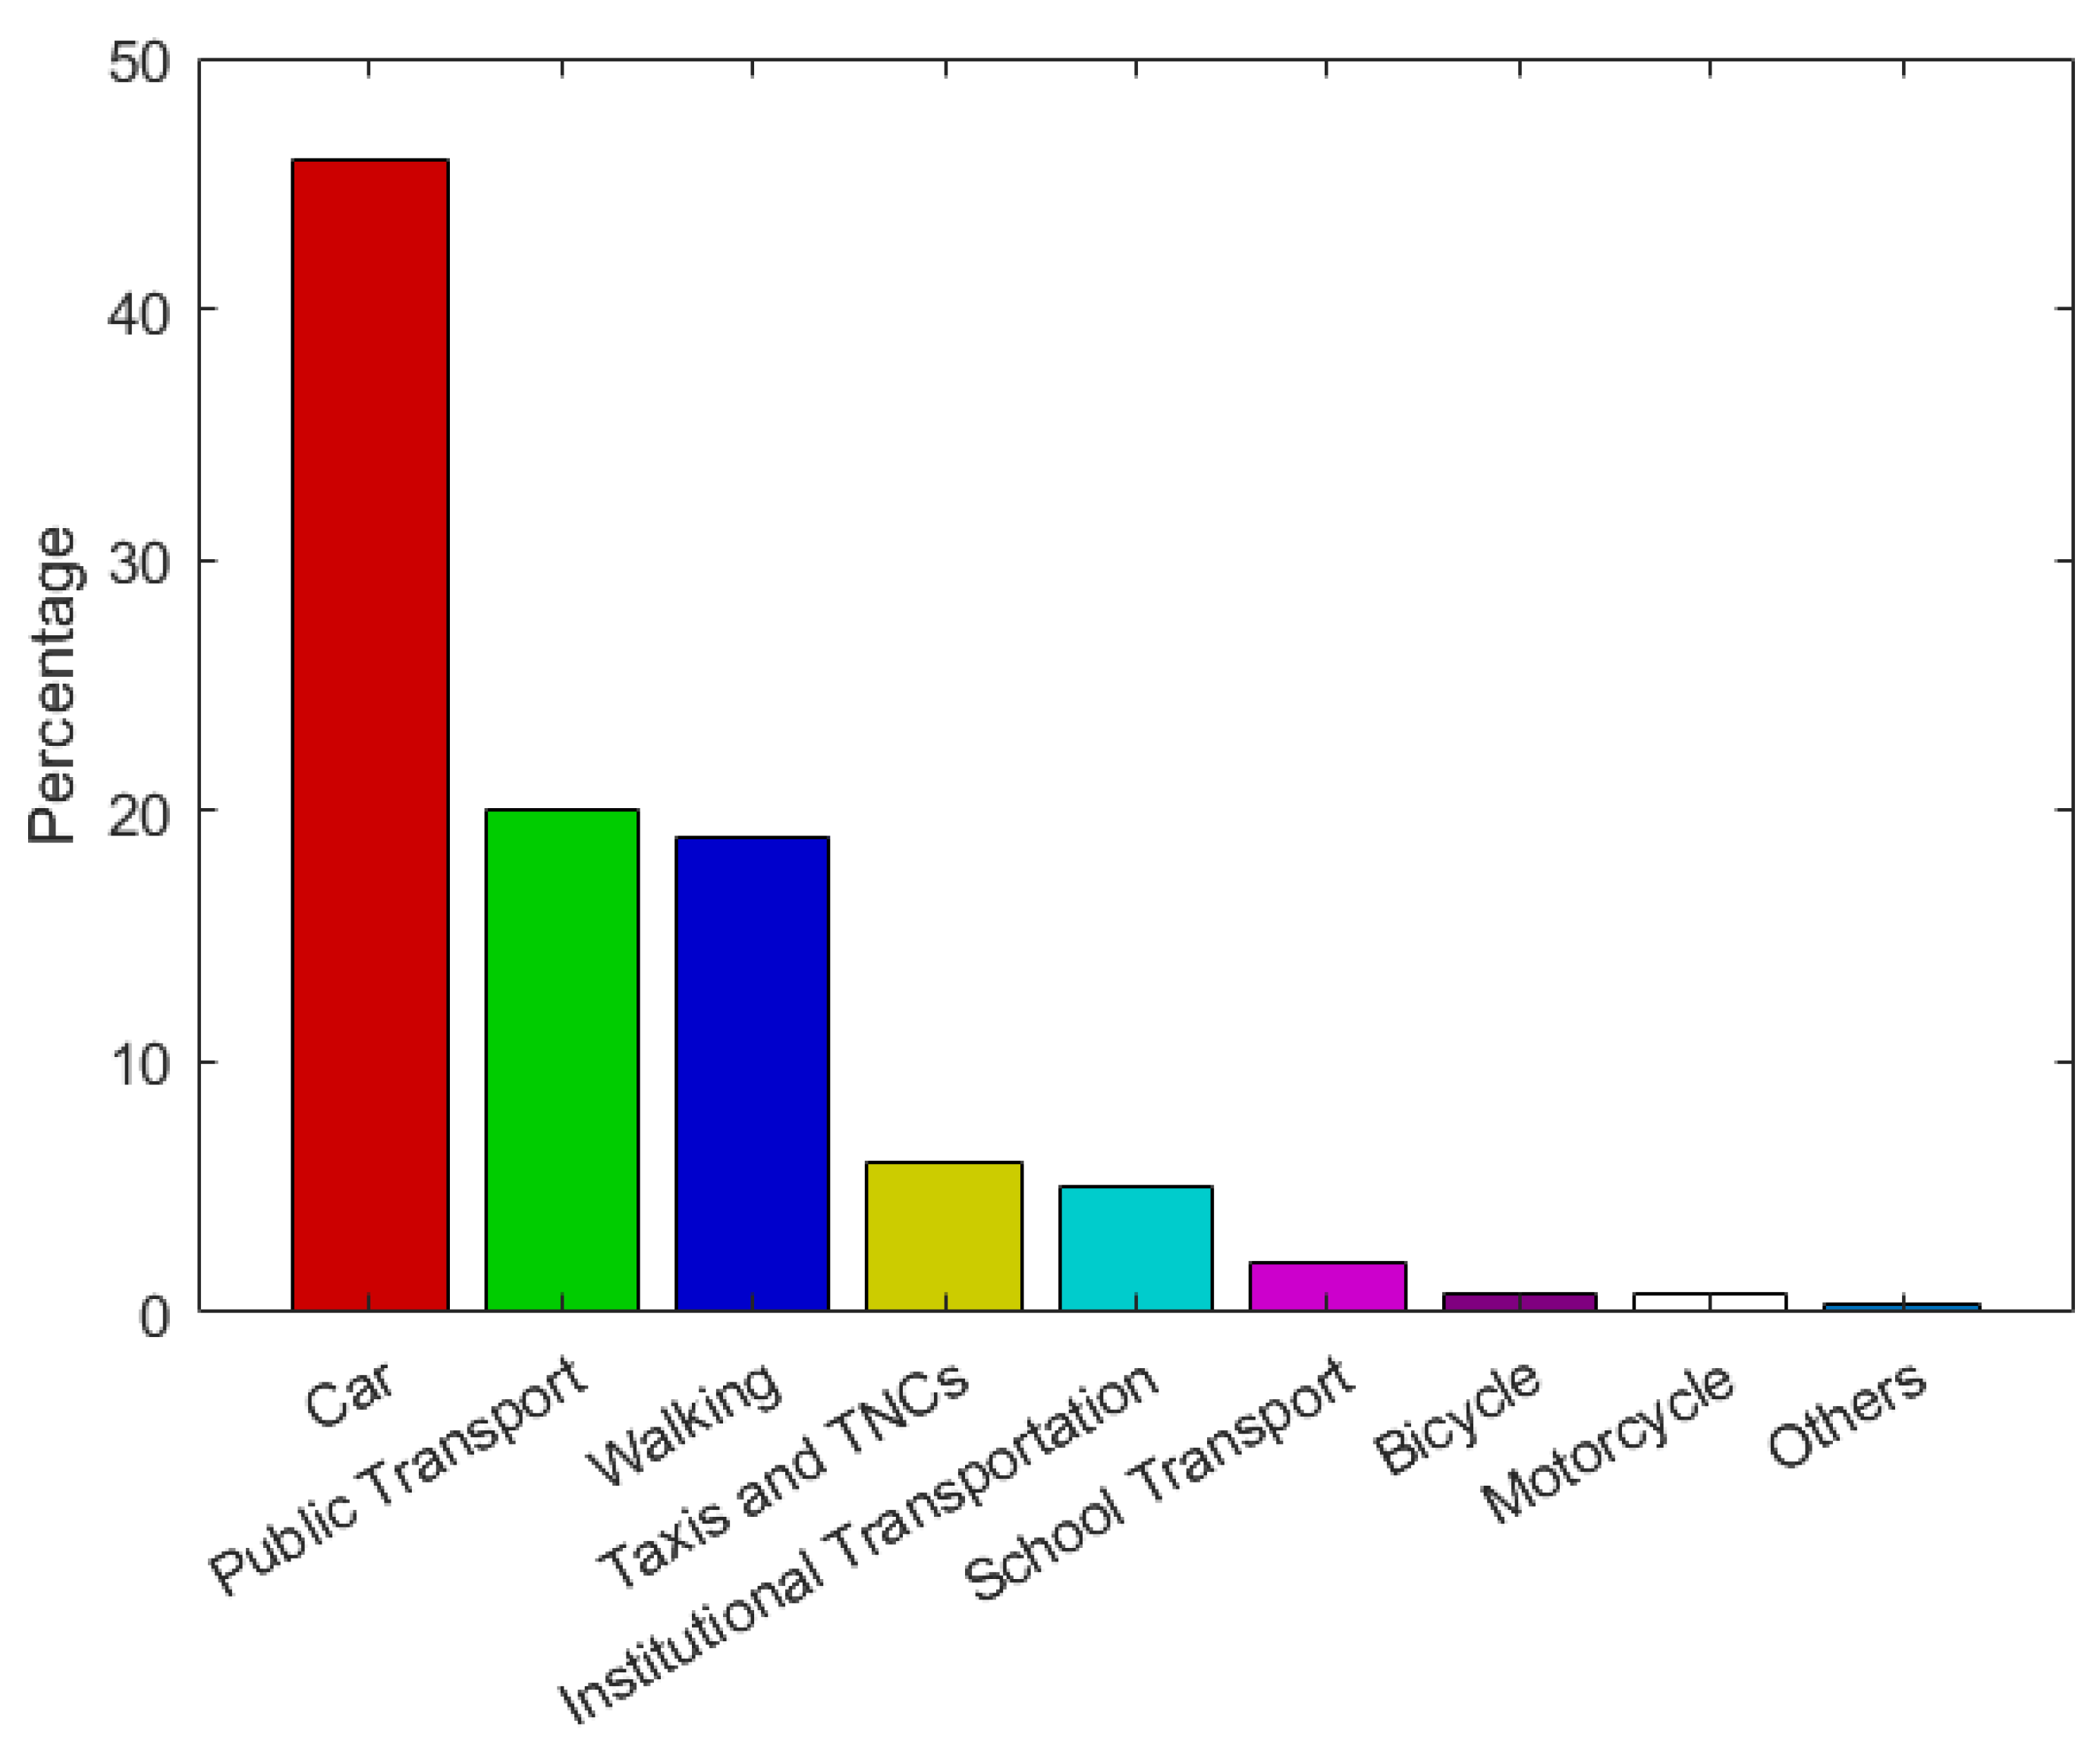
The MMA has been identified as the second-most-polluted city in Latin America and is the ninth-most-polluted city in the world [
18]. These levels of pollution are strongly related to the industrial activities located in the city, but also to the city’s dependency on motorized vehicles (see
Figure 1).
The weather in the MMA can be very extreme; temperatures during the summer typically surpass 35 °C, making it unpleasant for people to walk or bike as modes of transportation.
With a density of 698 people per square kilometer, the MMA reflects the urban structure of a sprawling city that is vehicle-oriented [
19]. As a result, sustainable transport modes such as public transport and micromobility have lacked investment and expansion, contributing to marginalization and access disparities among the population [
18].
Historically, housing in the MMA takes two different forms: formal and informal [
20]. Formal housing plans usually create monofunctional, single-family, gated-communities in the suburbs of the city, whereas informal housing is mostly irregular urban settlements in the city center and suburban areas created by migrant groups and communities displaced by gentrification. The inner city has become less populated, despite being the historic center of the city and being home to most services and economic opportunities.
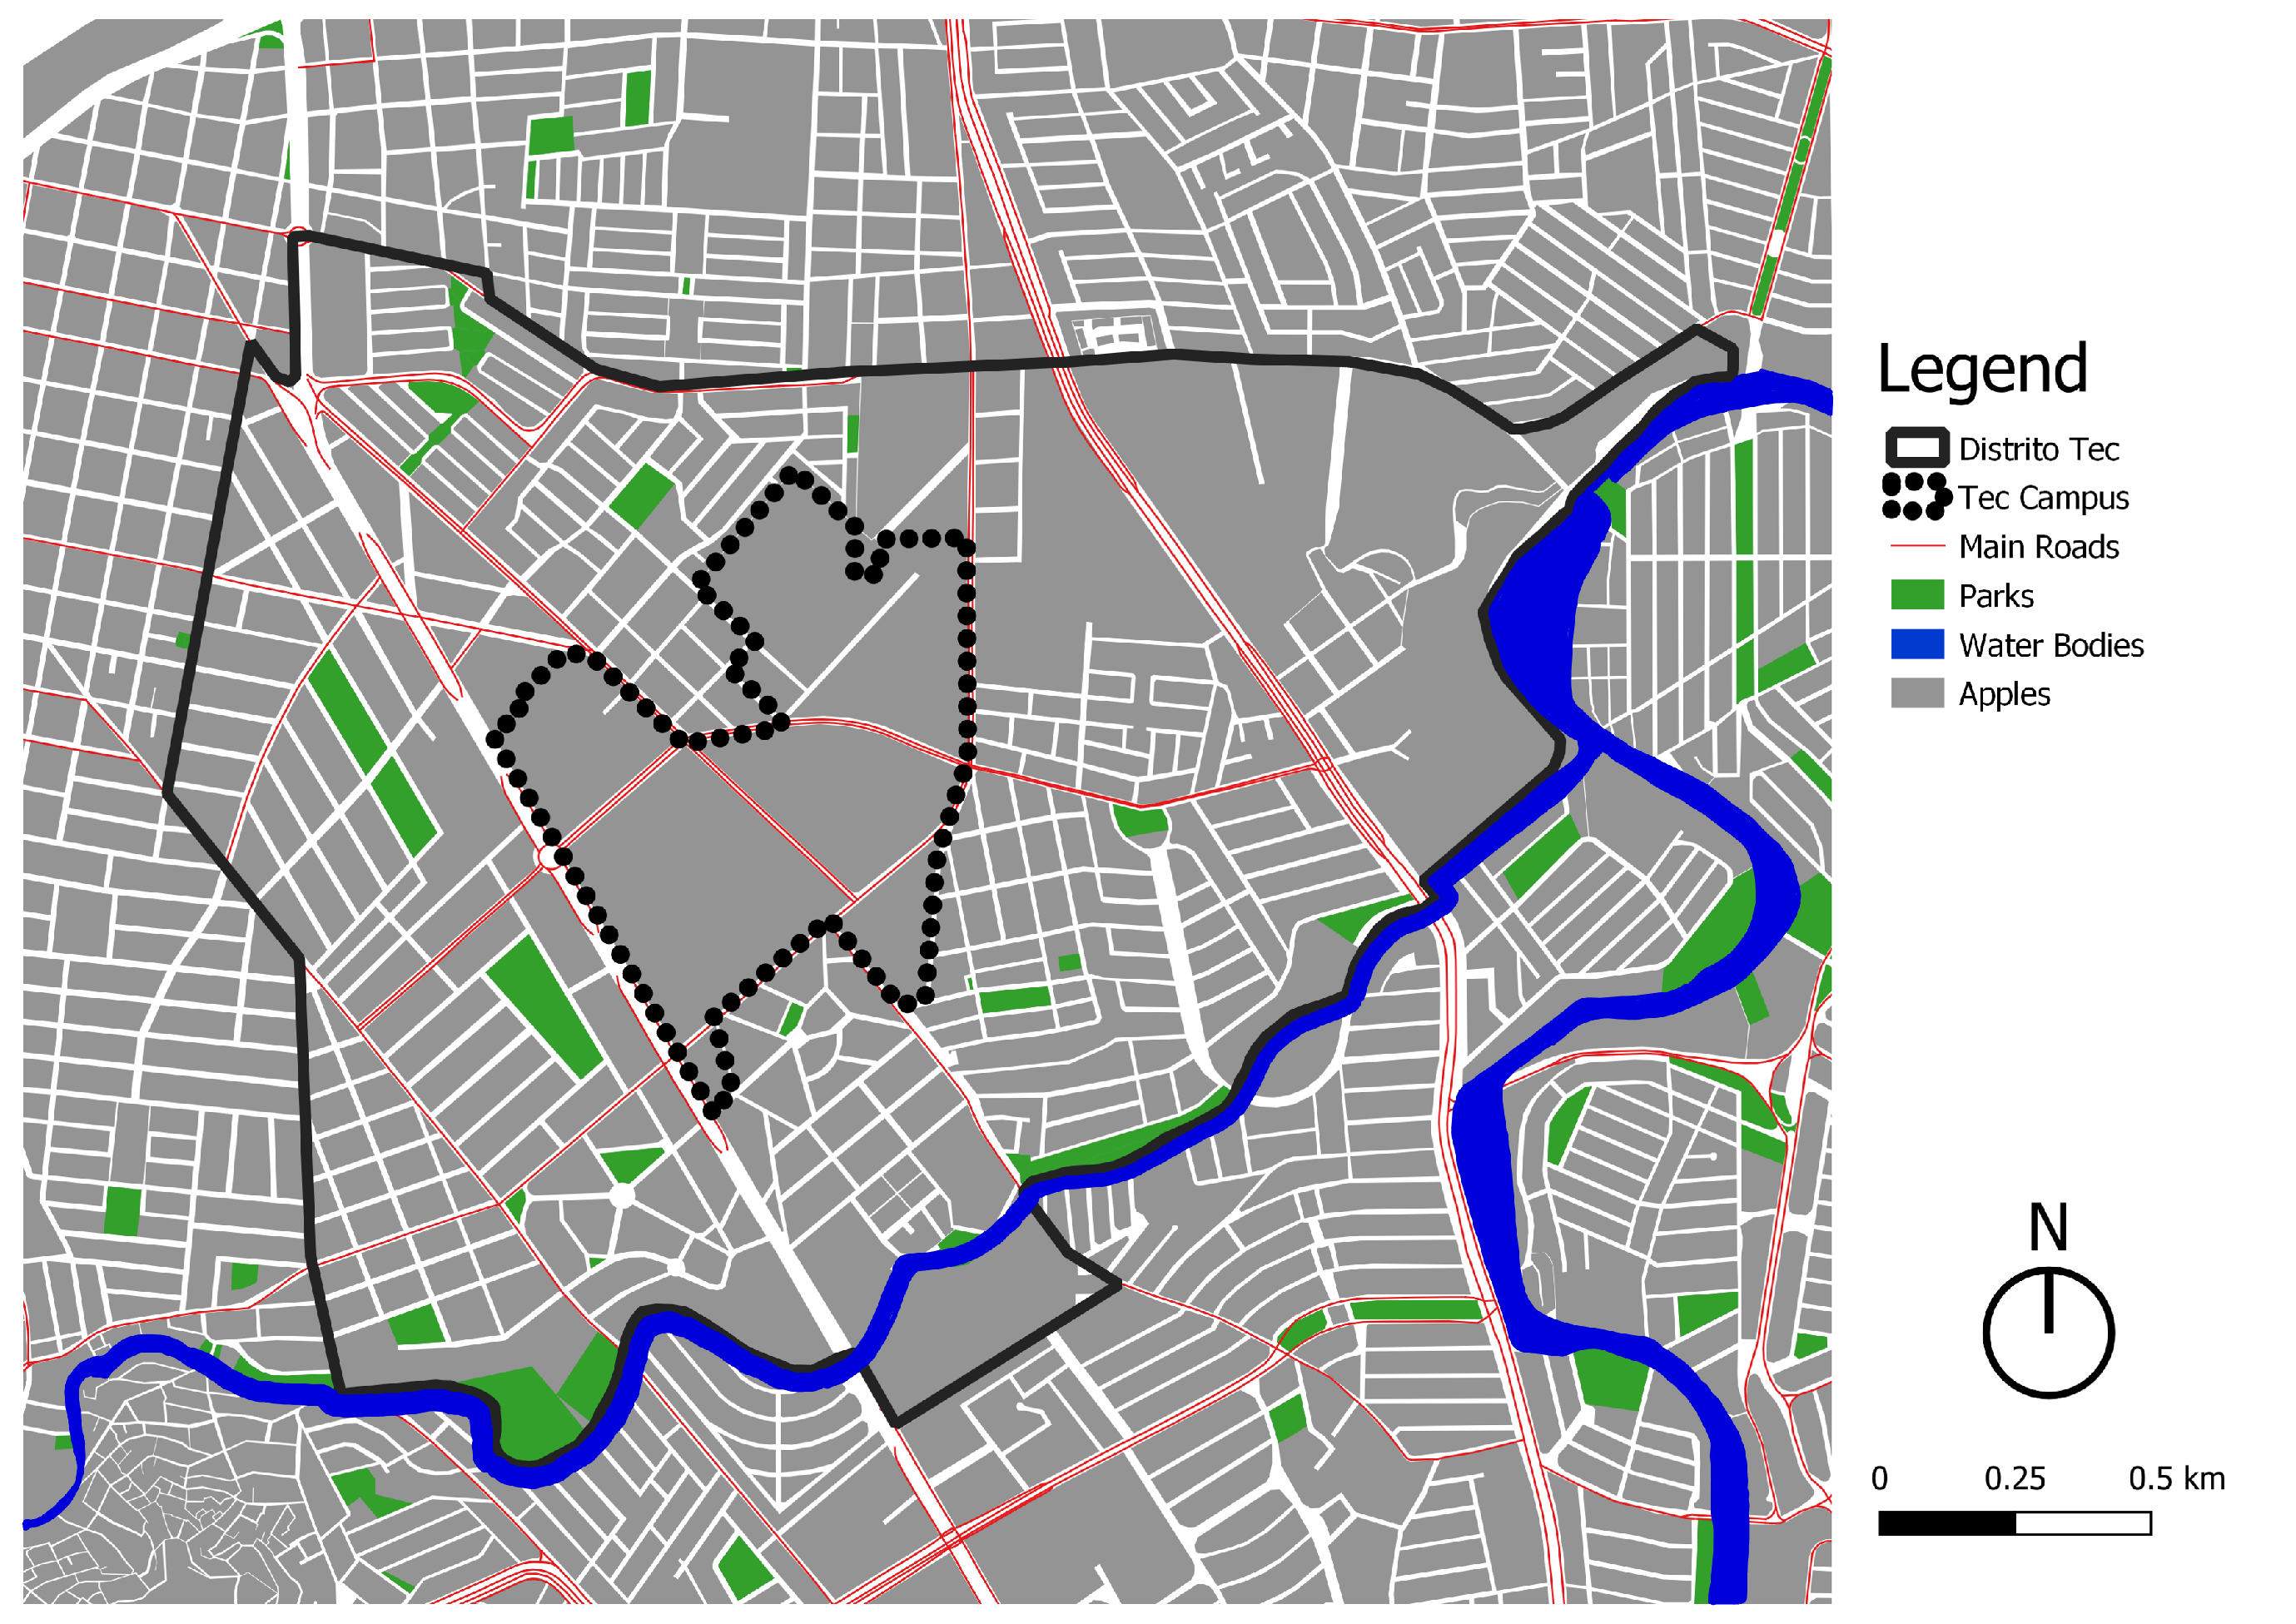
The Distrito Tec is a project led by the Instituto Tecnológico de Monterrey university (Spanish acronym: ITESM) in collaboration with the local community and authorities. Its objective is to improve the urban environment in the vicinity of the university campus [
21]. The project is considered one of the City Improvement Districts (CIDs) of Monterrey; it promotes urban regeneration and sustainability, as well as citizen engagement and participation in urban projects.
Distrito Tec is located in southern Monterrey in a central area of the MMA. Its area of 4.52 square kilometers has 26,333 inhabitants and comprises 24 neighborhoods surrounding the university (see
Figure 2) [
21].
As an urban campus, Distrito Tec has a high demand of services not just from the local population, but from the university’s students, professors, and workers. As a result, Distrito Tec is a dynamic economic environment with a high density of commerce and services.
As in many central areas in the city, Distrito Tec’s neighborhoods are very heterogeneous. They mix different socioeconomic groups and housing typologies. In terms of land-use, certain areas are mainly monofunctional, whilst others are characterized by having many services and commerce.
2.1.2. Stanford District, San Francisco Bay Area, United States of America
With a population of 7,751,700 inhabitants in 2018, the San Francisco Bay Area (BA) is the fourth-largest metropolitan area in the United States [
22]. It extends over 18,130 square kilometers and comprises nine counties [
23].
The BA and the State of California are two of the strongest economies not only in the United States, but in the world. With a figure of USD 70,662 GDP per capita [
24], the State of California’s per capita GDP is well over the national average of USD 63,543.57 [
25]. The BA has a highly diversified economy; nevertheless, there is a clear trend toward a tertiarization [
26] of the economic activities, mainly fueled by the technology industry. There are 67.2% of the jobs located in the tertiary sector, 24.2% in the secondary, 5% in the primary, and 3.3% non-specified [
22].
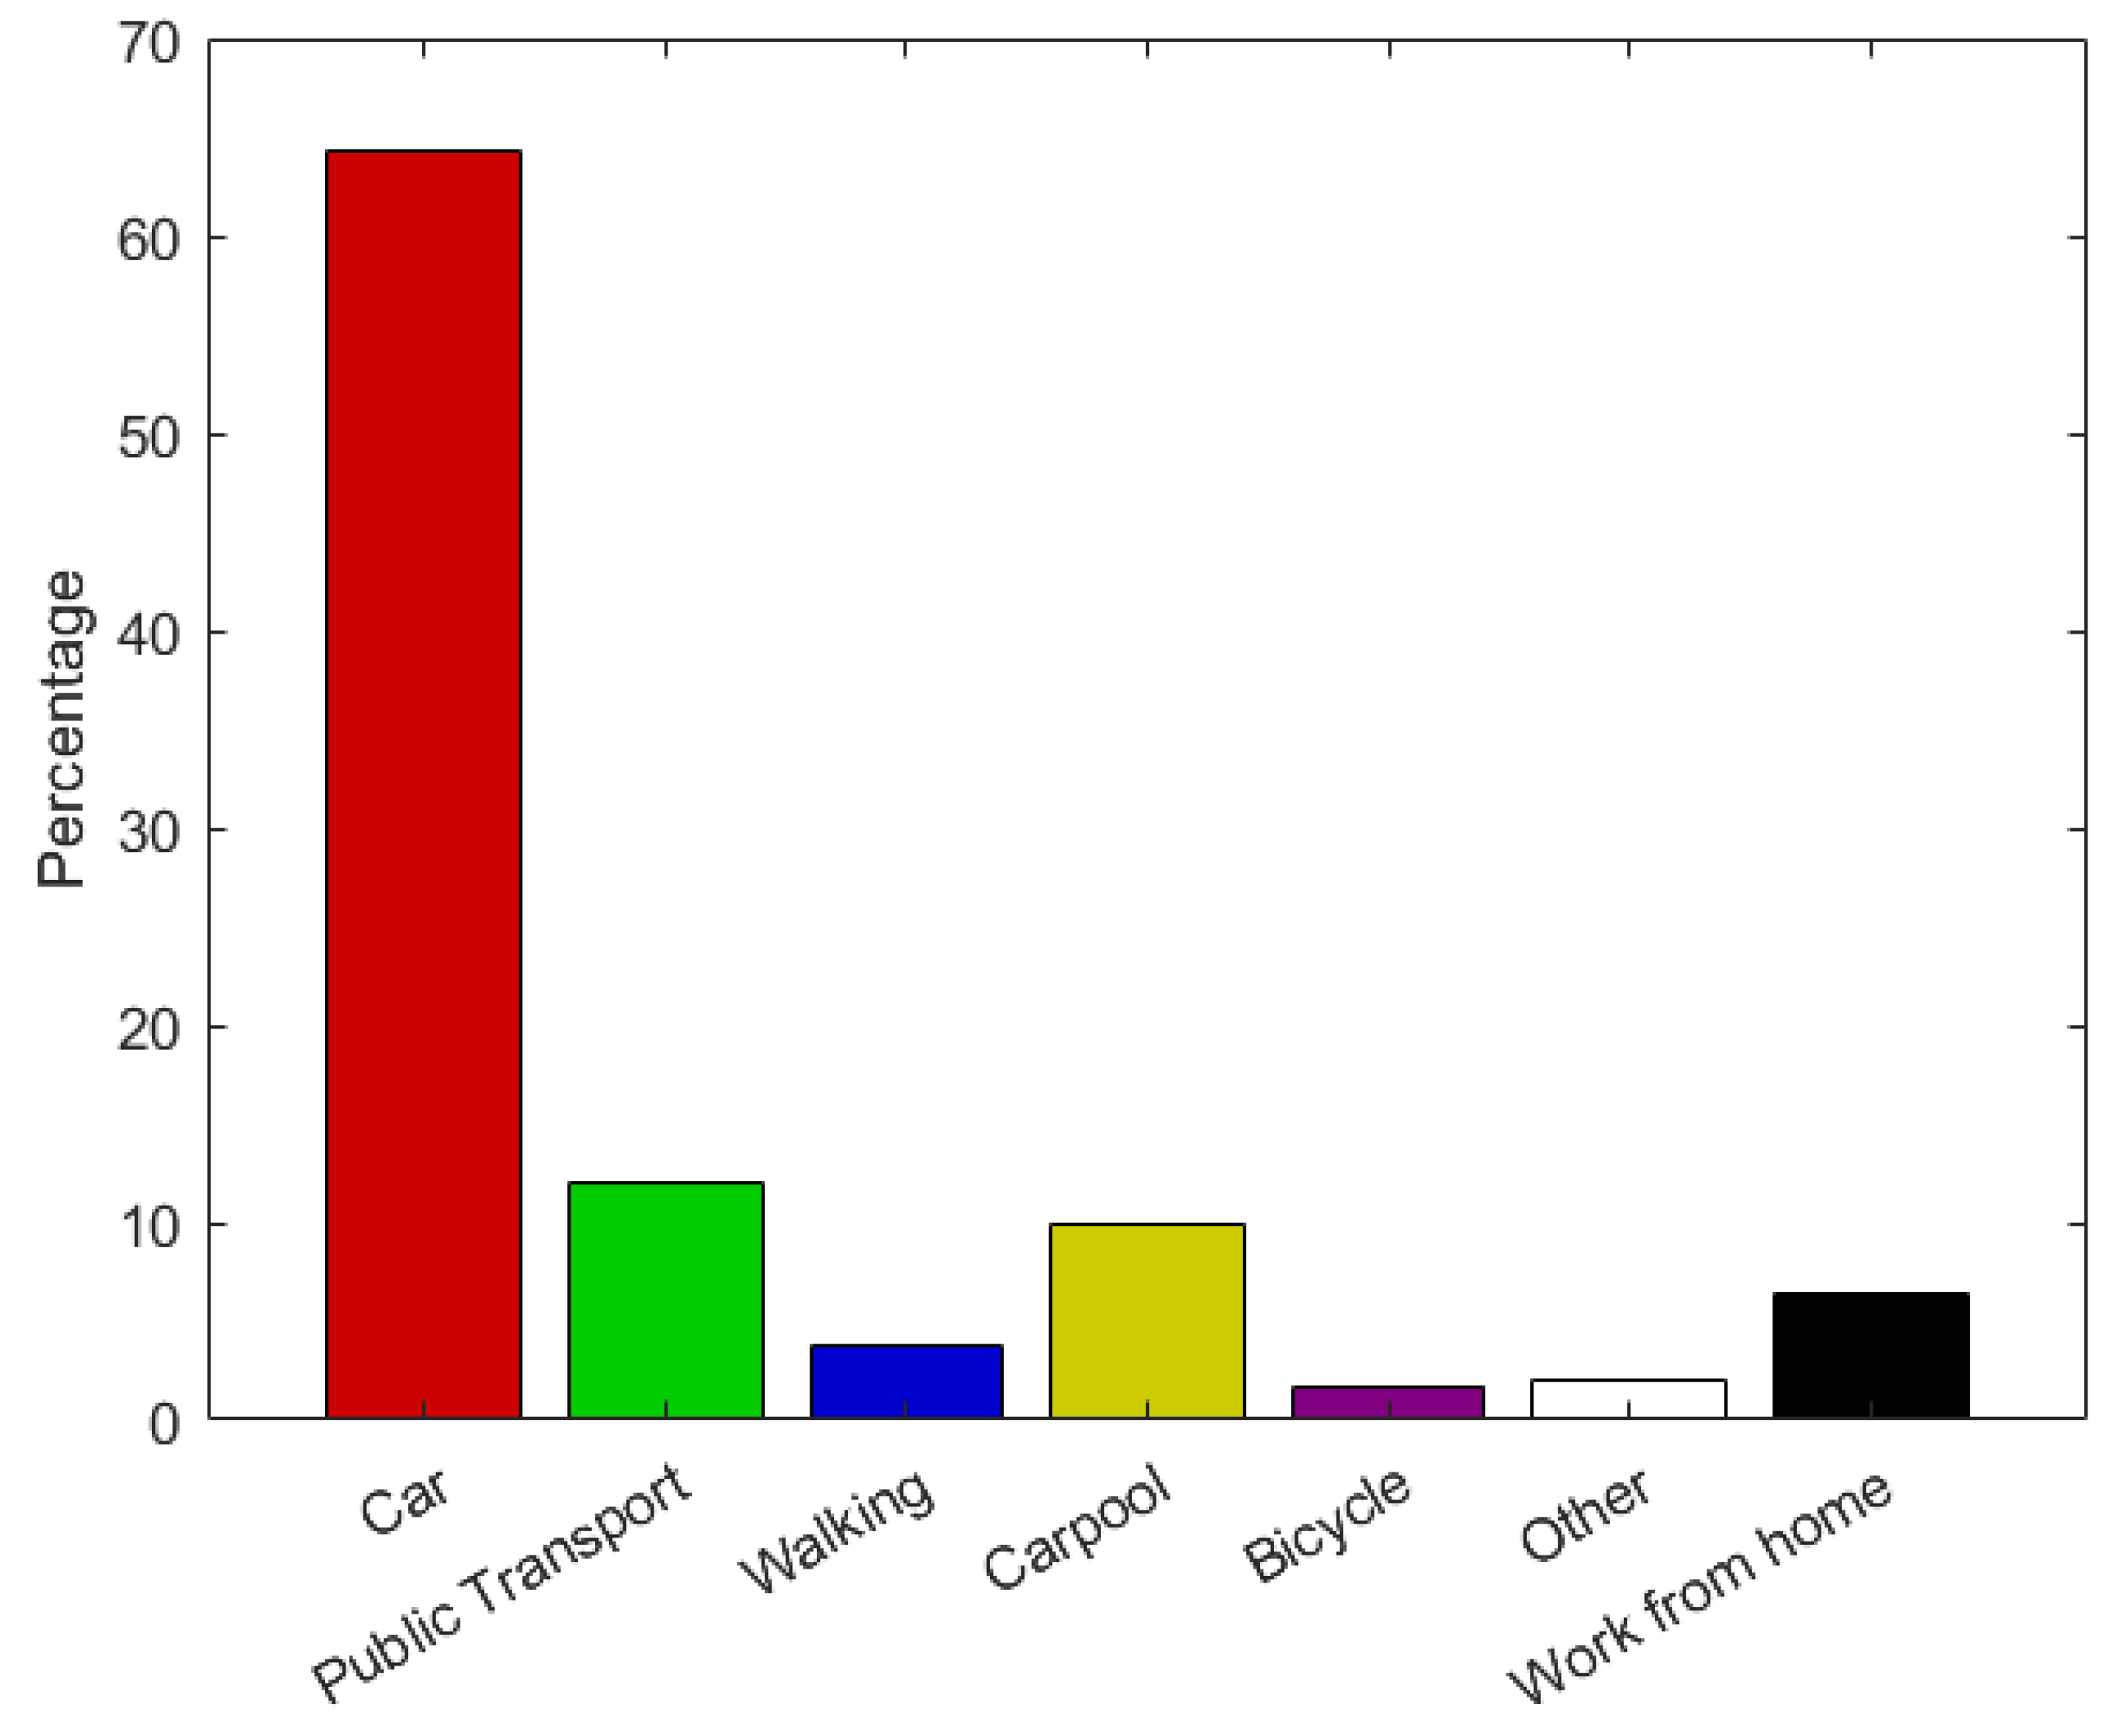
Despite significant efforts to reduce emissions, the BA emits Green House Gases (GHGs) at a considerably higher rate than the global average [
22]. Data from 2015 demonstrate that transportation is the main source of emissions, accounting for 3.1 metric tons of per-capita GHG emissions from primary sources [
22]. This is no surprise considering that 74.3% of commutes in the BA are made by car (see
Figure 3).
The BA usually does not have extreme weather conditions. Nevertheless, low temperatures during the winter, high temperatures during the summer, and rain can prevent people from walking or biking.
The urban and metropolitan composition of the BA is extremely complex, as it is formed by 101 cities and various unincorporated communities. Hence, densities are very different depending on the area, varying from 0–1235 persons per km2 to >9884 persons per km2.
Even though 57% of the BA’s workers live and work in the same county, job centers are concentrated in San Francisco and Silicon Valley, making these two areas the main destinations for commuters [
22].
The housing market and middle-income employee housing needs are deeply misaligned in the Bay Area, and this misalignment has begun to result in some forms of “informal” housing, such as unapproved ADUs and mobile home use by temporary blue-collar employees [
22]. Despite this, and in contrast with the MMA, housing in the BA is strictly produced under formal processes. As a result of densification policies, multi-family housing increased in production, reaching a 50–50 ratio with single-family housing in 2018 [
22].
Stanford is a Census-Designated Place (CDP) located at the northwest of Santa Clara County. It comprises Stanford University Campus, including the university’s buildings and on-campus housing. The Campus is surrounded by two cities, Palo Alto and Menlo Park.
Palo Alto, in Santa Clara County, has 15 constituent neighborhoods and a population of 69,700 inhabitants in 2021 [
27]. The city is known for being home to technology and innovation, as it contains important companies and research facilities. As a result, Palo Alto hosts more than 100,000 jobs, which makes it one of the main destinations for commutes related to work in the entire BA.
Inevitably, Palo Alto has a very important relationship with Stanford University. It hosts many housing facilities and commercial areas that are used by the students, alumni, professors, and other personnel employed by the university. Nevertheless, the local population, which has very strong community engagement, has limited the growth of infrastructure and services related to the university.
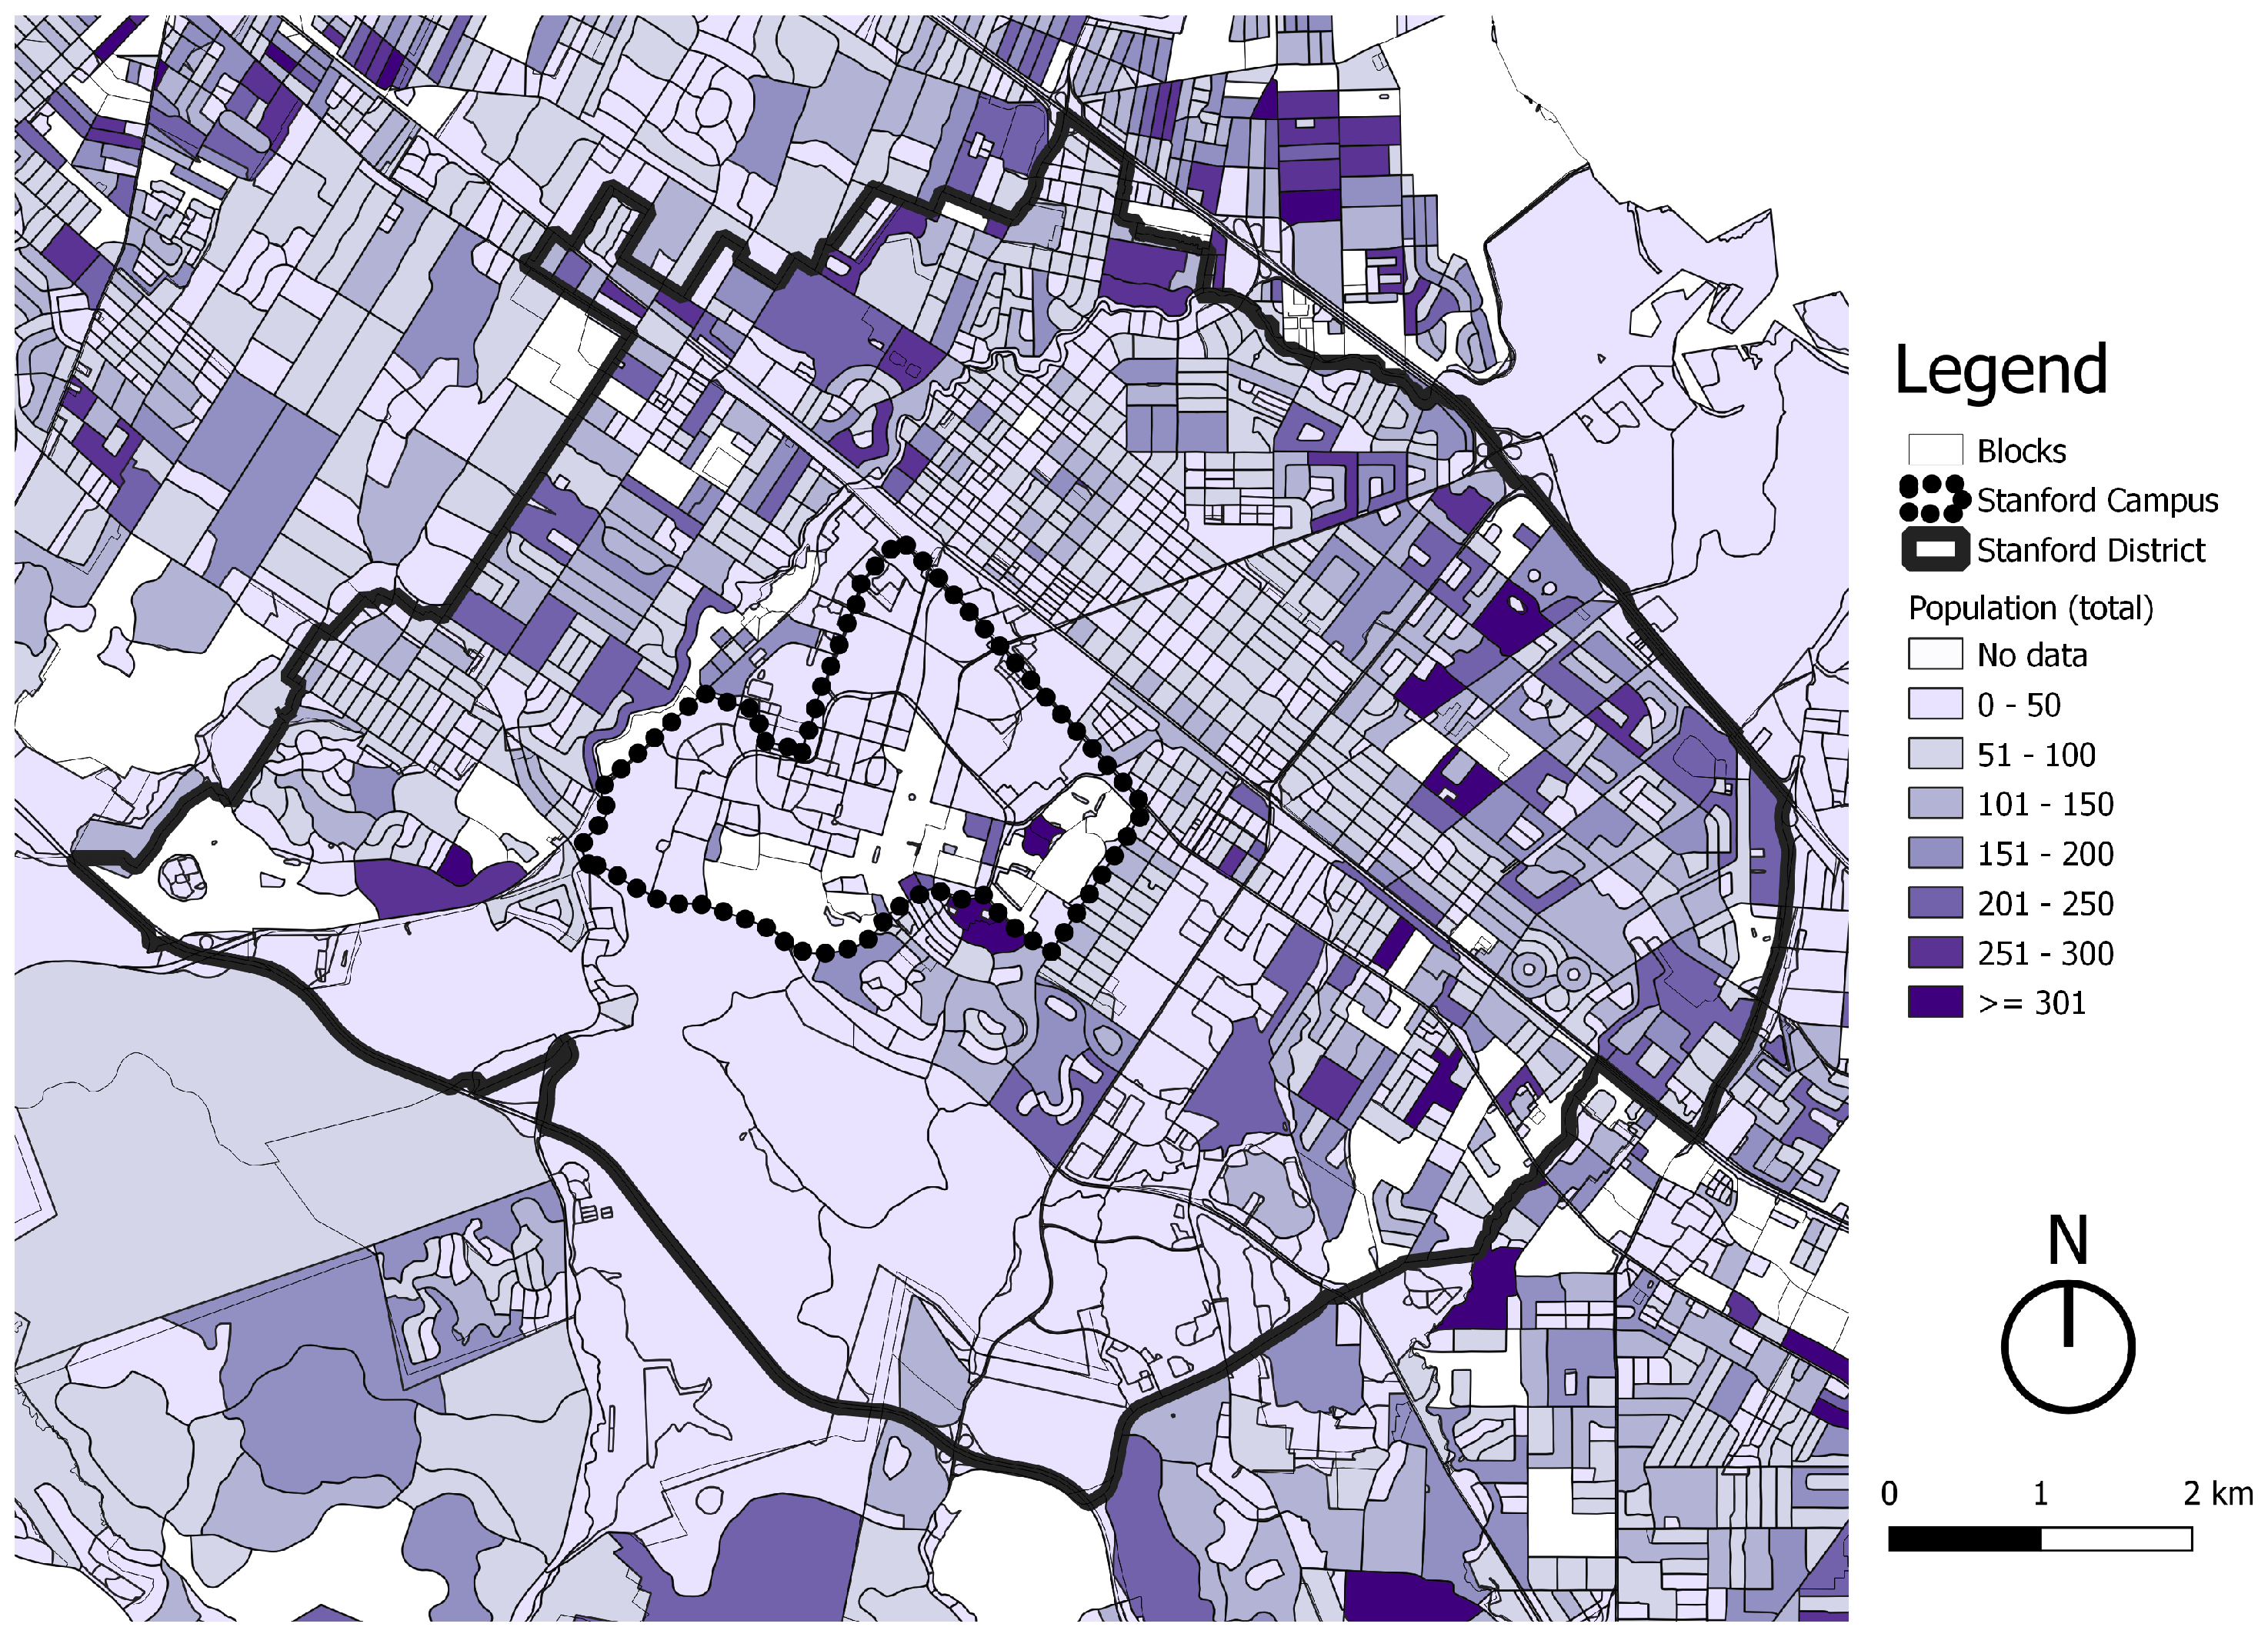
Menlo Park, in San Mateo County, has 10 constituent neighborhoods and a population of 32,026 inhabitants in 2010 [
28] (see
Figure 4). It shares many of the same characteristics, such as hosting technology and innovation, as well as having many housing facilities and services that are used by people from Stanford University. Palo Alto and Menlo Park both have an extremely ethnically diverse population and a very high income per capita.
2.2. Methodology
Designing a methodology that ensures the comparability of results was a significant challenge of this study. Hence, different data sources and tools were analyzed in order to select the most suitable. Open-source data and software were prioritized, as they encourage the transferability and replication of the current research project to other cities or study areas. A similar methodology to [
29] was implemented in this study, adding a comparative approach between the two study areas.
2.2.1. Delimitation of Study Areas
Both the Tecnológico de Monterrey and Stanford campuses are encompassed by metropolitan areas. As a consequence, they are subject to social, environmental, economic, and political decisions and factors that go well beyond their immediate surroundings. In addition, both universities are important educational institutions in their cities, attracting a broad variety of students, professors, and personnel from different parts of their metropolitan areas. Conscious of the metropolitan impact on both campuses, the current research project was based on the analysis, from a general perspective, of how each metropolitan area performs in terms of demographics, mobility, GHG emissions, economy, and dwellings. By doing so, it is possible to comprehend and provide a brief characterization of each study area, which is crucial to understanding what happens on smaller scales.
Distrito Tec is an urban regeneration initiative that started in 2012 by the Tecnológico de Monterrey [
21] in collaboration with citizens, authorities, and Non-Governmental Organizations (NGOs). The delimitation of the district polygon was performed by the stakeholders involved and was based on areas that have a direct urban socio-spatial relationship with the university campus (see
Figure 5). As a result, the polygon has an area of 4.52 km
2 with 26,371 inhabitants, 24 neighborhoods, and 11,206 households [
21].
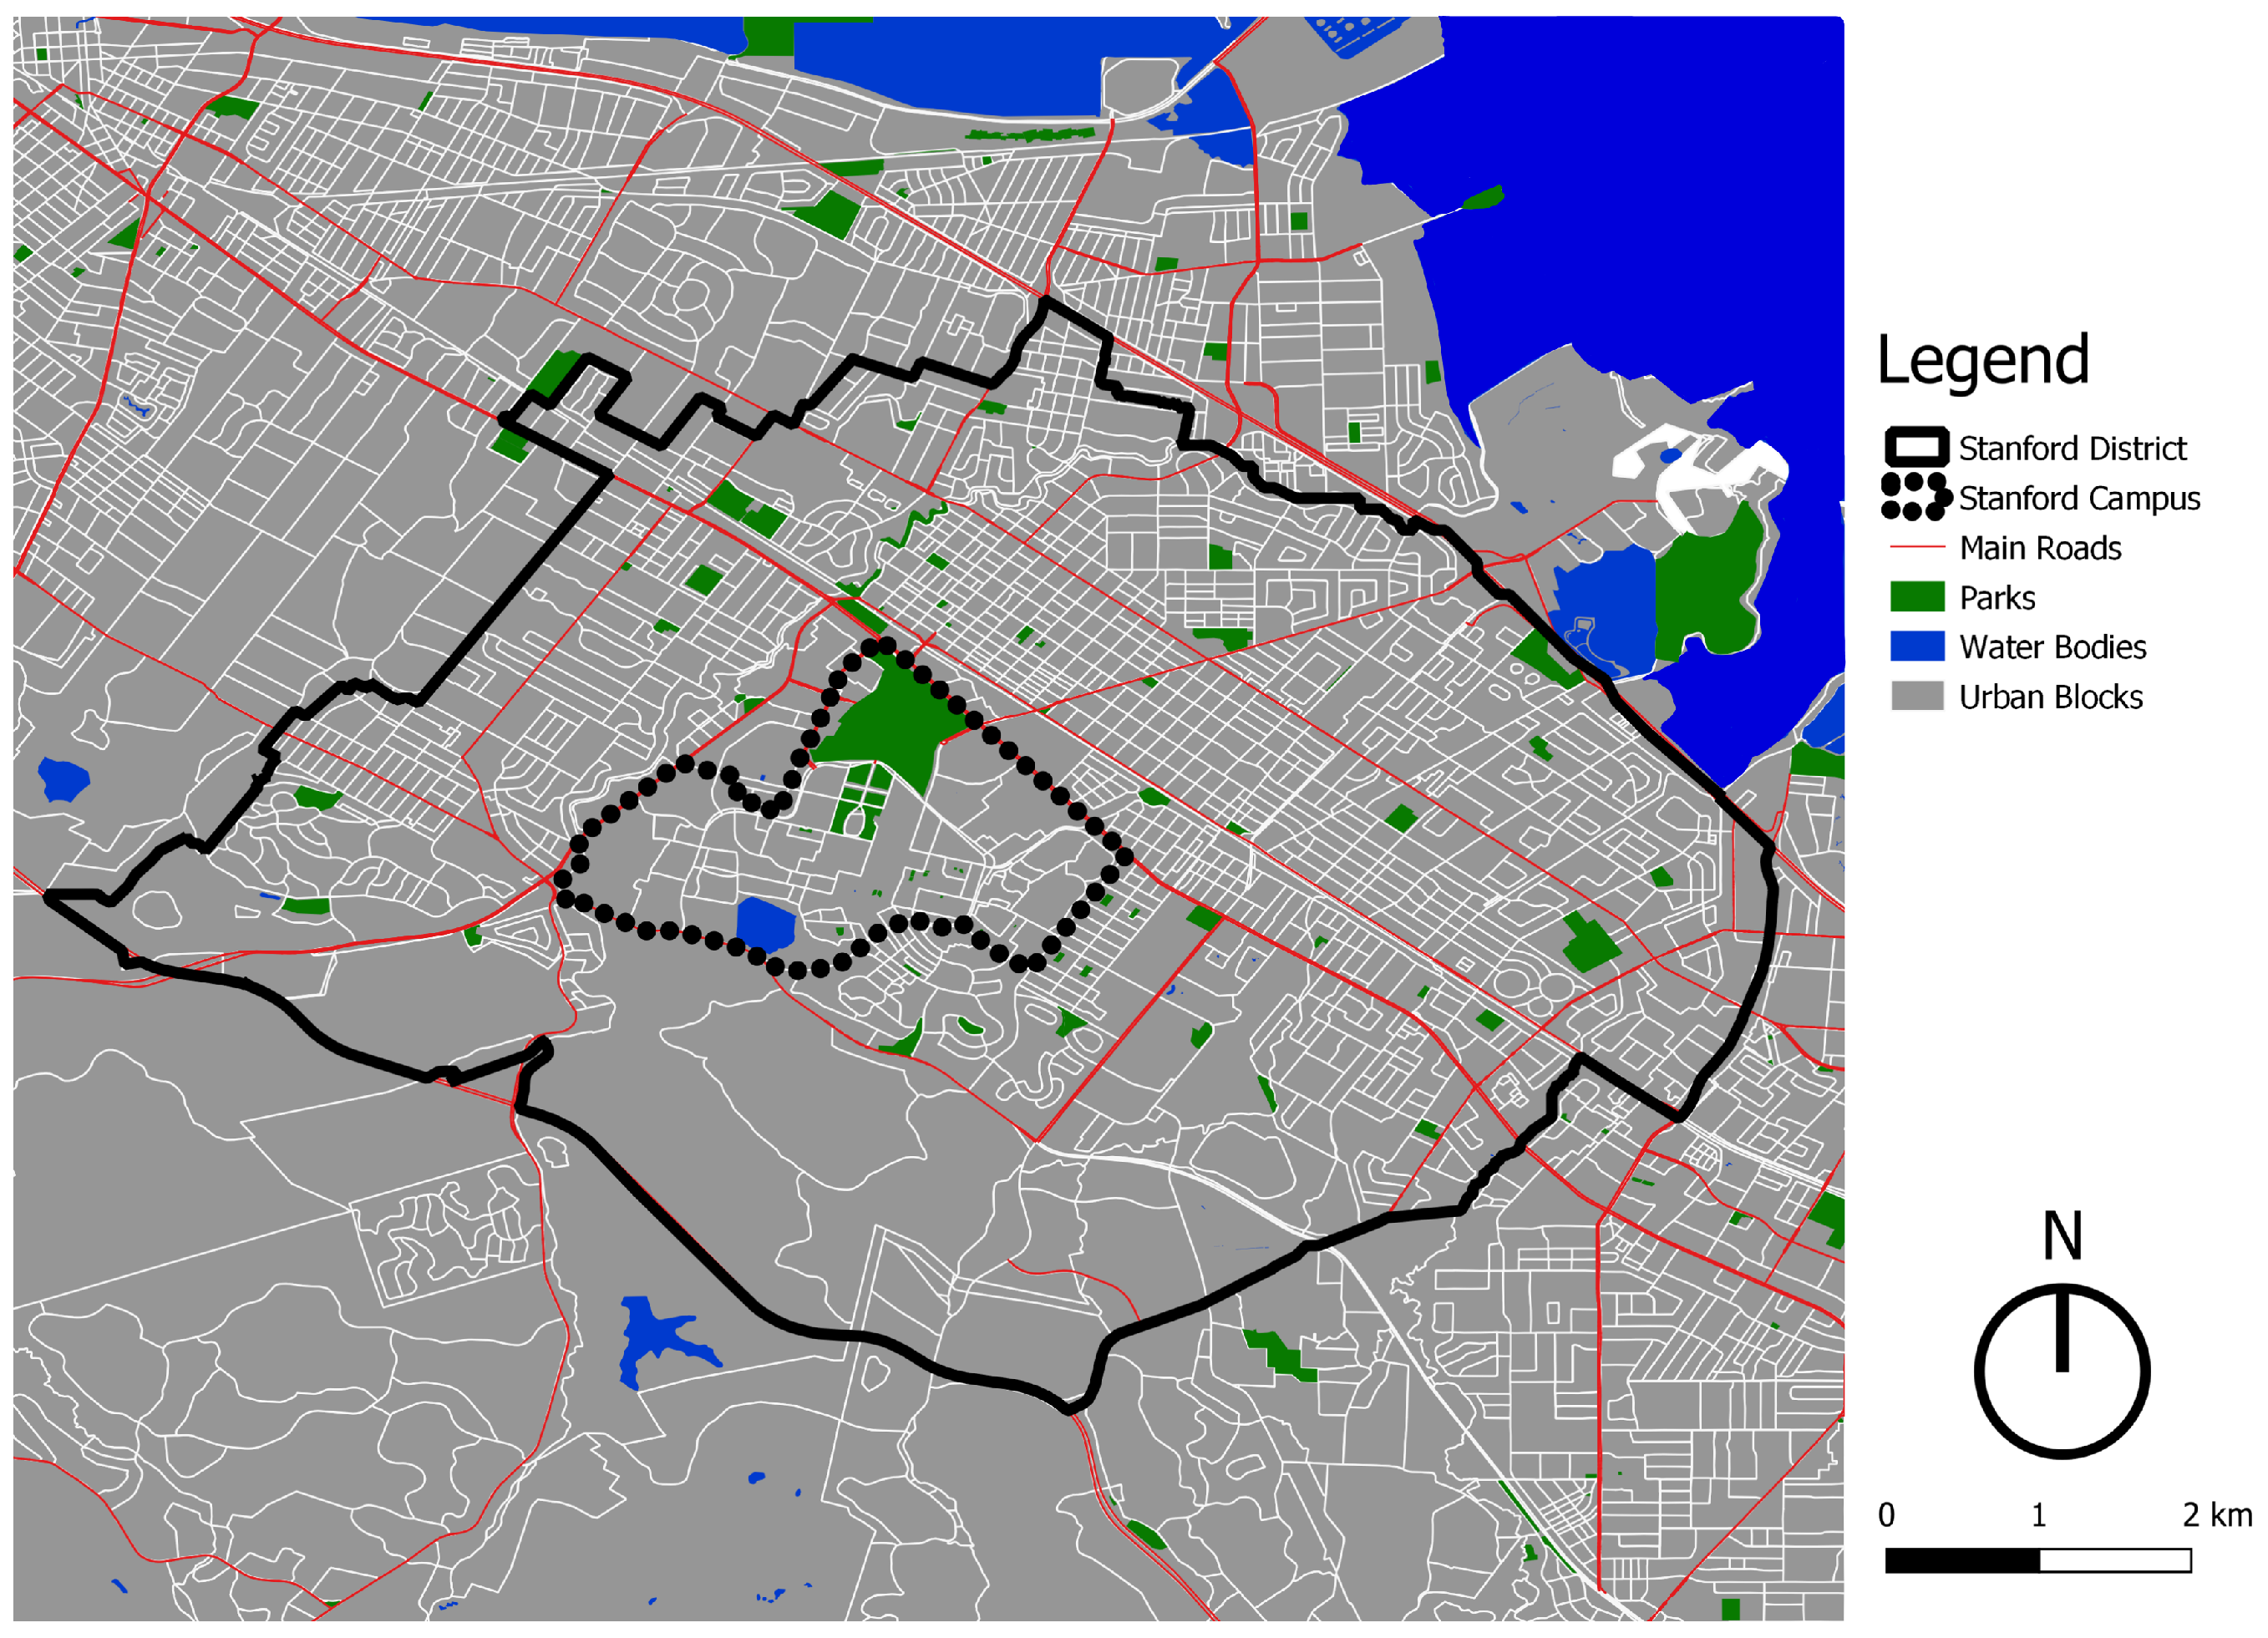
In contrast with Distrito Tec, there is not a formally defined district for Stanford beyond the university’s campus grounds. Hence, the current research project defined a polygon called “Stanford District” that includes some of the surrounding areas of the university campus (see
Figure 6). As mentioned before, there are two cities located around Stanford: Palo Alto and Menlo Park. From each city, a given number of neighborhoods were selected to form Stanford District, based on their urban socio-spatial relationship to the campus. As a result, 7 constituent neighborhoods were selected from Menlo Park and 10 from Palo Alto. Stanford District has an area of 56.54 km
2 with 113,378 inhabitants (2010), 17 constituent neighborhoods, and 46,686 households [
30].
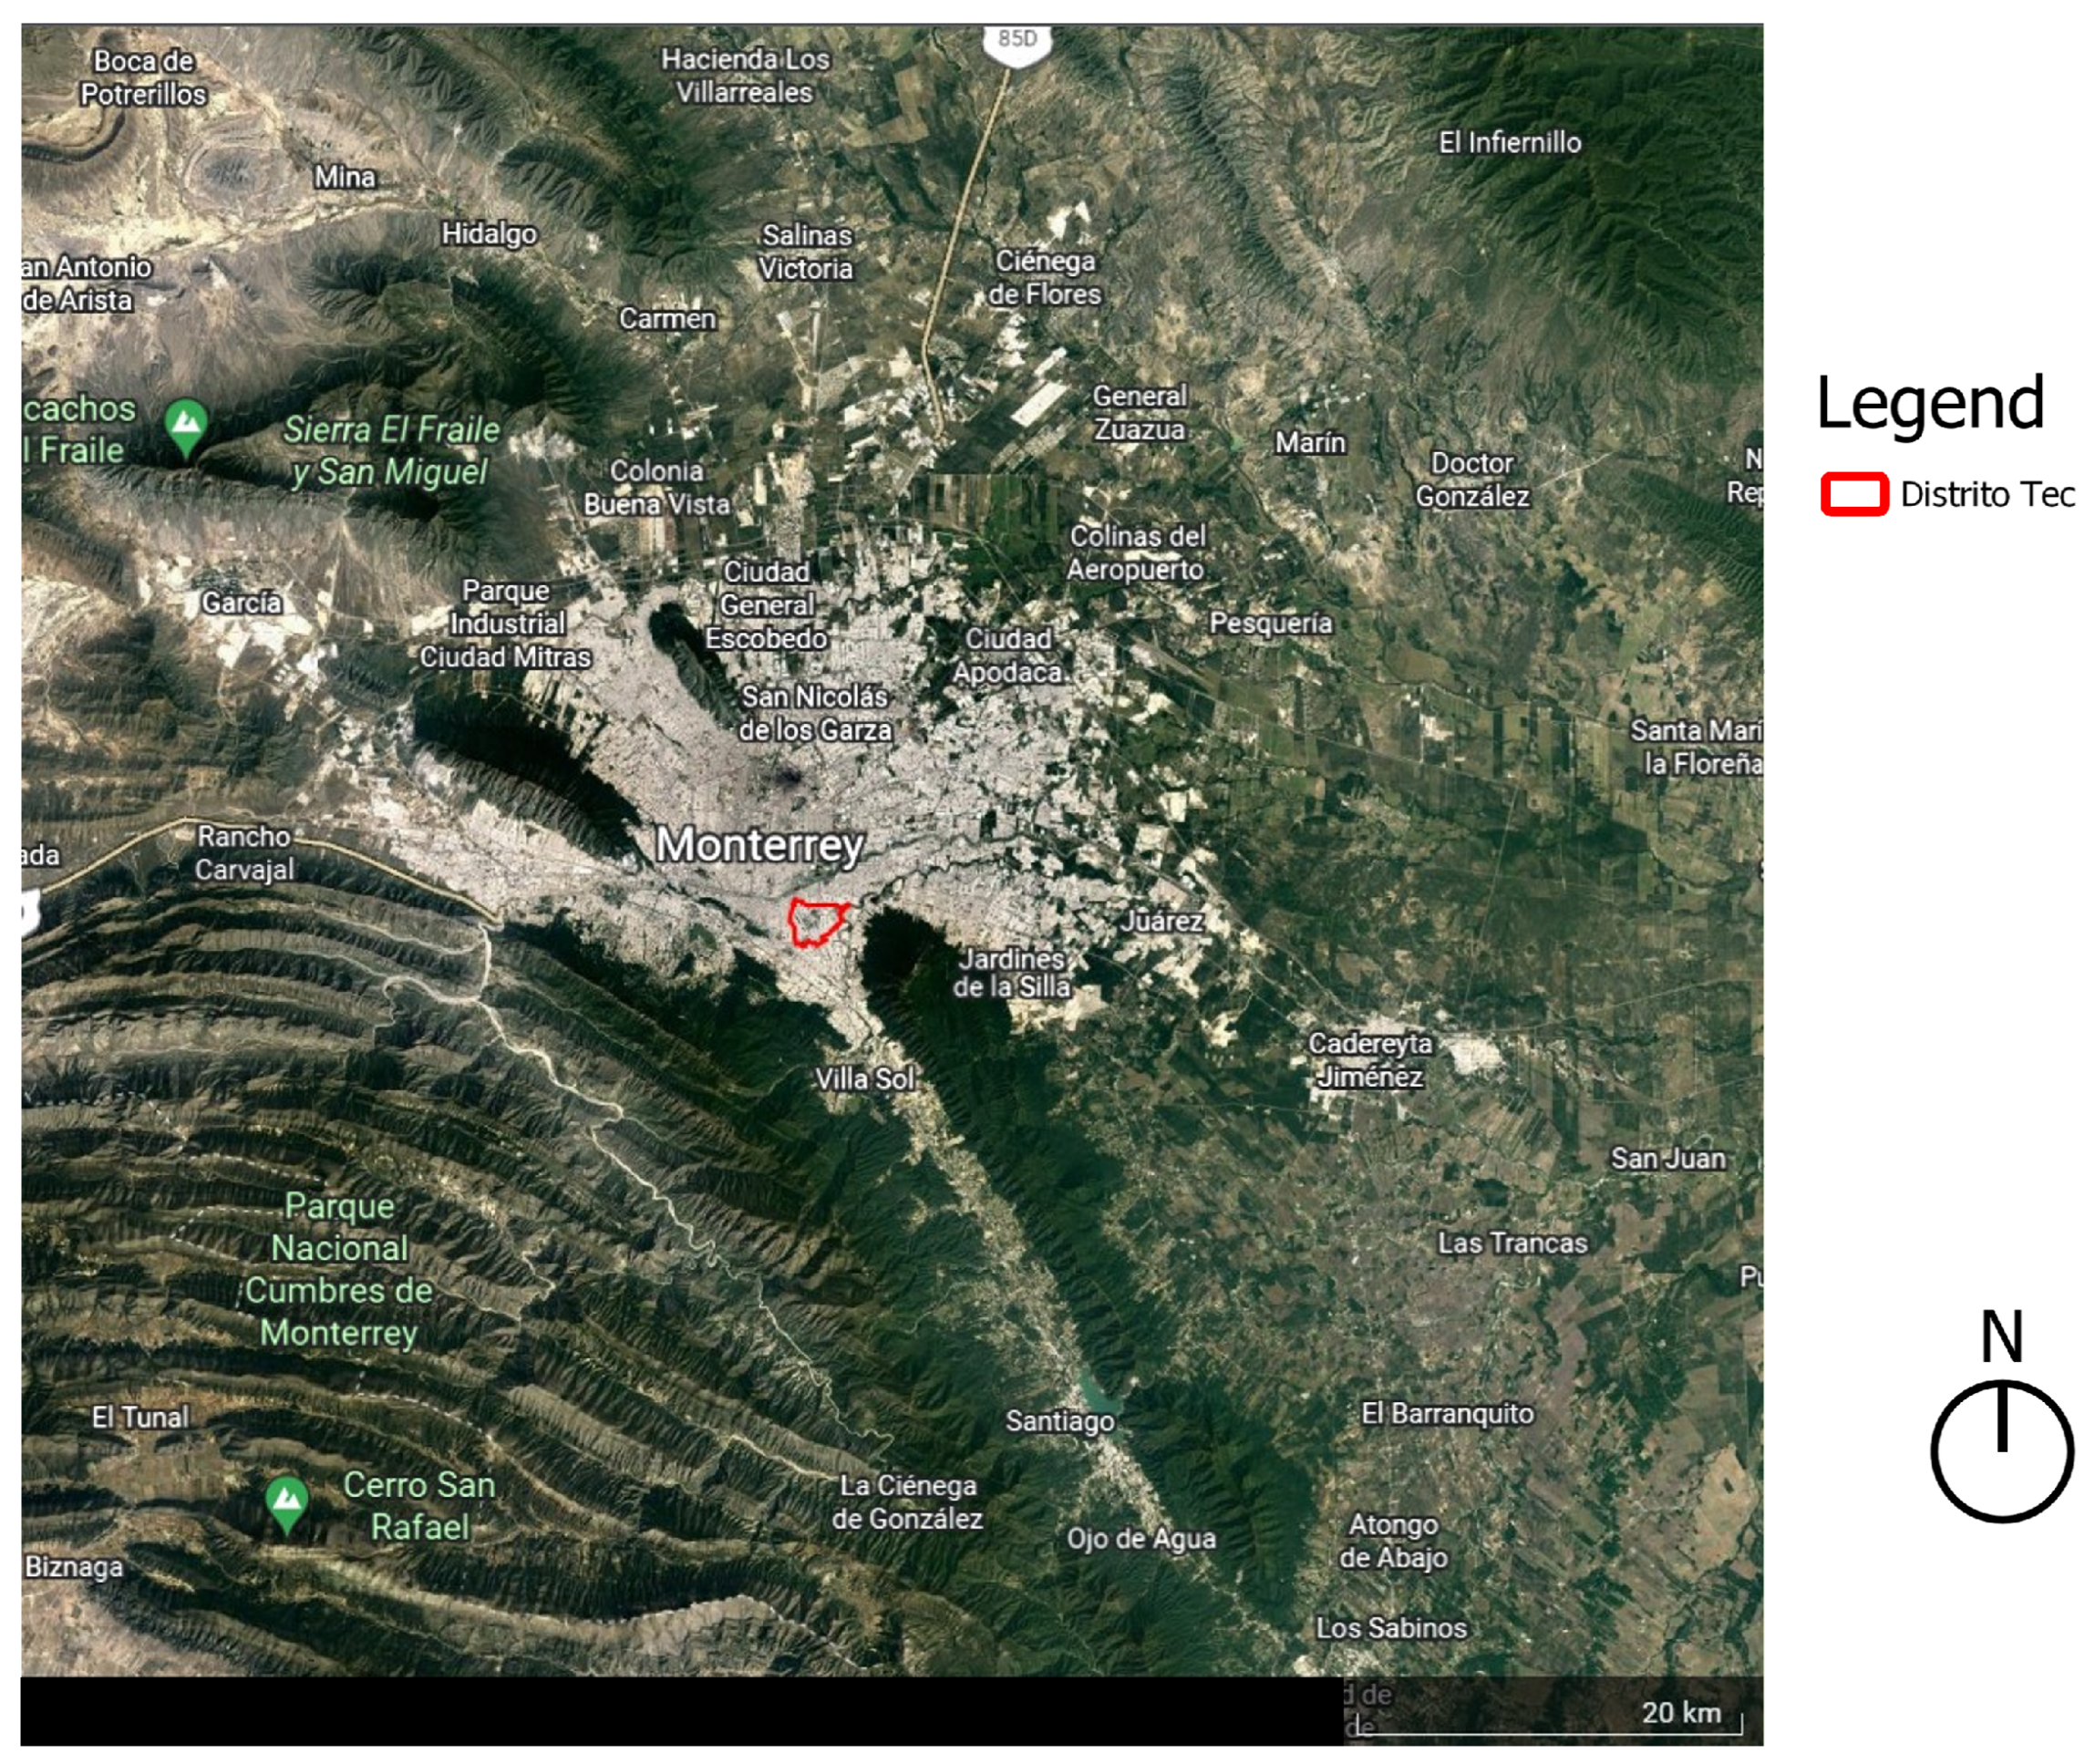
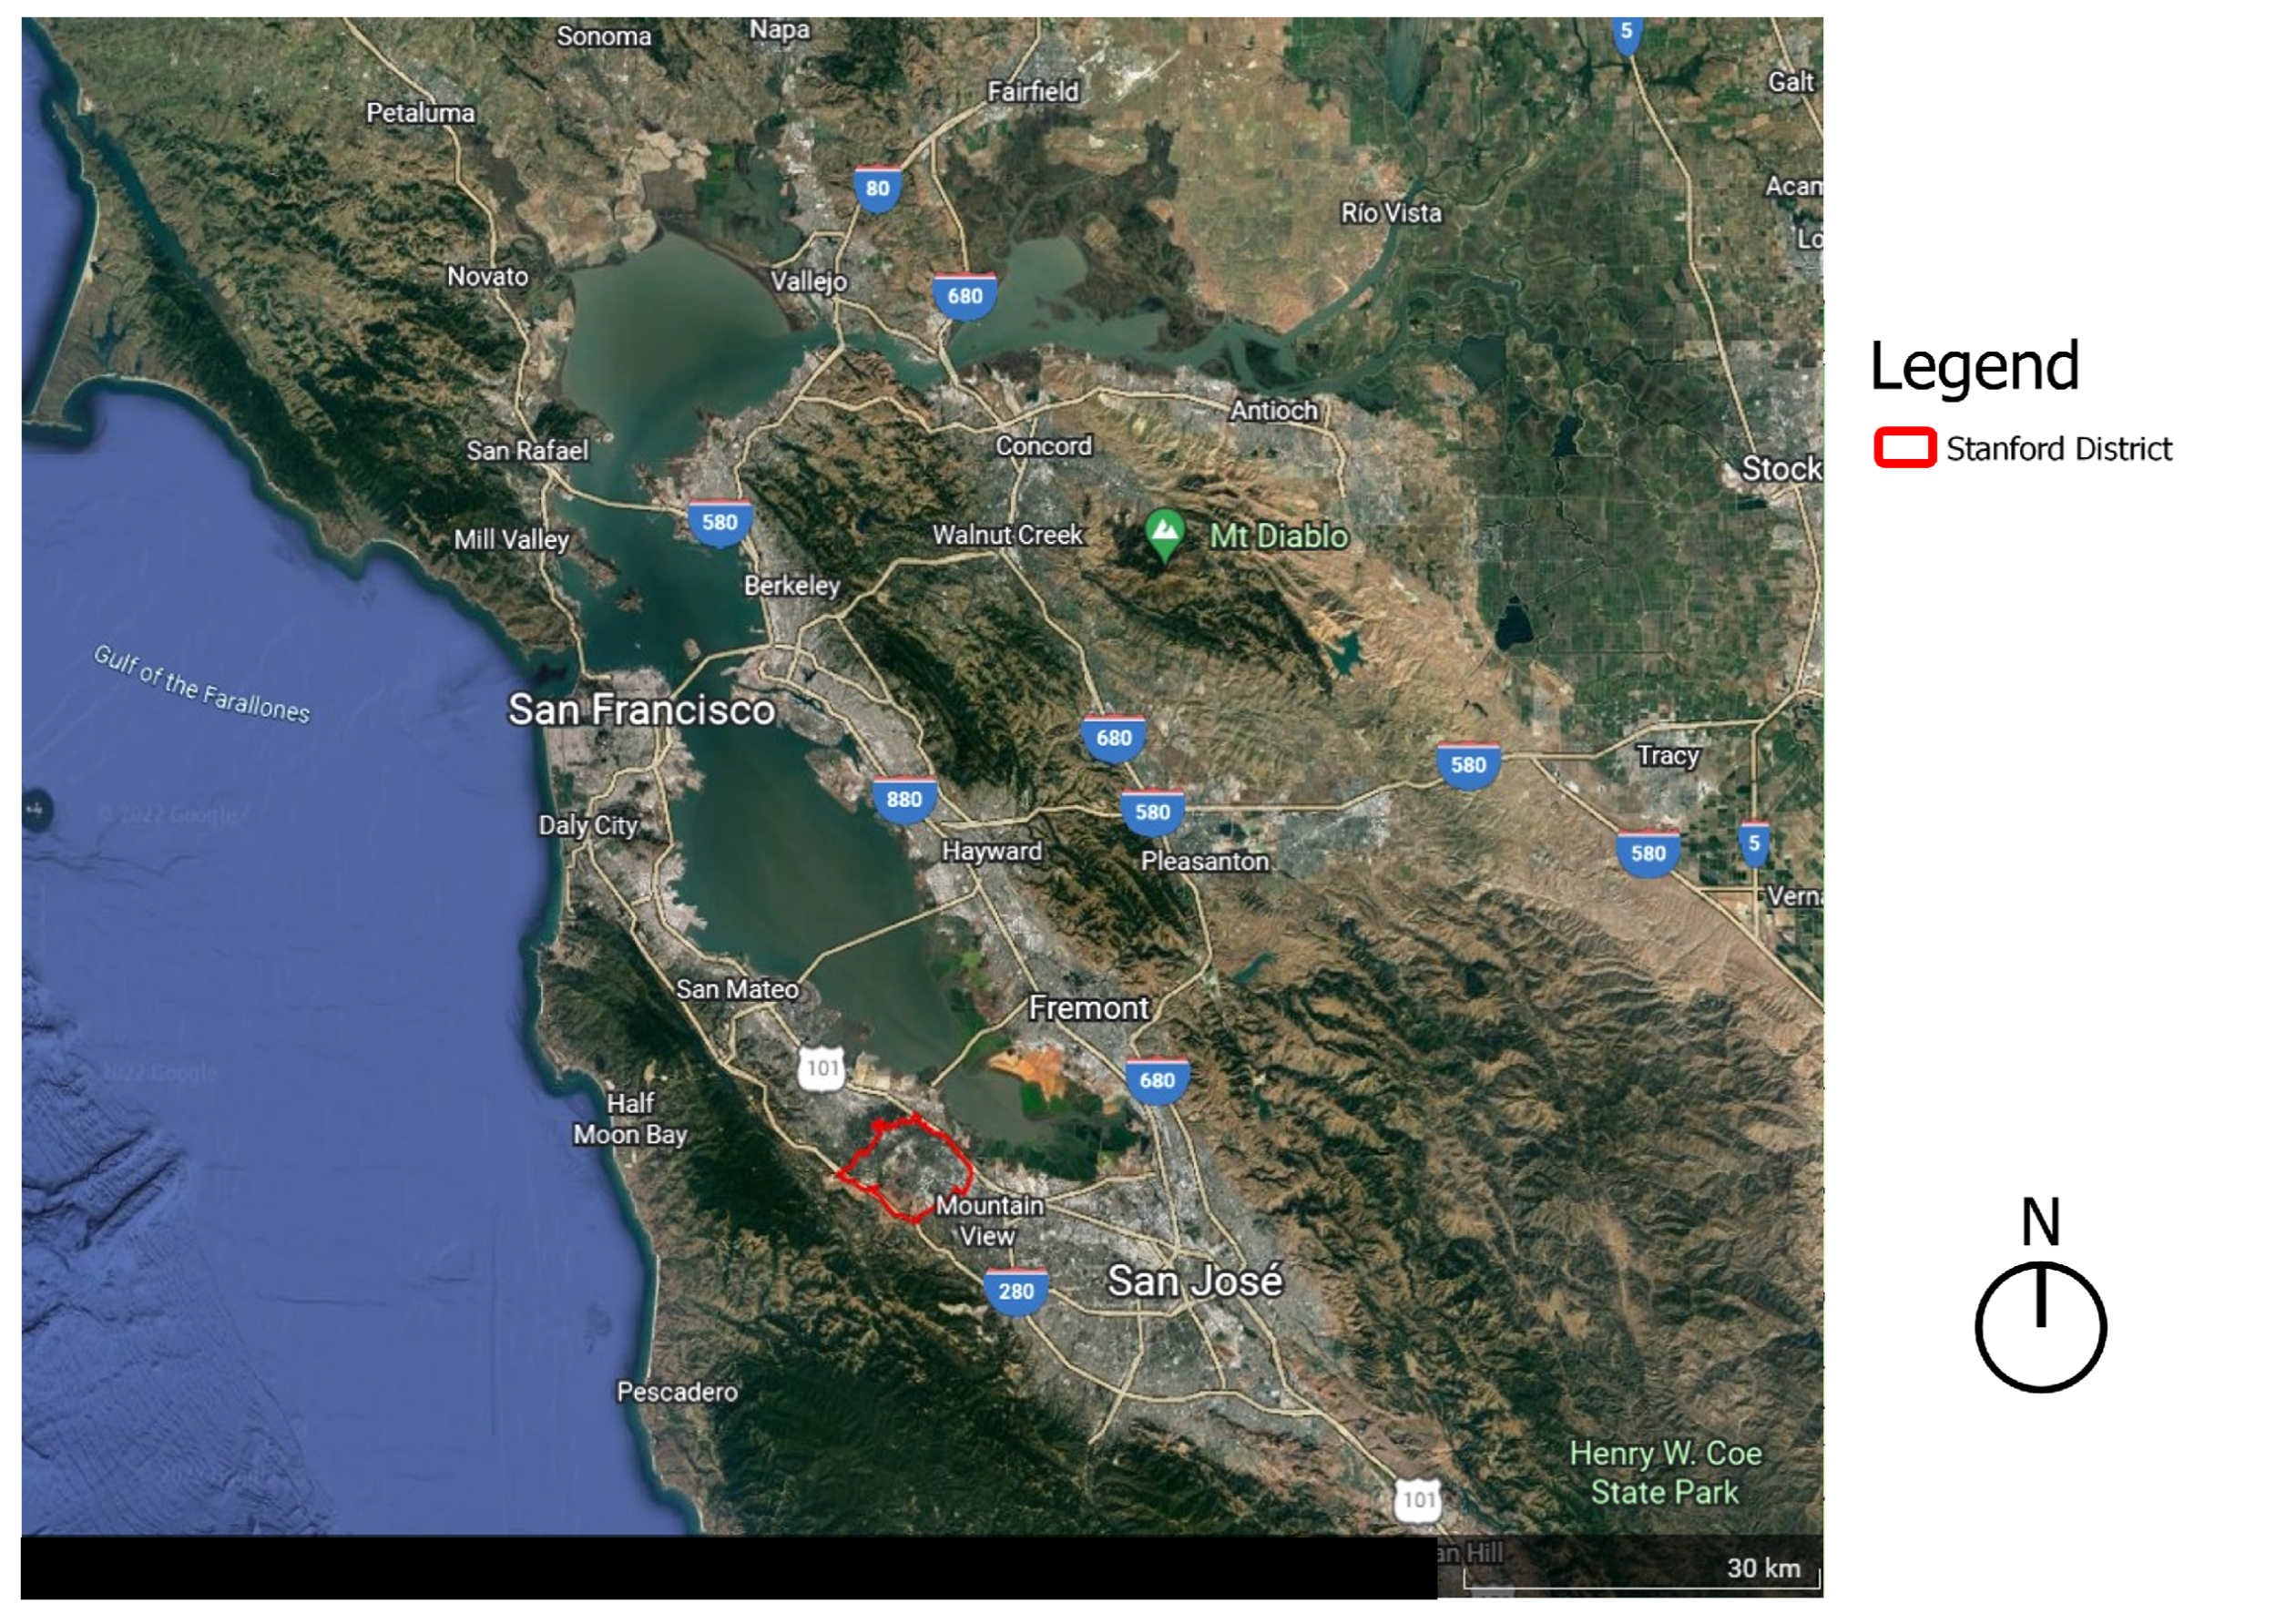
Even though both districts, Distrito Tec and Stanford District, are significantly different in size (see
Table 1), the comparison was considered valid because they are comparable as local areas based on their relative scales within their respective metropolitan areas (see
Figure 7 and
Figure 8).
2.2.2. Software
For the current research project, Urban Mobility Accessibility Computer (UrMoAC), developed by the German Aerospace Centre (DLR), was used as the main tool to compute accessibility measures.
UrMoAC is an open-source command-line tool, written in the Java programming language, designed to compute accessibility measures by reading inputs from a PostgreSQL/PostGIS database [
6]. UrMoAC is a flexible and adaptable tool as it calculates, among other variables, the minimum time and distance required to commute from one given origin (usually urban blocks) to a particular destination (places such as schools, hospitals, supermarkets, parks, etc.) using a specific transport mode or a combination of them (walking, bicycle, motorized vehicles, and public transport). The transportation modes and their speeds used for computations are shown in
Table 2. The computation uses the road network and its constraints (speed limits, direction, and permitted modes of transport) to achieve results based on real distances and close-to-reality transportation behaviors.
The results are accurate simulations of commutes from the selected origins and destinations, offering disaggregated data on travel times and distances based on the available datasets. Further, the results can be aggregated into larger areas (such as neighborhoods, block groups, or statistical areas) to make the results easier to understand and visualize. Thus, the open-source QGIS software [
31] version 3.18 was used to create thematic maps based on the databases obtained from UrMoAC.
2.2.3. Data Processing
For both study areas, urban blocks were the origins for all accessibility measurements. The datasets that contained the urban blocks were downloaded from INEGI for the MMA and from the United States Census Bureau for the BA; this is specified in
Table 3.
The destinations considered for the computation were public education centers (public elementary, middle, and high schools), health care facilities (general acute care hospitals and primary care clinics), supermarkets, and public parks. The datasets were obtained from the National Statistical Directory of Economic Units (DENUE, by its acronym in Spanish) and Urban and Rural Geostatistical Cartography by Blocks, both sources published by INEGI, for the MMA, whereas for the BA, several sources were used: United States Census Bureau, California State Geoportal, California Health and Human Services Open Data, and OpenStreetMap (OSM). The datasets used for the destinations of both study areas are presented in
Table 4.
It is important to mention that there are socioeconomic factors, such as social preference and willingness to pay, that can affect people’s decision to travel to one destination over another. In addition, public services often have access limitations related to building capacity, opening hours, working days, and demand, among others. Such variables will be briefly discussed, as their complete analysis goes beyond the scope of this research project, given that the objective of the research is to provide a preliminary approach to urban accessibility based on the availability of land-uses and transportation networks at different scales according to public datasets. Hence, only public health care facilities and schools were taken into account for the computation, as public facilities are available to everyone regardless of their income.
The road networks of both study areas were downloaded from OSM and are presented in
Table 5.
In order to make the individual results from each block readable, understandable, and useful, they were aggregated into areas and then mapped with QGIS. For the MMA, Basic Geostatistical Areas (AGEBs) were used; for the BA, block groups were used. Both are widely utilized units of analysis for cartographic purposes (see
Table 6).
All the datasets collected for the study (origins, destinations, road network, and aggregation areas) were uploaded to PostgreSQL. Once this step was completed, UrMoAC, with access to the database, ran the computations. In order to do so, for each accessibility measure, it is necessary to write a command that specifies the variables to use, the transport mode, and the constraints for each measurement. The constraints used for the current research project were nearest destination and first three destinations.
The output of the computation is a table with the travel time and distance required to reach the desired destination for each aggregation area. These results are then mapped in QGIS using the cumulative opportunity accessibility metric (where more opportunities in the environment relate to higher levels of accessibility [
32]). A standardized rating scale for accessibility (low, medium, and high), related to different times and distances, is presented in
Table 7. In this scale, a high accessibility is considered if a destination can be reached within 15 minutes, according to the concept of the 15 Minute City.
3. Results
The following section will assess urban accessibility to destinations that most people commute to in their daily lives. UrMoAC also has the capability to compute accessibility measurements to other destinations that could be considered to expand the current research and that are indeed very important to fully understand accessibility levels in a given area; nevertheless, they go beyond the scope of work of this research. In the same way, this study analyzed one-way trips as a starting point to evaluate the accessibility of a city, and although it was not implemented in this study, one way to improve the implemented methodology is by including the analysis of round trips [
33], activity paths, and travel times into the simulation with the help of other open-source tools such as SUMO [
34] and TAPAS [
35].
As the research was based on the concept of the 15 Minute City, the two transport modes used to assess accessibility were walking and cycling. Many cities are encouraging more people to walk or cycle, as they bring about important benefits to society (noise reduction, exercise, safe and comfortable streets), to the environment (reduction of GHG emissions), and even to the economy (pedestrian and cycling infrastructure is less expensive to build and maintain than that of motorized transport). However, there are important factors that can impact the decision to use one transport mode or another, one of them being the geography of the city. The inclusion of such factors is beyond the scope of this article and can be added to the limitations of the study. However, a more realistic estimate could be obtained by adding the “steepness” [
36] of the streets in the city as another factor to the OSM dataset.
Nevertheless, it is important to state that, today, cities and societies still rely heavily on motorized transport such as public transport and private vehicles to reach certain destinations. Consequently, this study should be extended by incorporating accessibility measures to the chosen destinations using such modes of transport. To do so, it is necessary to develop datasets that provide the average speed of cars on the entire road network throughout the day, as well as GTFS datasets of the whole public transport system of the given city. Currently, such datasets are not available for both cities, eliminating the possibility to make such comparisons in the following section.
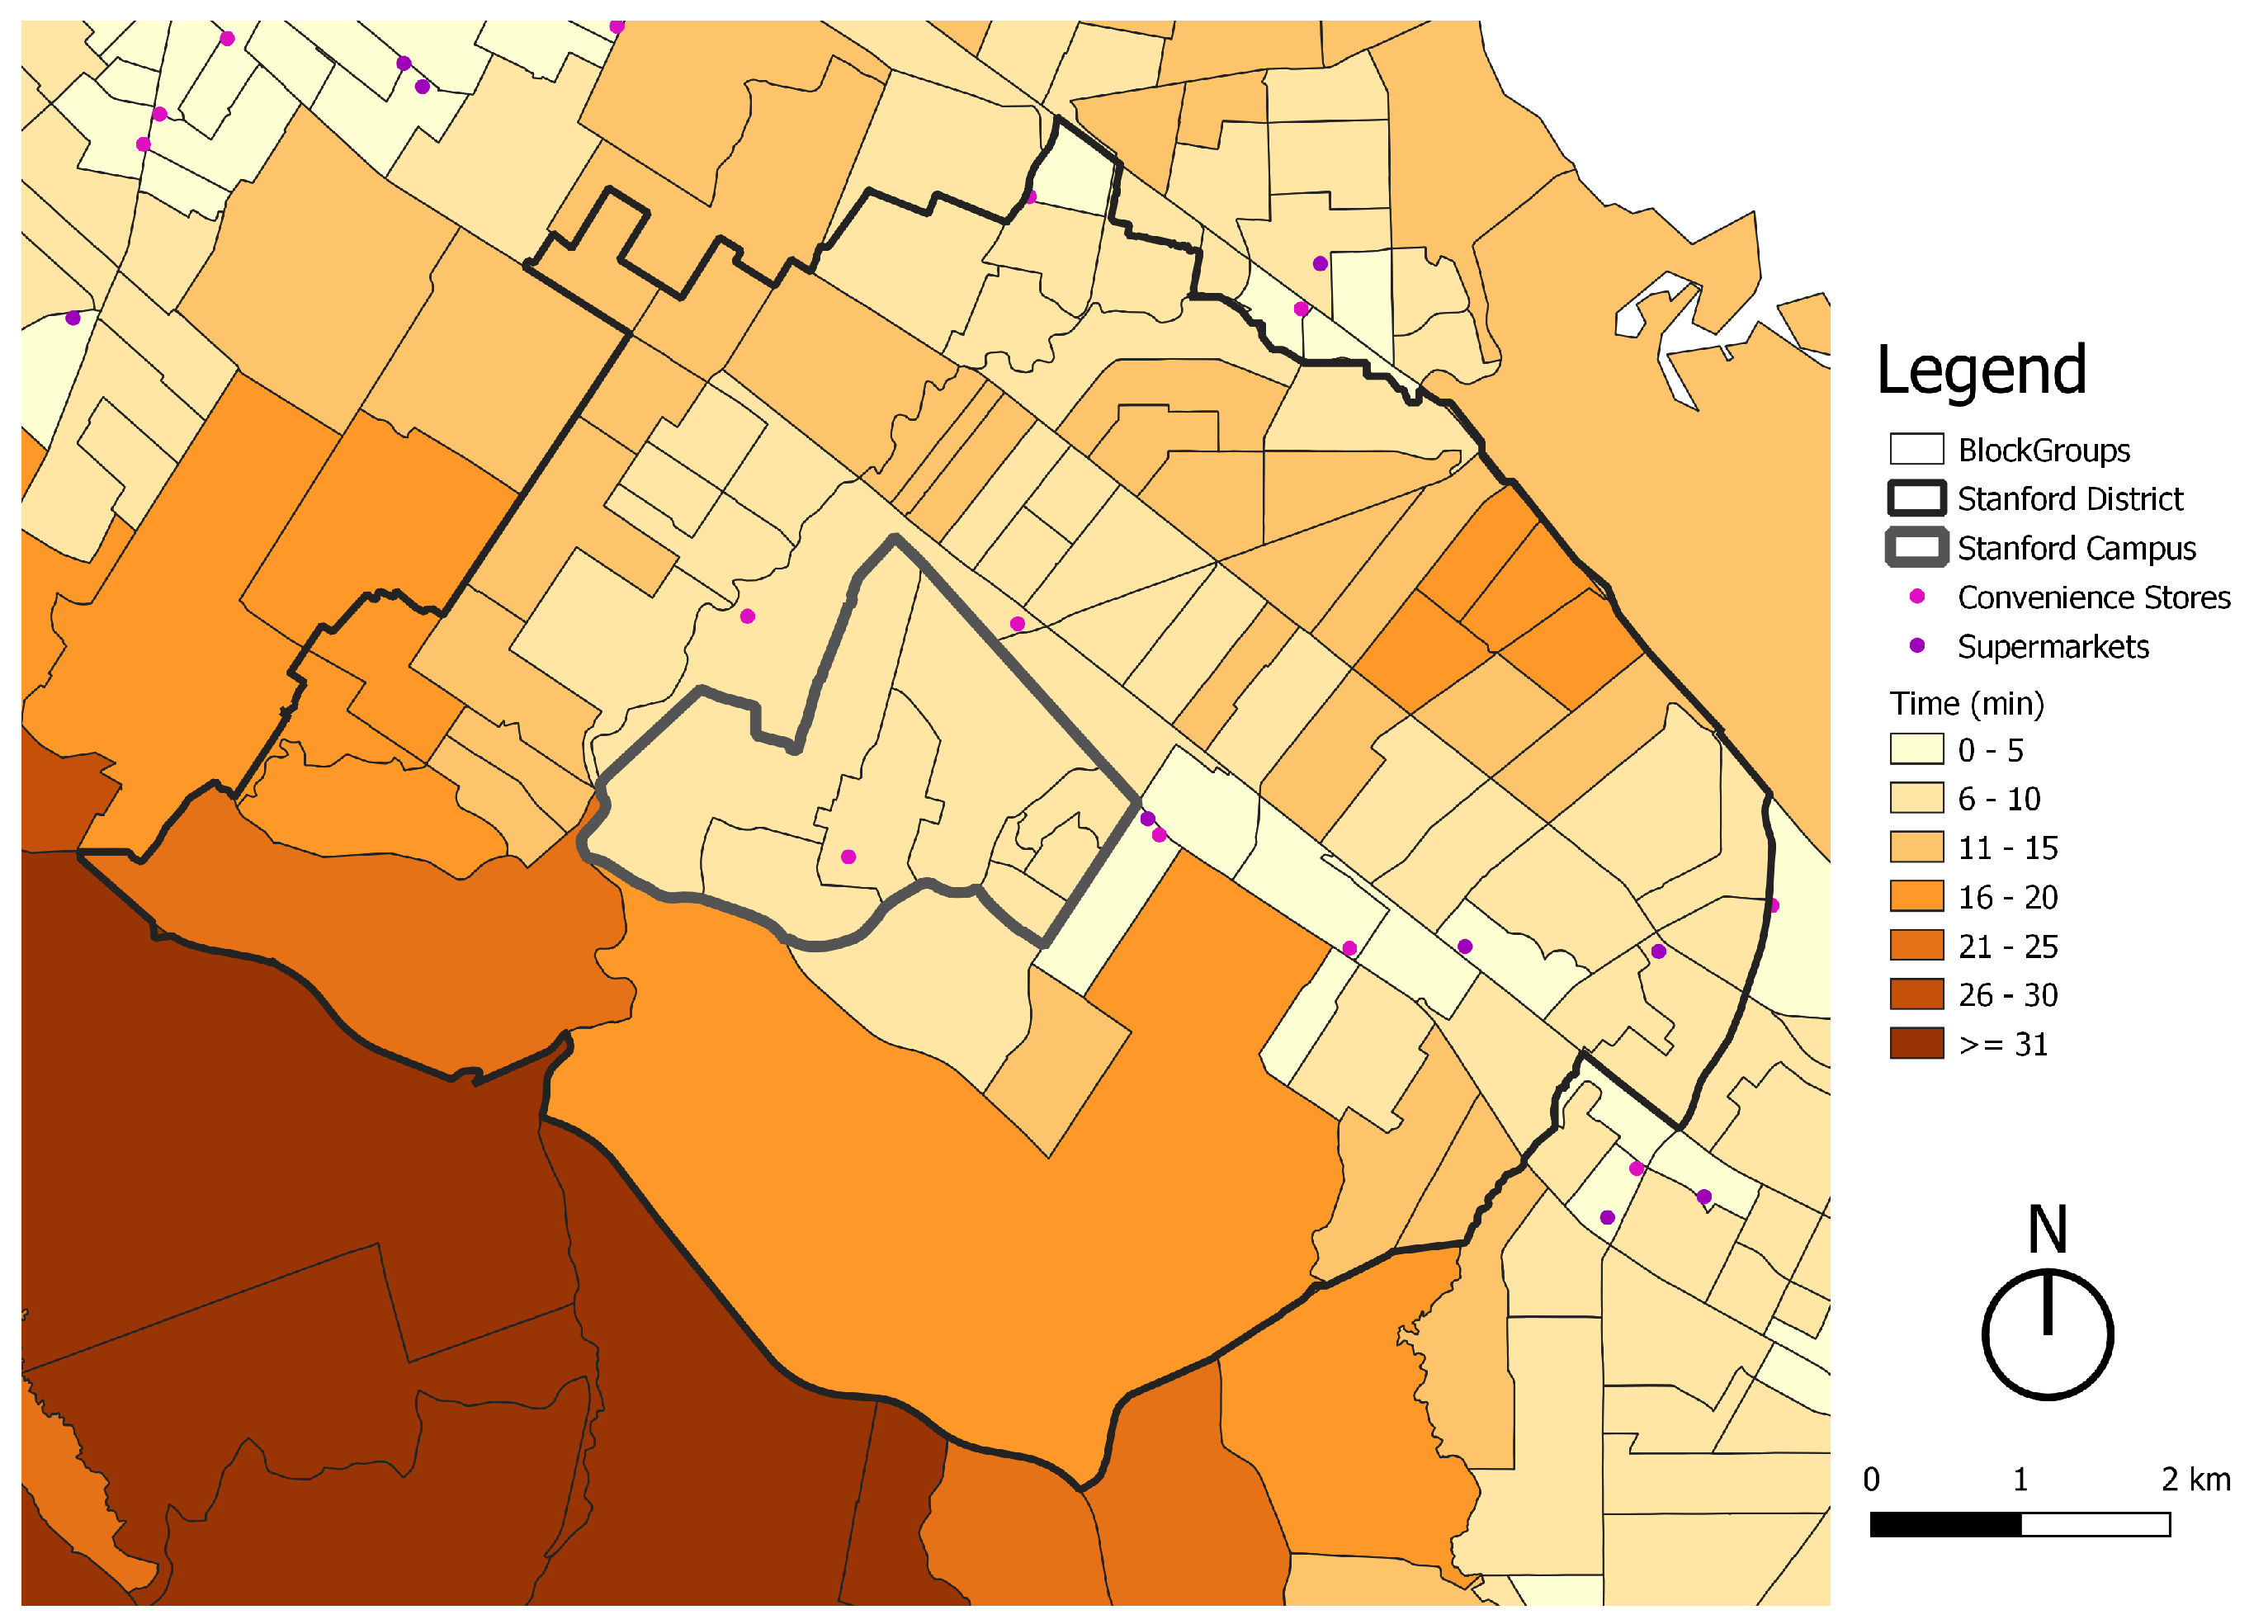
3.1. Access to Supermarkets
Cities around the world offer a variety of options for people to buy their groceries; nevertheless, in both the MMA and BA, supermarkets are the most popular choice. It is important to note that, in low-income neighborhoods in the Bay Area with fewer supermarkets (so-called food deserts [
37]), convenience stores (i.e., small retail businesses) are often relied upon for most groceries, so for this study, convenience stores were also considered for this study area.
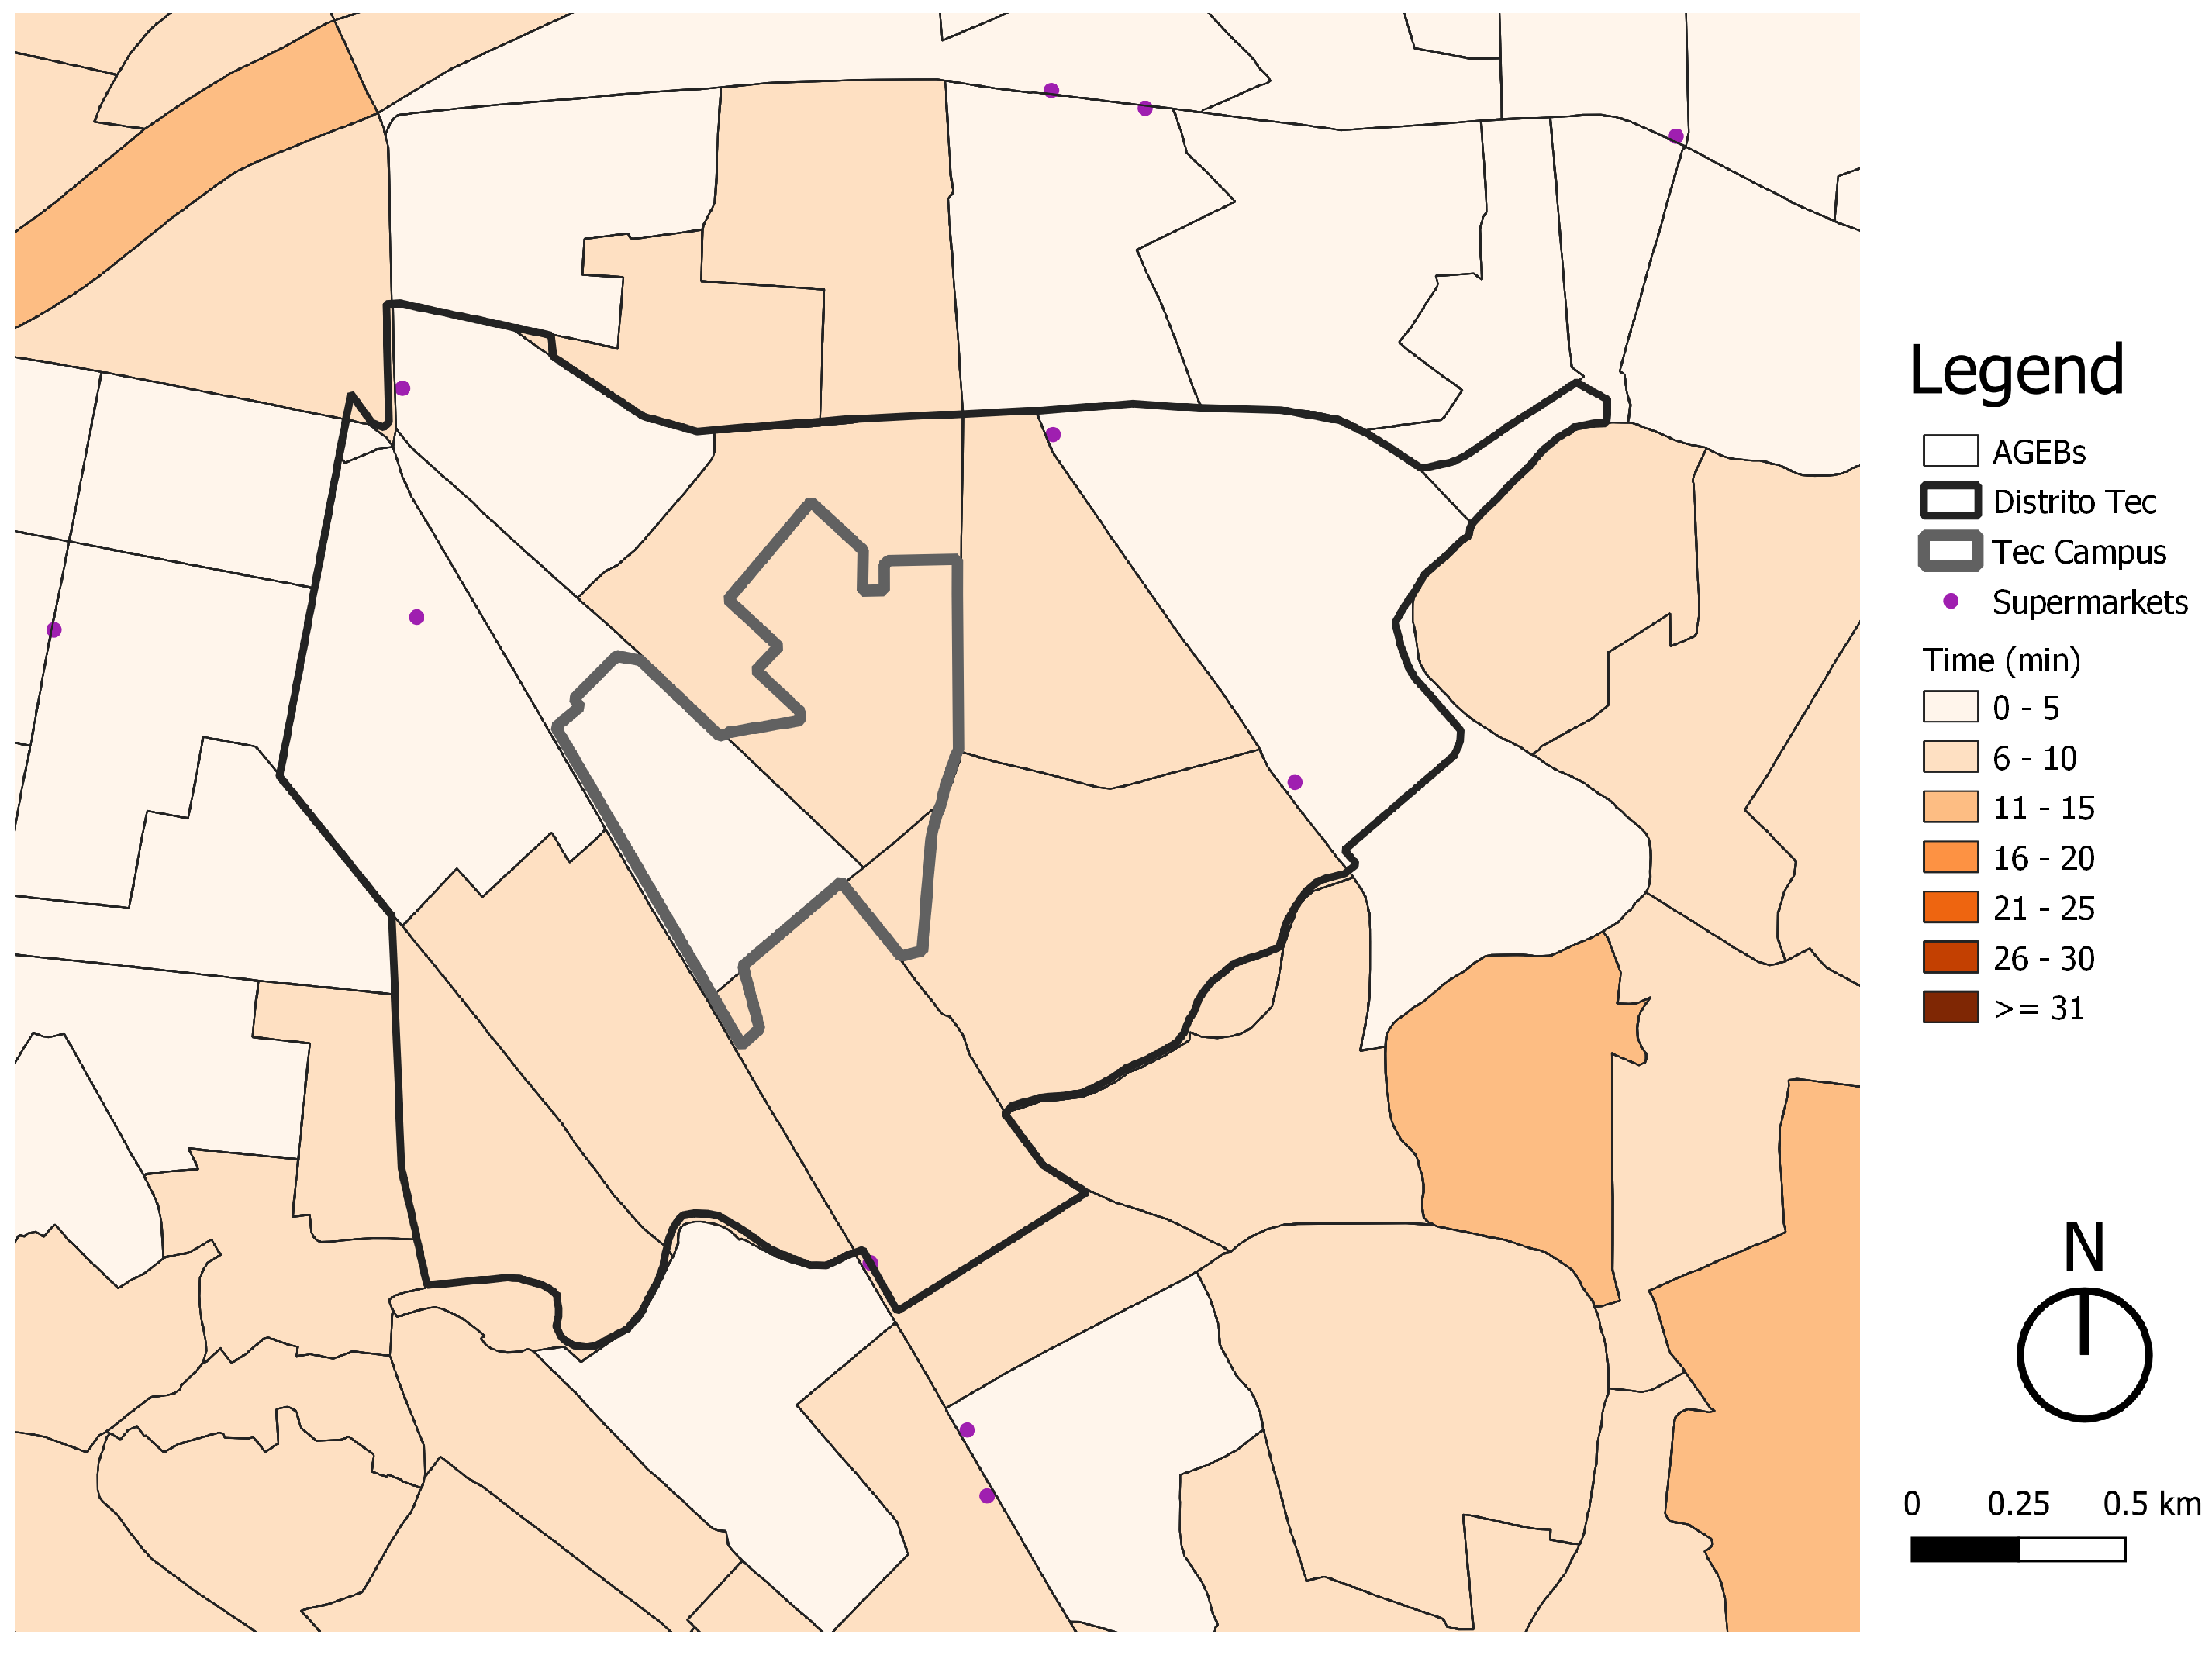
Supermarkets in both cities tend to be large-scale buildings belonging to transnational companies such as Walmart, Sam’s Club, Costco, Target, and H-E-B, among others. At these stores, people buy a variety of goods such as food, beverages, personal care products, medicines, house cleaning products, home appliances, etc.
Most of the supermarkets in both cities are designed for people to access by car, offering extensive parking areas. Additionally, people tend to buy large amounts of products to avoid going to the supermarket more than once per week, and most buy groceries for more than one person. As a result, most people that have a car use it to go to the supermarket. Changing this behavior, i.e., encouraging people to walk or cycle to the supermarket, poses an important challenge, as both modes of transportation reduce the capacity of people to carry large quantities of goods. Such a modal shift would cause people to require going to the supermarket more frequently, and this would only be feasible if supermarkets are very accessible.
Figure 9 and
Figure 10 assess the accessibility levels traveling by bicycle in the Stanford District and Distrito Tec. All measurements are made to the closest supermarket, assuming most people value proximity above other factors to such destinations.
Figure 9 demonstrates that, according to the OpenStreetMap database, most of the supermarkets and convenience stores are concentrated in the central and eastern areas of the Stanford District.
Nevertheless, the accessibility results when traveling by bicycle to supermarkets and convenience stores are promising, with 88.61% of the aggregation areas complying with the 15 min standard. The remaining nine are located at a medium range (see
Table 8).
According to the DENUE database, Distrito Tec has four supermarkets located in the northern and eastern areas.
In contrast with the Stanford District, all aggregation areas of Distrito Tec have a high level of accessibility when traveling by bicycle to the closest supermarket (see
Table 8).
Based on the results for both study areas, the density of destinations is adequate to make a modal shift from cars to bicycles. Nonetheless, many people will still prefer to use alternative modes of transport such as cars, taxis, or even public transport, as these make it is easier to carry the goods. Additionally, many people will not be willing to go more than once per week to the supermarket because they are unable to carry everything on a bike. Such factors represent a strong constraint to convince people to stop using their cars, especially in cities where the car culture is strong.
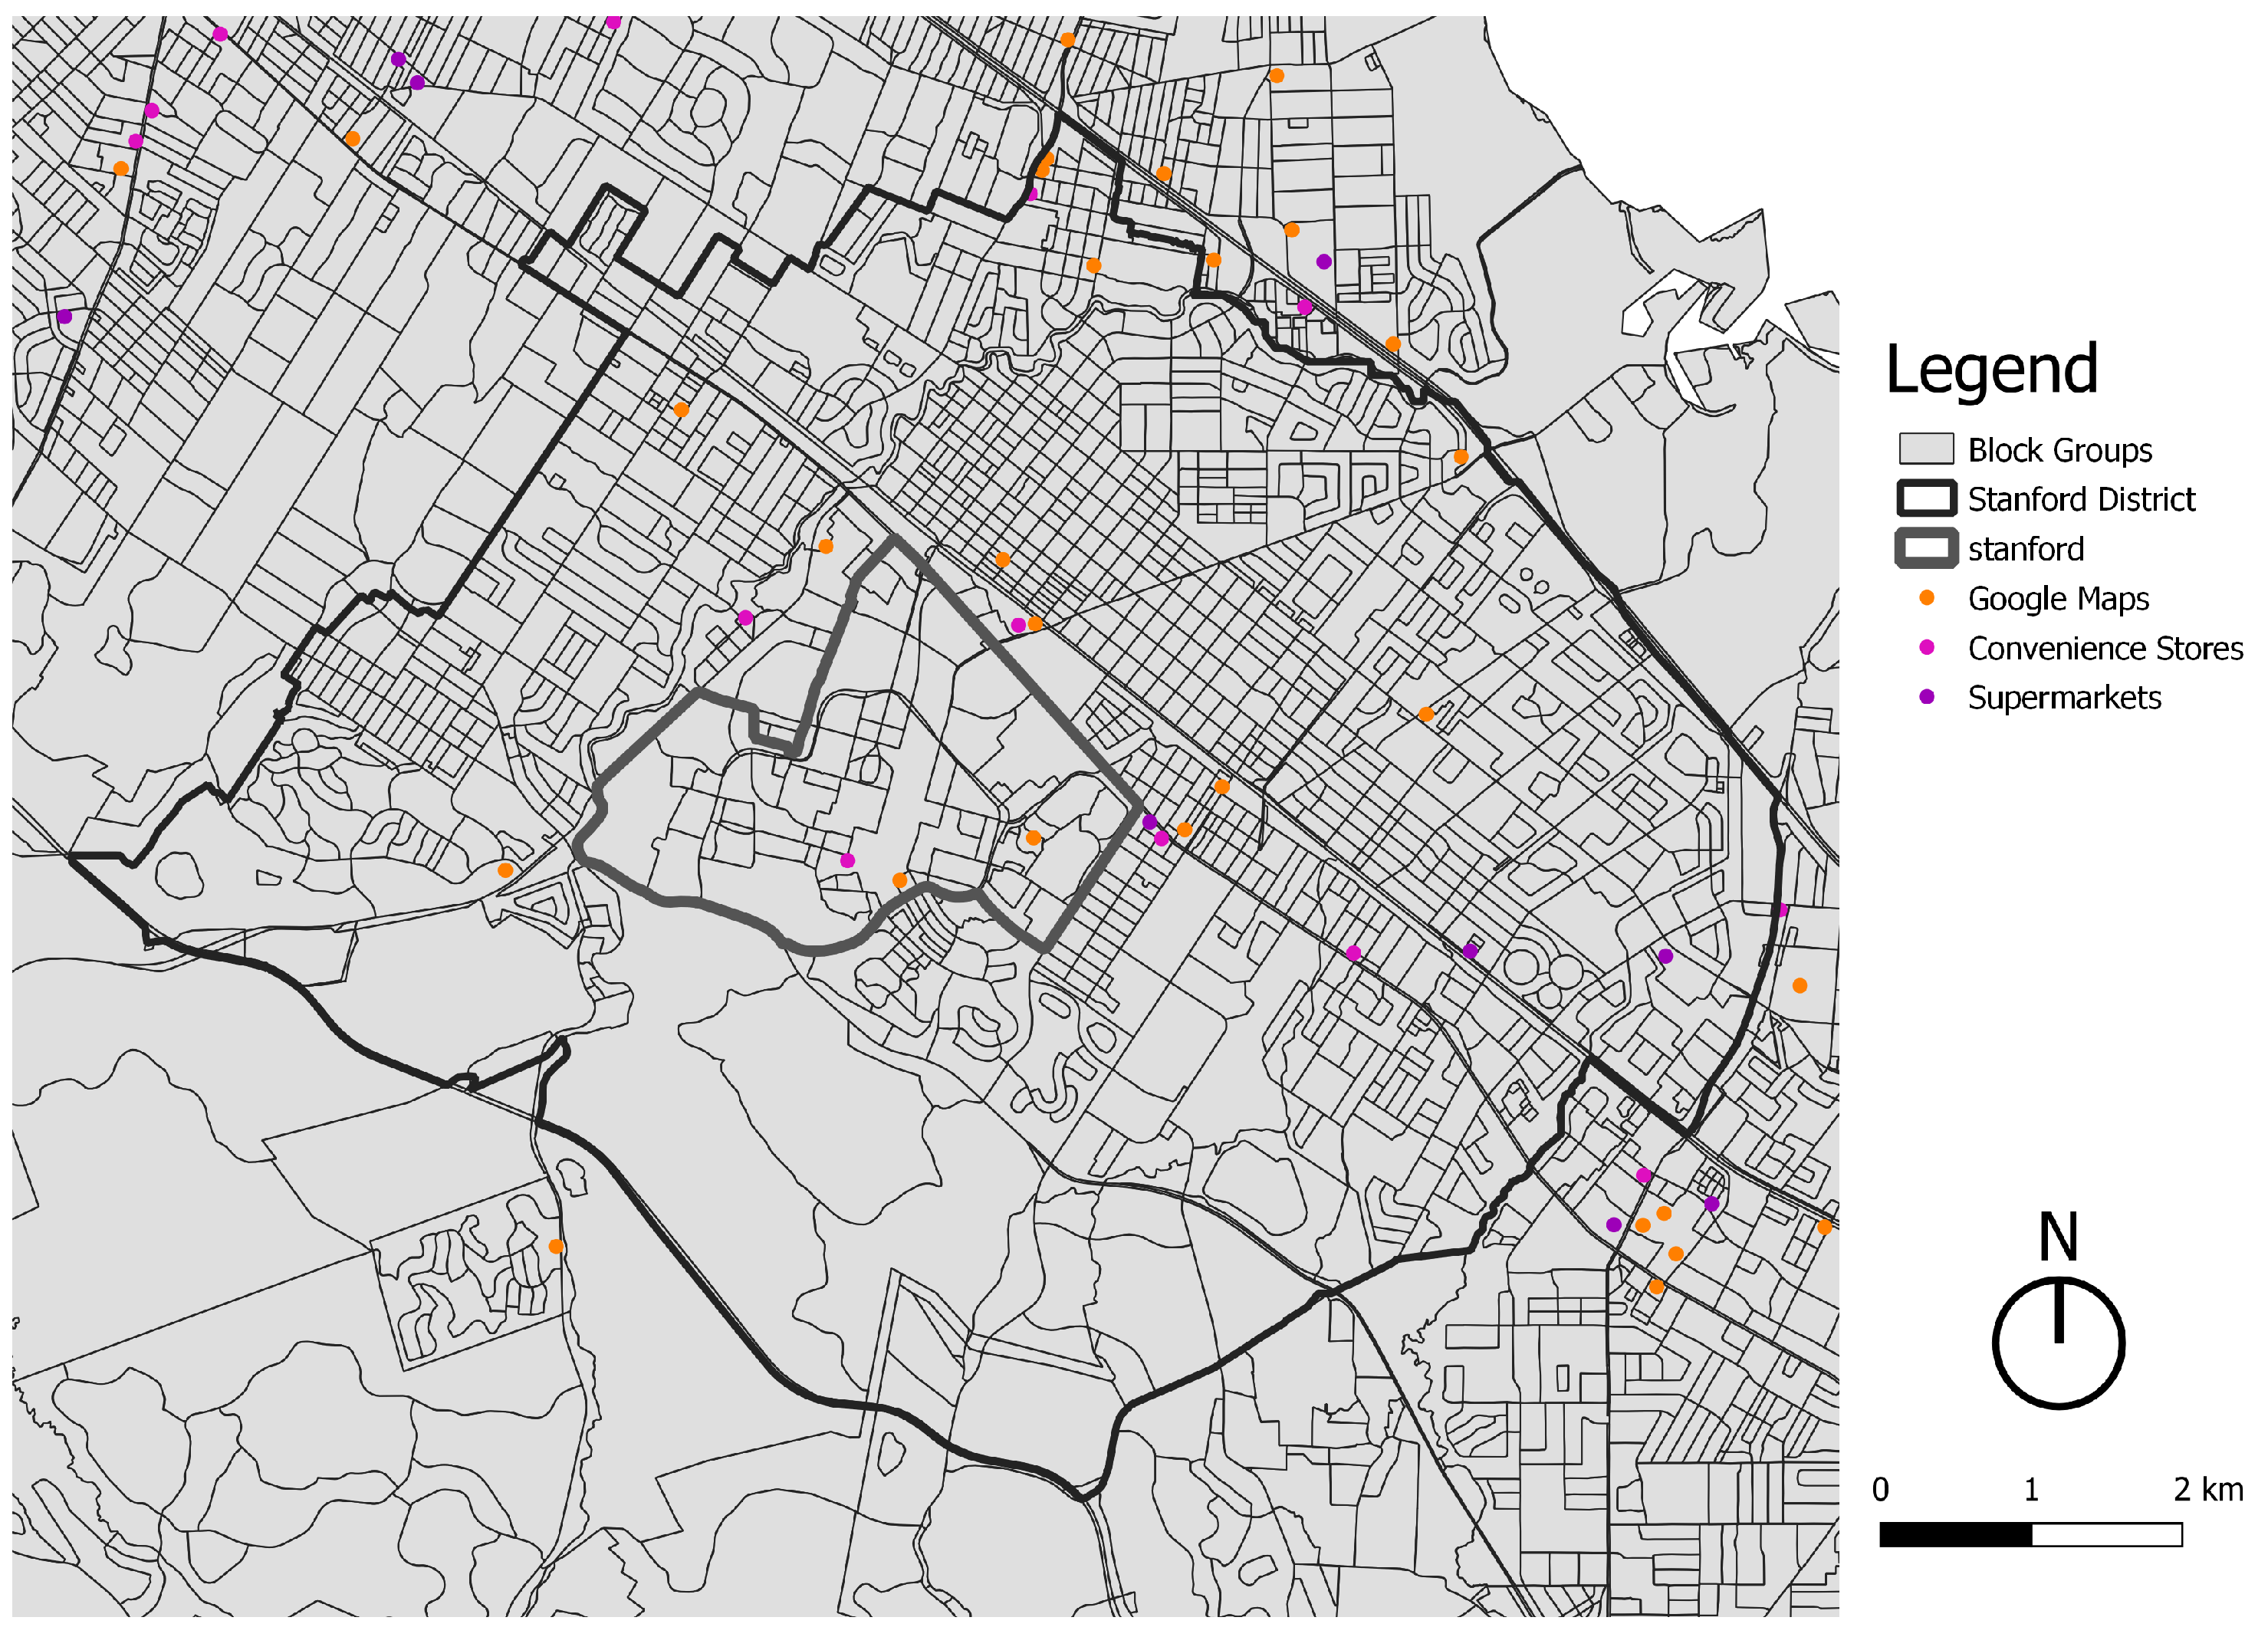
In terms of data quality, the authors noticed, based on their personal experience visiting both study areas, that some destinations were missing. Therefore, the decision was made to manually map missing locations based on Google Maps data.
Figure 11 shows a significant change in the number of destinations, demonstrating that the original data source for the Stanford District, OSM, has not been updated. In contrast, the database from DENUE for Distrito Tec showed no missing locations. Hence, running UrMoAC with the data shown in
Figure 11 would surely bring new and better results, as accessibility levels in the Stanford District would increase. Such faults represent a considerable constraint in planning processes and can mislead decisions regarding urban interventions that aim to improve accessibility levels.
3.2. Access to Educational Centers
The current section is dedicated to analyzing access to public educational centers. The section is divided into three parts, starting with public elementary schools, followed by public middle schools, and ending with public high schools.
It is important to mention that, in contrast to other destinations, schools are meant for a given age group. Therefore, the demand for schools depends, to a high extent, on the existence of a respective population in a given area. To analyze whether such a population exists or not in the study area goes beyond the scope of work of the current research project; hence, we assumed that such a population exists in both Stanford District and Distrito Tec.
As students are not always capable of going to the closest school due to capacity limits, social preference, or other constraints, the accessibility measurement was performed considering travel time to the thee closest destinations (schools).
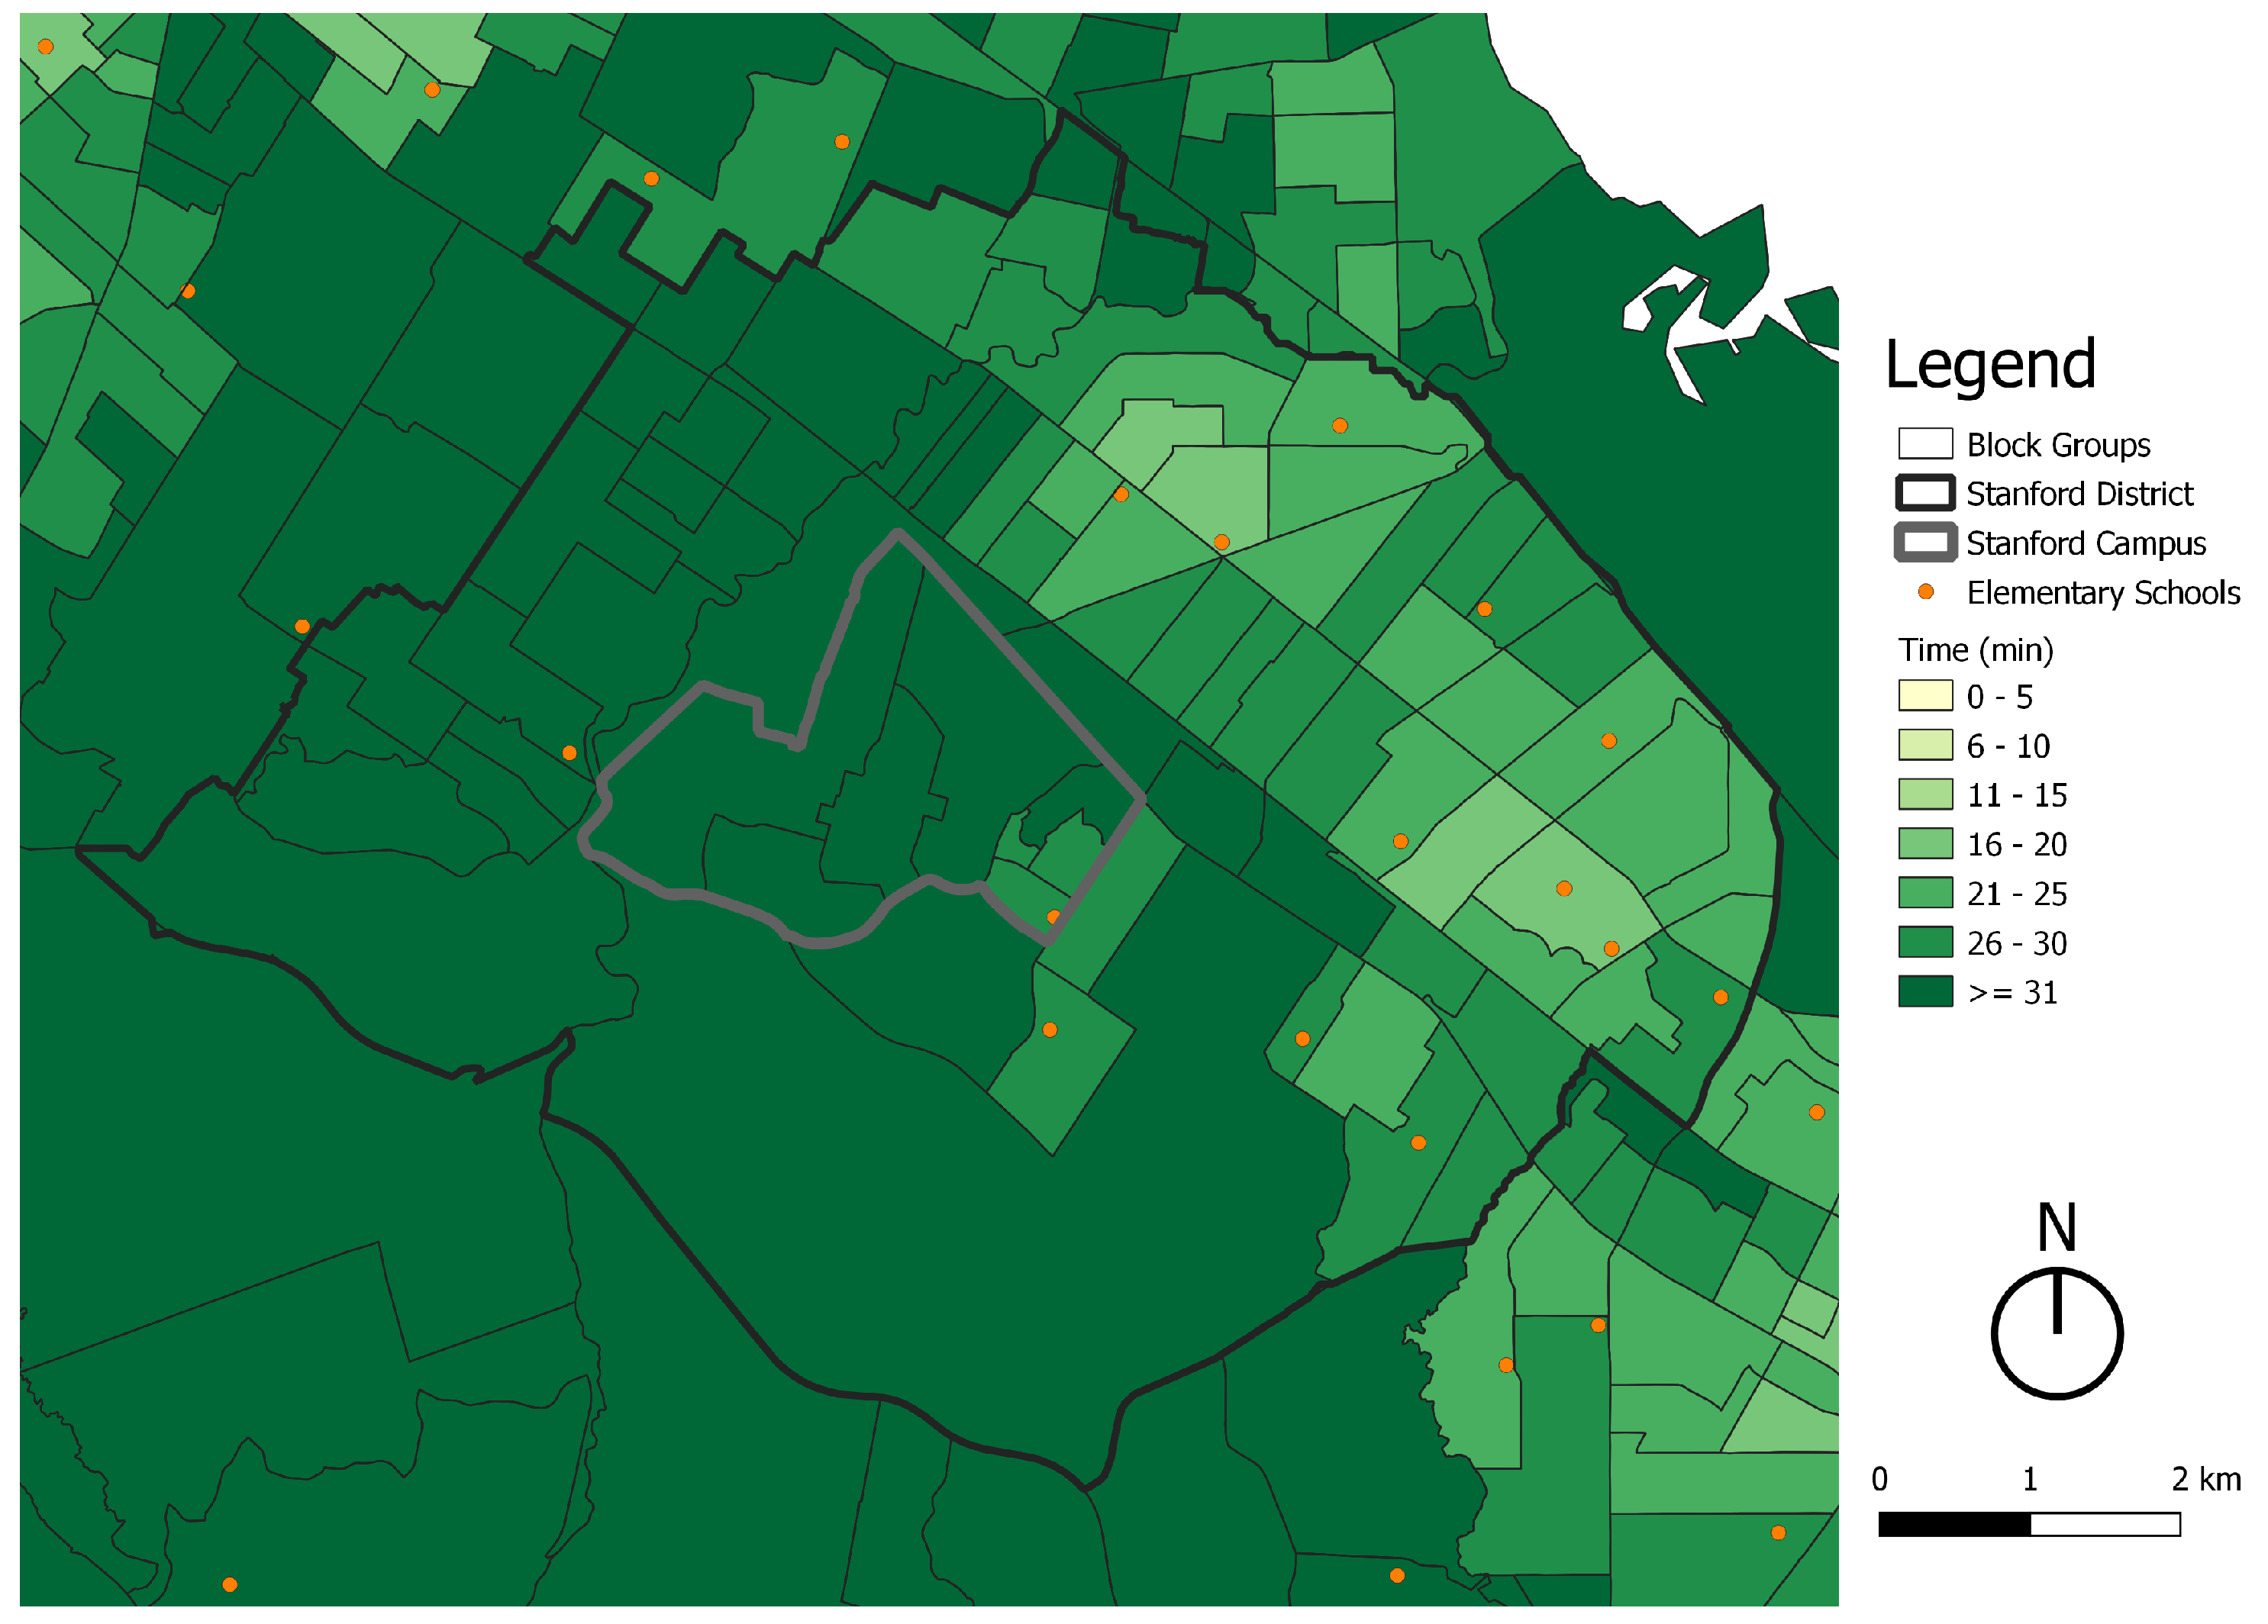
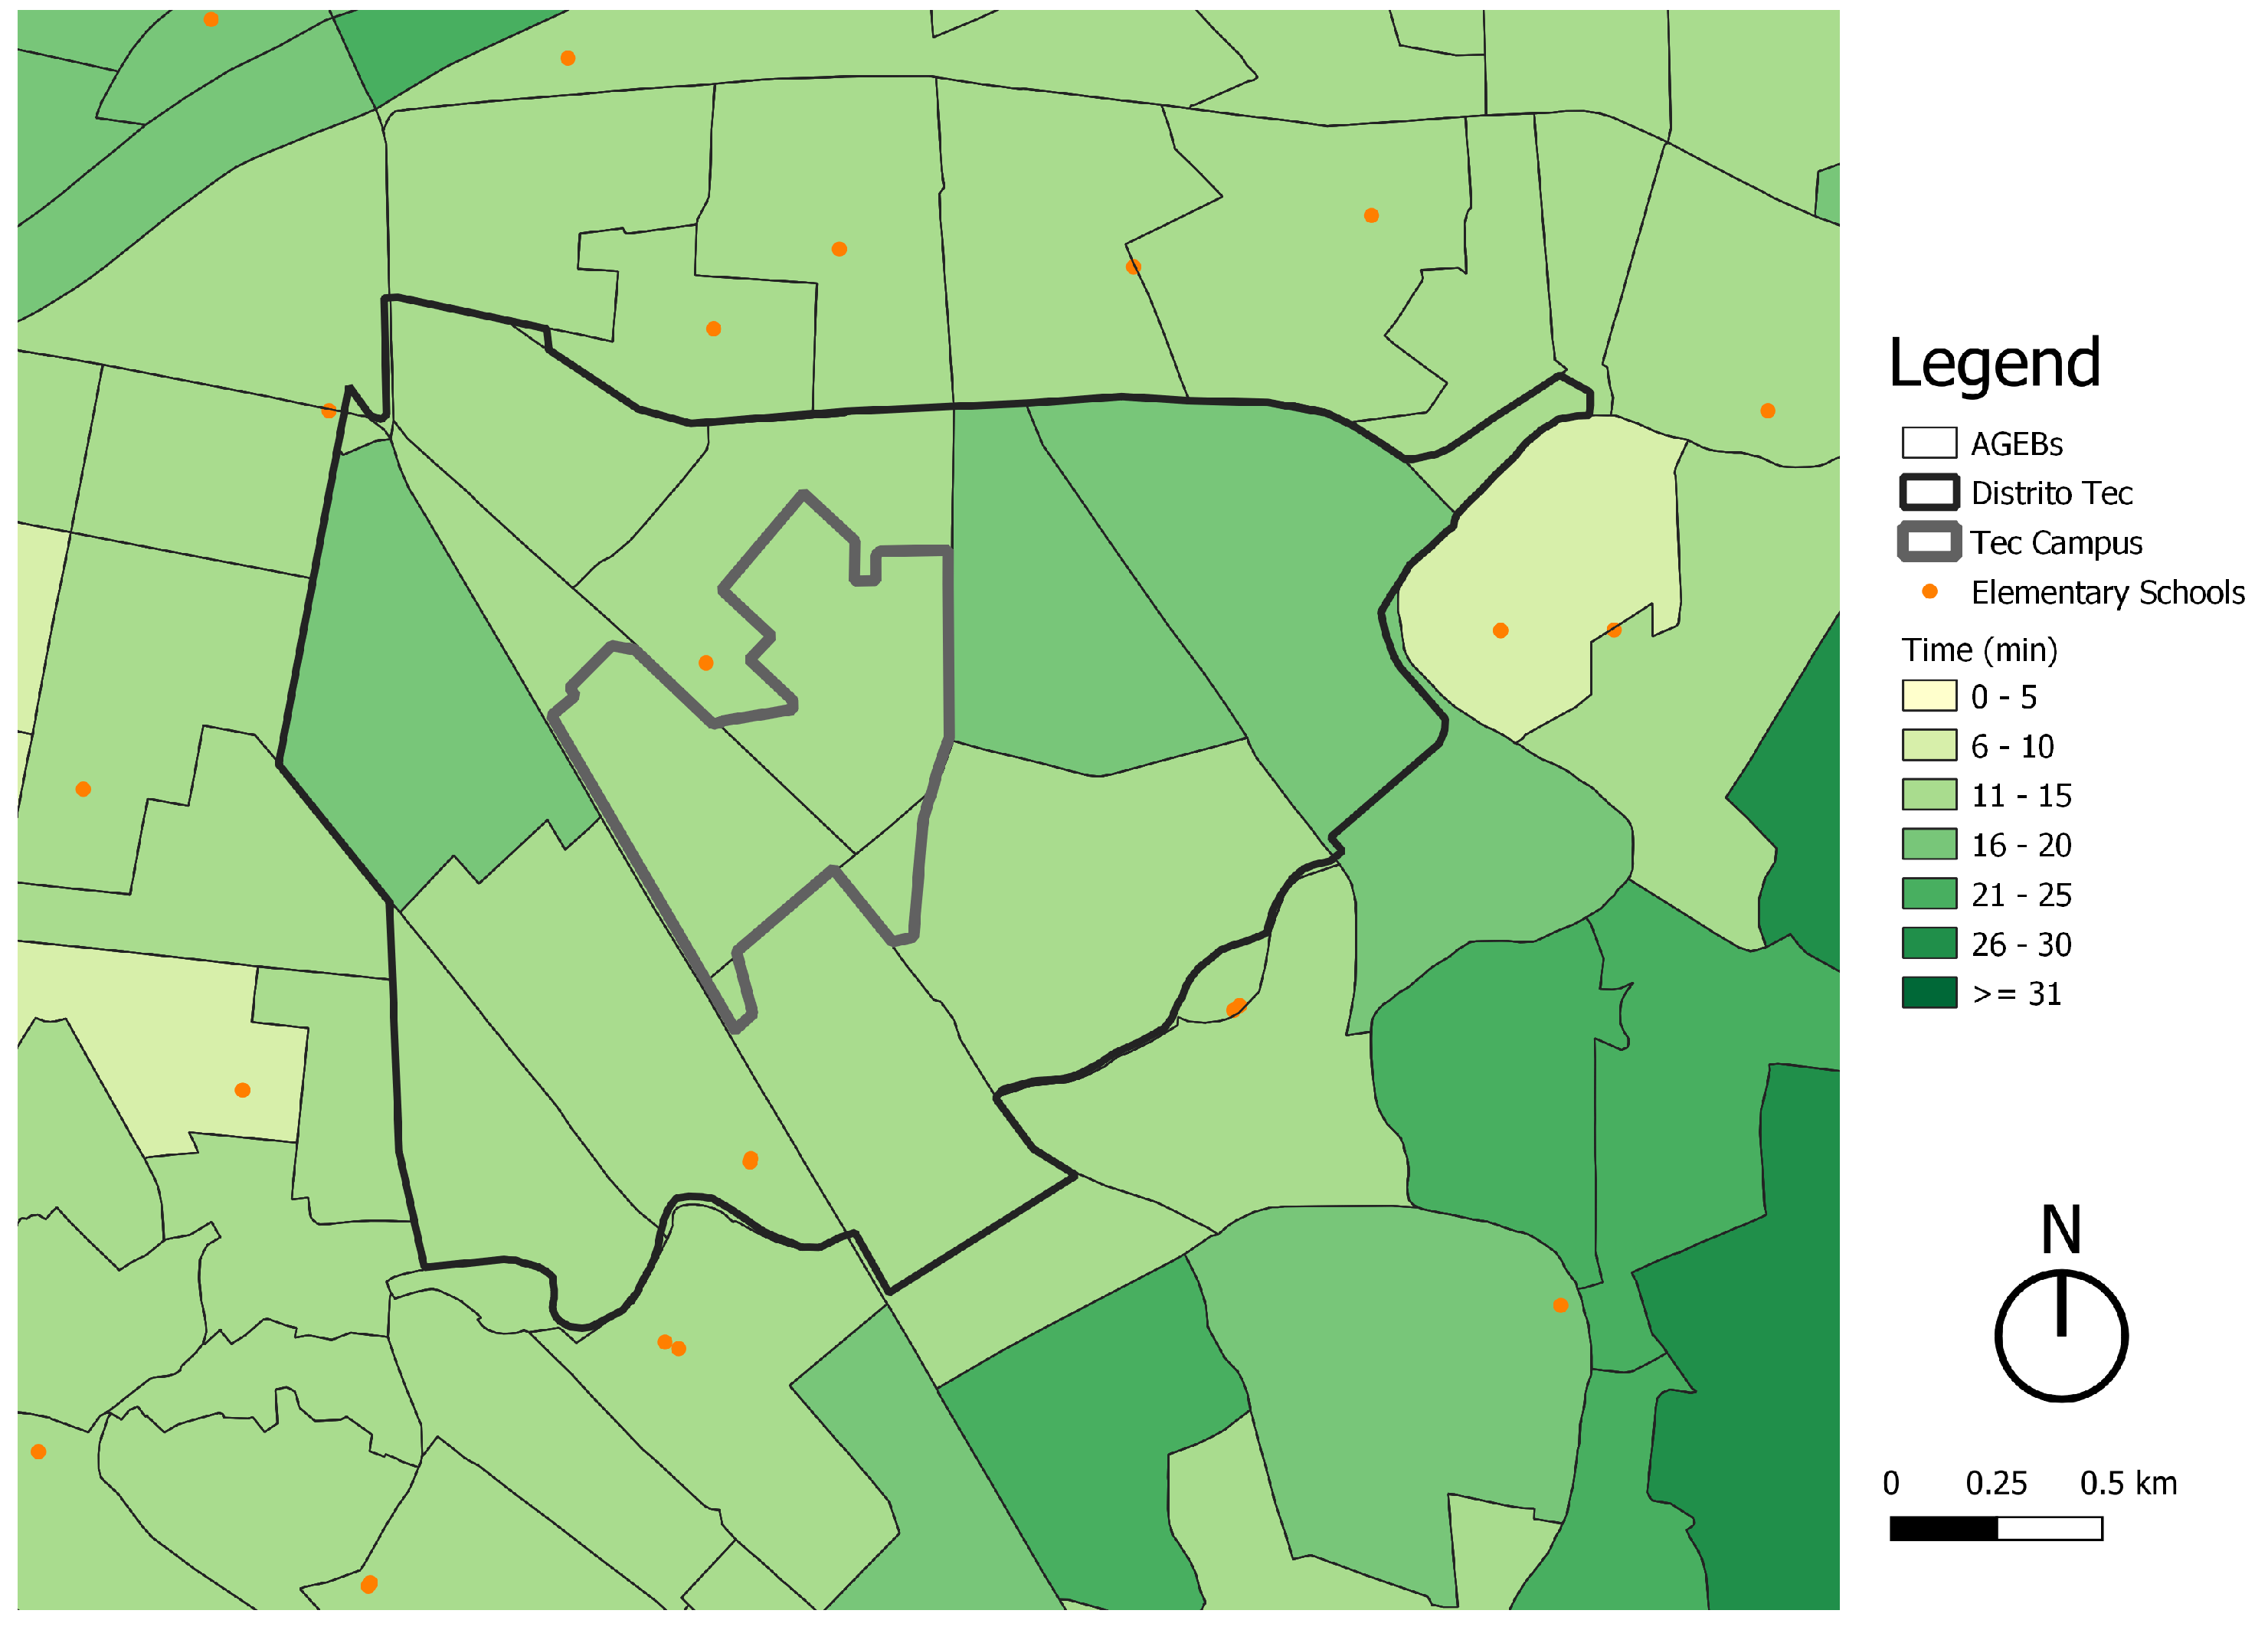
3.2.1. Access to Public Elementary Schools
Elementary schools are usually meant for children aged 5 to 11 years old. Therefore, most of the pupils arrive at schools with their parents or by school bus. When parents bring their kids to school, they tend to trip chain, as they usually continue their commute to work or elsewhere. As a result, public transport and cars represent attractive transport modes for many people. Nevertheless, if the level of access to elementary schools is high enough, such trips could be easily made by walking and, therefore, not relying on motorized transport.
Figure 12 shows that the Stanford District has 14 different public elementary schools within its boundaries. Even though the number is considerably high, most of them are in the northeastern and eastern sides of the polygon. As a result, when considering walking as the transport mode, none of the aggregation areas meets the 15 min parameter. The were 58.23% of the block groups having a medium level of accessibility and the remaining 41.77% a low level (see
Table 9).
Distrito Tec has only two elementary schools (see
Figure 13), but the surrounding areas have a higher density of destinations. Consequently, 72.72% of the aggregation areas within Distrito Tec have a high level of accessibility and the remaining 27.27% a medium one (see
Table 9).
The lack of accessibility in the Stanford District stems from the area being much larger than that of Distrito Tec. It also relates to the methodology for the measurement considering the three closest destinations and not the shortest one. Before arriving at a specific conclusion or intervention to solve such an issue, more research should be conducted, such as evaluating the unit capacity of each elementary school and the demand for them from the local population.
It is also important to mention that, in order to achieve a modal shift from cars to walking, safety plays an important role. Parents greatly value their children’s safety, so if they perceive that walking may be unsafe (because of theft, narrow sidewalks, etc.), they will avoid walking. Therefore, making walkable cities and streets is crucial. Additionally, it is important to mention that complementing commutes with sustainable motorized transport modes such as school buses represents a strong alternative to encourage sustainable mobility for educational commutes.
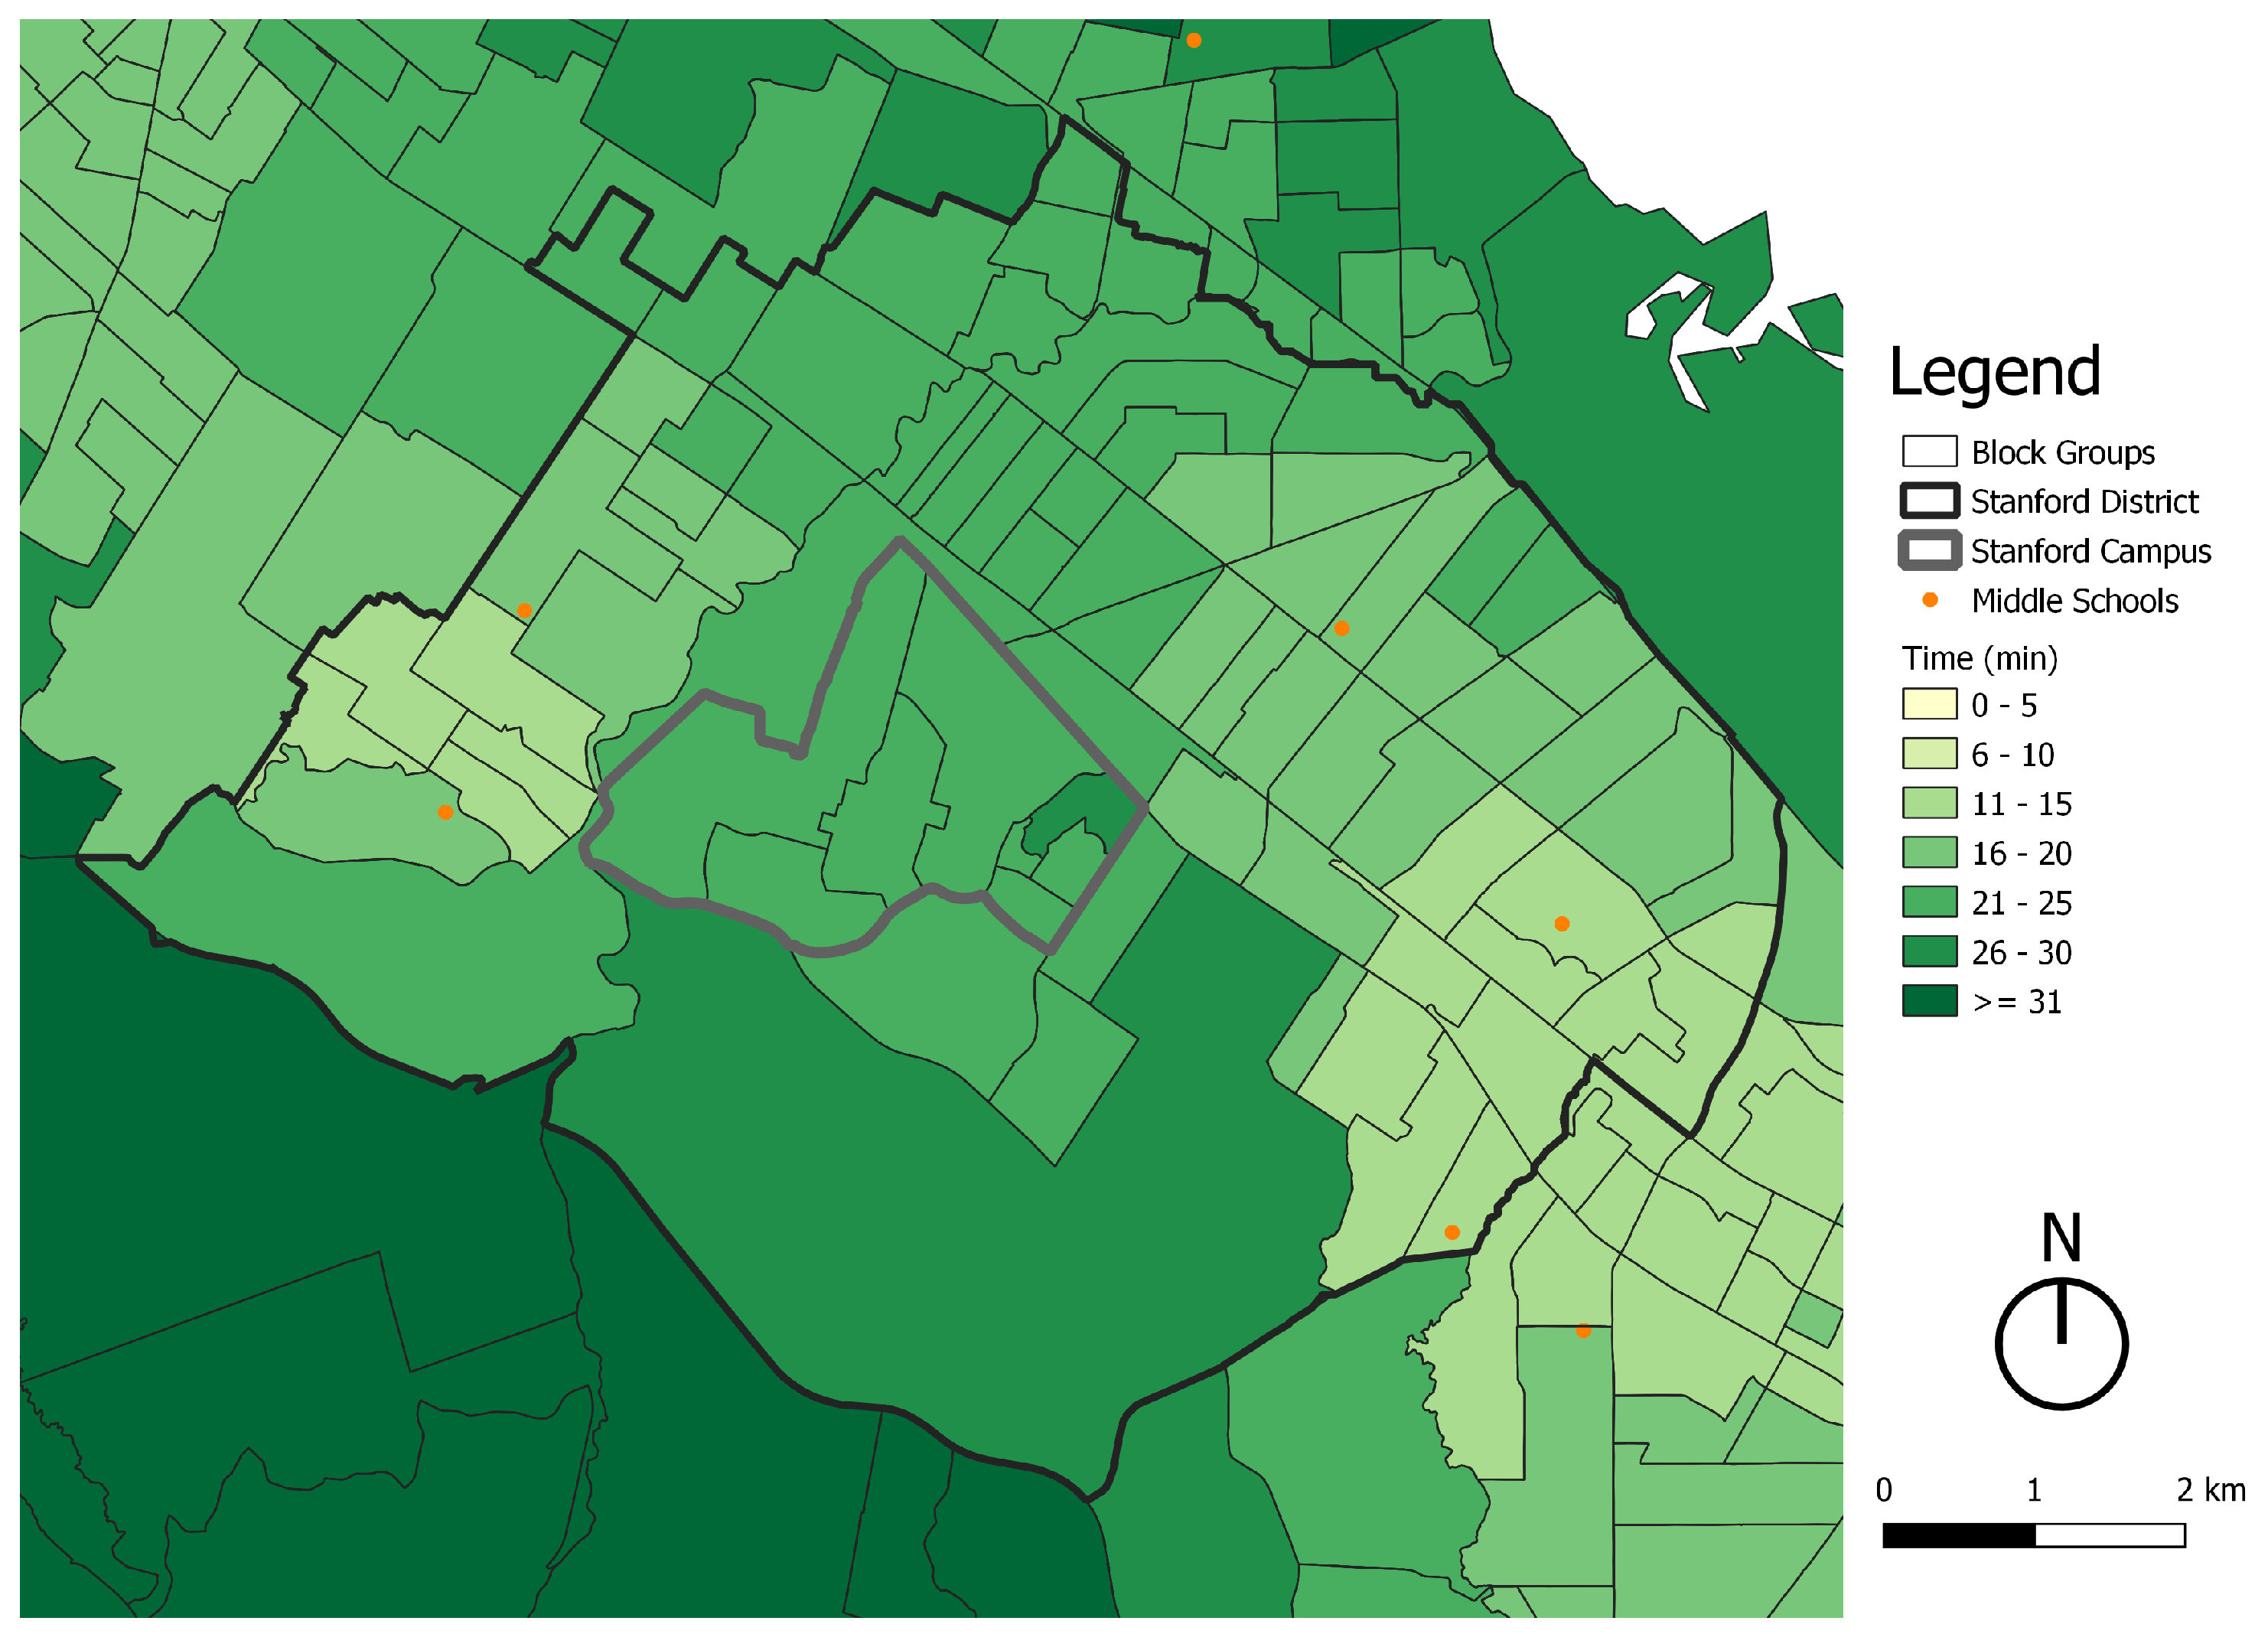
3.2.2. Access to Public Middle Schools
Middle school students’ ages usually vary between 11 and 13 years old. Therefore, in many cases, they are still too young to commute fully by themselves to schools. Hence, their commuting patterns are similar to primary school students, where their parents usually drop them off at school, with a car or with public transport, or they arrive by school bus.
Figure 14 shows the five public middle schools located within the Stanford District. These are located in the eastern and western areas of the polygon. Only 20.25% of the block groups have a high level of accessibility with the remaining 79.75% a medium level (see
Table 10).
Distrito Tec has only two public middle schools (see
Figure 15). However, all the aggregation areas have a high level of accessibility (see
Table 10).
Stanford District clearly has a reduced density of middle schools and, consequently, a lower level of accessibility than Distrito Tec. Once again, before suggesting any interventions, it is necessary to further understand the conditions of both study areas to determine if the demand for such destinations exists. In the case that it does, the destinations should be located in the vicinity of the areas that have a considerable population of children between 11 and 13 years old.
Children between 11 and 13 years old are able to use a bike to commute, but for parents to allow them to do so, street and city safety must be ensured. If the city does not align with people’s perception of safety, other sustainable transport alternatives can be promoted such as school buses.
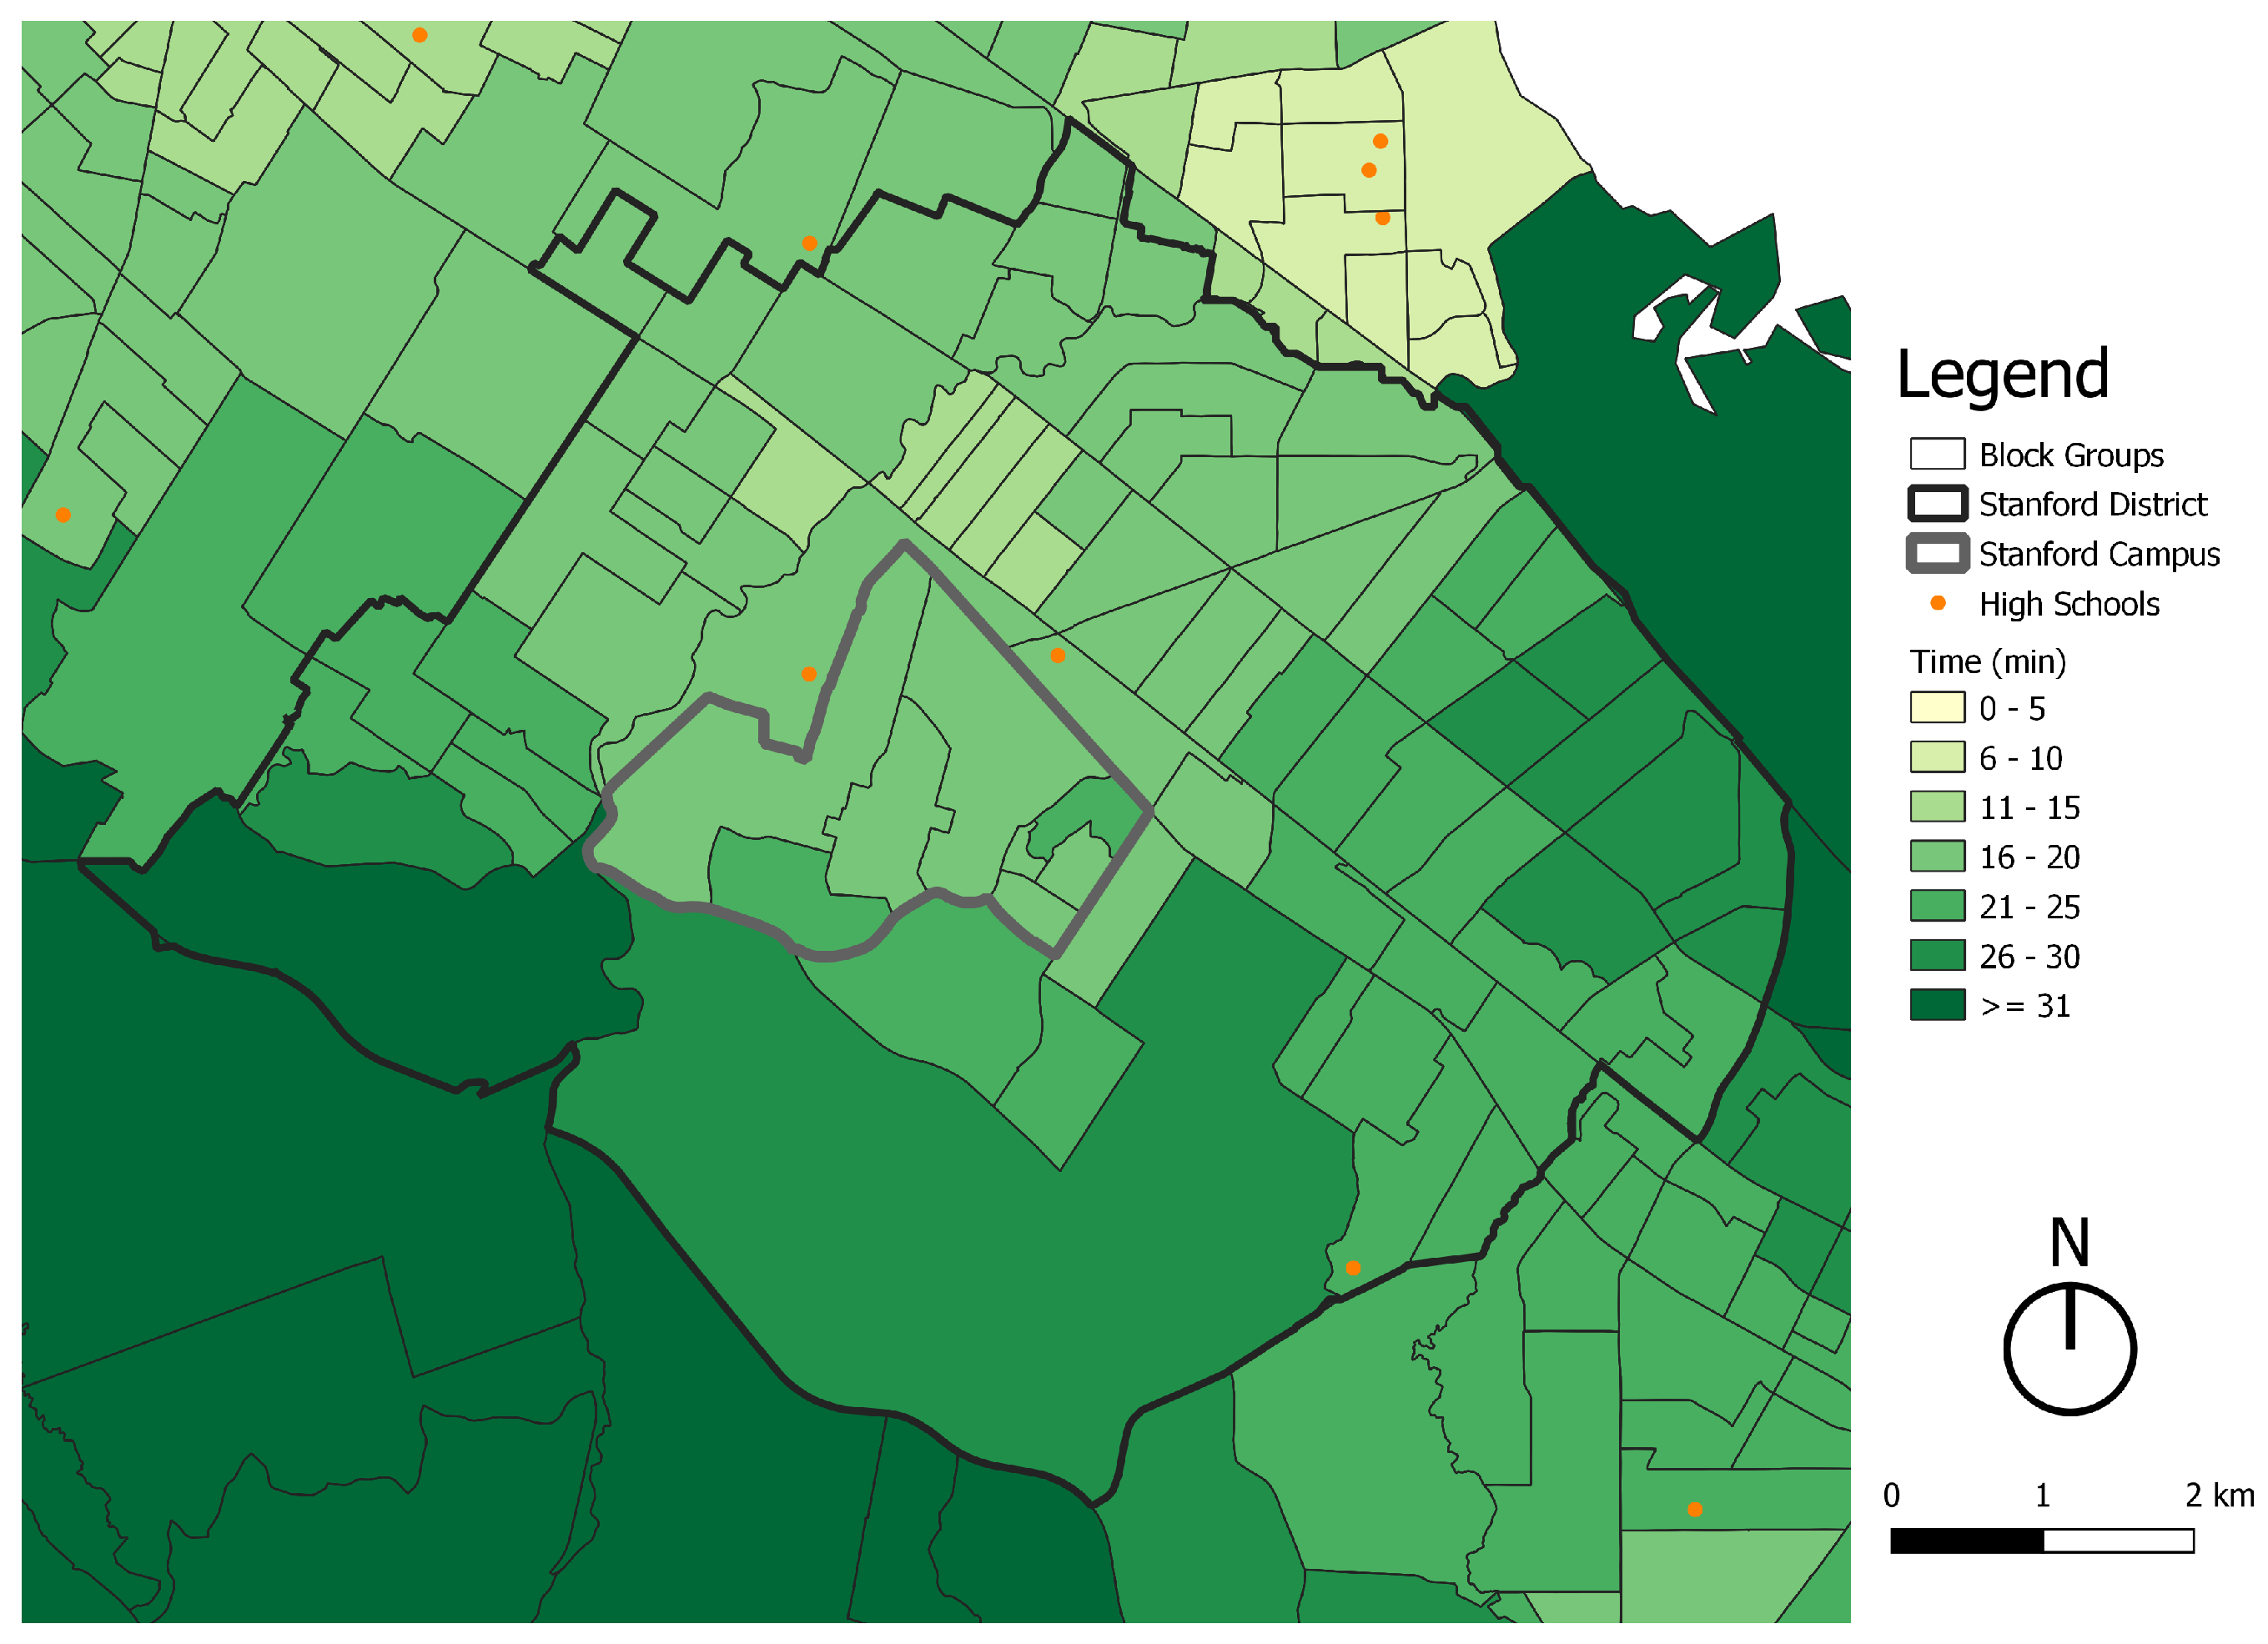
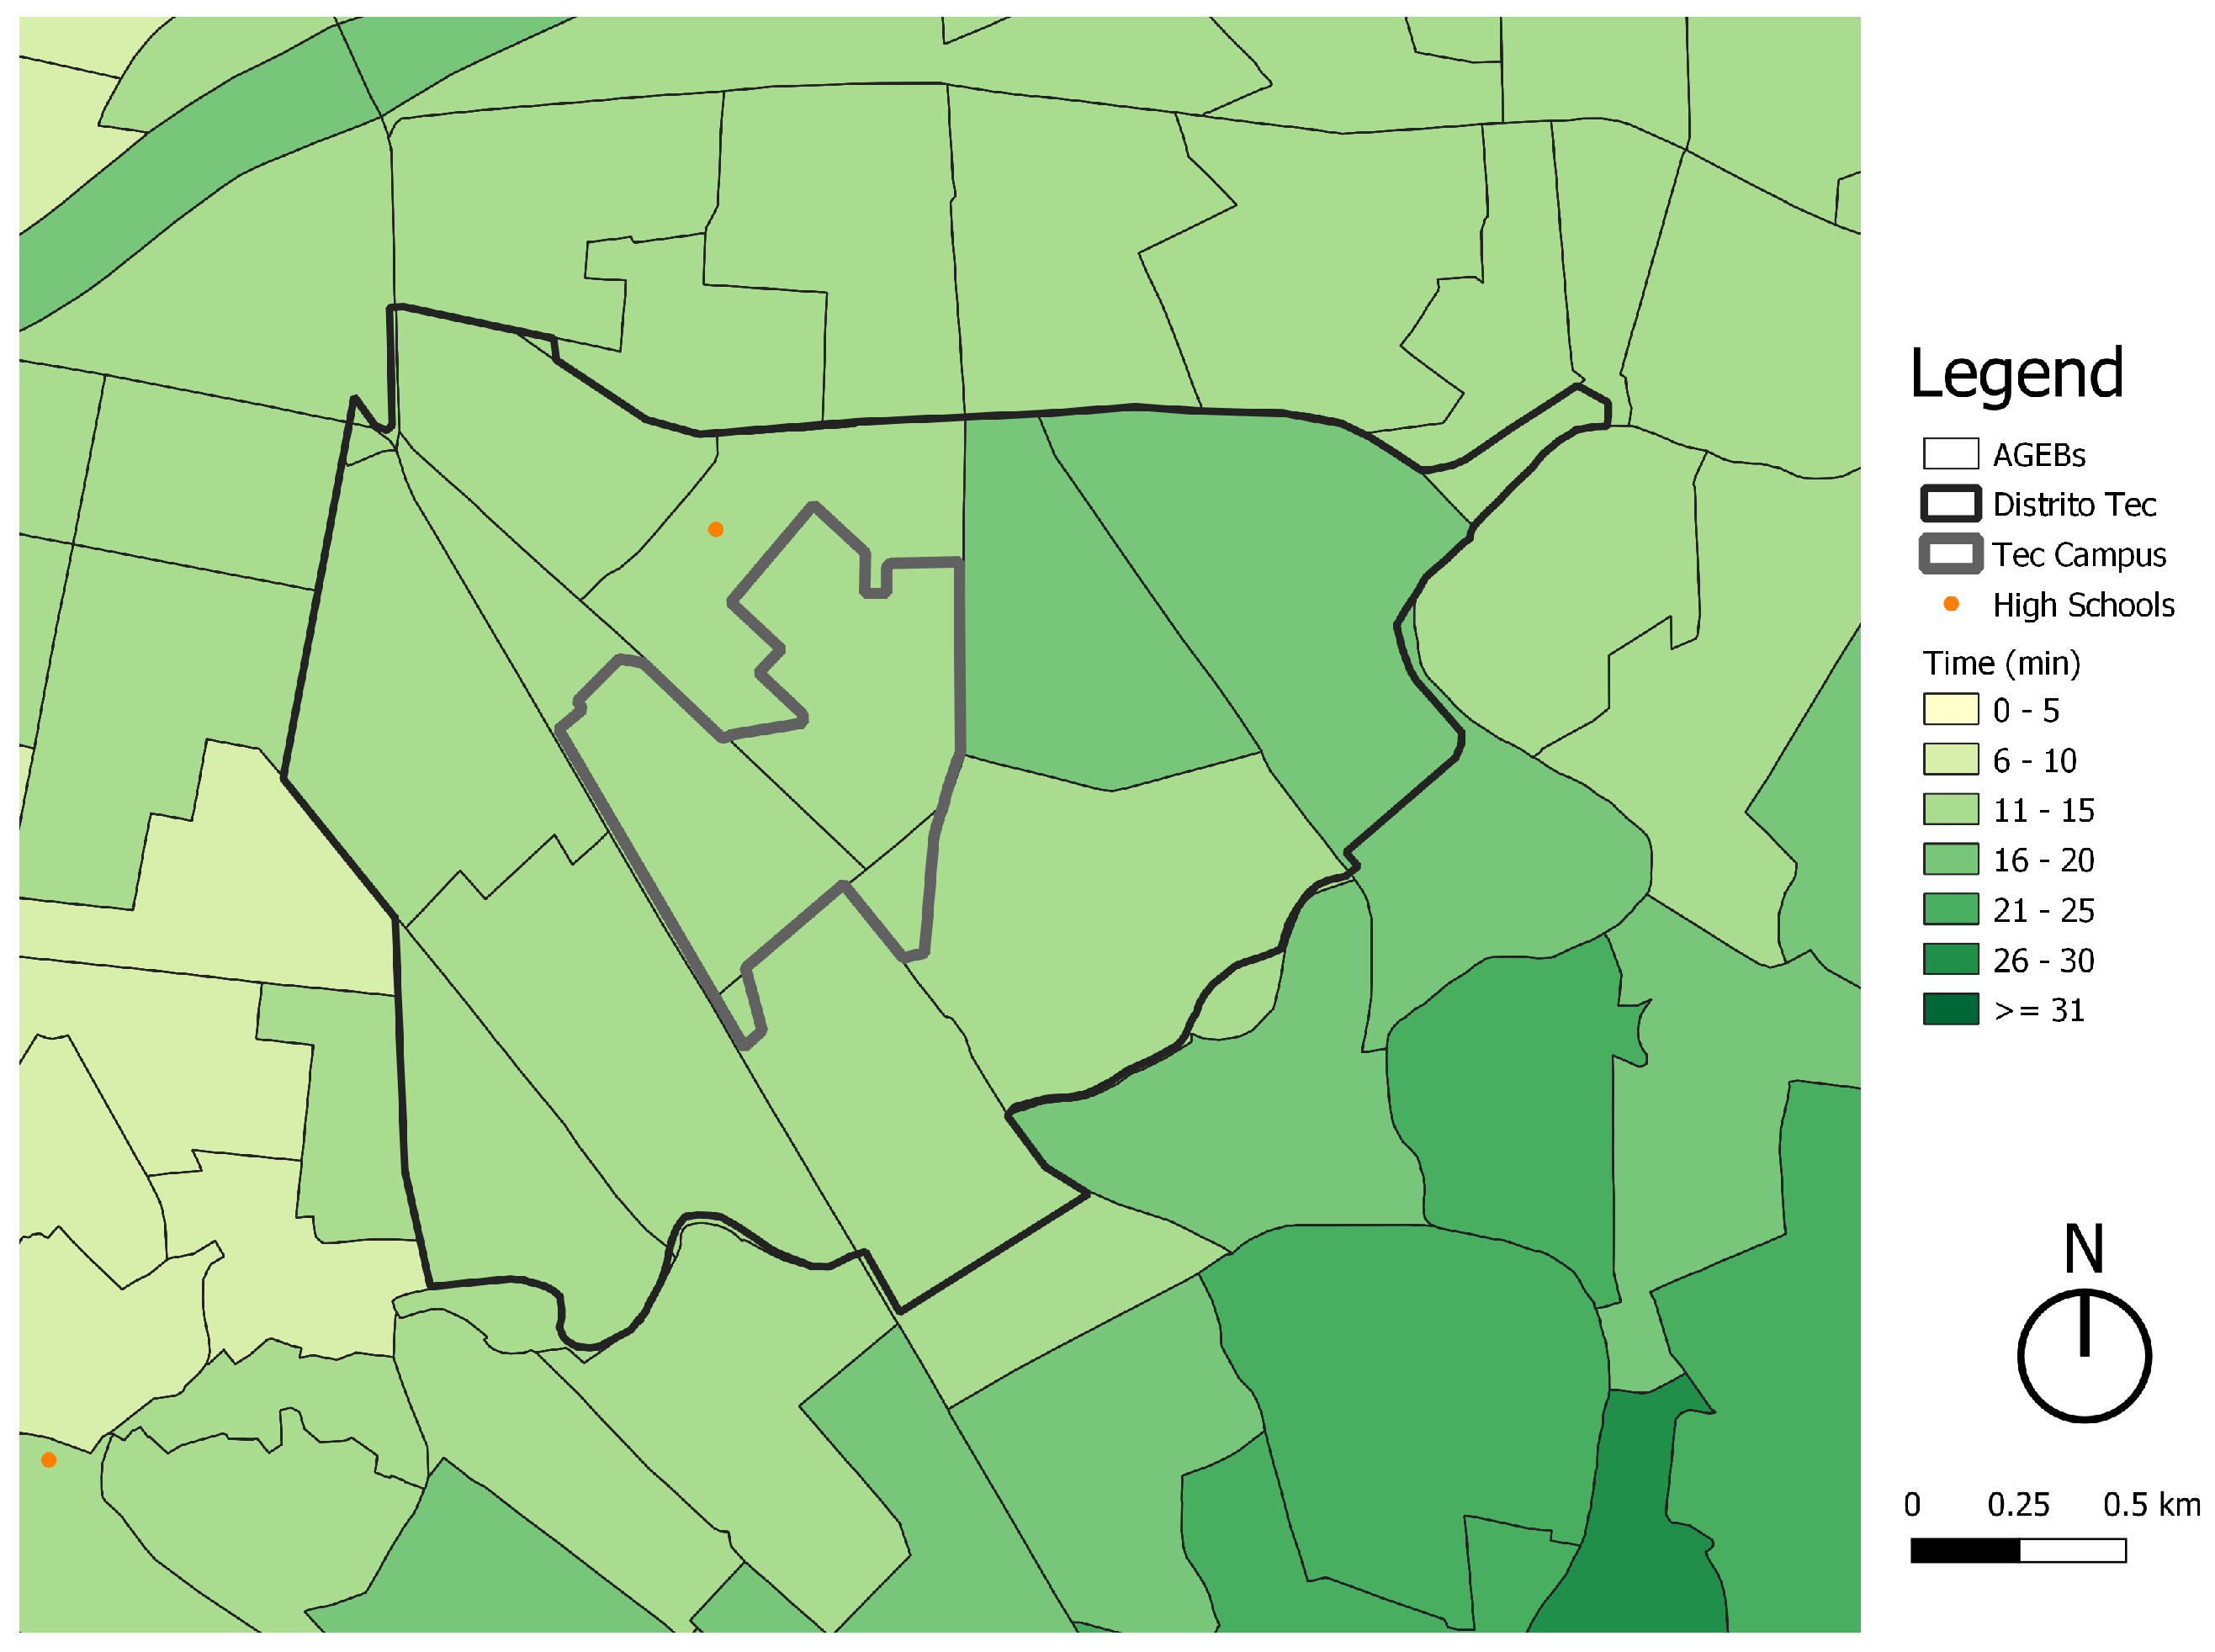
3.2.3. Access to Public High Schools
Unlike students from elementary and middle schools, the ones attending high schools are much more independent concerning their mobility (14 to 18 years old). As a result, they do not rely as heavily on other persons assisting them to go to school (such as their parents), so walking or cycling to schools stand as very attractive mobility alternatives. Both modes of transport can also be easily complemented with school buses or public transport if the commutes are long.
Figure 16 shows the number of public high schools within the Stanford District. Immediately, it can be noticed that the density is very low, with only three destinations inside the district, two located at the center and one at the eastern corner. Consequently, only 7.59% of the aggregation areas have high accessibility levels, 91.14% medium levels, and 1.27% low levels (see
Table 11).
Figure 17 shows that like in the Stanford District, in Distrito Tec, there is an extremely low density of public high schools, with only one destination available within the area. Nevertheless, 81.81% of the aggregation areas have a high level of accessibility and the remaining 18.18% a medium level (see
Table 11).
It is clear that the density of high schools for both areas is very low, and thus, there is a significant reduction in accessibility levels. Nevertheless, exactly as in the previous cases, it would be necessary to further assess the demand for such destinations to determine whether an increase in their density is required.
To promote the use of bicycles by students, it is important to have safe streets, as well as parking spaces for bicycles at schools. For students with longer commutes, sustainable transport modes such as school buses or public transport can be used.
3.3. Access to Parks
According to Jordi Borja, the “public space is the city” [
38], public spaces are where relationships between citizens, power structures, and citizenship materialize. Therefore, public spaces play a key role in building communities.
In social terms, public spaces, including streets, parks, plazas, etc., have an important social cohesion function as these are places where individuals meet and where culture and collective expression are fostered [
39]. Therefore, a city that lacks quality public spaces threatens one of its crucial functions: being a liveable space.
In the environmental dimension of sustainability, public spaces provide a crucial ecological service to cities. Parks bring nature back to cities, helping reduce the creation of microclimates and improve the air quality of the area, as well as facilitating rainwater permeation underground and filling natural water deposits.
Consequently, access to high-quality public spaces, such as parks, should be one of the priorities on the urban agenda. Nevertheless, historically, many cities have had a lack of investment in such spaces, and many urban morphologies and typologies have prioritized private space over public space.
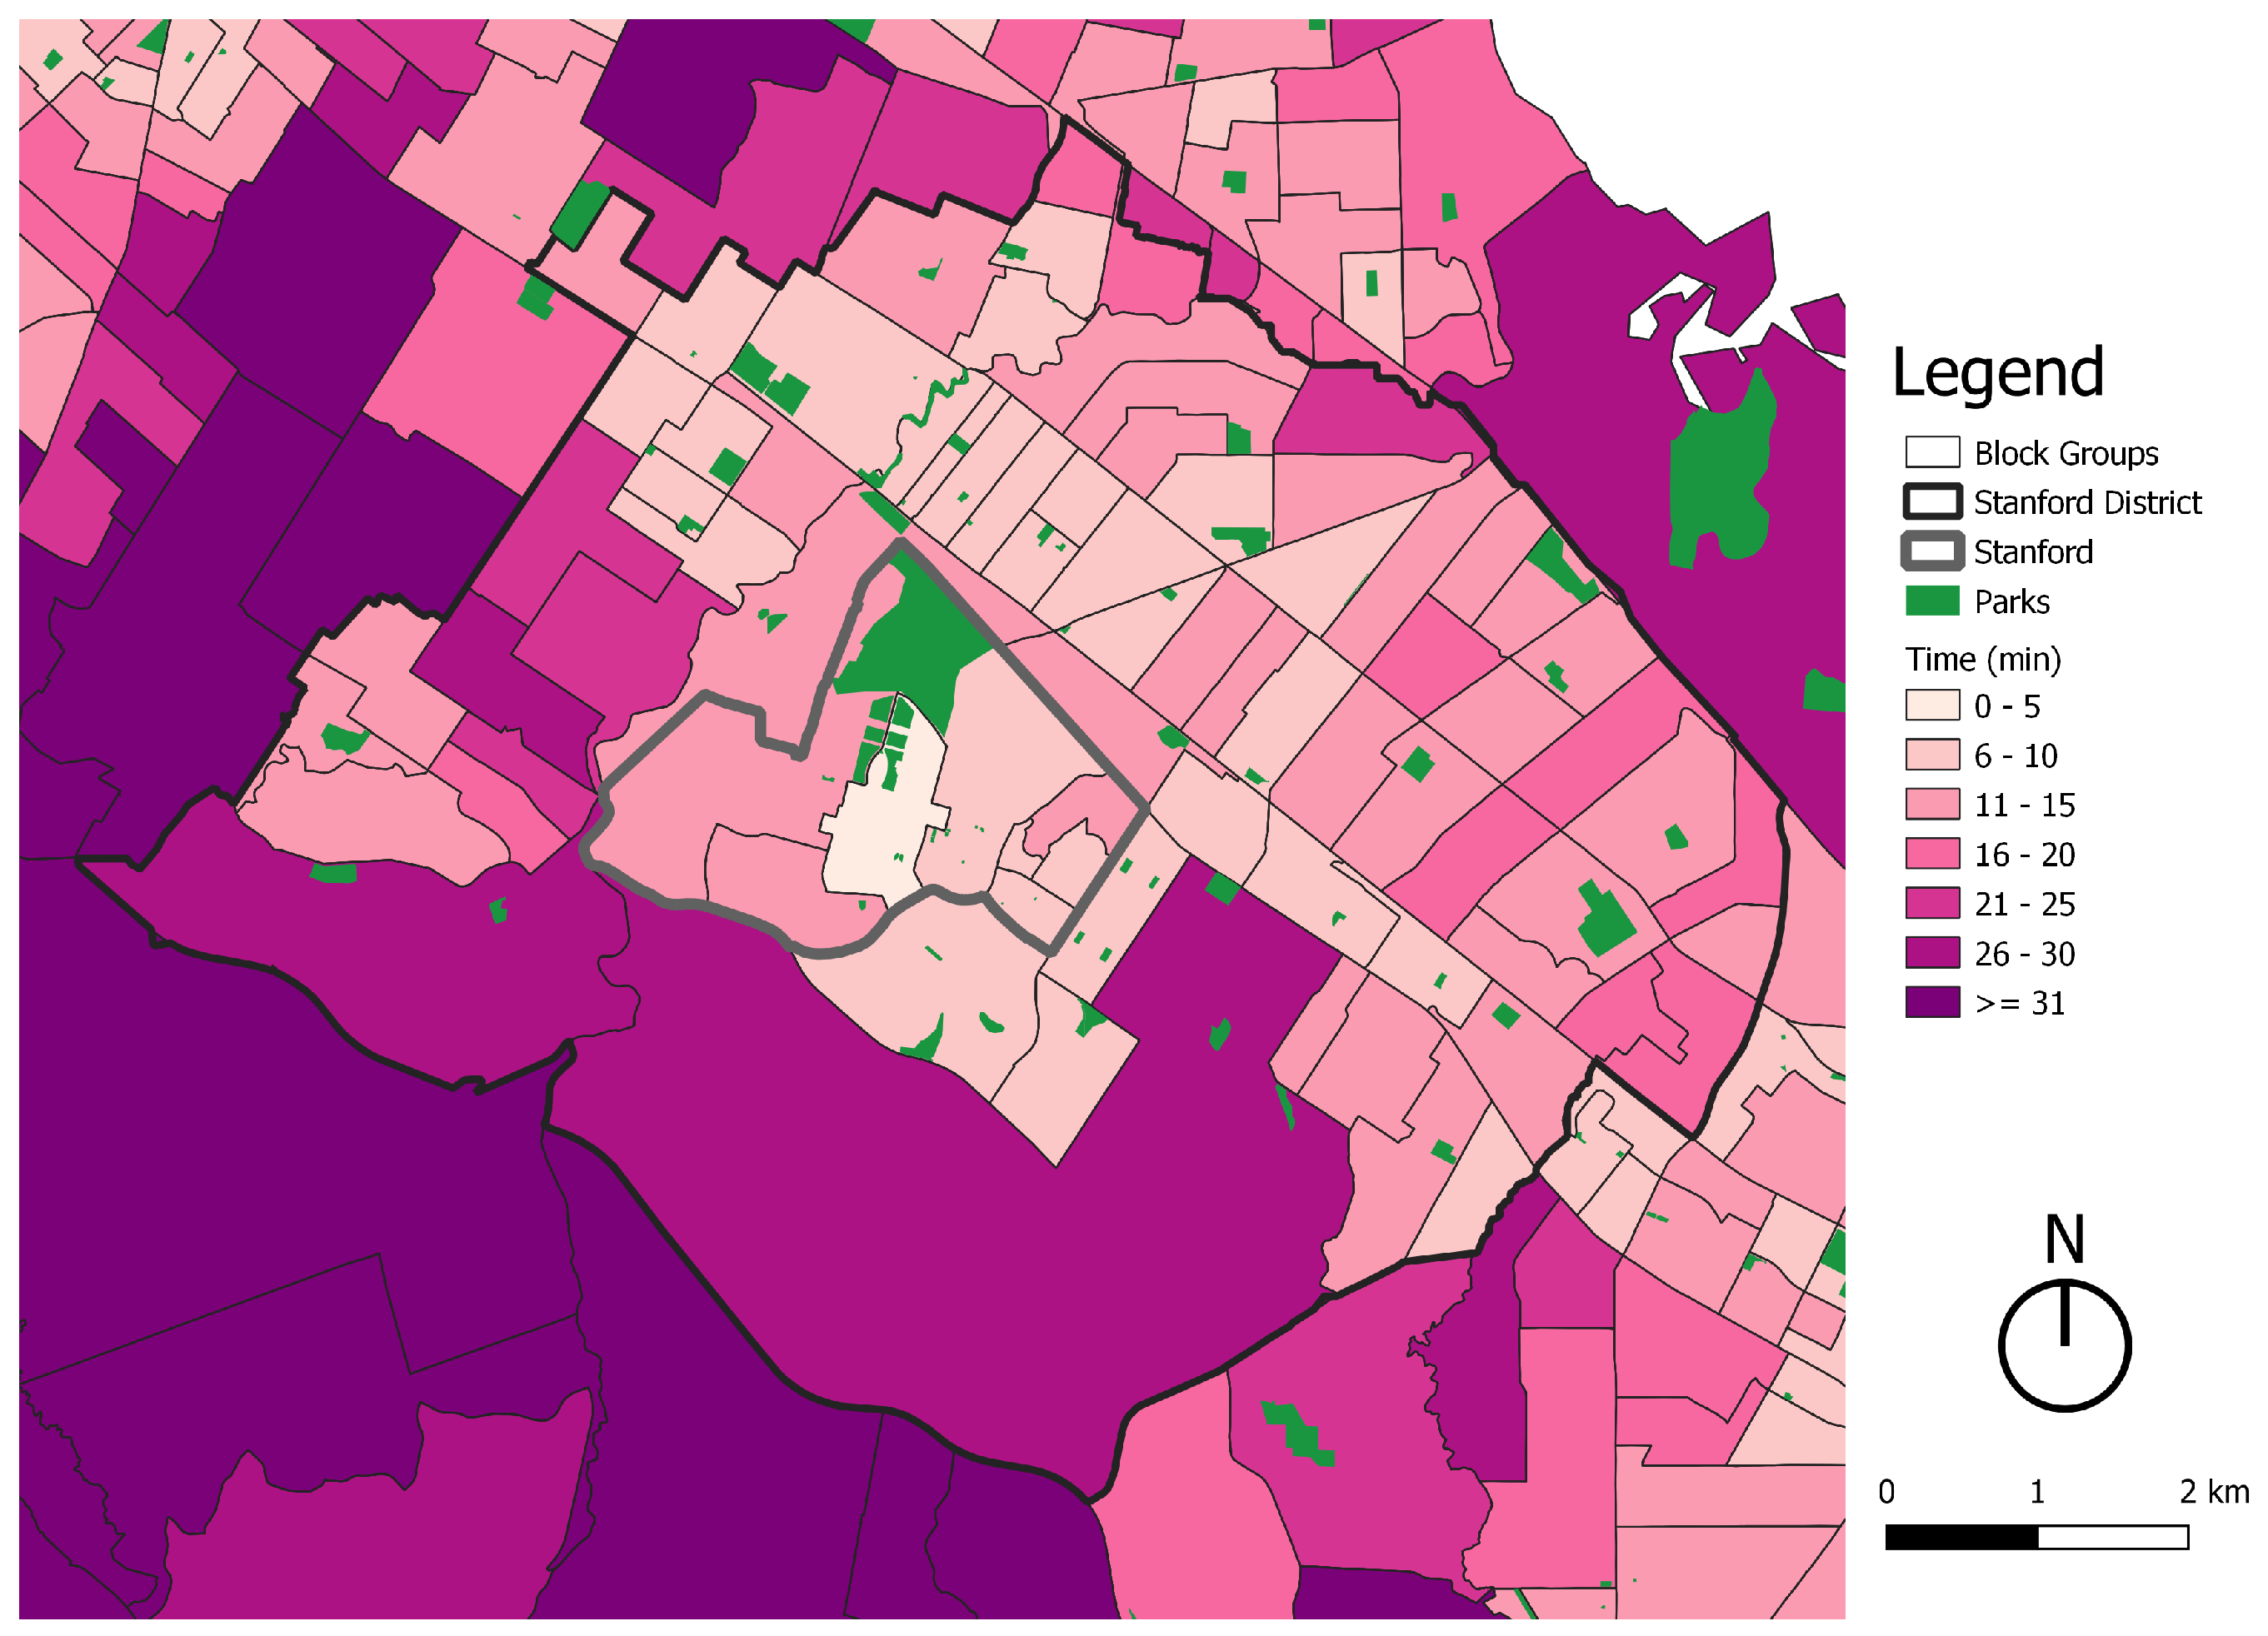
Figure 18 shows the parks within the Stanford District. The vast number of parks are located throughout the entire area, excluding the south. As a result, most of the aggregation areas (79.75%) comfortably meet the 15 min time parameter, and the remaining 20.25% have a medium level of accessibility (see
Table 12).
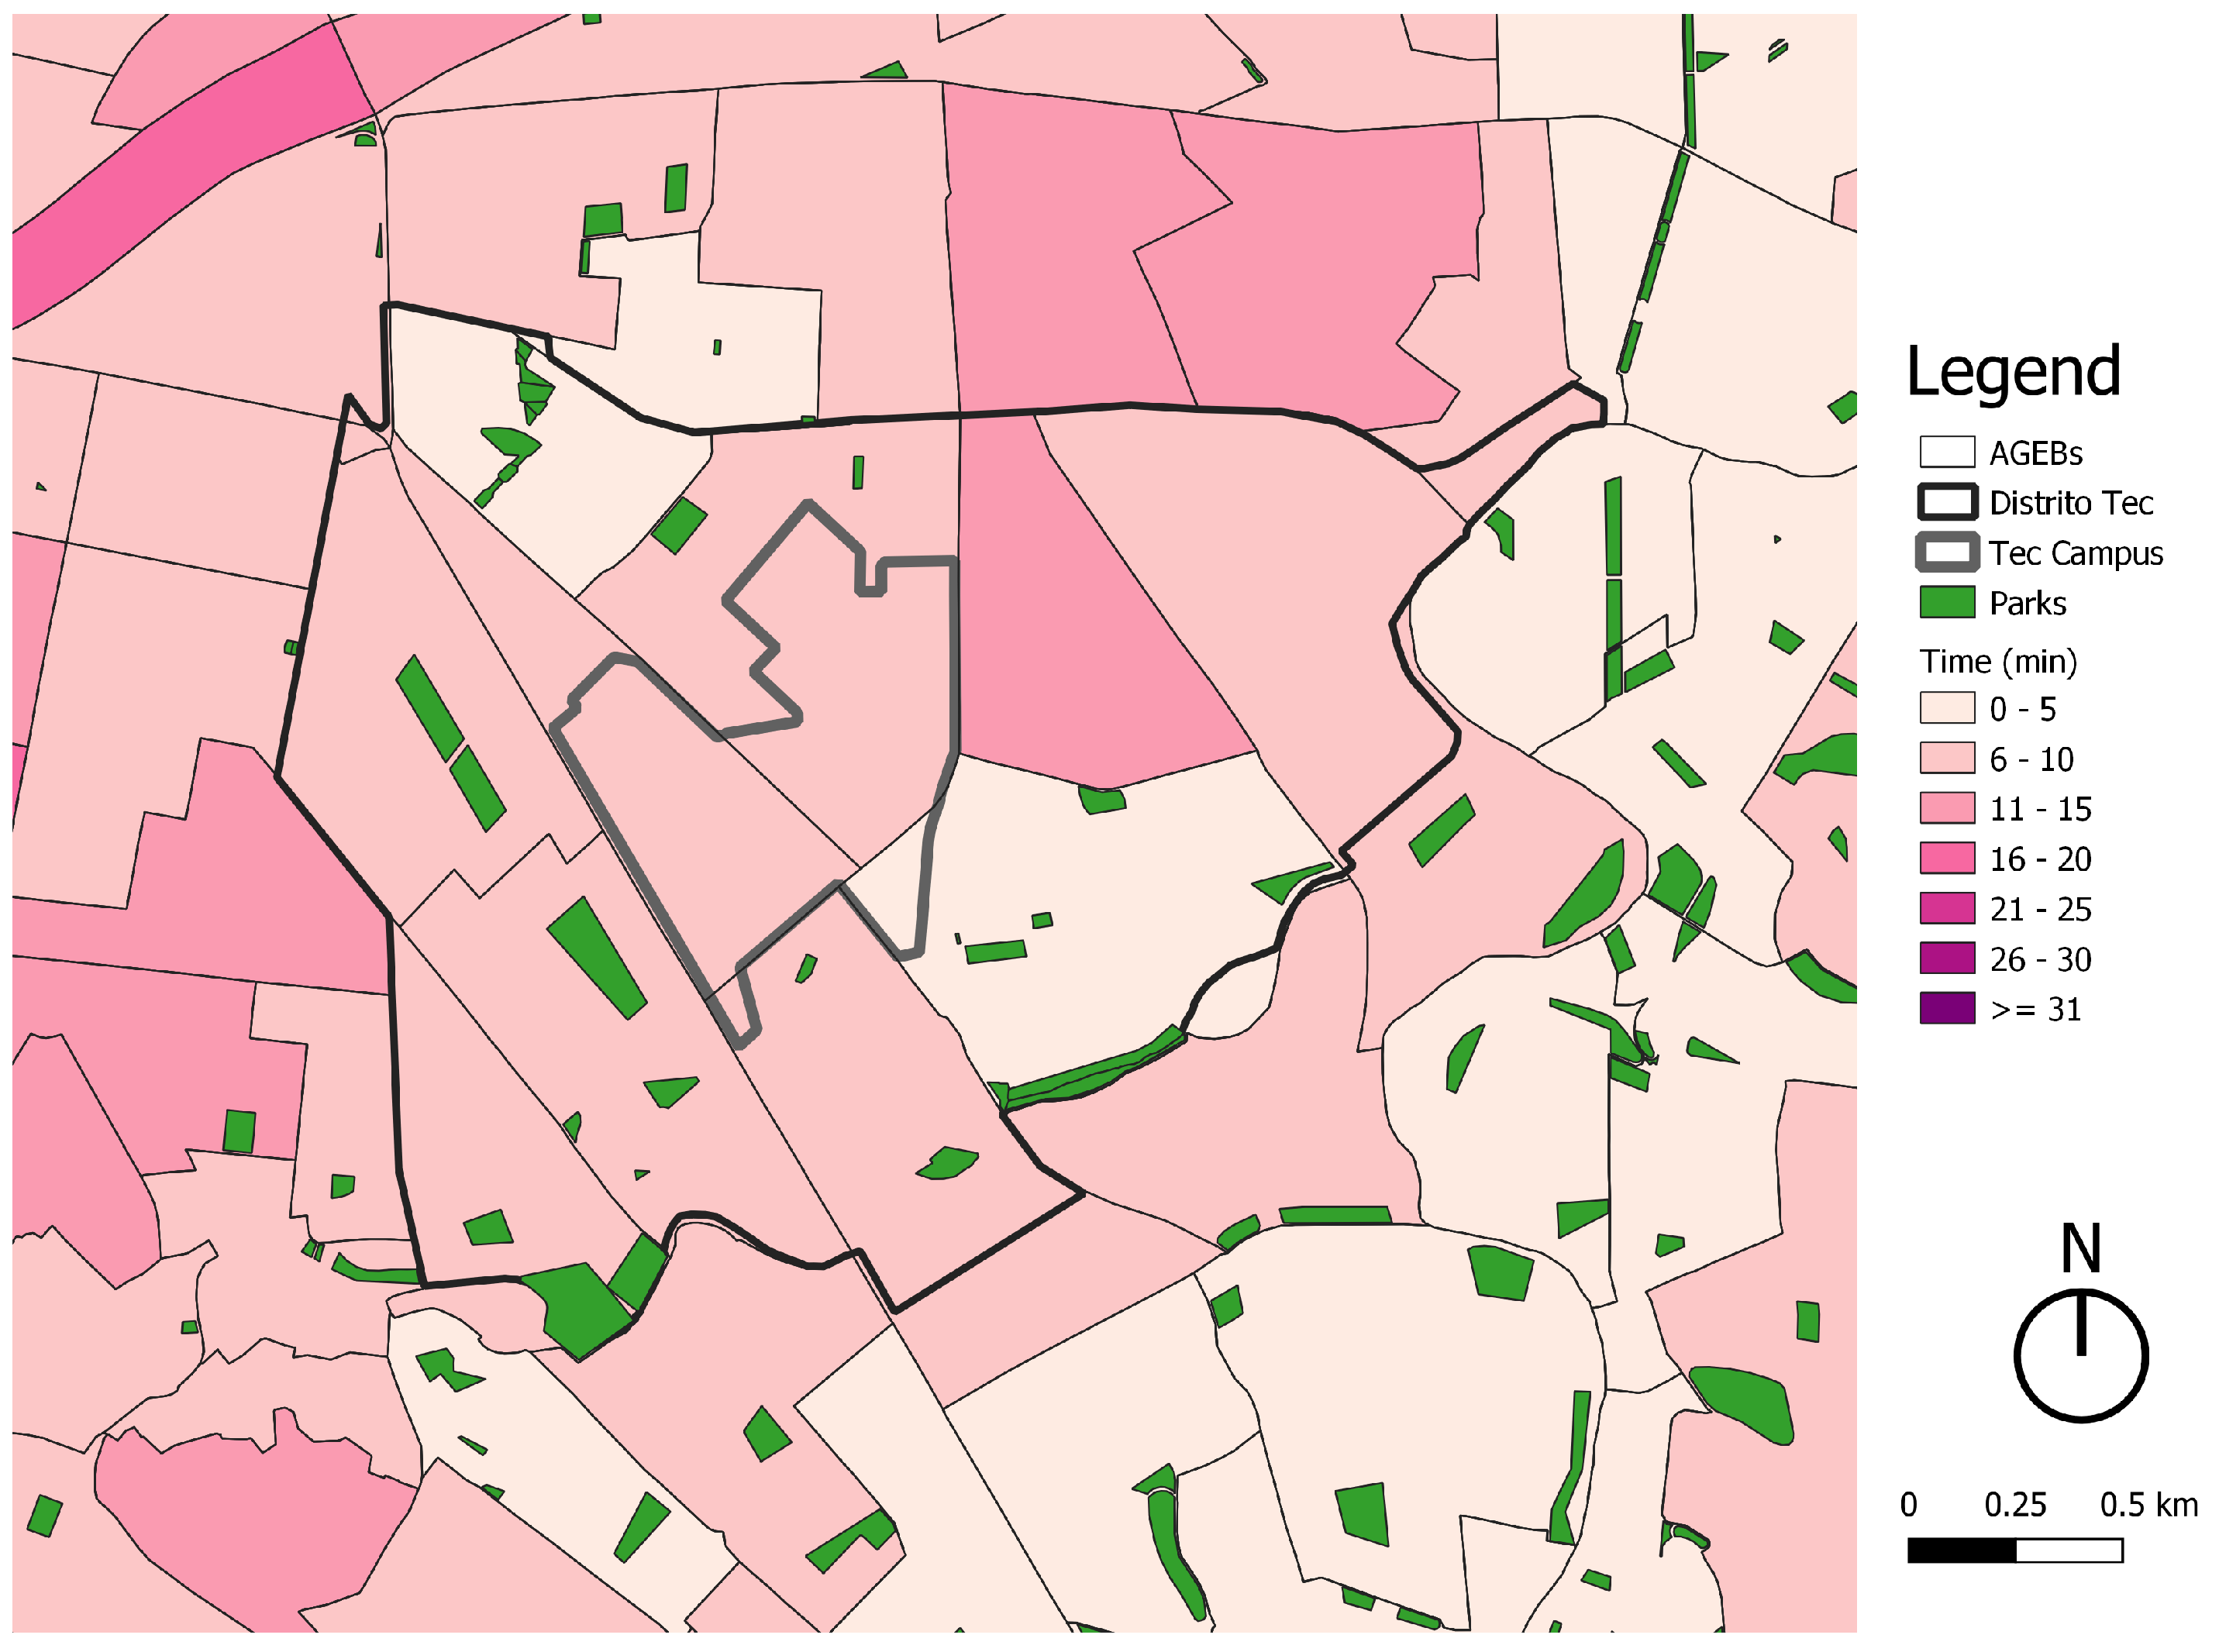
Figure 19 shows the parks within Distrito Tec. Most of them are located in the north, west, and south of the polygon, leaving the east with few destinations, as well as the center. It is important to note that the ITESM does have many green areas, but they are not mapped because they are not public nor accessible to everyone. Despite this, Distrito Tec has a very high level of access to parks with all its aggregation areas meeting the 15 min parameter (see
Table 12).
Unlike many other areas in the MMA and SFBA, both study areas are privileged in terms of access to parks. As a result, even if people decide to walk, for most of the areas of both districts, people can visit and enjoy a park in less than 15 min travel time. Nevertheless, just because parks are easy to access does not necessarily mean people are going to use them. In both study areas, many houses have gardens; hence, parks need to offer very-high-quality spaces and a variety of activities (such as cultural events, commerce, and other complementing activities) in order to be attractive to the local population.
3.4. Access to Public Hospitals
The COVID-19 pandemic has been an important reminder of the importance of having a well-structured public health system. Unfortunately, many cities have failed to establish a robust, accessible public health system, resulting in access disparities to such destinations [
39].
As most health infrastructure tends to be expensive to build and maintain, traditional planning has focused on creating high-capacity health facilities in certain areas of the city. Consequently, commutes to hospitals are usually long for patients and hospital workers that do not live nearby. Additionally, many people that visit hospitals have disabilities and rely on private motorized transport modes.
It is important to mention that, in both study areas, it is common that many people that work in or visit hospitals use private motorized vehicles to get there. Nevertheless, infrastructure should not be designed around those users, but for people that commute using sustainable modes of transport such as public transport, bicycles, or walking.
This section will analyze how both study areas perform in terms of access to hospitals, considering general public Hospitals in Distrito Tec and non-profit general acute care hospitals and primary care clinics in the Stanford District.
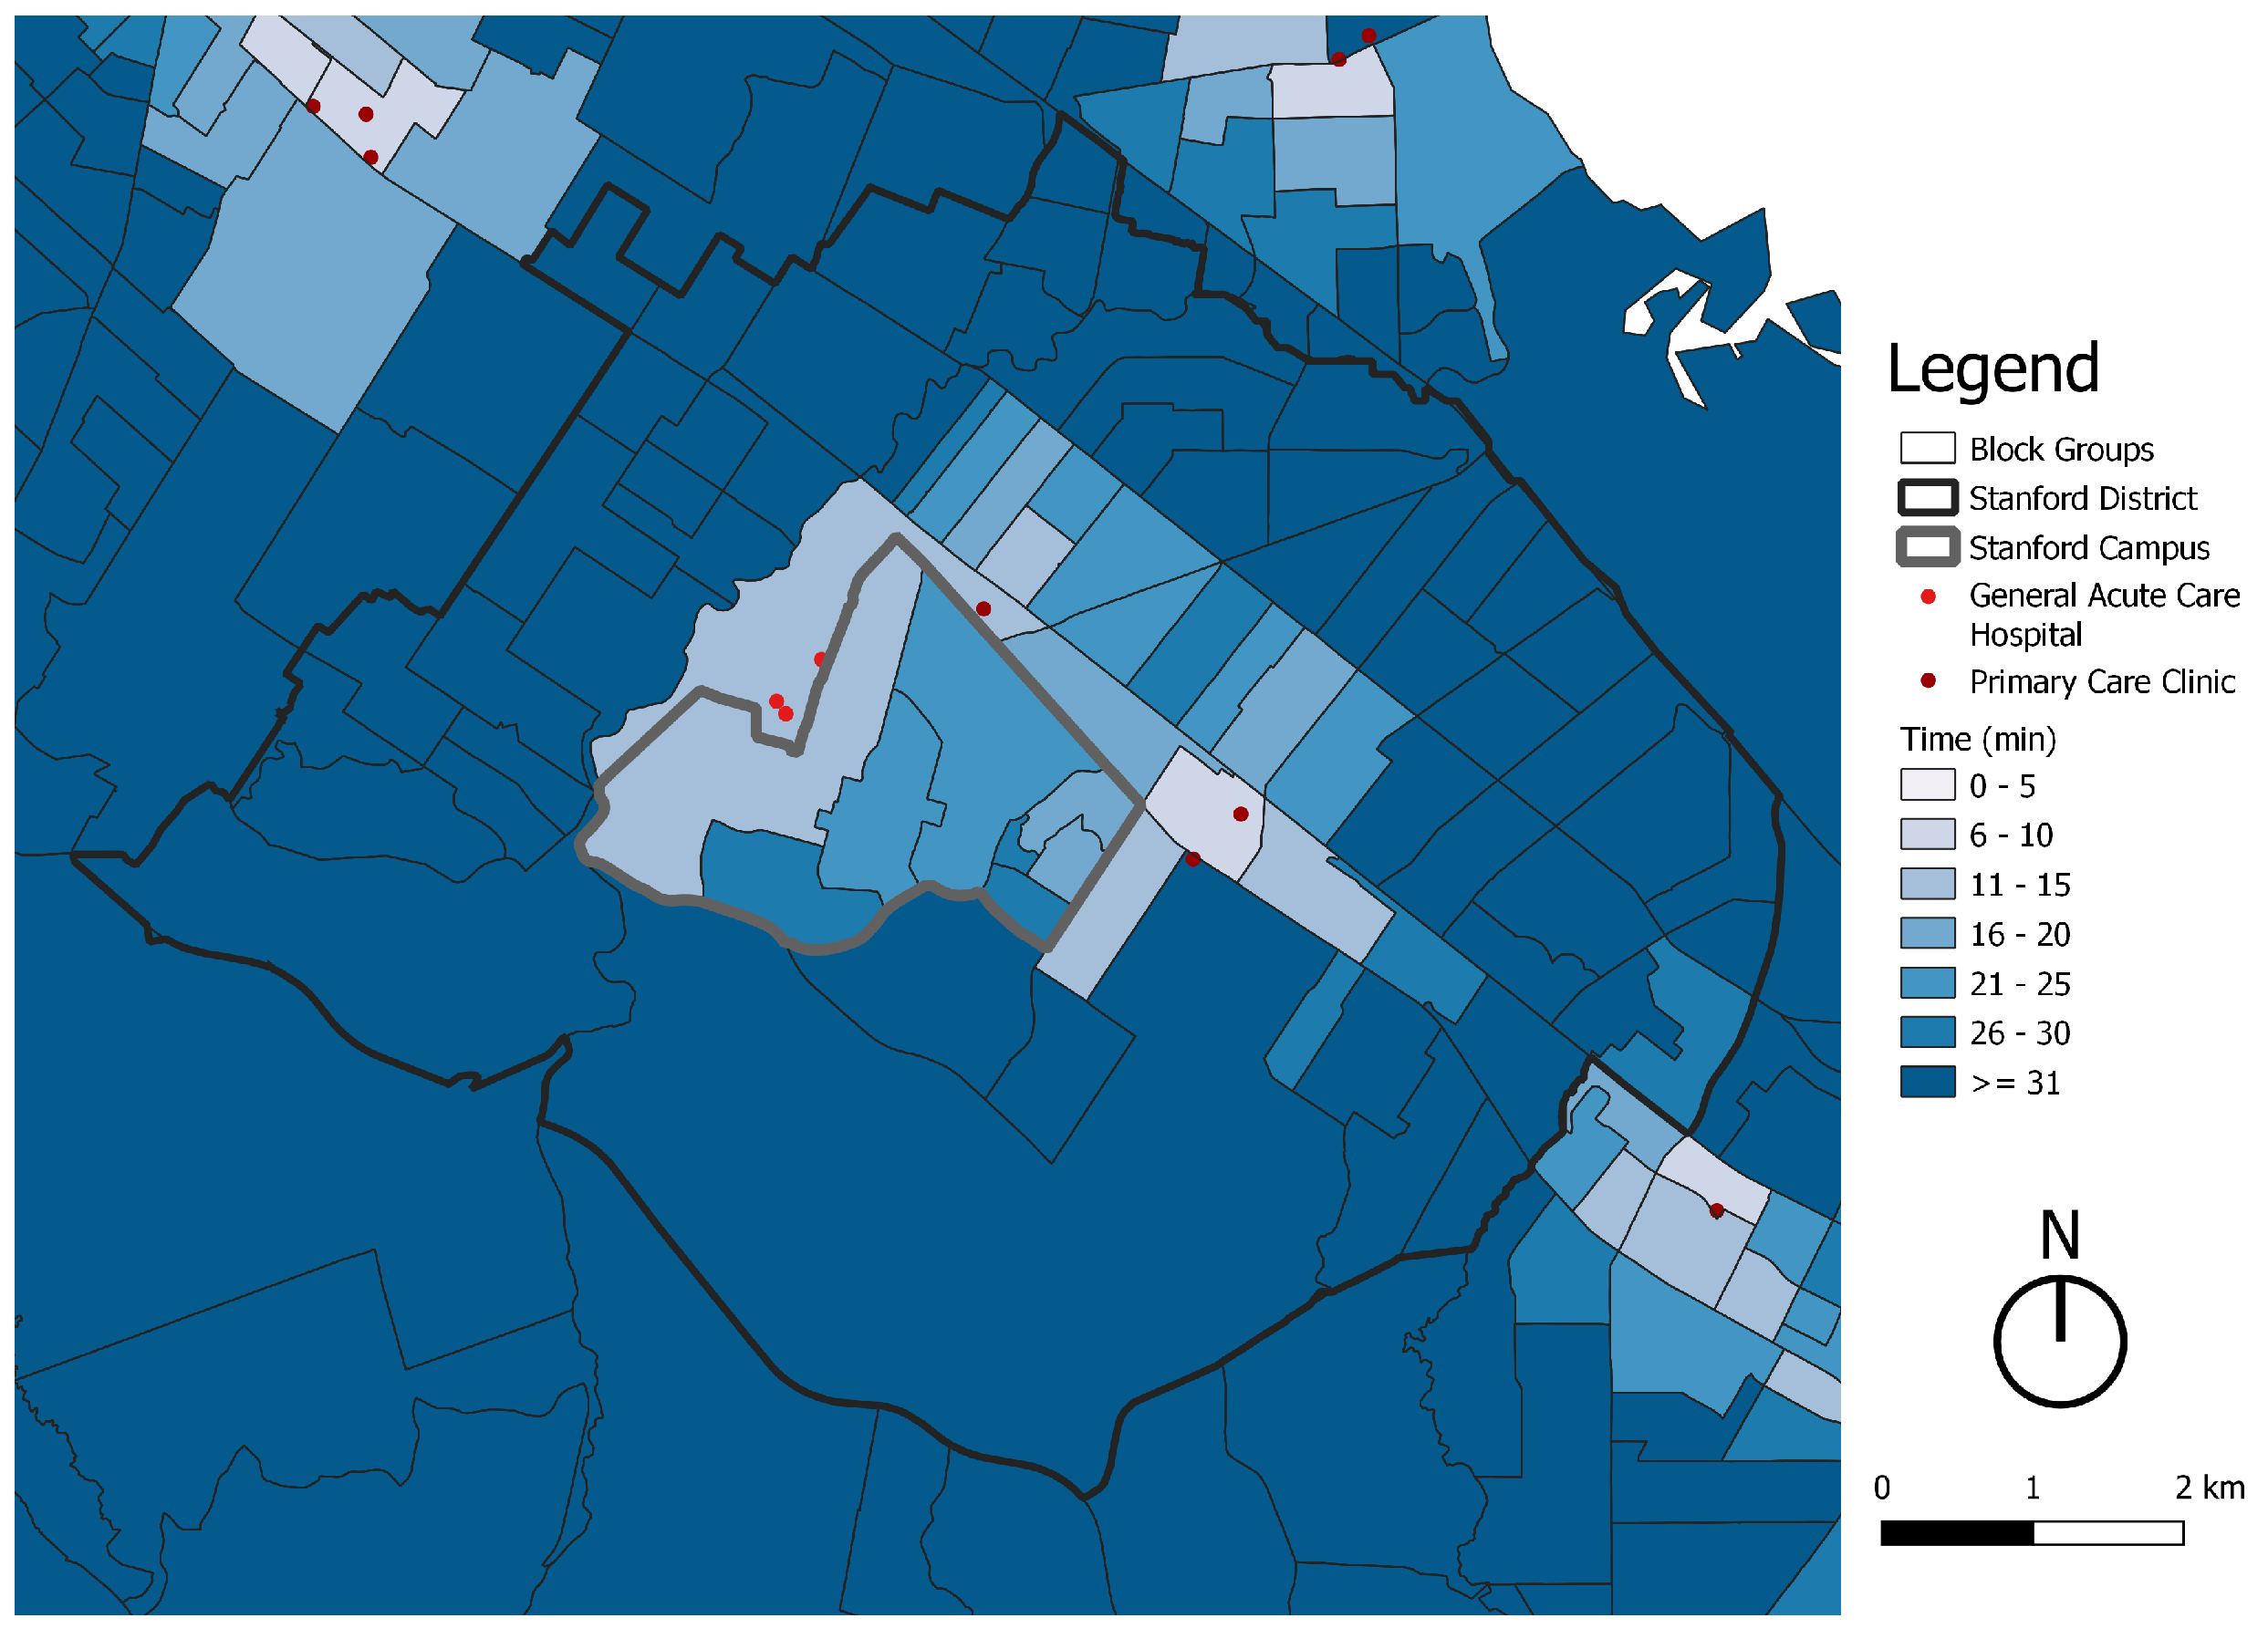
Figure 20 shows the location of public general acute care hospitals and public primary care clinics in the Stanford District. There are six destinations, all concentrated in the center of the polygon. Consequently, only 7.59% of the aggregation areas have a high level of accessibility, 26.58% medium, and 65.82% low (see
Table 13).
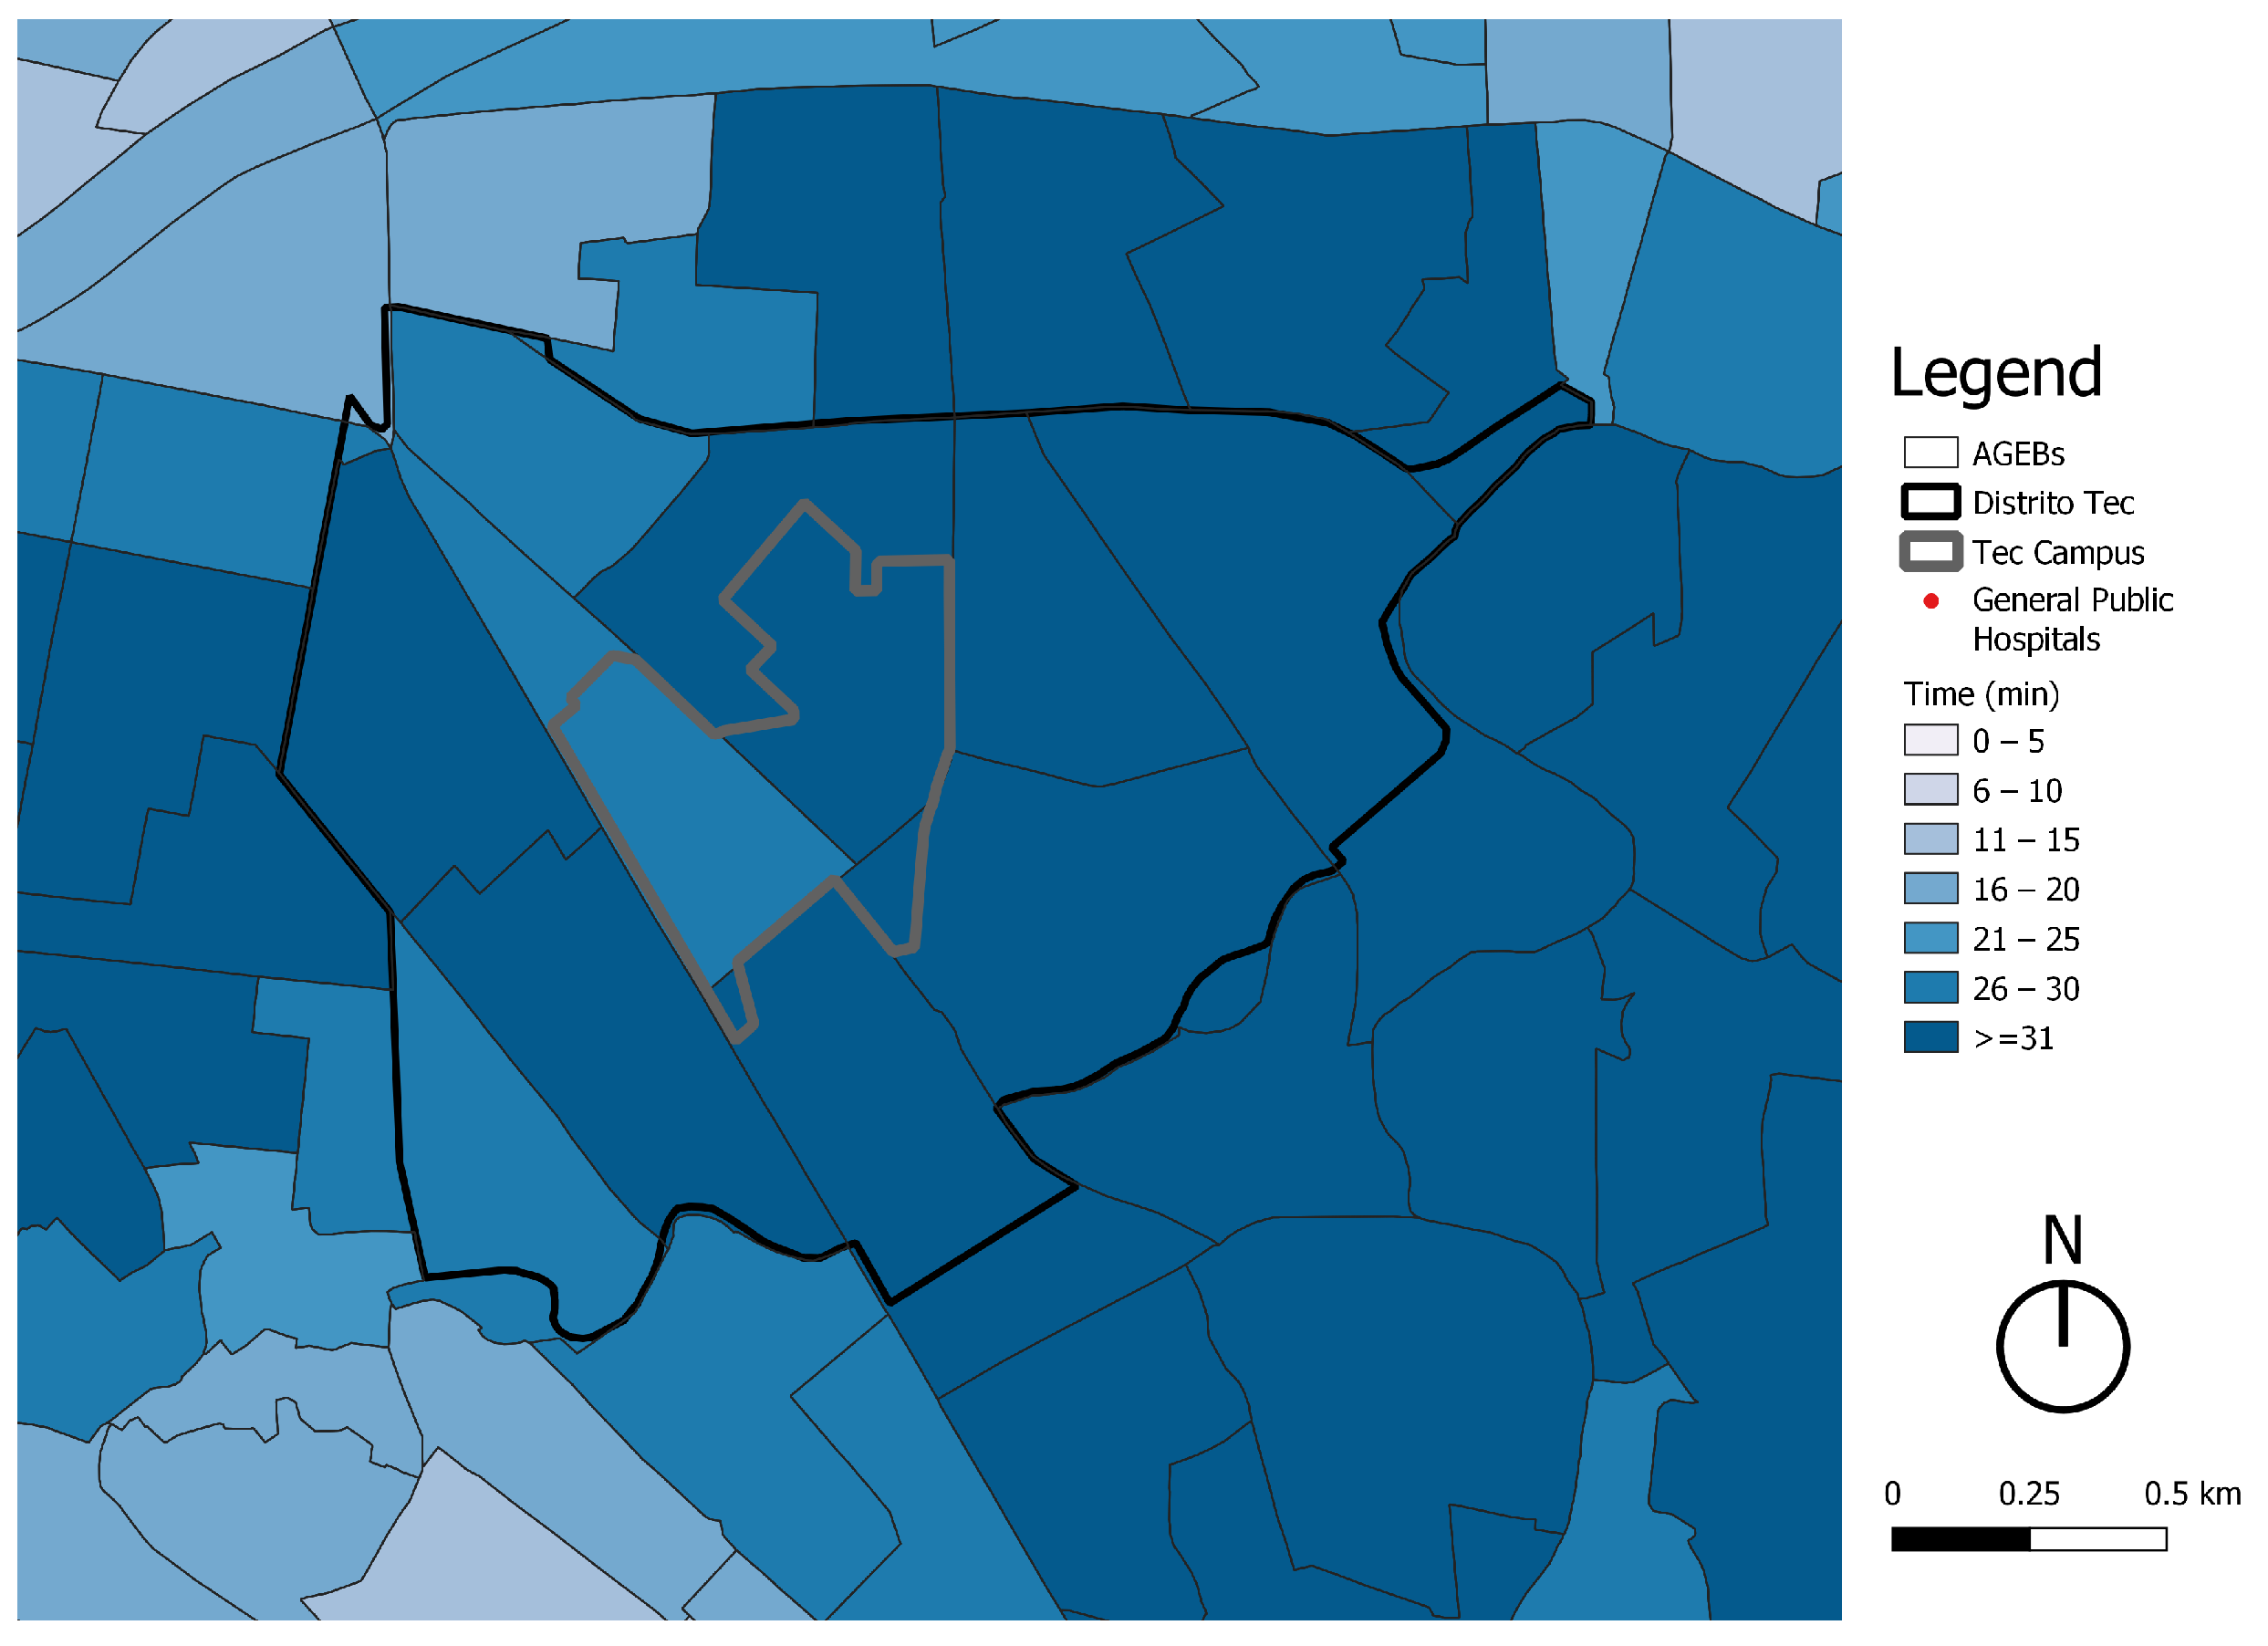
Figure 21 demonstrates that Distrito Tec does not have any public general hospitals within its area, nor in the vicinity. Consequently, the levels of accessibility to such destinations are mainly low (72.72% of aggregation areas) and the remaining 27.27% medium (see
Table 13).
The reduced number of destinations in both cities results in low accessibility levels to hospitals when people walk. Nevertheless, most people that visit hospitals in both cities do not often walk to them and instead use cars or public transport. Assessing access levels with those transport modes would be important before suggesting any urban intervention to improve access levels. Additionally, it is important to take into consideration the nature of hospitals: many of them require large buildings or clusters of them to complement the services offered to the patients. Therefore, it would be hard to downsize such infrastructure just to increase the number of destinations.
4. Discussion
The results presented in the previous section demonstrate that the social, political, environmental, and economic factors that have historically shaped each urban area have drastic consequences on the way cities are inhabited and how they respond to people’s and the environment’s needs. Therefore, the decisions that create a given urban form and arise from both formal and informal urbanization processes cannot be taken lightly.
It is important to repeat that the results are a preliminary evaluation of how two local areas are performing in terms of urban accessibility, but to achieve a full diagnosis and analysis of the specific interventions that each area needs, further information must be gathered. More detailed exploration of the variables concerning demographics, infrastructure capacities, social preference, willingness to pay, and others that prove to be relevant to each region must be included [
4].
In both MEDC and LEDC cities, access disparity remains one of the most significant urban issues that must be tackled. Therefore, there is an urgent need to change urban planning paradigms from creating car-centered cities to creating proximity-based cities. Such an approach would result in more inclusive cities that enable individuals or groups of individuals to access the city’s opportunities easily and comfortably, regardless of socioeconomic situation or even disabilities.
The previous results show that the car-centered urban planning approach that both the MMA and SFBA have taken during the Twentieth Century has resulted in car dependence and an unsustainable urban structure as a result. Therefore, neither the MMA nor the SFBA are ready to become 15 Minute Cities if only micromobility transport methods are considered.
Enabling such urban transformation in both cities is not an easy task. There are important social, cultural, economic, and political factors that have to be tackled. Hence, the transformation must be planned actions that are well articulated in the short, medium, and long term.
One of the biggest challenges in both cities is to change social preference related to car use. Among the population of the MMA and SFBA, the car serves as a symbol of freedom and even status; thus, people often buy a car as soon as they can afford it. This is one of the main reasons people refuse to use public transport, as they have to plan their day based on given transport schedules. However, such a preference for individual transport represents an important opportunity to convince people to shift from cars to sustainable individual transport modes such as walking, cycling, or using any other micromobility transport modes that bring them freedom while they commute without significant greenhouse gas emissions.
Safety is another important barrier for people to make a modal shift from cars to micromobility. Therefore, cities have to build the required infrastructure, such as bike lanes and wide-enough sidewalks, to guarantee that people can safely and comfortably use micromobility transport alternatives to move around the city. Additionally, it is important to reduce crime rates as people feel more exposed when they are walking or cycling.
Finally, in terms of mobility, it should be noted that the scale and structure of both cities currently forces people to travel long distances to access different opportunities. Redesigning such urban structures requires medium to long time interventions; thus, intermodal transport networks should be utilized to make such commutes shorter and more convenient for people. This means that a robust and high-quality public transport system has to exist.
In terms of redesigning and rethinking the urban structure of both cities regarding the availability of opportunities (destinations), there is also much work to be done. As mentioned, many of the destinations have been built thinking people will use cars to get to them; hence, they tend to operate on large scales. To keep that economic model running, many people have to go to only one destination to do their shopping, work, study, or get medical assistance. However, downsizing some of these destinations would make it feasible to have a larger number of smaller establishments located in a given area, which would reduce travel distances and times and would encourage people to move without using a car.
Naturally, there are certain infrastructures, such as hospitals and university campuses, that require large-scale buildings that complement the different activities happening. Such is the case of the Stanford District and Distrito Tec. Hence, it is crucial to create urban plans that integrate such spaces into the rest of the region and that enable access to such locations using sustainable transport modes.
In terms of data, this study demonstrated the continuous challenge in that cities have to capture, process, and publish up-to-date high-quality data for analyzing the urban conditions and developing targeted solutions. The study also demonstrated to what extent planners and decision-makers can fully rely on public datasets, sending an important message that current datasets, at least the open-source ones, are not robust and updated enough to be the unique source of information.
It also underscored the importance of investing in developing data, such as GTFS files that can simulate and understand the performance of public transport systems. Without such information, planners and decision-makers lack the information necessary to understanding the needs of the city and the hierarchy in which they have to be solved.
Finally, it is important to argue that urban accessibility stands as one of the most important analytical tools and approaches to rethink location patterns in urban areas. It also allows the comparison of different cities’ performance in terms of accessibility, becoming a transferable approach that can be used to improve urban conditions in different cities around the world and respond to the social, environmental, and economic challenges that society faces.
5. Conclusions
Cities are fragile social, environmental, economic, and political creations. They are also systems made of many subsystems and elements that relate to one another. Therefore, any intervention can affect the stability, adaptability, and resilience of the city as a whole. Unfortunately, traditional urban planning has failed to recognize the complexity of cities and has created rigid, unadaptable, and non-resilient cities. This problem was also discussed in [
40], which examined the importance, theoretical understanding, and empirical measurement of urban accessibility and made two main recommendations: to place accessibility at the center of the study of urban development and to focus urban policy-making more directly on specific problems, such as congestion, pollution, and traffic fatalities, which the authors of this paper fully agree with. Similarly, the results of the two studies show an inefficient misallocation of the two most-important urban consumption goods: housing and transportation.
This study serves as an example of how these planning processes have shaped cities in both LEDCs and MEDCs. Consequently, despite the different social, political, environmental, and economic backgrounds of the MMA and the SFBA, both study areas show similar challenges in terms of urban accessibility based on the active mobility needs of local communities, in particular university districts. In general, the results show that the Stanford District has, on average, a medium level of urban accessibility [
41] and the Tec District shows a high level of accessibility [
29]. Some of the problems that must be addressed in both study areas are safety for cyclists [
42] and pedestrians [
43], the density of some establishments (e.g., public schools, hospitals, etc.), and the promotion of public transportation use [
44] and/or the incorporation of private transportation for employees or students, such as school buses.
The results identified in this work are similar to those found in [
45], which identified the close link between transportation and urban form and the direct and indirect costs of the choices made, as well as identifying the turning points that may allow moving from dispersed urban development and conventional motorized transportation to more compact cities characterized by innovative mobility options configured around public and shared transportation. The examples used are based on cities around the world to illustrate emerging trends in both developed and developing countries, as this article sought to illustrate.
Understanding and demonstrating that cities at different economic development stages have similar challenges is a significant step in undertaking urban projects that reduce GHG emissions, access disparity, segregation, and marginalization on a worldwide scale. Additionally, having tools and standardized rating scales to assess how different cities are performing in terms of urban accessibility is crucial.
It is also clear that extremely disaggregated information about how a given urban area is performing in terms of accessibility, like the one obtained with UrMoAC, is critical to understand the specific needs of each local community and urban region. This information is valuable for designing targeted solutions that tackle specific local issues and avoiding generic urban interventions and landscapes.
Urban accessibility stands as an urban planning tenet. It is inherently people-centric and based on local considerations and the unique characteristics of communities for assessing mobility and access in cities. It redefines the urban planning and decision-making processes by making the community’s needs an intrinsic part of the analysis to enhance project implementation. Therefore, maximizing urban accessibility is at the core of active mobility (i.e., walking and cycling).
Further research in this area could assess accessibility performance on selected routes to have a more precise dataset of travel times to target destinations. This would be an enhancement of our initial use of average travel times within some of the very large block groups that may misrepresent this dimension. A proximity assessment tool, for instance a route and travel mode time system, would be more appropriate for the travel time calculations. Thus, the 15-minute proximity bubble or “buffer” around each location could then have its demographics calculated by pulling data from the census block groups and calculating based on the percentage of the block groups included in the proximity bubble. This would in turn provide more representative demographic data and much more representative travel time data than the block group approach does, in theory.
Another way to obtain information even closer to reality would be to apply the methodology presented in [
46] in which the TransCAD GIS system was used for the analysis of urban accessibility in Dallas/Fort Worth and Austin, where one of the outputs of the tool is a color-coded map indicating areas of relatively high and low accessibility. Unlike the UrMoAC tool, the gravity/log sum measure is chosen to calculate urban accessibility, so future research can be conducted comparing the results using the two tools.
The final reflection from this study is a call for more flexible urbanism, both in theory and in practice. Planners need to better respond to the constantly evolving, indeterminate, and unpredictable nature of cities. This requires more holistic, interdisciplinary approaches to problem solving. It also invites decision-makers to embrace the notion of a more ephemeral urbanism, not in the sense of implementing spontaneous interventions, but in the sense of accepting that urban interventions will not last forever and that they will need to adapt, transform, and evolve based on environment change and societal needs. Only by doing so will the urban realm have the ability to adapt and address climate change risk, while enhancing local communities’ resilience to face and overcome this global challenge.
Author Contributions
Conceptualization, J.d.-J.L.-S. and R.A.R.-M.; methodology, K.L.R.-H., A.L.G.-B., J.N.-B. and M.A.R.-M.; software, K.L.R.-H., A.L.G.-B., J.N.-B., M.A.R.-M. and D.K.; validation, J.N.-B., B.L.P.-H. and D.K.; formal analysis, J.N.-B., K.L.R.-H. and M.A.R.-M.; investigation, J.N.-B., K.L.R.-H. and M.A.R.-M.; resources, R.A.R.-M. and J.d.-J.L.-S.; data curation, K.L.R.-H., A.L.G.-B., J.N.-B. and M.A.R.-M.; writing—original draft preparation, J.N.-B., K.L.R.-H. and M.A.R.-M.; writing—review and editing, B.L.P.-H. and J.d.-J.L.-S.; visualization, K.L.R.-H., J.N.-B., M.A.R.-M. and J.d.-J.L.-S.; supervision, R.A.R.-M., B.L.P.-H., D.K. and J.d.-J.L.-S.; project administration, M.A.R.-M., R.A.R.-M. and J.d.-J.L.-S.; funding acquisition, R.A.R.-M. and J.d.-J.L.-S. All authors read and agreed to the published version of the manuscript.
Funding
This research received funding by the CampusCity Initiative of the Tecnologico de Monterrey. CampusCity Initiative is funded by Fundación FEMSA. Fundación FEMSA had no role in study design, data collection, and analysis, decision to publish, nor preparation of the manuscript.
Institutional Review Board Statement
Not applicable.
Informed Consent Statement
Not applicable.
Data Availability Statement
Acknowledgments
Special thanks to the Deutsches Zentrum für Luft-Raumfahrt (DLR) for making UrMoAC an open-source software and sharing relevant information about its use with our research team. The authors would also like to thank the Distrito Tec team, from the Instituto Tecnológico de Monterrey, for giving relevant information and feedback throughout the development of the entire project. We acknowledge as well the support of the California—Global Energy, Water & Infrastructure Innovation Initiative at Stanford University.
Conflicts of Interest
The authors declare no conflict of interest.
References
- Williams, K. Sustainable cities: Research and practice challenges. Int. J. Urban Sustain. Dev. 2009, 1, 128–132. [Google Scholar] [CrossRef]
- Bibri, S.E. Data-driven smart sustainable cities of the future: An evidence synthesis approach to a comprehensive state-of-the-art literature review. Sustain. Futures 2021, 3, 100047. [Google Scholar] [CrossRef]
- Borsatto, J.M.L.S.; Amui, L.B.L. Green innovation: Unfolding the relation with environmental regulations and competitiveness. Res. Conserv. Recycl. 2019, 149, 445–454. [Google Scholar] [CrossRef]
- Geurs, K.T.; Ritsema van Eck, J.R. Accessibility measures: Review and applications. In Evaluation of Accessibility Impacts of Land-Use Transportation Scenarios, and Related Social and Economic Impact; Technical Report 90715; PBL Netherlands Environmental Assessment Agency: The Hague, The Netherlands, 2001. [Google Scholar]
- Moreno, C.; Allam, Z.; Chabaud, D.; Gall, C.; Pratlong, F. Introducing the “15-Minute City”: Sustainability, Resilience and Place Identity in Future Post-Pandemic Cities. Smart Cities 2021, 4, 93–111. [Google Scholar] [CrossRef]
- Krajzewicz, D.; Heinrichs, D.; Cyganski, R. Intermodal Contour Accessibility Measures Computation Using the ‘UrMo Accessibility Computer’. Int. J. Adv. Syst. Meas. 2017, 10, 111–123. [Google Scholar]
- GTFS—General Transit Feed Specification. 2021. Available online: https://gtfs.org/ (accessed on 20 June 2022).
- Lisciandra, C. The role of psychology in behavioral economics: The case of social preferences. Stud. Hist. Philos. Sci. Part A 2018, 72, 11–21. [Google Scholar] [CrossRef]
- Kaplan, N.; Omer, I. Multiscale Accessibility—A New Perspective of Space Structuration. Sustainability 2022, 14, 5119. [Google Scholar] [CrossRef]
- Vidović, K.; Šoštarić, M.; Budimir, D. An overview of indicators and indices used for urban mobility assessment. Promet—Traffic—Traffico 2019, 31, 703–714. [Google Scholar] [CrossRef]
- Zhao, X.; Moon, J. Analysis of Urban Spatial Accessibility of Museums within the Scope of Seoul. Buildings 2022, 12, 1749. [Google Scholar] [CrossRef]
- Abdulraheem, M.O.; Oloyede, I.O.; Amuda-Yusuf, G.; Raheem, W.M. Urban Green Space Accessibility in Ilorin City, Nigeria. Int. J. Real Estate Stud. INTREST 2022, 1, 24–36. [Google Scholar] [CrossRef]
- Bai, X.; Surveyer, A.; Elmqvist, T.; Gatzweiler, F.W.; Güneralp, B.; Parnell, S.; Prieur-Richard, A.H.; Shrivastava, P.; Siri, J.G.; Stafford-Smith, M.; et al. Defining and advancing a systems approach for sustainable cities. Curr. Opin. Environ. Sustain. 2016, 23, 69–78. [Google Scholar] [CrossRef]
- Huovila, A.; Bosch, P.; Airaksinen, M. Comparative analysis of standardized indicators for Smart sustainable cities: What indicators and standards to use and when? Cities 2019, 89, 141–153. [Google Scholar] [CrossRef]
- Kiplagat, A.K.; Koech, J.K.; Ng’etich, J.K.; Lagat, M.J.; Khazenzi, J.A.; Odhiambo, K.O. Urban green space characteristics, visitation patterns and influence of visitors’ socio-economic attributes on visitation in Kisumu City and Eldoret Municipality, Kenya. Trees For. People 2022, 7, 100175. [Google Scholar] [CrossRef]
- Desarrollo Urbano Sostenible. Municipios de Zona Metropolitana de Monterrey. 2022. Available online: https://datos.monterrey.gob.mx/dataset/municipios-de-zona-metropolitana-de-monterrey (accessed on 31 October 2022).
- El Gobierno del Nuevo Lion of Economy of the State Government. Nuevo León Data. 2022. Available online: http://datos.nl.gob.mx/ (accessed on 20 June 2022).
- Gobierno del Estado de Nuevo León. Programa Integral de Movilidad Urbana Sustentable (PIMUS-ZMM). 2010. Available online: https://www.nl.gob.mx/publicaciones/documento-ejecutivo-pimus (accessed on 20 June 2022).
- Chavez-Rodriguez, L.; Lomas, R.T.; Curry, L. Environmental justice at the intersection: Exclusion patterns in urban mobility narratives and decision making in Monterrey, Mexico. Erde 2020, 151, 116–128. [Google Scholar] [CrossRef]
- Sousa Gonzalez, E. El espacio urbano y su transformación metropolitana en la sobremodernidad. El caso Monterrey, NL, México. Nóesis Revista Ciencias Sociales 2008, 17, 168–203. [Google Scholar]
- Distrito Tec. 2021. Available online: http://distritotec.itesm.mx/categorias/colonias/ (accessed on 20 June 2022).
- Montana Public Service Commission. Vital Signs: Population. 2021. Available online: https://www.vitalsigns.mtc.ca.gov/population (accessed on 20 June 2022).
- Bay Area Census. Counties. 2019. Available online: http://www.bayareacensus.ca.gov/counties/counties.htm (accessed on 31 October 2022).
- Statista Research Department. Per Capita Real Gross Domestic Product (GDP) of the United States in 2019. 2019. Available online: https://www.statista.com/statistics/248063/per-capita-us-real-gross-domestic-product-gdp-by-state/ (accessed on 20 June 2022).
- The Word Bank. GDP per Capita (current US$)—United States. 2021. Available online: https://data.worldbank.org/indicator/NY.GDP.PCAP.CD?locations=US (accessed on 20 June 2022).
- Pettinger, T. Sectors of the Economy. 2021. Available online: https://www.economicshelp.org/blog/12436/concepts/sectors-economy/ (accessed on 20 June 2022).
- City of Palo Alto. 2022. Available online: https://www.cityofpaloalto.org/About (accessed on 20 June 2022).
- City of Menlo Park. City Population and Demographics. 2020. Available online: https://beta.menlopark.org/Community/City-population-and-demographics (accessed on 20 June 2022).
- Gaxiola-Beltrán, A.L.; Narezo-Balzaretti, J.; Ramírez-Moreno, M.A.; Pérez-Henríquez, B.L.; Ramírez-Mendoza, R.A.; Krajzewicz, D.; Lozoya-Santos, J.d.J. Assessing Urban Accessibility in Monterrey, Mexico: A Transferable Approach to Evaluate Access to Main Destinations at the Metropolitan and Local Levels. Appl. Sci. 2021, 11, 7519. [Google Scholar] [CrossRef]
- Bureau, U.S.C. United States Census Bureau. 2020. Available online: https://www.census.gov/ (accessed on 20 June 2022).
- Park, S.; Nielsen, A.; Bailey, R.T.; Trolle, D.; Bieger, K. A QGIS-based graphical user interface for application and evaluation of SWAT-MODFLOW models. Environ. Model. Softw. 2019, 111, 493–497. [Google Scholar] [CrossRef]
- Kwan, M.P. Space-time and integral measures of individual accessibility: A comparative analysis using a point-based framework. Geogr. Anal. 1998, 30, 191–216. [Google Scholar] [CrossRef]
- Kuzkin, O. Optimal planning of trip and round trip cycle time on an urban route. Technol. Audit. Prod. Reserves 2017, 2, 34–42. [Google Scholar] [CrossRef][Green Version]
- Lopez, P.A.; Behrisch, M.; Bieker-Walz, L.; Erdmann, J.; Flötteröd, Y.P.; Hilbrich, R.; Lücken, L.; Rummel, J.; Wagner, P.; Wießner, E. Microscopic Traffic Simulation using SUMO. In Proceedings of the 21st IEEE International Conference on Intelligent Transportation Systems, Maui, HI, USA, 4–7 November 2018. [Google Scholar]
- Heinrichs, M.; Krajzewicz, D.; Cyganski, R.; von Schmidt, A. Introduction of car sharing into existing car fleets in microscopic travel demand modelling. Pers. Ubiquitous Comput. 2017, 21, 1055–1065. [Google Scholar] [CrossRef]
- U.S. Geological Survey National Elevation Dataset (NED) Website. 2010. Available online: https://www.sciencebase.gov/catalog/item/4f4e48b1e4b07f02db530759 (accessed on 31 October 2022).
- Short, A.; Guthman, J.; Raskin, S. Food Deserts, Oases, or Mirages? Small Markets and Community Food Security in the San Francisco Bay Area. J. Plan. Educ. Res. 2007, 26, 352–364. [Google Scholar] [CrossRef]
- Borja, J.; Martinez, Z. El Espacio público: Ciudad y Ciudadanía. 2000. Available online: https://www.researchgate.net/profile/Zaida-Martinez/publication/31731154_El_espacio_publico_ciudad_y_ciudadania_J_Borja_Z_Muxi_prol_de_O_Bohigas/links/543fbcd00cf2be1758cf9779/El-espacio-publico-ciudad-y-ciudadania-J-Borja-Z-Muxi-prol-de-O-Bohigas.pdf (accessed on 20 June 2022).
- World Economic Forum. 5 Things COVID-19 Has Taught us about Inequality. 2020. Available online: https://www.weforum.org/agenda/2020/08/5-things-covid-19-has-taught-us-about-inequality/ (accessed on 20 June 2022).
- Duranton, G.; Guerra, E. Developing a Common Narrative on Urban Accessibility: An Urban Planning Perspective; National Academies of Sciences, Engineering, and Medicine: Washington, DC, USA, 2016. [Google Scholar]
- Joh, K.; Boarnet, M.G.; Nguyen, M.T.; Fulton, W.; Siembab, W.; Weaver, S. Accessibility, Travel Behavior, and New Urbanism: Case Study of Mixed-Use Centers and Auto-Oriented Corridors in the South Bay Region of Los Angeles, California. Transp. Res. Rec. 2008, 2082, 81–89. [Google Scholar] [CrossRef]
- Wegman, F.; Zhang, F.; Dijkstra, A. How to make more cycling good for road safety? Safety and Mobility of Vulnerable Road Usears: Pedestrians, Bicyclists, and Motorcyclists. Accid. Anal. Prev. 2012, 44, 19–29. [Google Scholar] [CrossRef] [PubMed]
- Beitel, D.; Stipancic, J.; Manaugh, K.; Miranda-Moreno, L. Assessing safety of shared space using cyclist-pedestrian interactions and automated video conflict analysis. Transp. Res. Part D Transp. Environ. 2018, 65, 710–724. [Google Scholar] [CrossRef]
- Papola, A.; Tinessa, F.; Marzano, V.; Mautone, A. Quantitative overview of efficiency and effectiveness of public transport in Italy: The importance of using ITS. In Proceedings of the 2017 5th IEEE International Conference on Models and Technologies for Intelligent Transportation Systems (MT-ITS), Naples, Italy, 26–28 June 2017; pp. 895–900. [Google Scholar] [CrossRef]
- Rode, P.; Floater, G.; Thomopoulos, N.; Docherty, J.; Schwinger, P.; Mahendra, A.; Fang, W. Accessibility in Cities: Transport and Urban Form. In Disrupting Mobility: Impacts of Sharing Economy and Innovative Transportation on Cities; Meyer, G., Shaheen, S., Eds.; Springer International Publishing: Cham, Switzerland, 2017; pp. 239–273. [Google Scholar] [CrossRef]
- Bhat, C.R.; Handy, S.L.; Kockelman, K.M.; Mahmassani, H.S.; Gopal, A.R.; Srour, I.M.; Weston, L.M. Development of an urban accessibility index: Formulations, aggregation, and application. Work 2002, 4938. Available online: https://www.google.com.hk/url?sa=t&rct=j&q=&esrc=s&source=web&cd=&ved=2ahUKEwi1vN-n_9T7AhVjUGwGHVMxCcAQFnoECAwQAQ&url=https%3A%2F%2Fctr.utexas.edu%2Fwp-content%2Fuploads%2Fpubs%2F4938_4.pdf&usg=AOvVaw3av2tku9Owa4MDk3TdNewL (accessed on 21 November 2022).
Figure 1.
Mode share of the MMA. Source: [
18].
Figure 1.
Mode share of the MMA. Source: [
18].
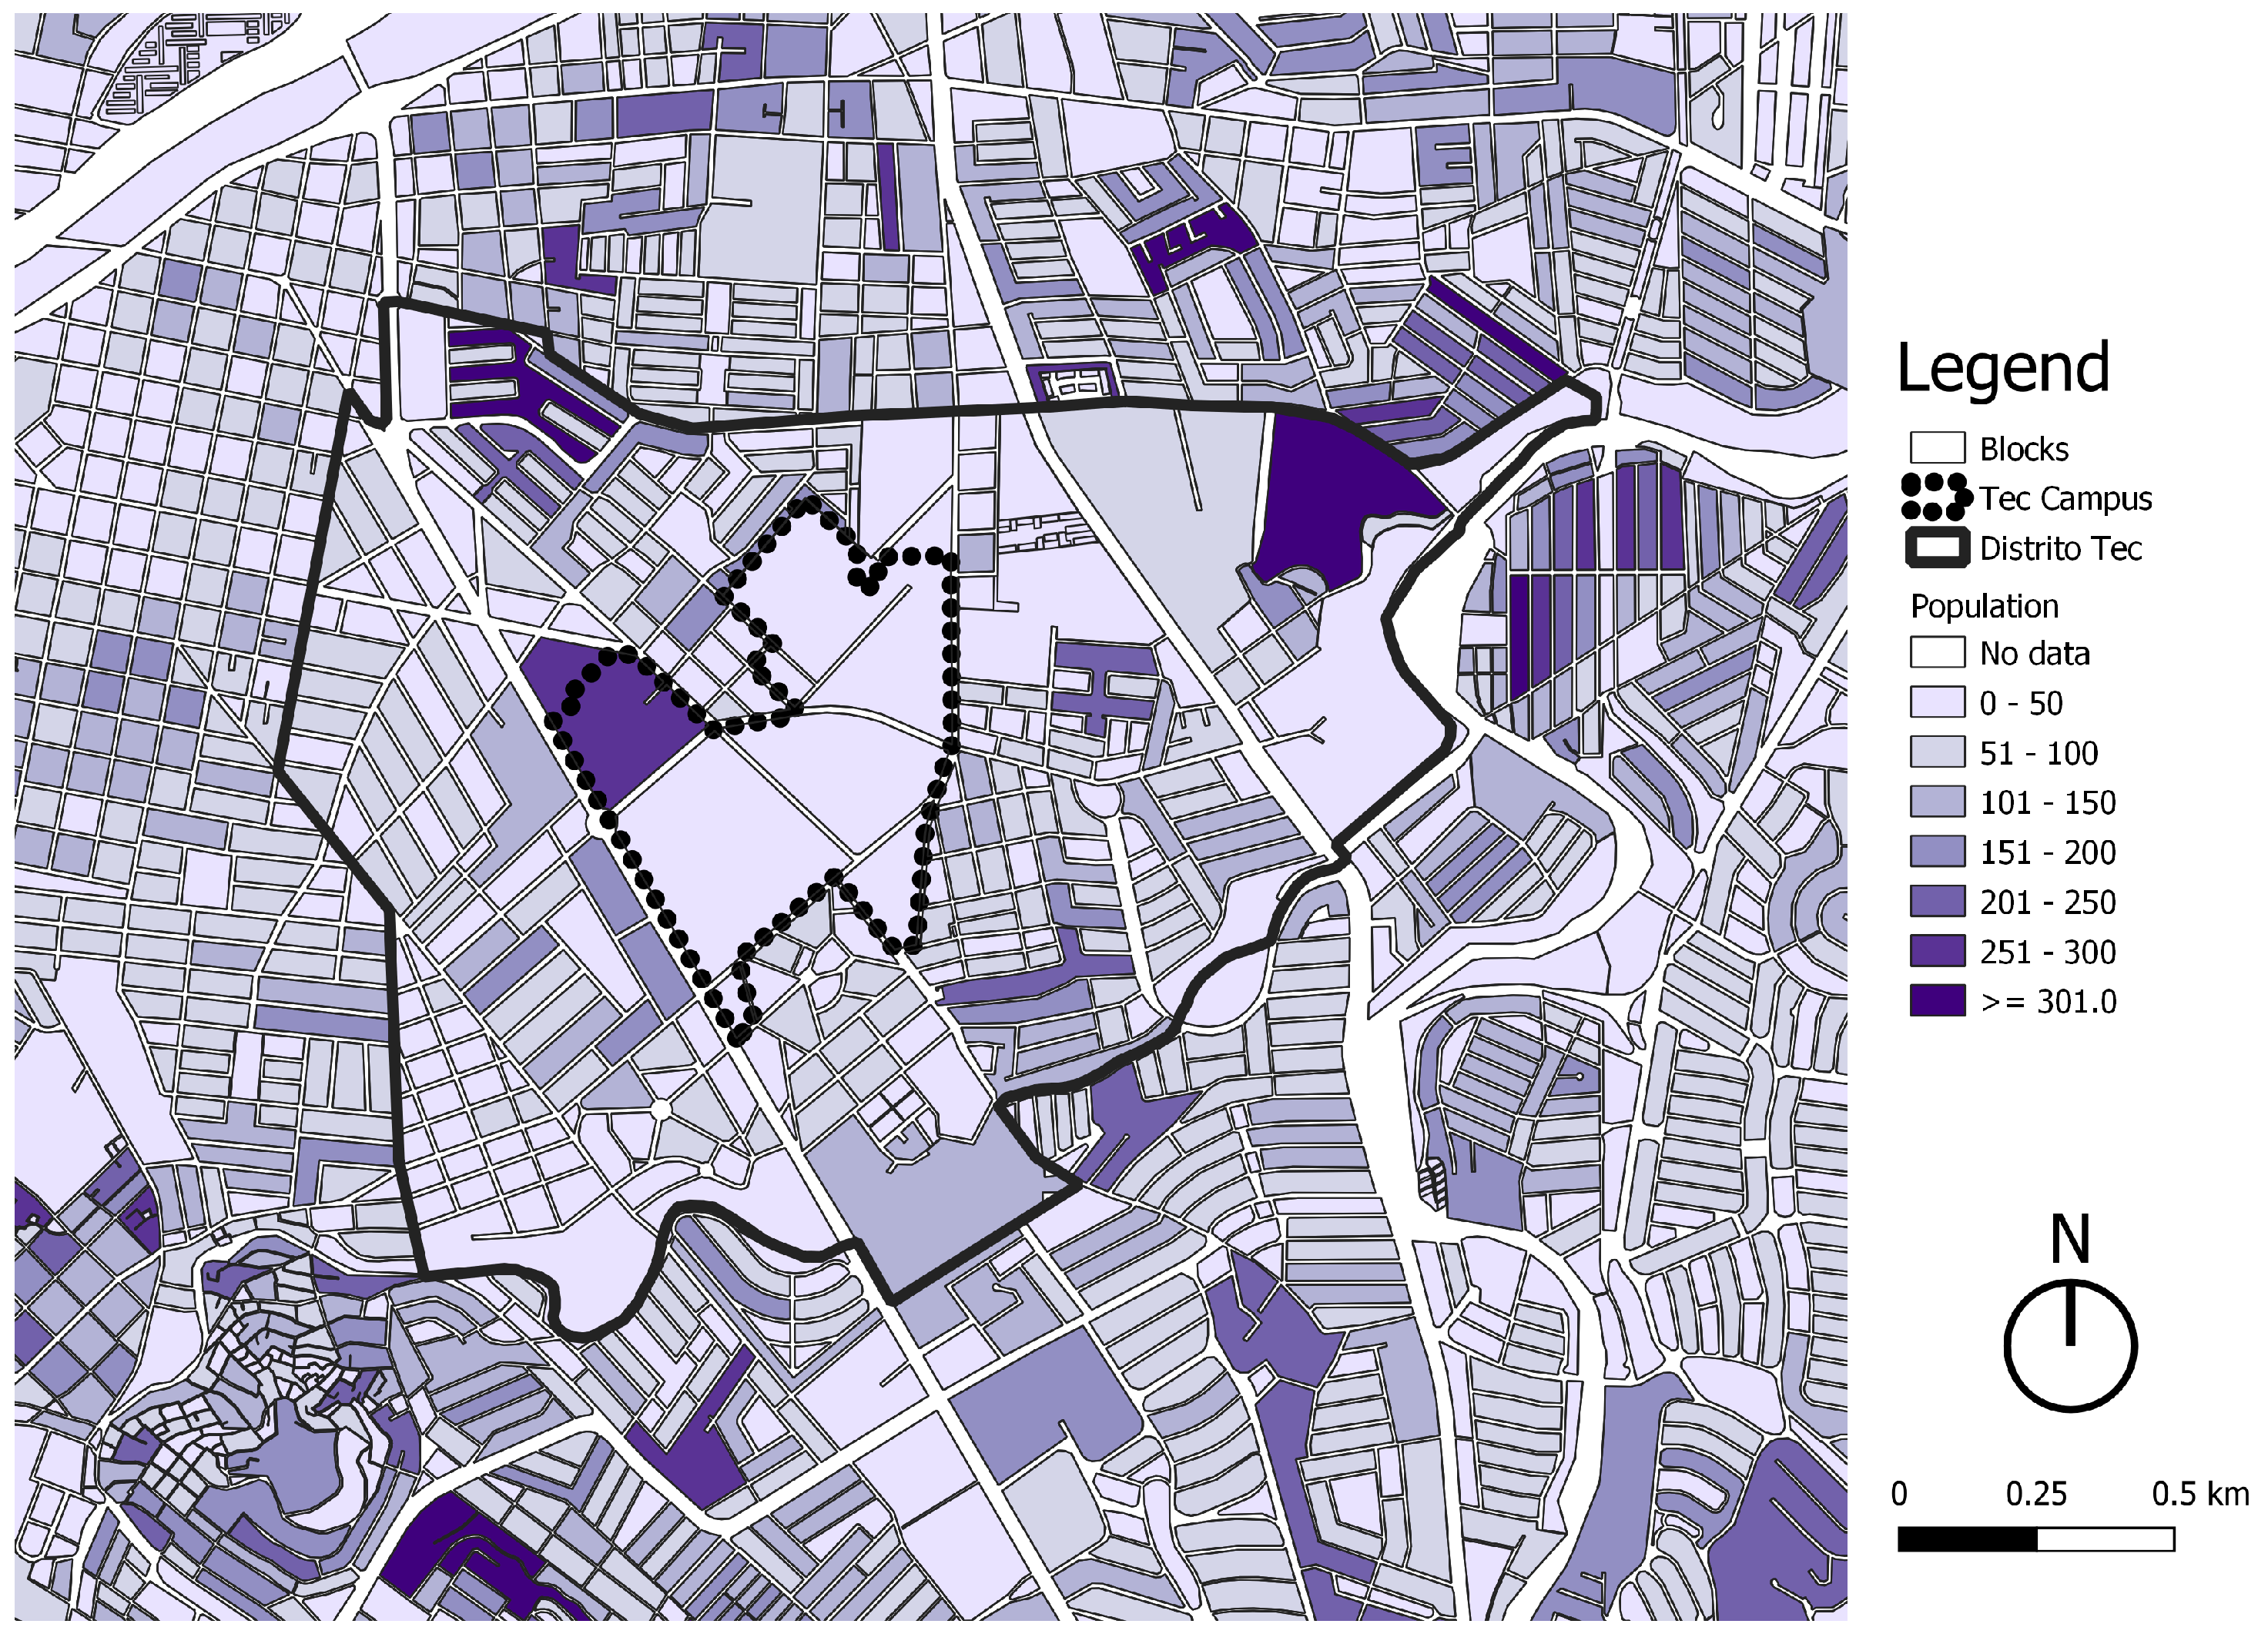
Figure 2.
Population by block in Distrio Tec, Monterrey.
Figure 2.
Population by block in Distrio Tec, Monterrey.
Figure 3.
Mode share of the San Francisco Bay Area. Source: [
22].
Figure 3.
Mode share of the San Francisco Bay Area. Source: [
22].
Figure 4.
Population by block in Stanford District, San Francisco Bay Area.
Figure 4.
Population by block in Stanford District, San Francisco Bay Area.
Figure 5.
Delimitation of the Distrito Tec area within Monterrey, Mexico. Tec campus, parks, main roads, rivers, and urban blocks are also shown.
Figure 5.
Delimitation of the Distrito Tec area within Monterrey, Mexico. Tec campus, parks, main roads, rivers, and urban blocks are also shown.
Figure 6.
Delimitation of the Stanford District area within the San Francisco Bay Area, CA, USA. Stanford campus, parks, main roads, water bodies, and urban blocks are also shown.
Figure 6.
Delimitation of the Stanford District area within the San Francisco Bay Area, CA, USA. Stanford campus, parks, main roads, water bodies, and urban blocks are also shown.
Figure 7.
Distrito Tec within the Monterrey Metropolitan Area.
Figure 7.
Distrito Tec within the Monterrey Metropolitan Area.
Figure 8.
Stanford district within the San Francisco Bay Area.
Figure 8.
Stanford district within the San Francisco Bay Area.
Figure 9.
Stanford District average travel time to the closest supermarket or convenience store by bicycle.
Figure 9.
Stanford District average travel time to the closest supermarket or convenience store by bicycle.
Figure 10.
Distrito Tec average travel time to the closest supermarket by bicycle.
Figure 10.
Distrito Tec average travel time to the closest supermarket by bicycle.
Figure 11.
Location of supermarkets and convenience stores in Stanford District merging OpenStreetMap and Google Maps databases.
Figure 11.
Location of supermarkets and convenience stores in Stanford District merging OpenStreetMap and Google Maps databases.
Figure 12.
Stanford District average travel time to the 3 closest public elementary schools by foot.
Figure 12.
Stanford District average travel time to the 3 closest public elementary schools by foot.
Figure 13.
Distrito Tec average travel time to the 3 closest public elementary schools by foot.
Figure 13.
Distrito Tec average travel time to the 3 closest public elementary schools by foot.
Figure 14.
Stanford District average travel time to the 3 closest public middle schools by bicycle.
Figure 14.
Stanford District average travel time to the 3 closest public middle schools by bicycle.
Figure 15.
Distrito Tec average travel time to the 3 closest public middle schools by bicycle.
Figure 15.
Distrito Tec average travel time to the 3 closest public middle schools by bicycle.
Figure 16.
Stanford District average travel time to the 3 closest public high schools by bicycle.
Figure 16.
Stanford District average travel time to the 3 closest public high schools by bicycle.
Figure 17.
Distrito Tec average travel time to the 3 closest public high schools by bicycle.
Figure 17.
Distrito Tec average travel time to the 3 closest public high schools by bicycle.
Figure 18.
Stanford District average travel time to the closest park by foot.
Figure 18.
Stanford District average travel time to the closest park by foot.
Figure 19.
Distrito Tec average travel time to the closest park by foot.
Figure 19.
Distrito Tec average travel time to the closest park by foot.
Figure 20.
Stanford District average travel time to the closest public general acute care hospital or public primary care clinic by foot.
Figure 20.
Stanford District average travel time to the closest public general acute care hospital or public primary care clinic by foot.
Figure 21.
Distrito Tec average travel time to the closest public general hospital by foot.
Figure 21.
Distrito Tec average travel time to the closest public general hospital by foot.
Table 1.
Essential characteristics of the two study areas.
Table 1.
Essential characteristics of the two study areas.
| Characteristic | Distrito Tec | Stanford District |
|---|
| Neighborhoods | 24 | 17 |
| Households | 11,206 | 46,686 |
| Area | 4.52 km2 | 56.54 km2 |
| Population | 26,371 | 113,378 |
Table 2.
Speeds of transport modes used for computation, as defined in the UrMoAC tool.
Table 2.
Speeds of transport modes used for computation, as defined in the UrMoAC tool.
| Mode | Speed (km/h) |
|---|
| Walking | 3.6 |
| Cycling | 13 |
| Motorized vehicles | The road’s speed limit |
| Public transport | Time schedule from GTFS |
Table 3.
Urban blocks’ datasets used for the computation of urban accessibility in this study.
Table 3.
Urban blocks’ datasets used for the computation of urban accessibility in this study.
Table 4.
Destinations’ datasets.
Table 4.
Destinations’ datasets.
Table 5.
Road Network Datasets.
Table 5.
Road Network Datasets.
Table 6.
Datasets of aggregation areas.
Table 6.
Datasets of aggregation areas.
Table 7.
Standardized rating scale.
Table 7.
Standardized rating scale.
| Scale (Accessibility) | Time (min) | Distance Cycling (km) | Distance Walking (km) |
|---|
| Low | >30 | >6.5 | >1.8 |
| Medium | 16–30 | 3.26–6.5 | 0.9–1.8 |
| High | 0–15 | 0–3.25 | 0–1.8 |
Table 8.
Accessibility level to supermarkets traveling by bicycle per aggregation area.
Table 8.
Accessibility level to supermarkets traveling by bicycle per aggregation area.
| Accessibility Level | Stanford District (Block Groups) | Distrito Tec (AGEBs) |
|---|
| Low (>30) | 0/79–0% | 0/11–0% |
| Medium (16–30) | 9/79–11.39% | 0/11–0% |
| High (0–15) | 70/79–88.61% | 11/11–100% |
Table 9.
Accessibility level to elementary schools traveling by foot per aggregation area.
Table 9.
Accessibility level to elementary schools traveling by foot per aggregation area.
| Accessibility Level | Stanford District (Block Groups) | Distrito Tec (AGEBs) |
|---|
| Low (>30) | 33/79–41.77% | 0/11–0% |
| Medium (16–30) | 46/79–58.23% | 3/11–27.27% |
| High (0–15) | 0/79–0% | 8/11–72.72% |
Table 10.
Accessibility level to middle schools traveling by bicycle per aggregation area.
Table 10.
Accessibility level to middle schools traveling by bicycle per aggregation area.
| Accessibility Level | Stanford District (Block Groups) | Distrito Tec (AGEBs) |
|---|
| Low (>30) | 0/79–0% | 0/11–0% |
| Medium (16–30) | 63/79–79.75% | 0/11–0% |
| High (0–15) | 16/79–20.25% | 11/11–100% |
Table 11.
Accessibility level to high schools traveling by bicycle per aggregation area.
Table 11.
Accessibility level to high schools traveling by bicycle per aggregation area.
| Accessibility Level | Stanford District (Block Groups) | Distrito Tec (AGEBs) |
|---|
| Low (>30) | 1/79–1.27% | 0/11–0% |
| Medium (16–30) | 72/79–91.14% | 2/11–18.18% |
| High (0–15) | 6/79–7.59% | 9/11–81.81% |
Table 12.
Accessibility level to parks traveling by foot per aggregation area.
Table 12.
Accessibility level to parks traveling by foot per aggregation area.
| Accessibility Level | Stanford District (Block Groups) | Distrito Tec (AGEBs) |
|---|
| Low (>30) | 0/79–0% | 0/11–0% |
| Medium (16–30) | 16/79–20.25% | 0/11–0% |
| High (0–15) | 63/79–79.75% | 11/11–100% |
Table 13.
Accessibility level hospitals traveling by foot per aggregation area.
Table 13.
Accessibility level hospitals traveling by foot per aggregation area.
| Accessibility Level | Stanford District (Block Groups) | Distrito Tec (AGEBs) |
|---|
| Low (>30) | 52/79–65.82% | 8/11–72.72% |
| Medium (16—30) | 21/79–26.58% | 3/11–27.27% |
| High (0–15) | 6/79–7.59% | 0/11–0% |
| Publisher’s Note: MDPI stays neutral with regard to jurisdictional claims in published maps and institutional affiliations. |
© 2022 by the authors. Licensee MDPI, Basel, Switzerland. This article is an open access article distributed under the terms and conditions of the Creative Commons Attribution (CC BY) license (https://creativecommons.org/licenses/by/4.0/).


 ,
, 


