Article

Investigation of the Behaviors of Methanol Spray Impingement and Wall Wetting

School of Energy and Power Engineering, Xi’an Jiaotong University, Xi’an 710049, China
*
Author to whom correspondence should be addressed.
Appl. Sci. 2022, 12(23), 12263; https://doi.org/10.3390/app122312263
Submission received: 1 November 2022 / Revised: 22 November 2022 / Accepted: 28 November 2022 / Published: 30 November 2022

Abstract

:
Port fuel injection is an important technical route in methanol engines. To obtain a theoretical basis for injector arrangement and injection strategy development in methanol engines, an optimal experimental platform based on diffuse back-illumination and the refractive index matching method (RIM) was designed and built in this study. The experiments on the behavior of low-pressure methanol spray-wall impingement and wall film were carried out and the influence of the three boundary conditions of spray distance (Dimp), wall temperature (Twall), and injection pressure (Pinj) were analyzed comprehensively. Results showed that with the increase of Dimp, the overall shape of spray before impinging the wall changed from conical to cylindrical. The impinging spray height Hi and impinging spray width Wi increased with the decrease of Dimp and the increase of Pinj. Adhesive fuel film mass Mf increased with the increase of Dimp due to the decrease of kinetic energy during wall impact. In addition, the increase of the wall temperature Twall reduced Mf due to evaporation, but when Twall reached 423 K, Mf rebounded due to the Leidenfrost effect. The results of this study are helpful to improve the accuracy of the numerical methanol engine model.

1. Introduction

There are many physical behaviors involved in the process of spray impingement, and its complexity brings great challenges to experimental measurement and numerical simulation. Relevant research started in the 1980s. Due to the limitations of experimental methods and measuring equipment, early tests were inadequate to accurately study high transient processes. Recently, the improvement of optical measurement technology has played a major role in the study of the coupling between spray and wall. At present, the research on spray wall coupling mainly focuses on the following two aspects.
First, the research on the dynamic behavior of spray after hitting the wall is constantly being improved [1]. Katsura et al. [2] obtained the mathematical relationship between the height and width of the diesel impinging spray and time, environmental density, and the injection pressure. Arcoumanis et al. [3] studied the detailed structure of diesel spray when it impacts the normal temperature wall (20 °C) and heated wall (150 °C), and they found that higher wall temperature reduced the accumulation of droplets in front of the wall jet, and enhanced the vortex in front of the wall jet. In addition, Stratmann et al. [4] found that the increase of environmental density will also enhance the vortex in the front of the spray. Mathew et al. [5] used isooctane instead of gasoline to study the spray wall impact characteristics of a single-hole low-pressure injector. The results showed that the impact height of spray decreased with the increase of the normal angle between the injector and the wall. Park et al. [6] used the Mie scattering method and shadow method to study the wall impact characteristics of spray from an in-cylinder direct injection nozzle under different injection angles; they found that reducing the angle with the wall can promote the movement of liquid mist along the wall. Montanaro et al. [7,8] studied the wall impact characteristics of isooctane spray, and the results showed that the impact height of the gas phase and liquid phase did not increase linearly with the rise of wall temperature, but decreased after exceeding 473 K; they believe that this situation may be related to the “Leidenfrost” effect. Catapano et al. [9] used a GDI nozzle to inject gasoline onto pistons with different temperatures and found that the increase of piston temperature led to the reduction of the liquid phase, and higher injection pressure improved fuel evaporation. Luo et al. also carried out a spray wall impact experiment using a GDI nozzle [10,11,12]. In their experiment, toluene was used as the spray liquid, and the effects of spray pressure, ambient temperature, and density were studied. Yu et al. [13] studied the spray wall impact process of n-butanol/diesel blended fuel. The results showed that the impact height and impact width of spray will decrease with the increase of ambient temperature, ambient pressure, and injection distance, but will increase with the increase of fuel temperature. Li et al. [14] studied the influence of cross-flow velocity on the wall impact characteristics of the spray, and the results showed that the increase of cross-flow velocity would strengthen the dispersion of spray along the flow direction. Second, the research on the influence of various boundary conditions on fuel wall attachment is being continuously developed. At present, the common measurement methods of the adhered fuel include the weighing method and optical method. Akop et al. [15,16,17,18] carried out a series of studies on the adhered fuel by using the weighing method. The results showed that larger spray distance, higher spray pressure, or higher ambient pressure will lead to the reduction of the adhesive fuel film mass. Yu et al. [19] also used the weighing method to study the fuel adhesion formation of a variety of diesel blended fuels after impinging the wall. However, the current time resolution of the weighing method is still low, and it cannot be applied to the boundary conditions that easily accelerate the evaporation of liquid film, such as a high-temperature wall or high-temperature environment. At present, the refractive index matching (RIM) method proposed by Drake et al. [20] is a potential method to measure the adhesive fuel film thickness. Yang et al. [21] used the RIM method to study wall wetting. The results showed that the peak thickness of liquid film decreases with the increase in ambient temperature. Ambient pressure and orifice diameter did not significantly affect the adhesion ratio of spray. Ding et al. [22,23] found that the increase of the adhesive fuel film volume is related to the increase of soot emission. In addition, the increase in injection pressure increased the fuel adhesion mass, area and maximum liquid film thickness on the wall, while the increase in ambient temperature led to the opposite result [10,11,24]. He et al. [25] studied the spray and adhesive fuel film characteristics of n-hexane injected by a five-hole GDI injector through the RIM method and found that flash boiling can occur at low ambient pressure, and the fuel quality deposited on the wall usually increases with the increase of ambient pressure.
As mentioned above, the research of spray impingement and adhesive fuel film is mostly focused on high-pressure injectors, and the fuel studied is mostly gasoline and diesel or its components. However, there are few studies on the characteristics of spray impingement and the wall wetting of methanol, one of the most promising alternative fuels for the internal combustion engine. Methanol spray impingement and wall wetting in the intake port of the PFI engine significantly influences the mixture formation process, and, thereby, the combustion process. In this study, an optical experiment platform of spray impingement was built, and the diffusion backlight method and the refractive index matching method were used to capture the spray impingement process and the development process of adhesive fuel film of a methanol PFI nozzle through a high-speed camera. In addition, an image processing program matched with the experimental platform was developed to quantify and analyze the characteristics of spray impingement and fuel adhesion formation. This study is helpful in further improving the accuracy of the numerical methanol engine model and optimizing the injection strategy of the methanol engine.

2. Experimental Setup and Methodology

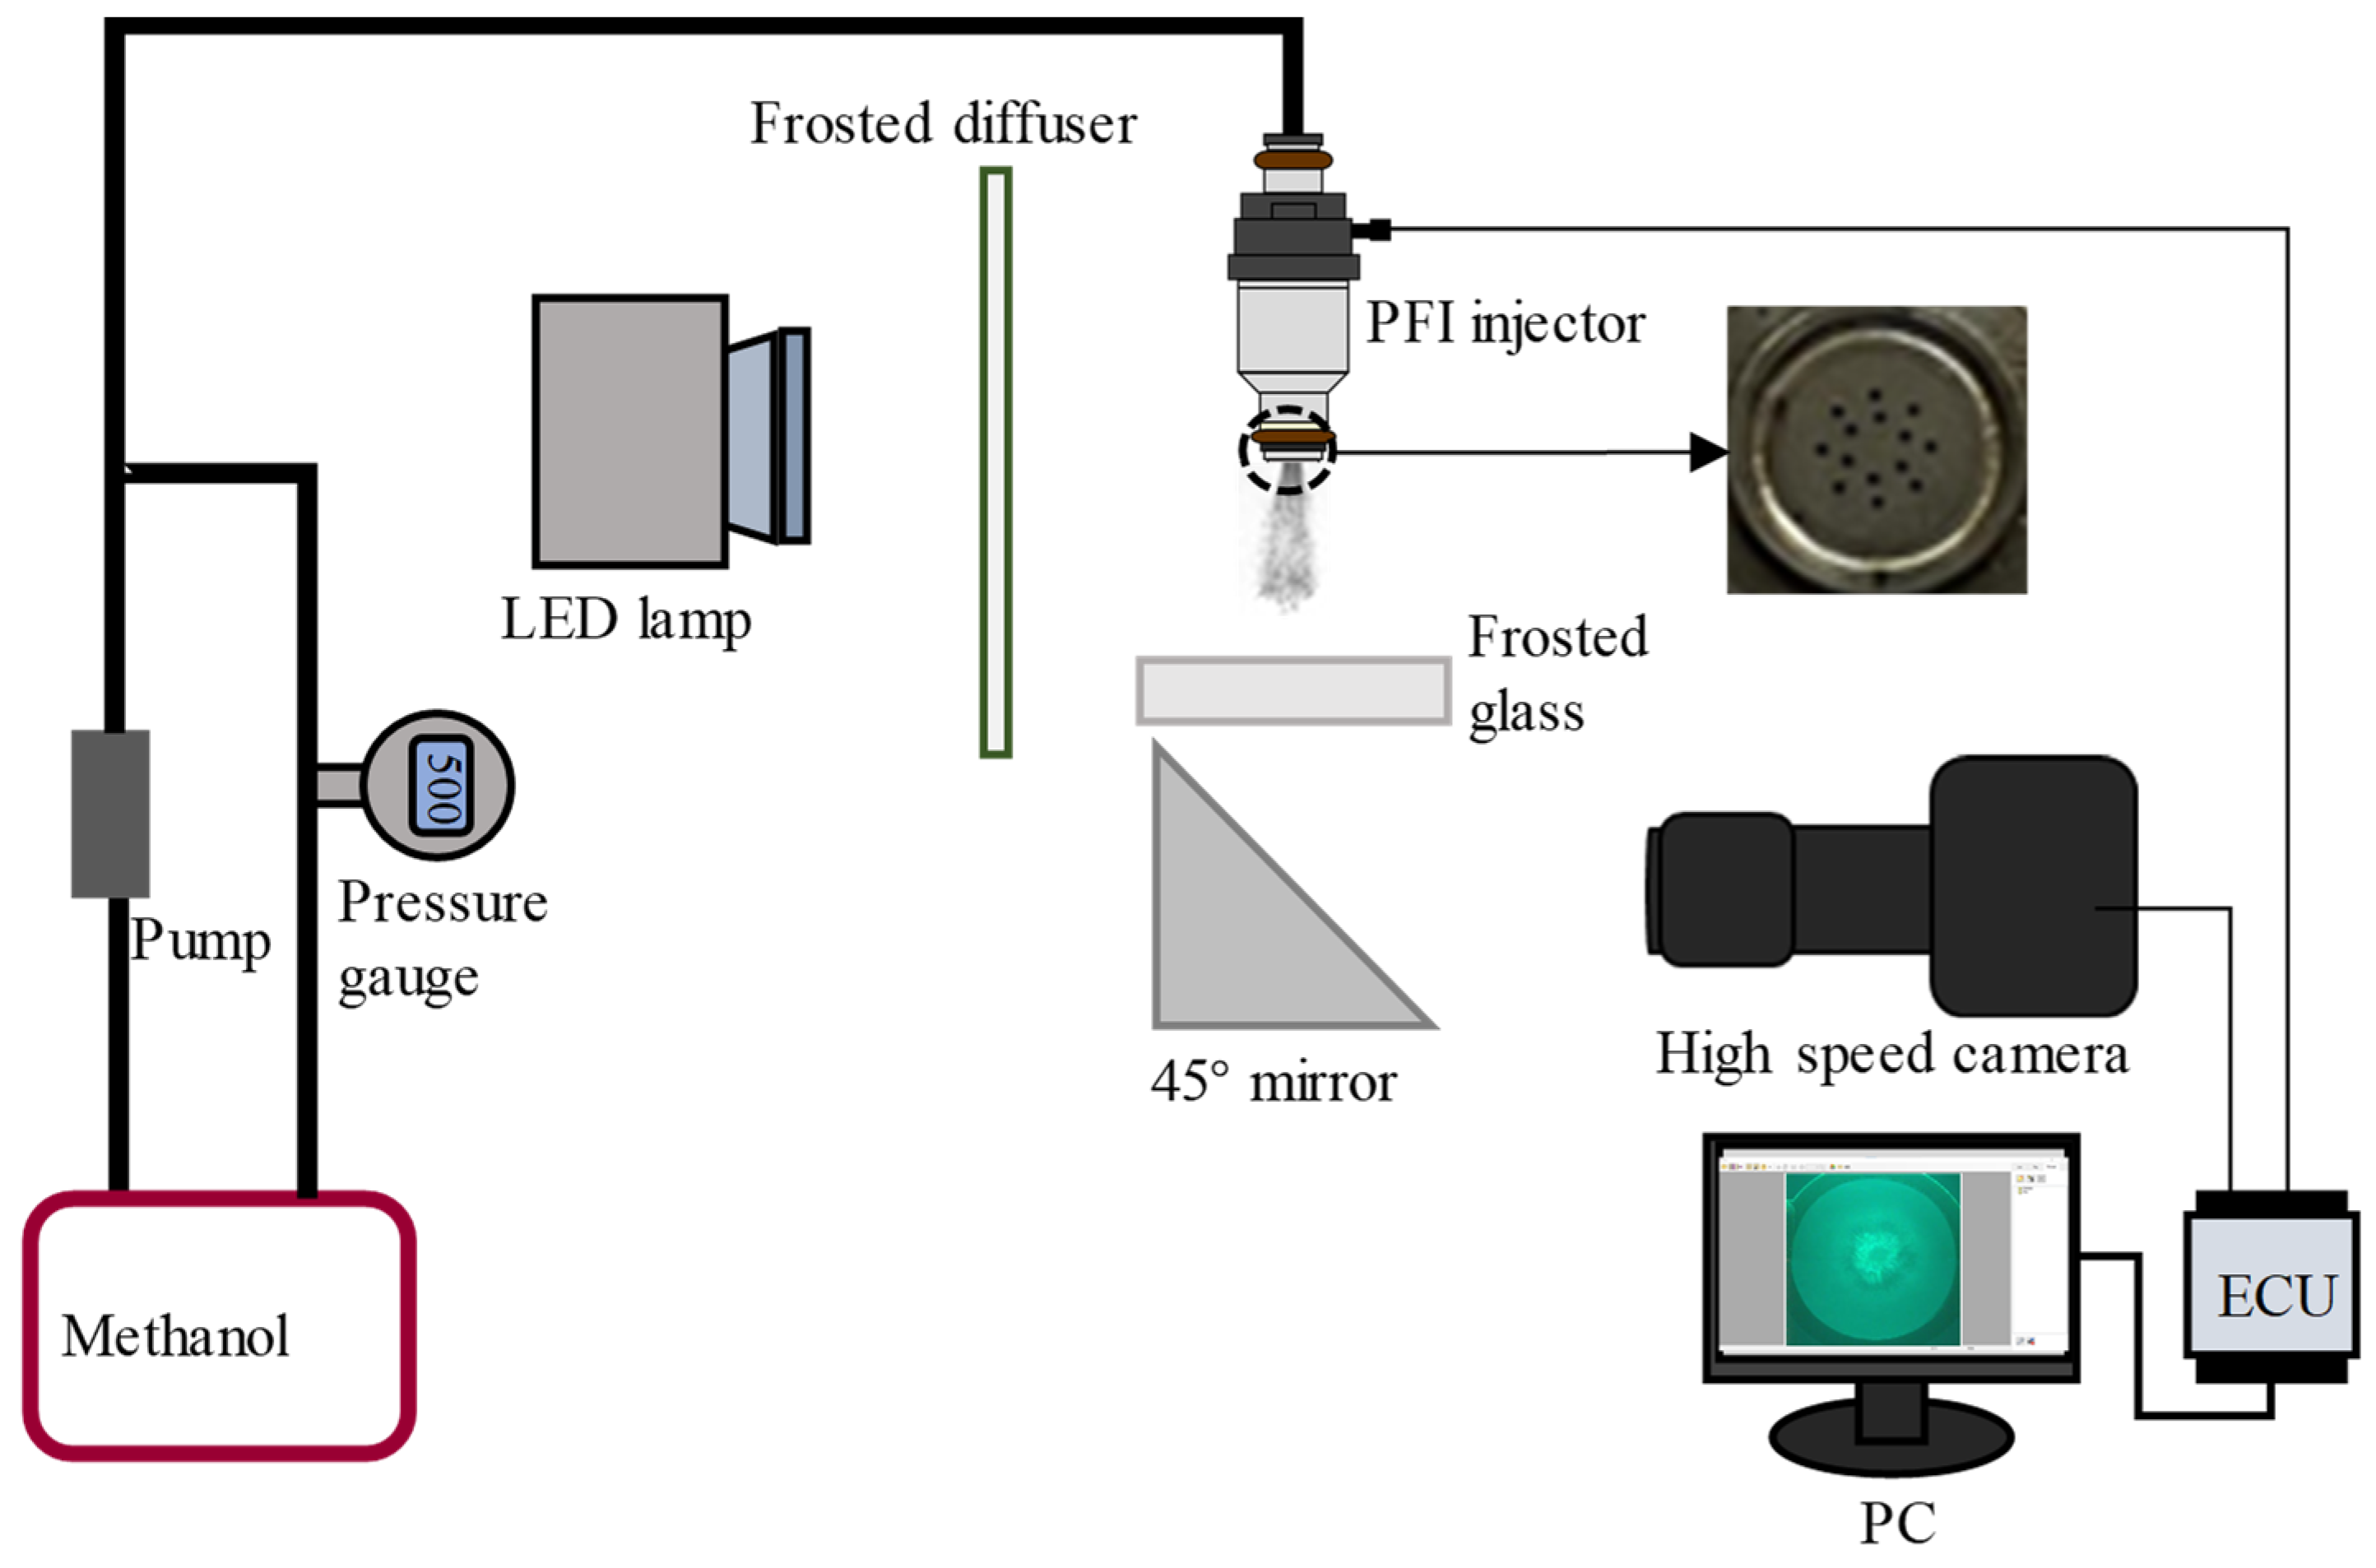
2.1. Experimental Apparatus

The schematic diagram of the experimental setup was given in Figure 1, which consisted of a fuel injection system, a temperature measurement and control system, and an image acquisition system. In this study, a 14-hole low-pressure methanol injector with hole diameters of 0.26 mm was used, of which flow characteristics were given in Figure 2. The injection pulse width and injection time were set in the control software. The injection pressure was controlled by a methanol pump and measured by a pressure gauge (0–1000 kPa, ±1 kPa). A piece of frosted quartz glass with an average roughness of 10.31 μm was placed under the injector as the impact wall. The temperature control system was used to realize different wall temperature conditions, including a box resistance heating furnace, which was used to heat quartz glass, and a temperature sensor (−50–1000 °C, ±0.1 °C) to monitor the glass surface temperature. After the glass was heated to the preset temperature, it was placed on the central tray as soon as possible, and methanol spraying was started. The measurement showed that the temperature difference before and after this process was no more than 2 °C. In the experiment, the DC LED lamp was used as the light source, of which uniformity was further improved by using the acrylic matte diffuser. The side view of the spray was photographed by a diffuse back-illumination (DBI) method [26], and the process of the wall wetting was captured by the camera (Phantom Miro EX4@4000fps) through a 45° mirror.

2.2. Methanol Characteristics and Initial Conditions

Some properties of methanol were listed in Table 1. The laboratory conditions were kept at ambient temperature (283 K) and pressure (101 kPa). Test initial conditions were given in Table 2. As shown, the injection pressure and the wall temperature were set at 300–500 kPa and 293–423 K, covering the actual conditions of a PFI engine under rated condition (500 kPa, 400 K). Referring to previous work, the impingement distance ranges from 62 mm to 120 mm. To reduce the random error, all the tests were repeated five times under each condition.

2.3. Spray Image Processing

In this study, the spray penetration and area were extracted from spray images by using MATLAB codes developed by our group. First, an original image was converted to a grayscale image. After background subtraction, and Wiener filtering [27], the image was binarized using the threshold obtained by the Otsu algorithm [28], and finally, the image parameters were calculated. For all measurement parameters, the averaged results with a statistical error bar calculated from five repeated events were depicted. Figure 3 showed a diagram of typical impinging spray and defined impinging spray height H i and width W i .
For the quantitative study of the adhesive fuel film, the RIM method was used. In a gray image, the adhesive fuel film thickness was obtained with the calibration results of RIM. And adhesive fuel film mass M f was calculated by Equation (1),
M f = ρ 1000 × x , y f T ( x , y ) × τ 2
where ρ is methanol density (0.792 g·cm−3), f is adhesive fuel film area, T ( x , y ) is film thickness (μm) of the ( x , y ) point, and τ 2 is image scale (mm2·pixel−1).

2.4. RIM Calibration

Before analyzing the wall wetting images, according to previous studies [25,29,30], it is the premise that a quantitative relationship is established between the change of the scattered light and the local film thickness at each pixel. The local scattered light change Δ I ( x , y ) at the coordinate point (x, y) is calculated by Equation (2),
Δ I ( x , y ) = 1 I w e t ( x , y ) I d r y ( x , y )
where I w e t ( x , y ) and I d r y ( x , y ) are, respectively, the local intensity of the images with and without adhesive liquid.
At 293 K and 94.7 kPa, the mixed solution of methanol and n-octanol was used to calibrate the RIM method. Figure 4 showed the curve of the average light intensity with time after 0.5 μL solution (99%vol methanol and 1%vol n-octanol) was deposited on the surface of the glass. As illustrated, the process from the beginning of the curve to the lowest intensity was dominated by the solution spread. The rise of the curve indicated that the evaporation was in dominant control [25]. Methanol evaporates faster than n-octanol, resulting in the rising process of the curve undergoing two stages; in stage I, the average light intensity of ROI was increasing rapidly with the evaporation of methanol. At 7.2 s, the growth rate of ROI average light intensity curve slowed down significantly. It could be considered that the methanol completely evaporated at this time, and the subsequent increase of ROI average light intensity was caused by the evaporation process of n-octanol (in stage II). The intersection between the two segments was the calibration point.
Further, the experiment was repeated with deposited different total volumes of mixed solution, many times. The volume and mixing ratio of mixed solution used are given in Table 3.
As shown in Figure 5, the relationship curve between the adhesive fuel film thickness T f and the change of light intensity was obtained. Then, the fitting formula was given in Equation (3), and the R2 was 0.9817.
T ( x , y ) = 7.89872 × Δ I 2 ( x , y ) + 1.12507 × Δ I ( x , y )
In addition, in the early stage of the formation of the adhesive fuel film, the images were overexposed because the light was scattered by droplets in spray, which caused deviations in the image processing results. Therefore, results of adhesive fuel film from RIM only, from 10 ms or 20 ms ASOI, were available for analysis.

3. Results and Discussion

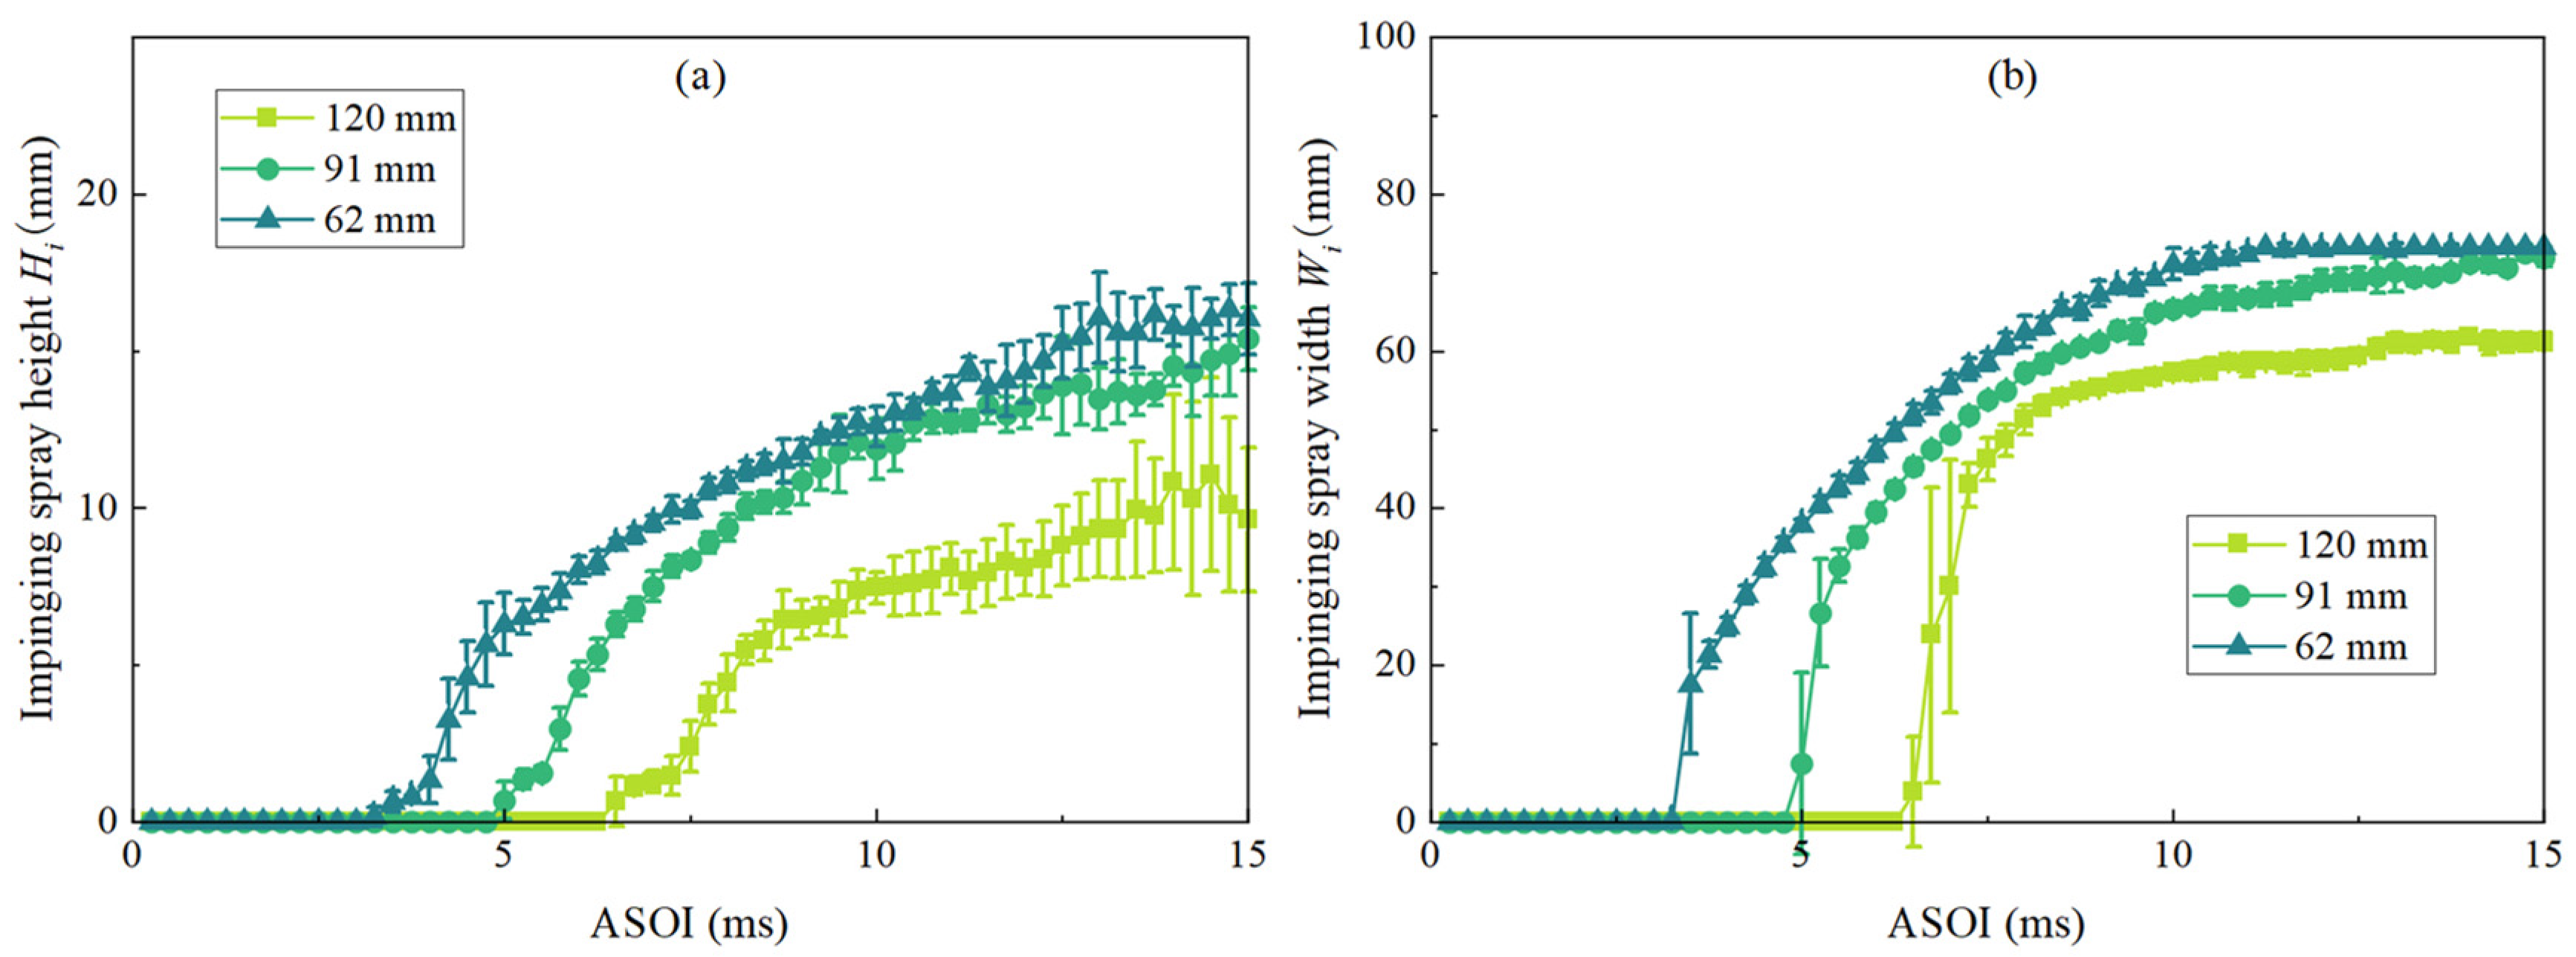
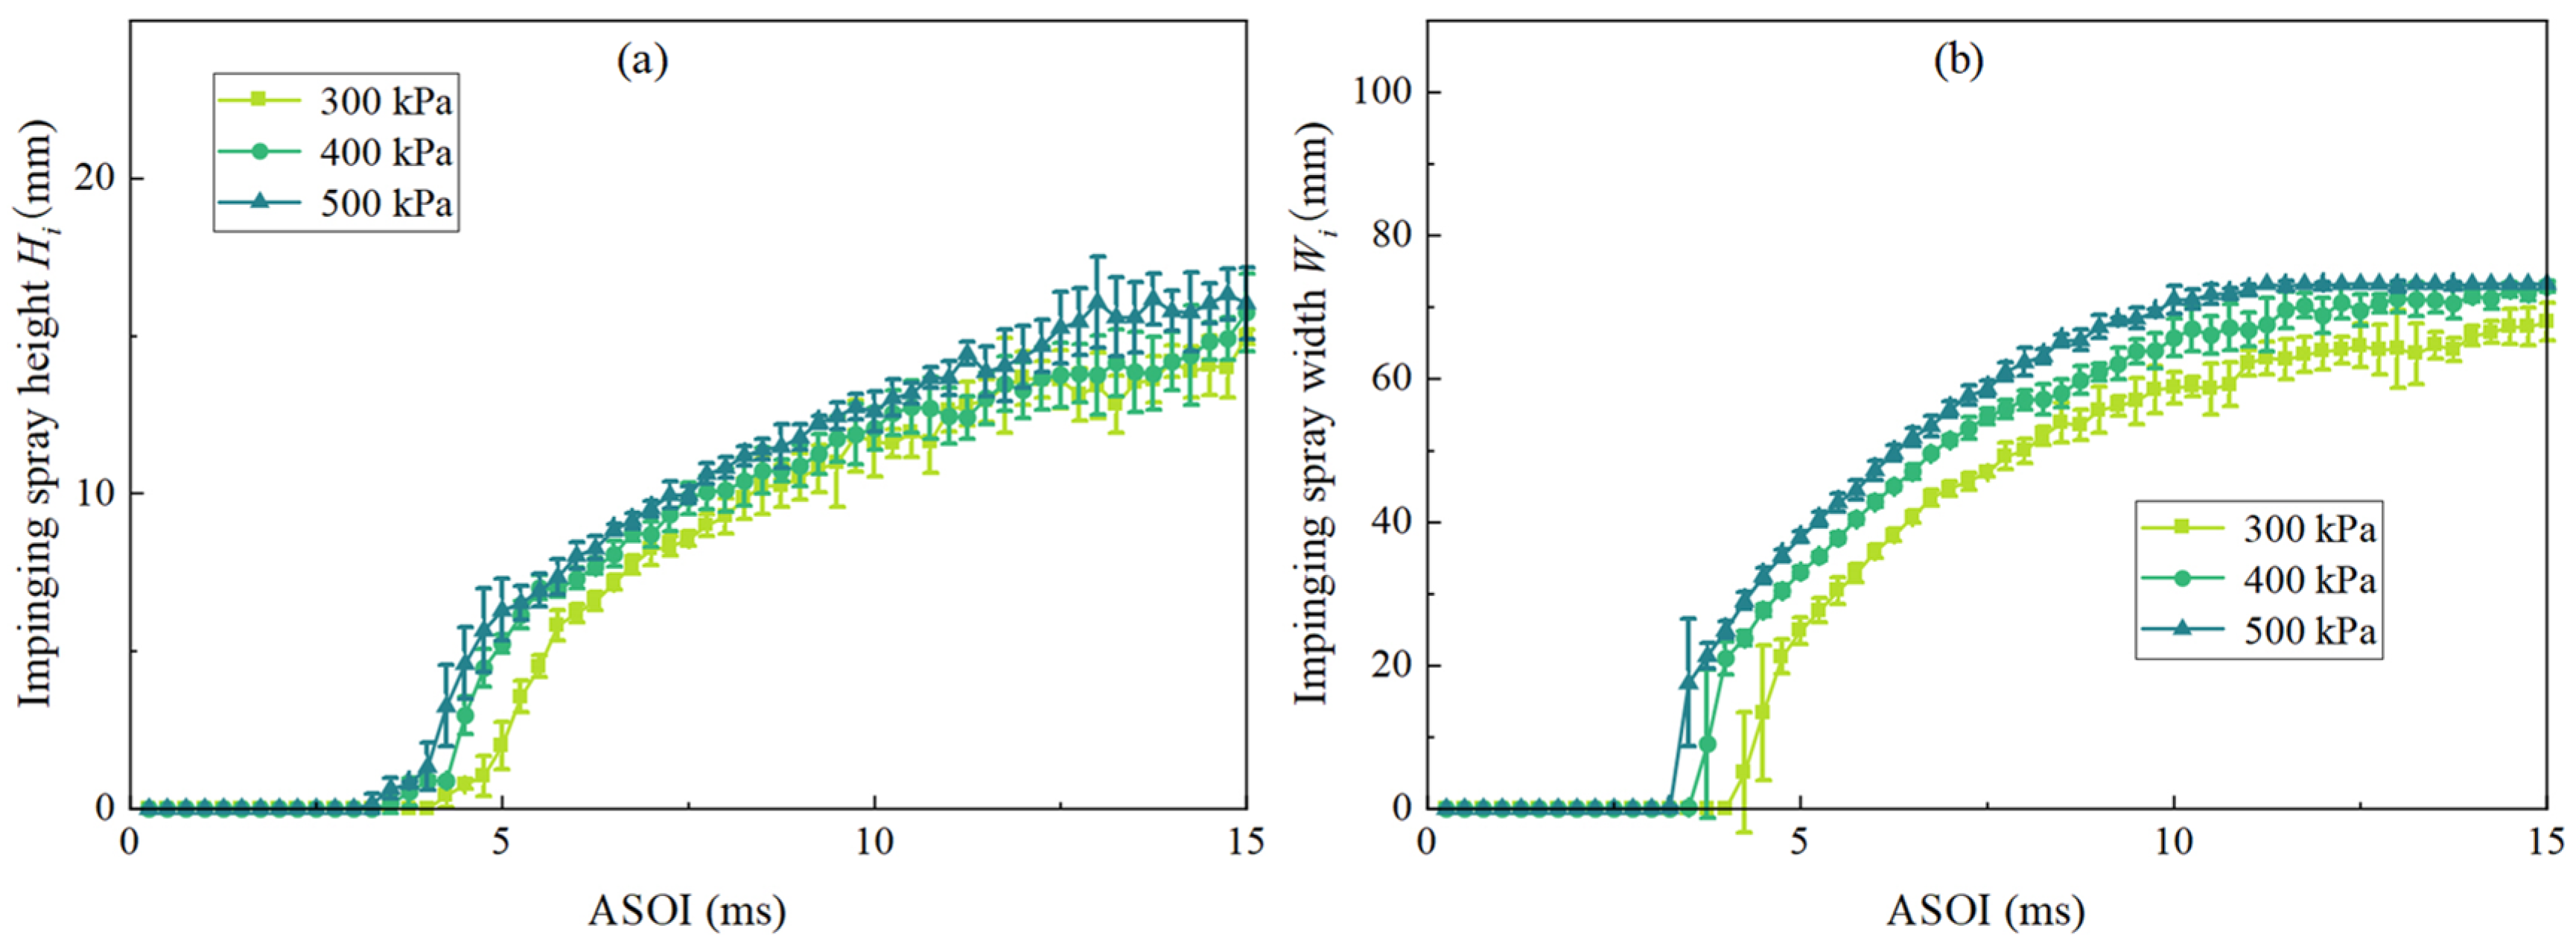
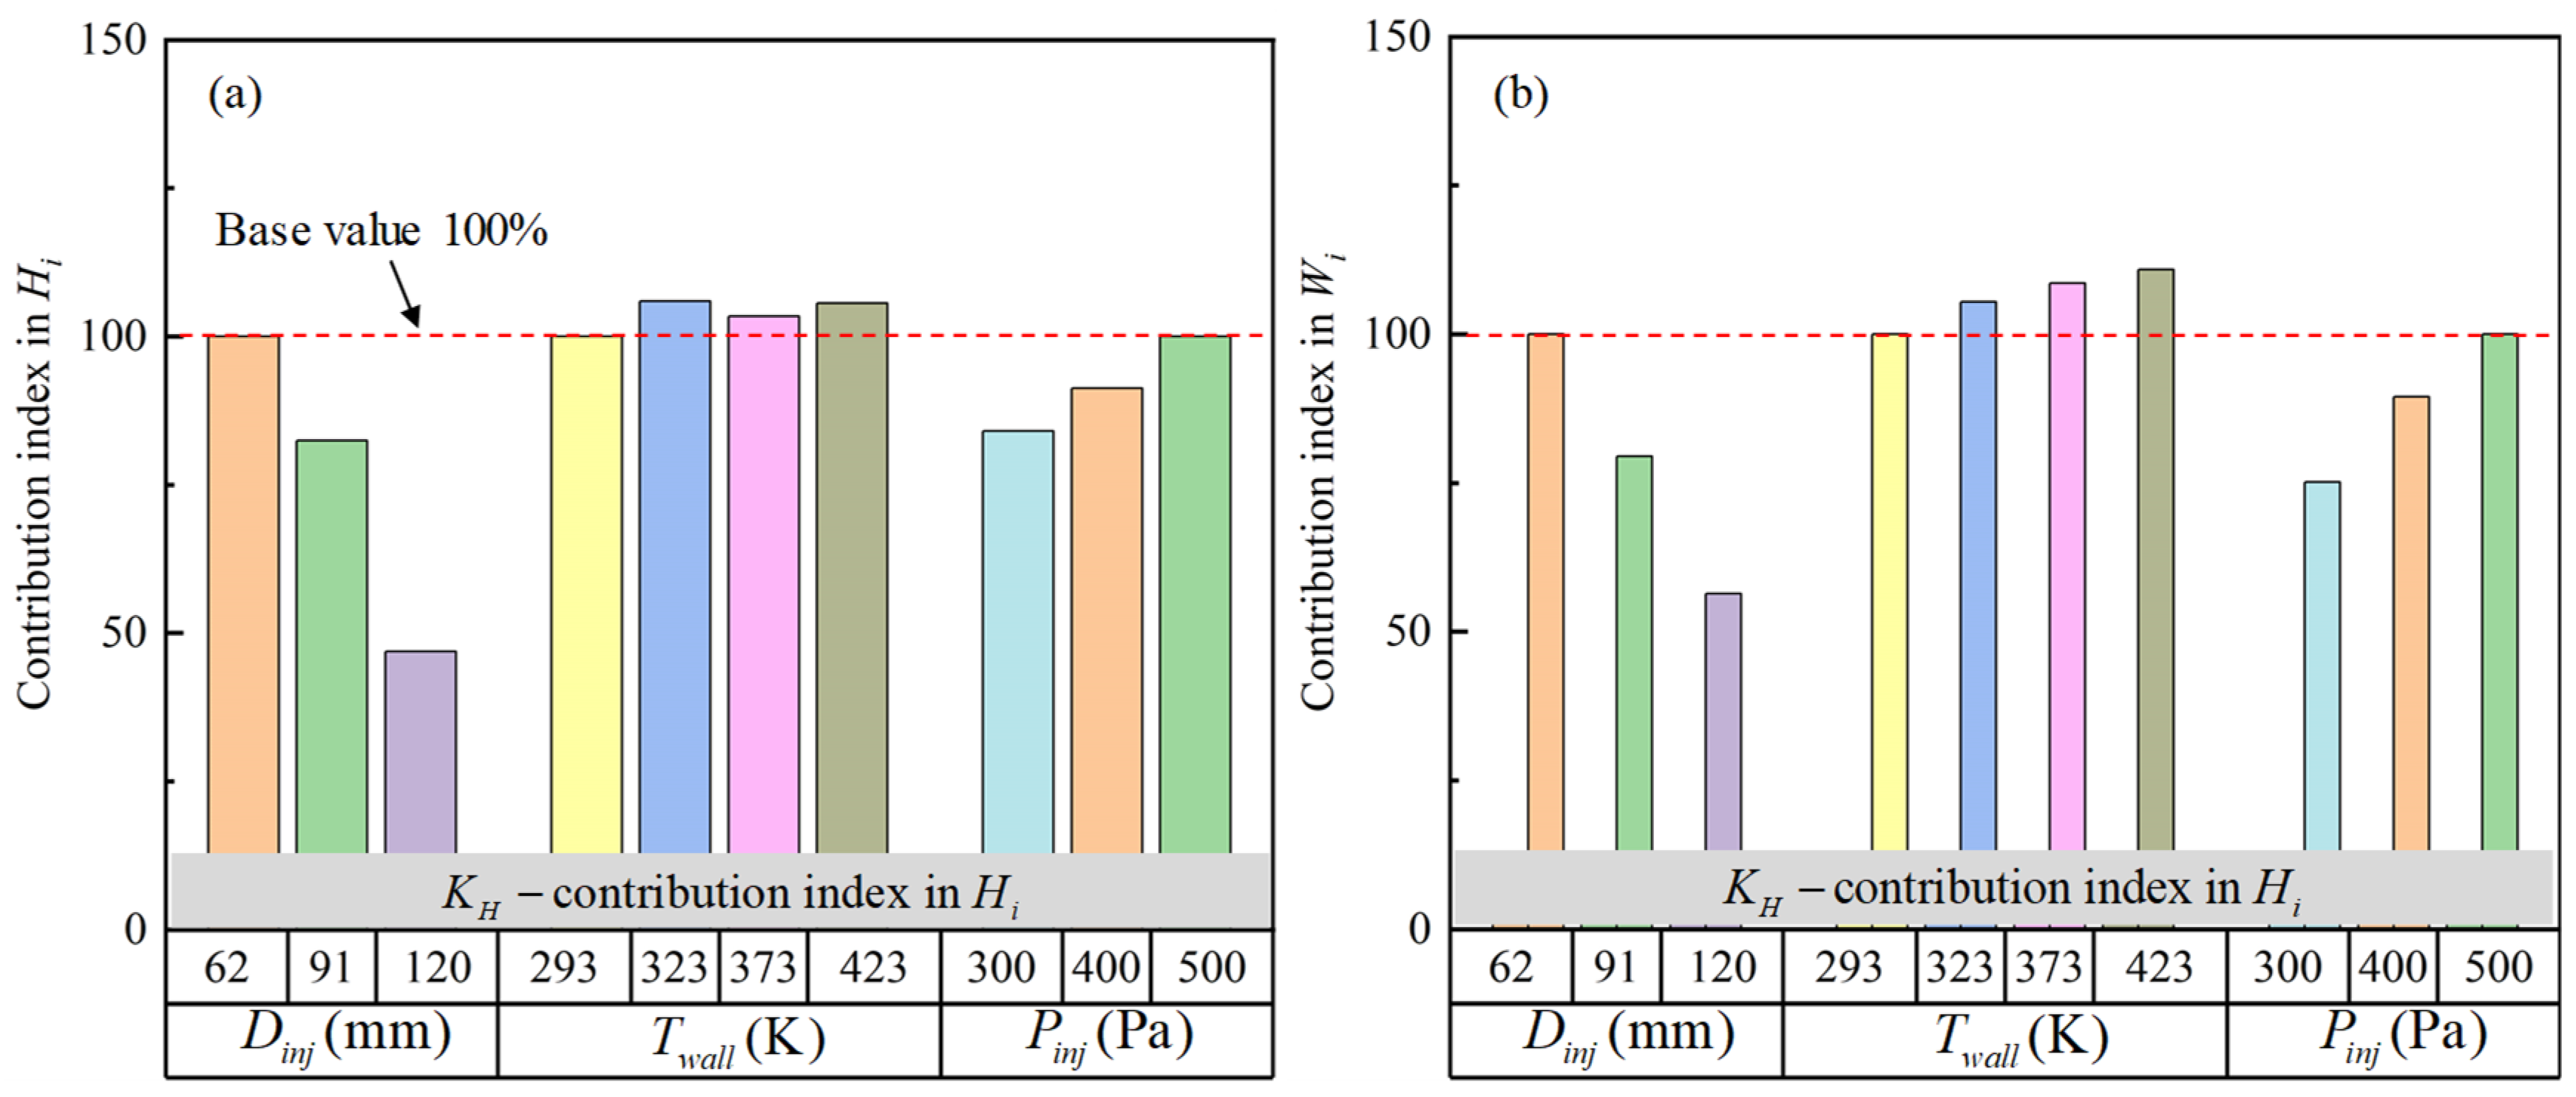
3.1. Macroscopic Behaviors of Spray Impingement

Figure 6 illustrated the impinging spray morphology under different impingement distance D i m p (from 62 to 120 mm). When the spray distance was 62 mm, the overall shape of the imping spray was trapezoidal, and gradually changed to rectangular with the increase of spray distance (120 mm). After the spray was injected, the aerodynamic convergence caused by the relative velocity between it and the surrounding gas led to the secondary fragmentation of the droplets, and also produced aerodynamic resistance to the droplets [14,29], thereby reducing the kinetic energy of spray. The larger the spray distance was, the longer the flight distance spray was, and the energy loss caused by air resistance increased, which slowed down the axial and radial droplet velocity further, causing the deformation of the far end of the spray.
As shown in Figure 7, the change of impinging spray height H i and width W i of spray underwent two stages. The first stage began at the beginning of spray impinging on the wall. With the continuous process of spray impinging the wall, droplets splashed continuously, and H i and W i increased rapidly. The second stage started at the end of the spray impinging the wall. Due to air resistance, the spray diffusion speed gradually decreased, and the growth rate of H i and W i decreased significantly.
Figure 8 showed the impinging spray morphology under different wall temperature T w a l l (from 293 K to 423 K). The three sprays had a similar macro shape with various wall temperature conditions.
Figure 9 showed the changes in Hi and Wi with time. When T w a l l was 323 K, 373 K, and 423 K, Hi was significantly higher than that of the usual temperature wall before 5 ms ASOI. However, in the following time, the changes of Hi corresponding to different T w a l l were similar. Generally, Hi of methanol spray on the wall was positively correlated with T w a l l . Similarly, Wi was positively correlated with T w a l l . However, the relative difference between Wi curves of T w a l l 373 K and 423 K in a short time after the spray impacted the wall is small. After about 6.5 ms ASOI, the growth rate of Wi was gradually lower when T w a l l was 373 K than when T w a l l was 423 K. The reason for the above results was that, on the one hand, the density decreased due to the rise of air temperature near the wall, and the resistance to droplet movement decreased to a certain extent; on the other hand, it was the strengthening of spray secondary atomization caused by the hot wall. This was similar to the previous research results of Li et al. [14].
Figure 10 showed the impinging spray morphology under different injection pressure P i n j (from 300 kPa to 500 kPa). At the same time, after the start of injection, the speed of methanol spray was positively correlated with P i n j .
Figure 11 showed the changes of Hi and Wi with time under different P i n j . Under a higher injection spray pressure, the impact energy of the droplet was higher, and the splashing behavior was more likely to occur after the impact of the wall. Therefore, both Hi and Wi were positively correlated with P i n j . At 15 ms ASOI, the average Hi with the injection pressure of 300 kPa, 400 kPa, and 500 kPa was about 15.0 mm, 15.7 mm, and 16.0 mm, respectively. For Wi, there were obvious differences in the change curves under the three injection pressures. When 300 kPa P i n j was applied, the time required for Wi to reach the limit of vision was at least 33% longer than that when P i n j of 500 kPa was applied.
Further, the contribution indices were used to quantitatively analyze the boundary conditions, say the influence of D i m p , T w a l l , and P i n j on Hi and Wi [14,29]. The contribution index was calculated as Equation (4),
K i = C 1 C × 100 %
where K i was the contribution index in parameter i under boundary conditions; C1 and C were the area between the curves of parameters (like Hi) and abscissa axis, which were obtained by integral. Among them, C represented the integral value obtained under the reference conditions, and C1 represented the integral value obtained under the changed boundary conditions. Thus, if K i is greater than 100%, this indicates that parameters can be increased by changed boundary conditions.
The results of parameters Hi and Wi with various boundary conditions were illustrated in Figure 12. The influence of the three boundary conditions in this study on Hi and Wi of methanol spray was the same. D i m p was the only boundary condition that had a negative correlation with Hi and Wi. Increasing T w a l l gradually increased the Hi and Wi, but when T w a l l rose from 323 K to 423 K, KH (contribution index in Hi) had not changed significantly, indicating that its role in promoting the growth of Hi had been very limited. In addition, it was obvious that the increase of P i n j brought greater impact owing to the increase of droplet velocity.

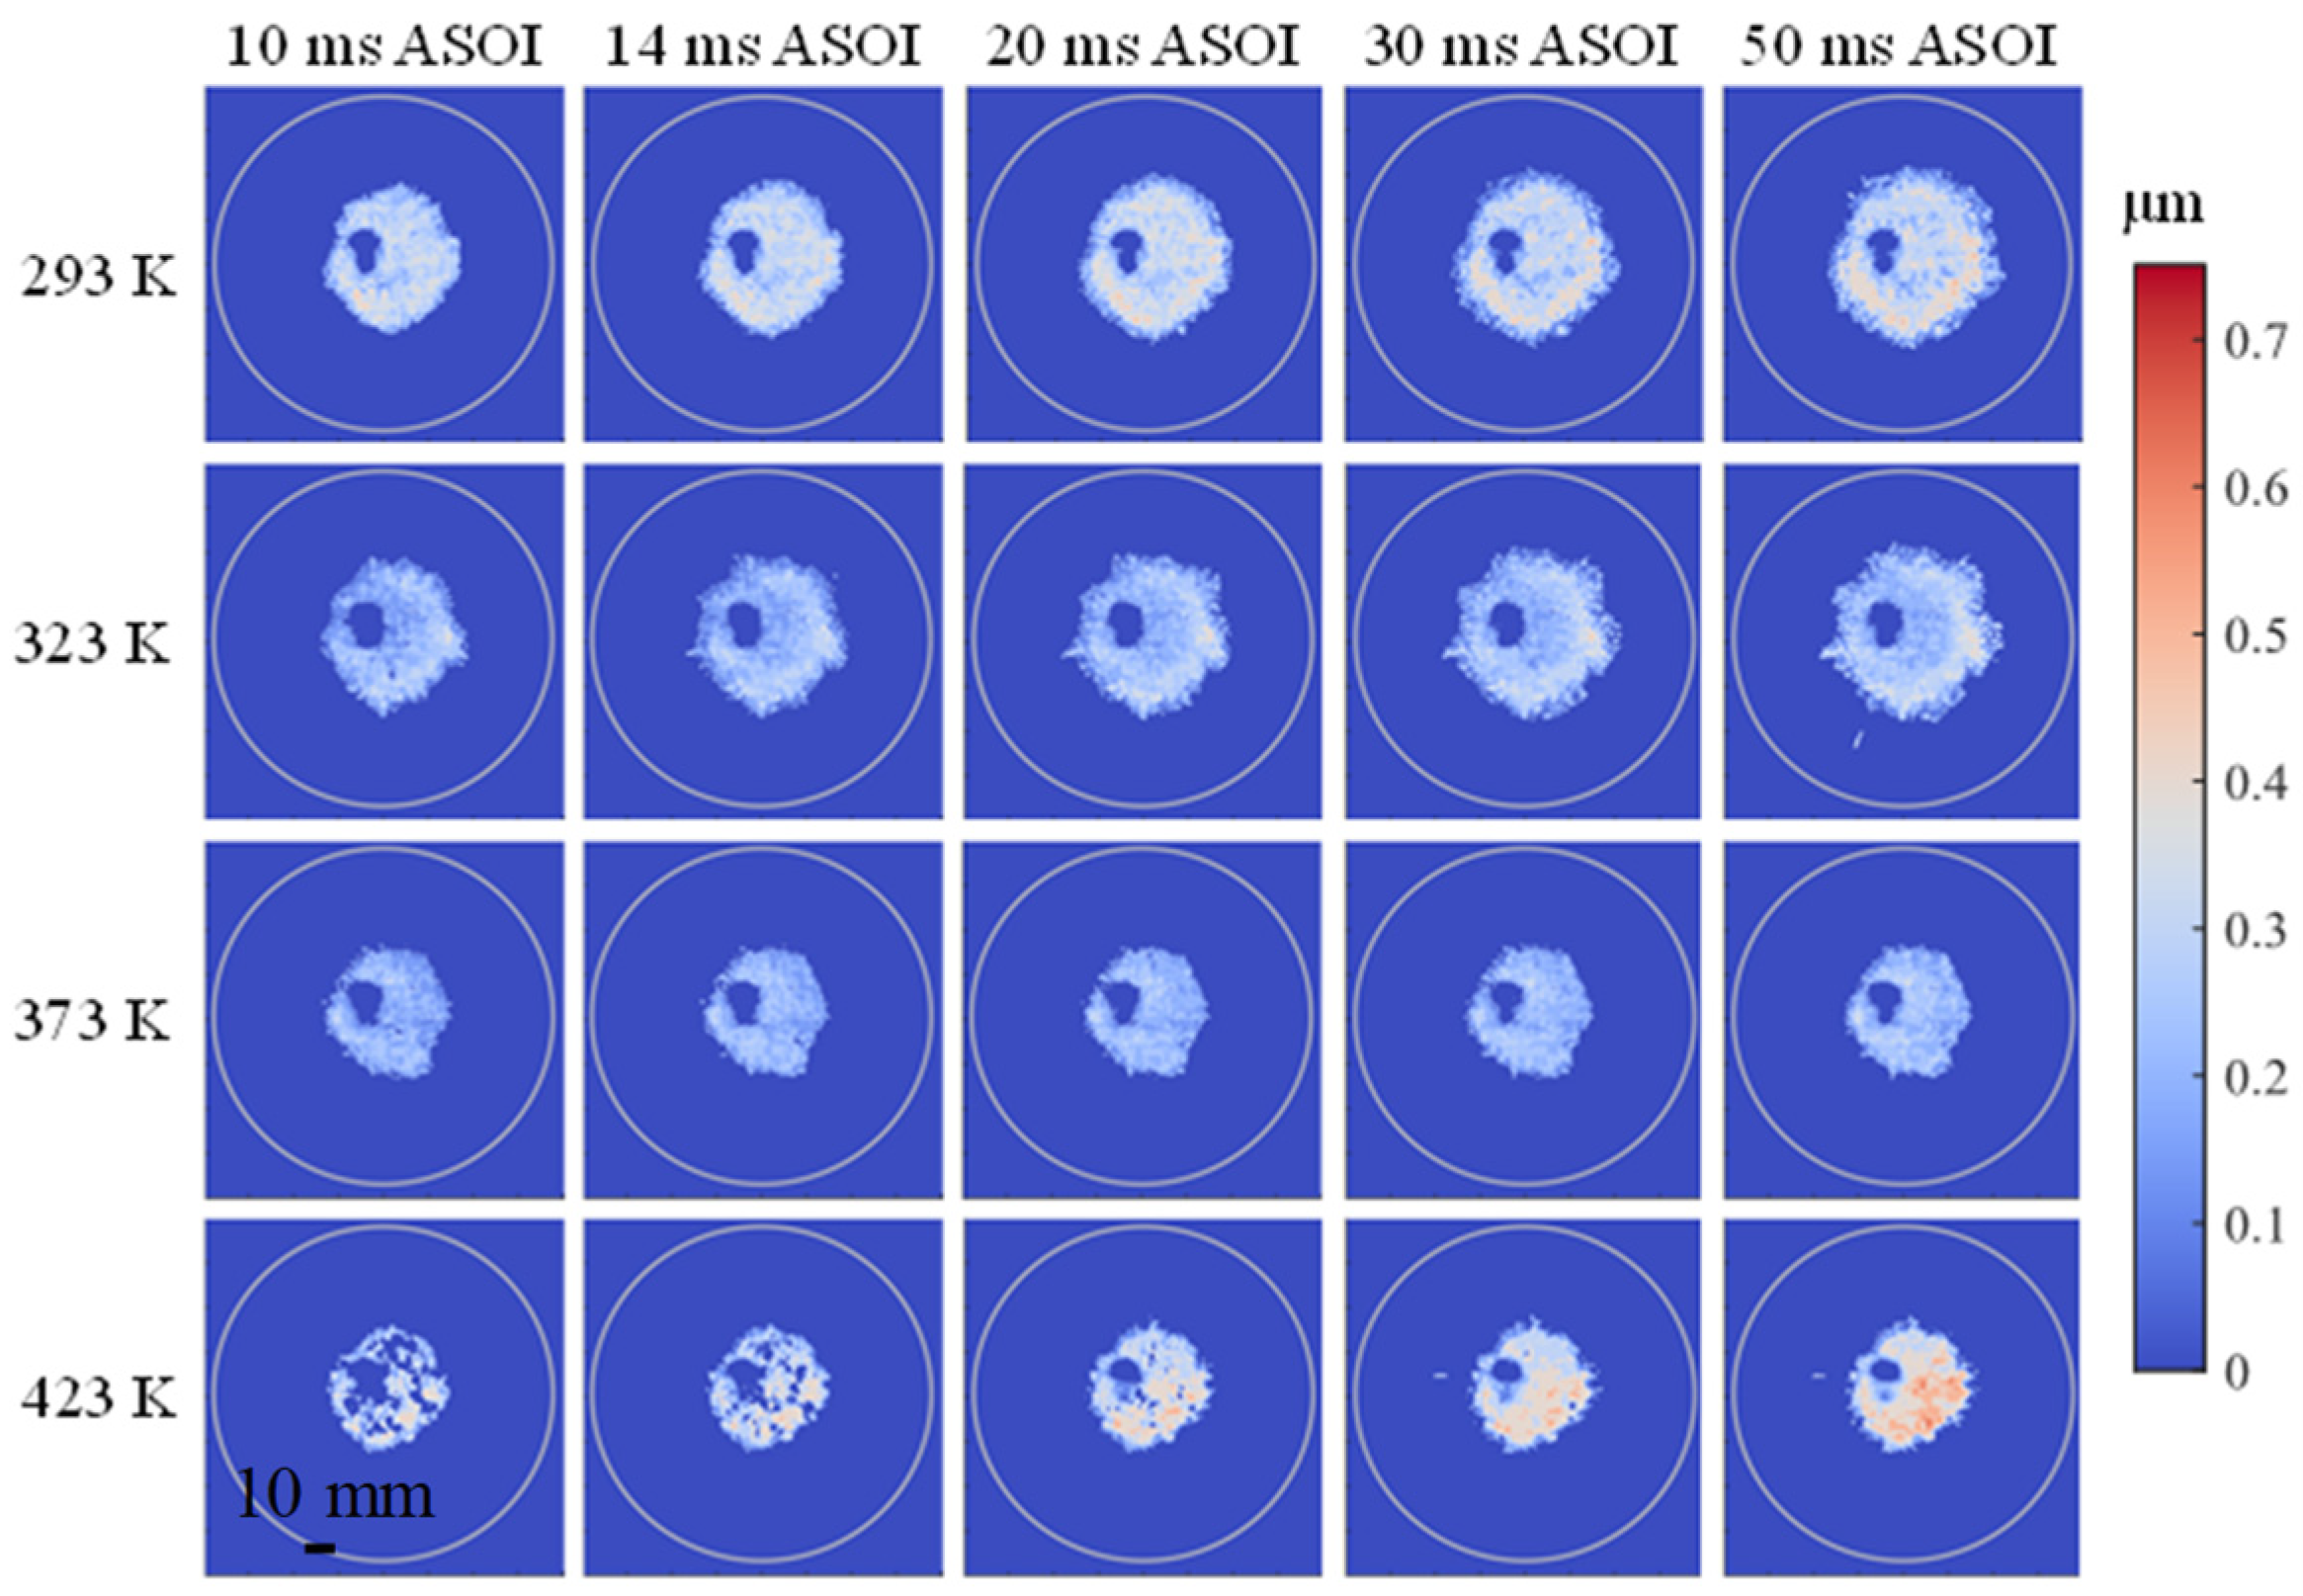
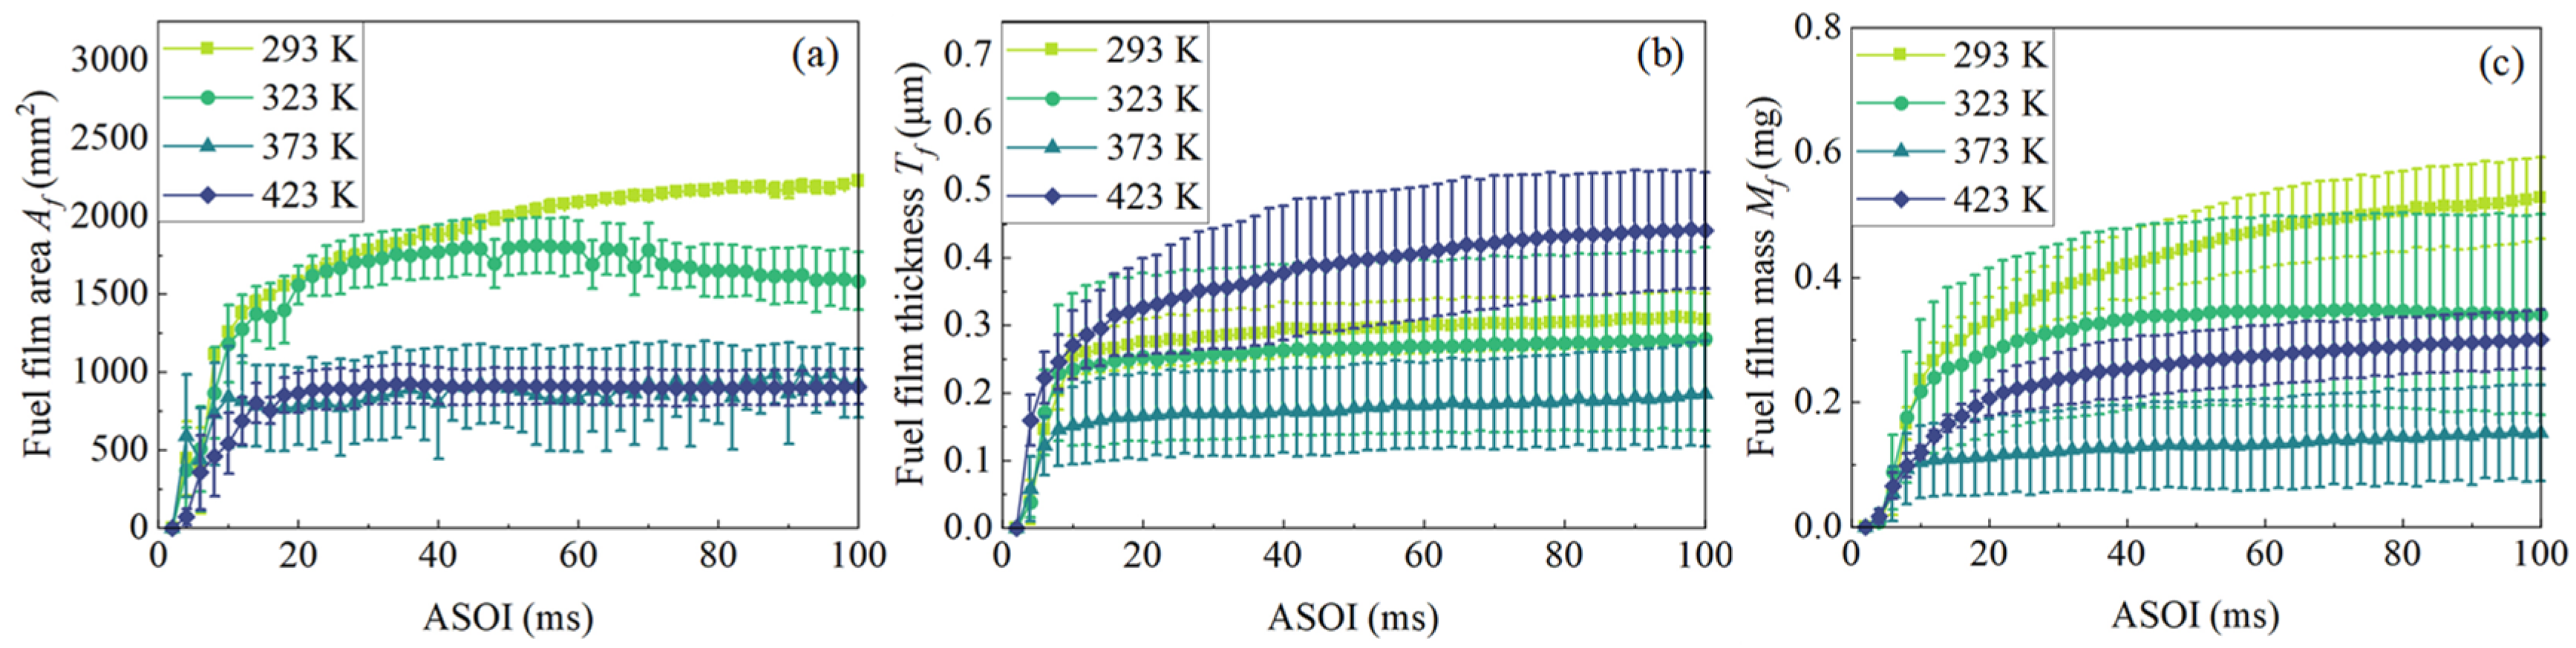
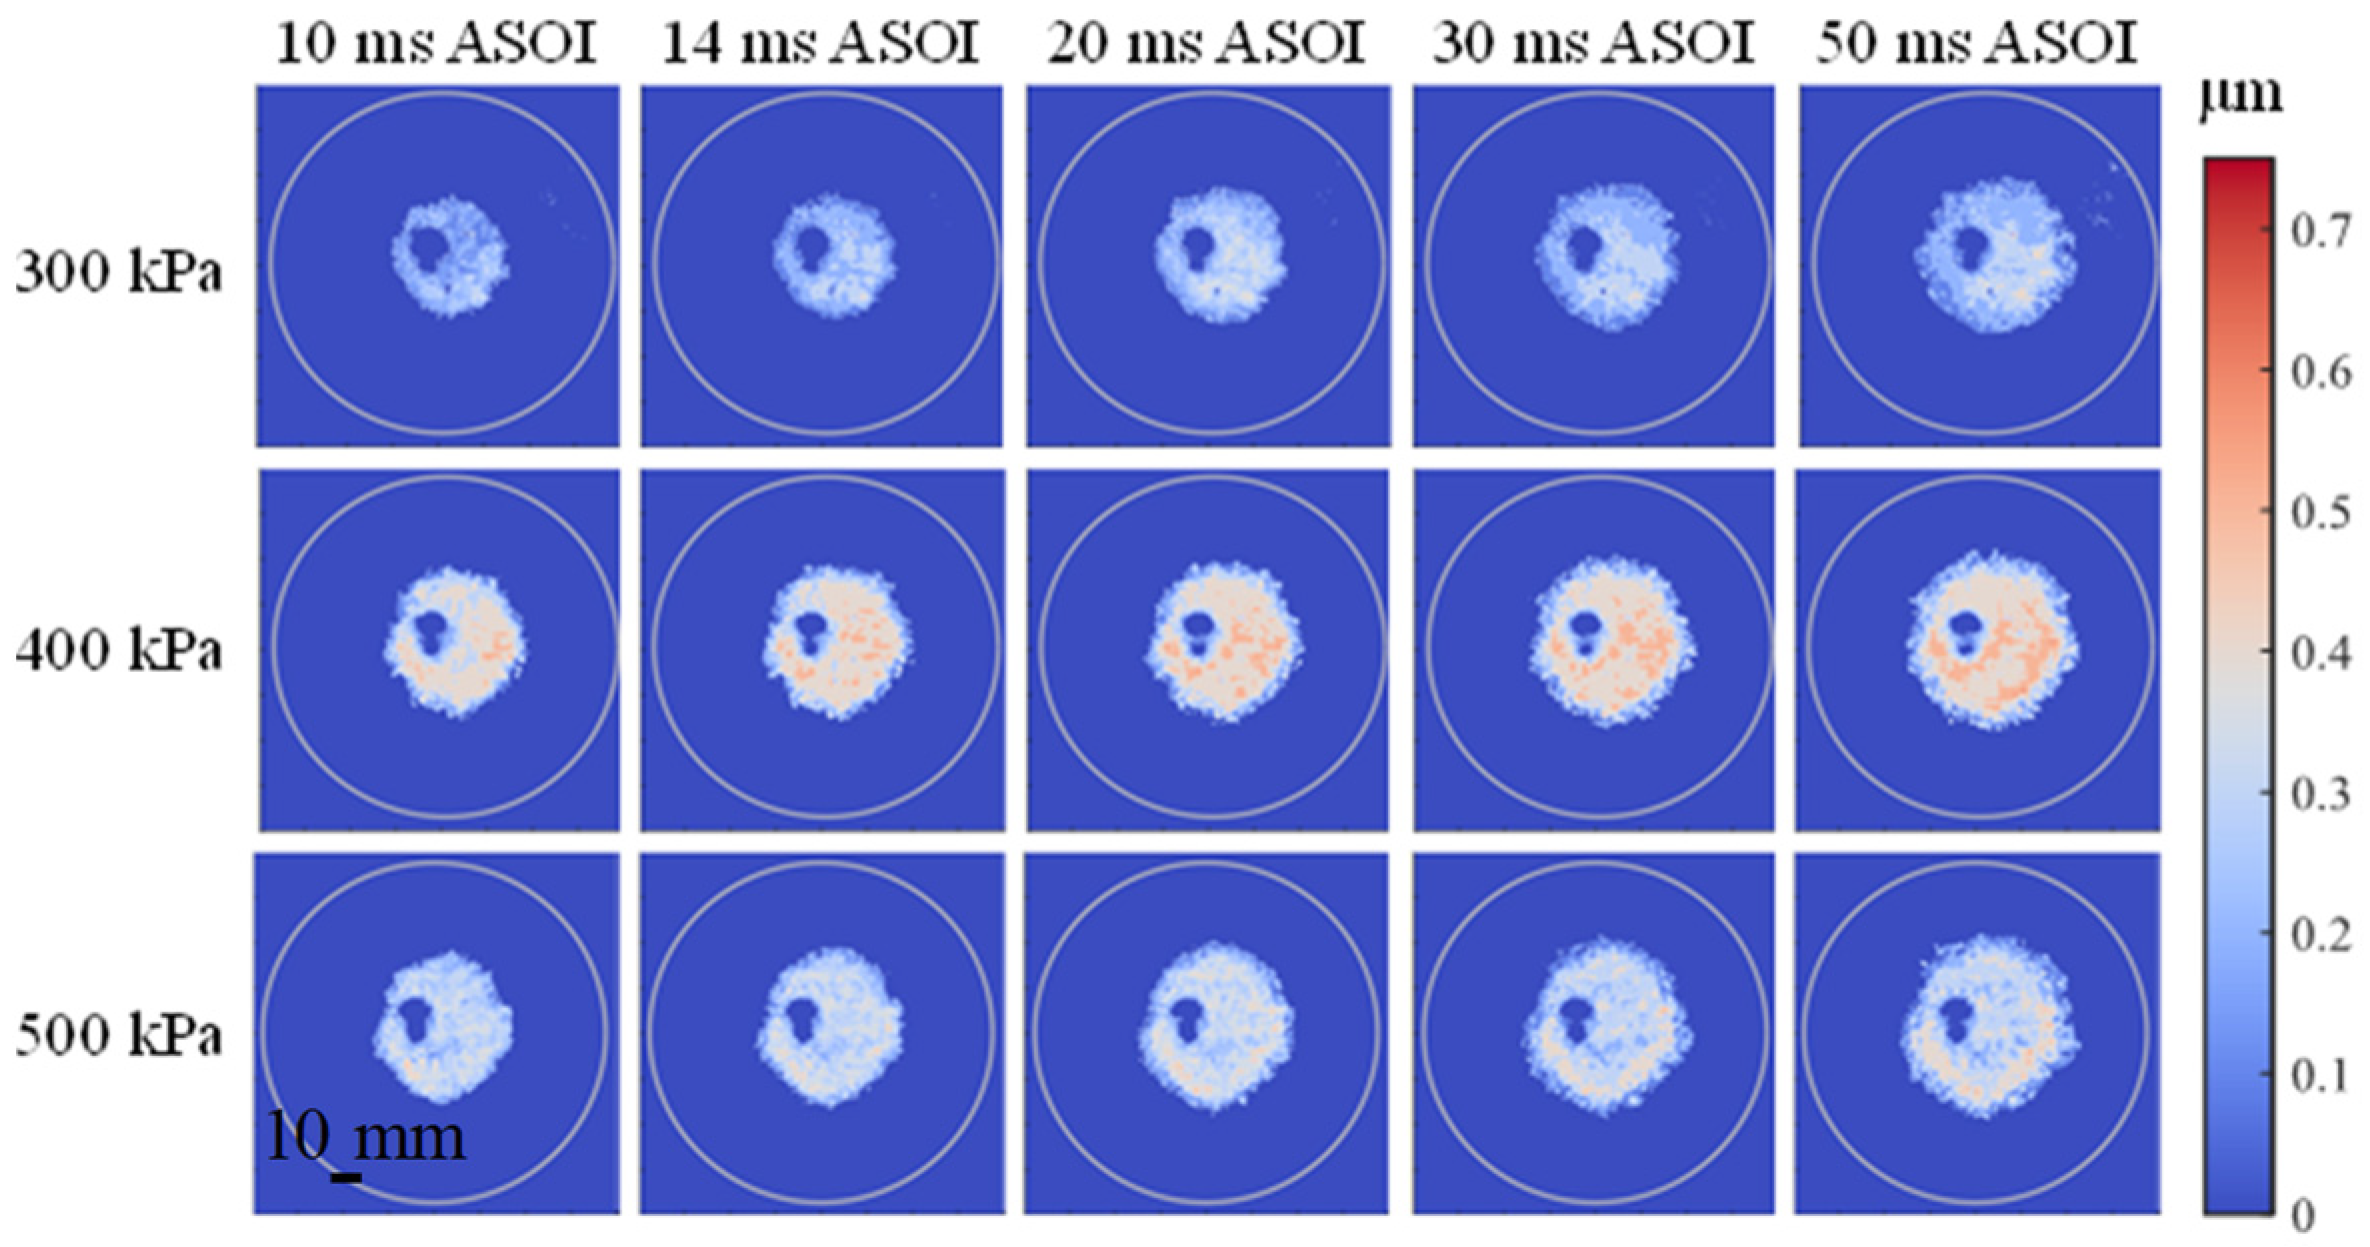
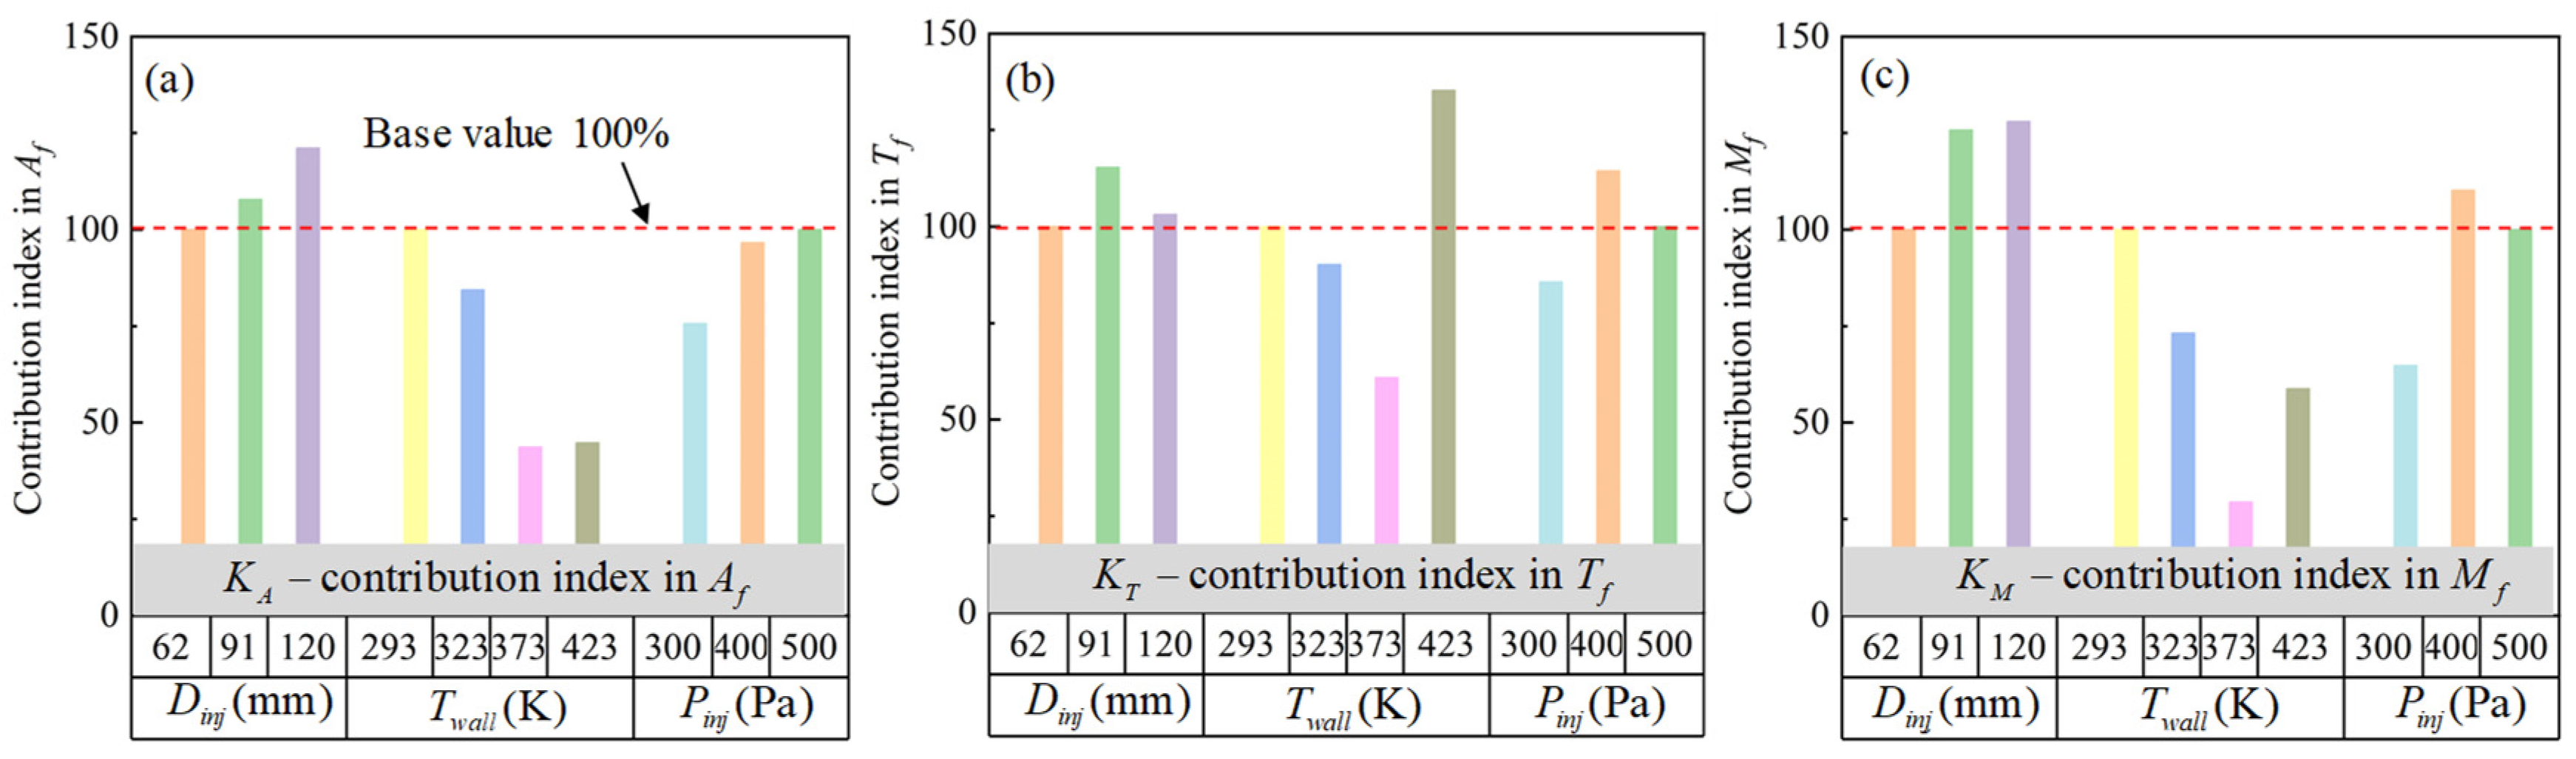
3.2. Fuel Adhesion Formation

Figure 13 showed the effect of impingement distance D i m p on adhesive fuel, and the corresponding relationship between average fuel film thickness T f and color was established in pseudo color images. The range marked by the gray circle was the field of quartz glass. As illustrated, after the formation of fuel adhesion, its area gradually increased with the development of time, as a result of the expansion of primary liquid film and secondary sedimentation of atomized droplets. In addition, the area with large T f was generally located near the edge of the adhesive fuel film, which was caused by the rebound droplets brought back to the wall by the vortex at the edge of the liquid mist at the initial stage of the spray hitting the wall, and then the secondary adhesion at the edge of the liquid film.
Figure 14 showed the quantitative results of fuel film area A f , average fuel film thickness T f , and fuel film mass M f with different D i m p . When D i m p was 120 mm, the spray impingement process has not been completely completed at 10 ms ASOI, so A f was slightly lower than the corresponding A f at D i m p of 91 mm and 62 mm (Figure 14a). With the subsequent droplet wall collision and sedimentation process going on, A f at D i m p of 120 mm overtook that at D i m p of 91 mm and 62 mm at 16 ms ASOI. After that, A f maintained a positive correlation with D i m p . At 100 ms ASOI, A f at 62 mm D i m p was 79.6% and 90.7% of that at 120 mm and 91 mm D i m p , respectively.
The results of T f were relatively complex, as shown in Figure 14b. Compared with the case of 62 mm D i m p , the spray impingement phenomenon occurs after a longer period of time after the start of spraying while D i m p was 120 mm and 91 mm. At 10 ms ASOI, the corresponding T f at these two distances was still rising due to the large settlement of droplets. At the same time, in the early stage of the end of the spray impingement, the adhesive fuel filled the deeper “gullies” on the frosted surface during the movement, resulting in the increase of T f [31]. However, on the whole, when the injector was at the height of 91 mm, it corresponded to the thickest T f in the three D i m p , and the distance condition of 62 mm corresponded to the thinnest T f in the three D i m p .
The trend of M f was similar to that of A f (Figure 14c). At 10 ms ASOI, M f at the height of 120 mm was significantly lower than that at 91 mm and 62 mm D i m p . The reverse override was completed at 26 ms ASOI. After that, A f showed a positive correlation with D i m p . The more kinetic energy loss of the droplets was caused by the higher the spray distance. Therefore, more droplets tended to adhere after impacting the wall, rather than “splash”. At 100 ms ASOI, M f for the 62 mm Dimp data was only 75.9% and 79.7% of that at the distance of 120 mm and 91 mm, respectively.
Figure 15 showed pseudo-color images of adhesive fuel under the different wall temperature of T w a l l . When the wall temperature was 423 K, the adhesive fuel boiled, which had a great impact on the intensity, and then interfered with image recognition. After 20 ms ASOI, the overexposure caused by fuel adhesion boiling was no longer significant, so the data of 20 ms ASOI to 100 ms ASOI were discussed. The fuel film area A f basically showed a negative correlation with the wall temperature (Figure 16a), but the trend of A f corresponding to 373 K and 423 K T w a l l was almost the same, which was caused by that part of the adhesive fuel extending outward at the edge and droplets settling at the periphery of the liquid film area where it evaporated quickly with higher T w a l l .
As shown in Figure 16b, film thickness T f showed the non-monotonical behaviors versus wall temperature T w a l l say between 293 K–373 K, T f had a negative correlation with T w a l l , but for T w a l l of 423 K, T f was the largest of the four temperature conditions. Combined with the boiling phenomenon mentioned above at 423 K, it indicated that the non-monotonical trend was a result of the competition between a higher plate droplet temperature difference and a lower heat convection coefficient caused by partial film boiling. When the wall temperature rose above the critical value (here, the critical value was between 373 K and 423 K), although the increase of wall temperature and droplet temperature difference increased the evaporation rate, the effect of the decrease of heat transfer coefficient caused by partial film boiling at this time was more significant, which reduced the actual evaporation rate.
The adhesive fuel mass M f was mainly affected by the evaporation rate of methanol and the settling rate of atomized droplets in the air. As shown in Figure 16c, for the case of 293 K T w a l l , the evaporation rate of droplets was lower than the sedimentation rate of atomized droplets in the air, so the quality of the liquid film was constantly rising. M f at T w a l l of 323 K and 373 K did not change significantly with time, indicating that the evaporation rate of methanol was the same as the sedimentation rate of droplets. These two factors offset each other to a certain extent. After T w a l l further increased to 423 K, M f began to rise slowly with time, indicating that under this working condition, the promotion effect of wall temperature on secondary crushing was slightly greater than that on methanol evaporation. In addition, M f was negatively correlated with the wall temperature from 293–373 K. However, when T w a l l further rose to 423 K, the corresponding M f was greater than that under 373 K T w a l l at the same ASOI time. The main reason for this phenomenon was that adhesive fuel after the methanol spray impacted the wall temporarily underwent partial film boiling. Compared with the nuclear boiling under T w a l l of 373 K, the droplets were separated from the wall by a vapor layer (the ‘Leidenfrost’ effect), resulting in the reduction of methanol vaporization efficiency during this time.
Figure 17 showed the pseudo color images of fuel adhesion formation under different injection pressure P i n j . Figure 18 gave the time-dependent curves of A f , T f and M f obtained from image analysis. Similar to results of pseudo color images, the two working conditions of 400 kPa P i n j and 500 kPa P i n j showed similar change of A f within the studied time range (Figure 18a), however, when P i n j was 300 kPa, A f was significantly lower than that of the other conditions. Compared with P i n j of 300 kPa, T f (Figure 18b) and M f (Figure 18c) at P i n j of 400 kPa increased. When P i n j was further increased to 500 kPa, T f and M f were lower than those at 400 kPa, as a result of which the droplet velocity increased and the kinetic energy when hitting the wall was greater; more droplets tended to splash rather than adhere. At 100 ms ASOI, under 300 kPa, 400 kPa and 500 kPa P i n j , the percentage of adhesive fuel mass in the total injection volume was 1.5%, 2.2% and 1.9%, respectively.
Figure 19 illustrated the contribution indices of different boundary conditions in A f (Figure 19a), T f (Figure 19b) and M f (Figure 19c), respectively, where A f , T f and M f under 62 mm D i m p , 293 K T w a l l , 500 kPa P i n j were set as the base values, that is, K A , K T , and K M of the values were 100%.
Figure 19a showed that among the three boundary conditions, only T w a l l had a negative correlation with A f . Other boundary conditions were positively correlated with A f . The T f was affected by complex factors, so it did not show a strict positive or negative correlation for any boundary condition, but was largely affected by the relative size of A f and M f , as shown in Figure 19b.
As shown in Figure 19c, D i m p was positively correlated with M f . When D i m p was less than 373 K, M f decreased with the increase of D i m p , but when D i m p reached 423 K, M f rebounded.
In fact, the temperature difference between the wall and the droplet mainly affects the evaporation rate of the adhesive fuel film. However, whether the impinging spray is splash or adhesion depends on the Weber number of the droplet [32]. When the Weber number is higher, the spray tends to splash rather than adhere. Here, the decrease of the impingement distance and increase of the injection pressure led to higher We, thereby the spray splash part increased, and the adhesion part decreased, which can be evidenced by the observation that with the reduction of the impingement distance (Figure 7 and Figure 14) and the increase of the injection pressure (Figure 11 and Figure 18), the impinging spray height Hi increased and adhesive fuel reduced.

4. Conclusions

In this paper, the influence of the spray distance (Dimp), wall temperature (Twall), and injection pressure (Pinj) on macro characteristics and wall adhesion characteristics of methanol spray was studied experimentally. The main conclusions were as follows,
(1) The change of Dimp had a great influence on the shape of spray that, with the increase of Dimp, the overall shape of spray before impacting the wall changed from conical to cylindrical. In addition, due to the increase of Dimp, the action time of air resistance on spray was prolonged, resulting in greater kinetic energy loss, and more droplets turned from “splash” to “adhesion” after impinging. Therefore, Hi and Wi were negatively correlated with Dimp, but Mf was positively correlated with Dimp.
(2) There were non-monotonical behaviors of the film characteristics versus wall temperature due to a competition between a higher plate droplet temperature difference and a lower heat convection coefficient caused by partial film boiling. Af, Tf and Mf were negatively correlated with Twall. However, when Twall continued to rise from 373 K to 423 K, the Leidenfrost effect appeared, increasing Tf and Mf.
(3) Hi and Wi were positively correlated with Pinj. The increase of Pinj also led to a larger Af, but when Pinj was 400 kPa, it corresponded to the highest Tf and Mf. When Pinj was further increased to 500 kPa, the increase of droplet kinetic energy also led to the “splash” behavior of film-forming droplets, resulting in the decline of Tf and Mf.
This study is helpful in further improving the accuracy of the numerical methanol engine model and optimizing the injection strategy of methanol engine. In addition, since the actual injection angle of most PFI engines is around 30 degrees, the effect of the injection angle will be further studied later.

Author Contributions

Y.-J.Z.: Conceptualization, data curation, writing—original draft, writing—review and editing. Y.-J.W.: funding acquisition, conceptualization, writing—review and editing. H.J.: writing—review and editing. S.-H.L.: funding acquisition, conceptualization. All authors have read and agreed to the published version of the manuscript.

Funding

This research was funded by [the National Natural Science Foundation of China] grant number [52176128] and [the Shaanxi Provincial Key R&D Program] grant number [2019ZDLGY15-10]. And The APC was funded by [the National Natural Science Foundation of China (Grant Nos. 52176128)]

Institutional Review Board Statement

Not applicable.

Informed Consent Statement

Not applicable.

Data Availability Statement

The data presented in this study are available on request from the corresponding author.

Acknowledgments

The work in Xi’an Jiaotong University was supported by the National Natural Science Foundation of China (Grant Nos. 52176128) and the Shaanxi Provincial Key R&D Program (Grant No. 2019ZDLGY15-10).

Conflicts of Interest

The authors declare no conflict of interest.

Nomenclature

ASOIafter the start of the injection
I ( x , y ) the light intensity of the ( x , y ) point
T ( x , y ) the adhesive fuel film thickness of the ( x , y ) point
RIMRefractive index matching
GDIGasoline direct injection
PFIPort fuel injection
K Contribution index
H i Impinging spray height
W i Impinging spray width
P i n j Injection pressure
T i n j Injection pulse width
T w a l l Wall temperature
D i m p Impingement distance
T f Average fuel film thickness
M f Fuel film mass
A f Fuel film area
f Adhesive fuel film

References

  1. Moreira, A.; Moita, A.; Panão, M. Advances and challenges in explaining fuel spray impingement: How much of single droplet impact research is useful? Prog. Energy Combust. Sci. 2010, 36, 554–580. [Google Scholar] [CrossRef]
  2. Katsura, N.; Saito, M.; Senda, J.; Fujimoto, H. Characteristics of a Diesel Spray Impinging on a Flat Wall. SAE Trans. 1989, 98, 252–268. [Google Scholar] [CrossRef]
  3. Arcoumanis, C.; Chang, J.-C. Flow and Heat Transfer Characteristics of Impinging Transient Diesel Sprays. SAE Trans. 1994, 103, 1092–1116. [Google Scholar] [CrossRef]
  4. Stratmann, J.; Martin, D.; Unterlechner, P.; Kneer, R. Near-Wall Characteristics of an Impinging Gasoline Spray at Increased Ambient Pressure and Wall Temperature. At. Sprays 2009, 19, 997–1012. [Google Scholar] [CrossRef]
  5. Mathews, W.S.; Lee, C.F.; Peters, J.E. Experimental Investigations of Spray/Wall Impingement. At. Sprays 2003, 13, 20. [Google Scholar] [CrossRef]
  6. Park, J.; Xie, X.; Kim, H.; Lai, M.-C. Visualization and measurement of a narrow-cone DI gasoline spray for the impingement analysis. Int. J. Automot. Technol. 2004, 5, 221–238. [Google Scholar] [CrossRef]
  7. Montanaro, A.; Allocca, L.; Lazzaro, M.; Meccariello, G. Impinging Jets of Fuel on a Heated Surface: Effects of Wall Temperature and Injection Conditions; SAE International: Warrendale, PA, USA, 2016. [Google Scholar] [CrossRef]
  8. Montanaro, A.; Allocca, L.; Meccariello, G.; Lazzaro, M. Schlieren and Mie Scattering Imaging System to Evaluate Liquid and Vapor Contours of a Gasoline Spray Impacting on a Heated Wall; SAE International: Warrendale, PA, USA, 2015. [Google Scholar] [CrossRef]
  9. Catapano, F.; Costa, M.; Marseglia, G.; Sementa, P.; Sorge, U.; Vaglieco, B.M. An Experimental and Numerical Investigation of GDI Spray Impact over Walls at Different Temperatures; SAE International: Warrendale, PA, USA, 2016. [Google Scholar] [CrossRef]
  10. Luo, H.; Nishida, K.; Ogata, Y. Fuel adhesion characteristics under non-evaporation and evaporation conditions: Part 2—Effect of ambient pressure. Fuel 2019, 251, 98–105. [Google Scholar] [CrossRef]
  11. Luo, H.; Nishida, K.; Ogata, Y.; Zhang, W.; Fujikawa, T. Fuel adhesion characteristics under non-evaporation and evaporation conditions: Part 1—Effect of injection pressure. Fuel 2019, 240, 317–325. [Google Scholar] [CrossRef]
  12. Luo, H.; Nishida, K.; Uchitomi, S.; Ogata, Y.; Zhang, W.; Fujikawa, T. Effect of temperature on fuel adhesion under spray-wall impingement condition. Fuel 2018, 234, 56–65. [Google Scholar] [CrossRef]
  13. Yu, H.; Liang, X.; Shu, G.; Wang, Y.; Zhang, H. Experimental investigation on spray-wall impingement characteristics of n-butanol/diesel blended fuels. Fuel 2016, 182, 248–258. [Google Scholar] [CrossRef]
  14. Li, Y.; Huang, Y.; Yang, S.; Luo, K.; Chen, R.; Tang, C. A comprehensive experimental investigation on the PFI spray impingement: Effect of impingement geometry, cross-flow and wall temperature. Appl. Therm. Eng. 2019, 159, 113848. [Google Scholar] [CrossRef]
  15. Akop, M.Z.; Zama, Y.; Furuhata, T.; Arai, M. Experimental Investigations on Adhered Fuel and Impinging Diesel Spray Normal to a Wall. At. Sprays 2013, 23, 211–231. [Google Scholar] [CrossRef]
  16. Akop, M.Z.; Zama, Y.; Furuhata, T.; Arai, M. Characteristics of Adhesion of Diesel Fuel on Impingement Disk Wall. Part 1: Effect of Impingement Area and Inclination Angle of Disk. At. Sprays 2013, 23, 725–744. [Google Scholar] [CrossRef]
  17. Akop, M.Z.; Zama, Y.; Furuhata, T.; Arai, M. Characteristics of Adhesion Diesel Fuel on an Impingement Disk Wall Part 2: Droplet Weber Number and Adhered Fuel Mass. At. Sprays 2014, 24, 651–671. [Google Scholar] [CrossRef]
  18. Akop, M.Z.; Zama, Y.; Furuhata, T.; Arai, M. Characteristics of Adhesion Diesel Fuel on an Impingement Disk Wall. Part 3: Ambient Pressure Effect. At. Sprays 2014, 24, 625–650. [Google Scholar] [CrossRef]
  19. Yu, H.; Liang, X.; Shu, G.; Sun, X.; Zhang, H. Experimental investigation on wall film ratio of diesel, butanol/diesel, DME/diesel and gasoline/diesel blended fuels during the spray wall impingement process. Fuel Process. Technol. 2017, 156, 9–18. [Google Scholar] [CrossRef]
  20. Drake, M.C.; Fansler, T.D.; Solomon, A.S.; Szekely, G.A. Piston Fuel Films as a Source of Smoke and Hydrocarbon Emissions from a Wall-Controlled Spark-Ignited Direct-Injection Engine. SAE Trans. 2003, 112, 762–783. [Google Scholar] [CrossRef]
  21. Yang, B.; Ghandhi, J. Measurement of Diesel Spray Impingement and Fuel Film Characteristics Using Refractive Index Matching Method; SAE International: Warrendale, PA, USA, 2007. [Google Scholar] [CrossRef]
  22. Ding, C.-P.; Sjöberg, M.; Vuilleumier, D.; Reuss, D.L.; He, X.; Böhm, B. Fuel film thickness measurements using refractive index matching in a stratified-charge SI engine operated on E30 and alkylate fuels. Exp. Fluids 2018, 59, 59. [Google Scholar] [CrossRef]
  23. Ding, C.-P.; Vuilleumier, D.; Kim, N.; Reuss, D.L.; Sjöberg, M.; Boehm, B. Effect of engine conditions and injection timing on piston-top fuel films for stratified direct-injection spark-ignition operation using E30. Int. J. Engine Res. 2020, 21, 302–318. [Google Scholar] [CrossRef]
  24. Liu, H.; Wang, J.; Duan, H.; Cai, C.; Jia, M.; Zhang, Y. Experimental study on the boiling criterion of the fuel film formed from spray/wall impingement. Exp. Fluids 2019, 60, 179. [Google Scholar] [CrossRef]
  25. He, X.; Li, Y.; Liu, C.; Sjöberg, M.; Vuilleumier, D.; Liu, F.; Yang, Q. Characteristics of spray and wall wetting under flash-boiling and non-flashing conditions at varying ambient pressures. Fuel 2020, 264, 116683. [Google Scholar] [CrossRef]
  26. Fansler, T.D.; Parrish, S.E. Spray measurement technology: A review. Meas. Sci. Technol. 2014, 26, 012002. [Google Scholar] [CrossRef]
  27. Mulero, M.; Zapata, J.; Vilar, R.; Martínez, V.; Gadow, R. Automated image inspection system to quantify thermal spray splat morphology. Surf. Coat. Technol. 2015, 278, 1–11. [Google Scholar] [CrossRef]
  28. Sezgin, M.; Sankur, B. Survey over image thresholding techniques and quantitative performance evaluation. J Electron Imaging 2004, 13, 146–168. [Google Scholar] [CrossRef]
  29. Gong, C.; Luo, H.; Wu, X.; Nishida, K. Experimental Analysis in Dynamics Characteristics of Impinging Spray By a PFI Injector: From Spray Atomization to Fuel Adhesion Formation. At. Sprays 2021, 31, 77–96. [Google Scholar] [CrossRef]
  30. Luo, H.; Nishida, K.; Uchitomi, S.; Ogata, Y.; Zhang, W.; Fujikawa, T. Effect of spray impingement distance on piston top fuel adhesion in direct injection gasoline engines. Int. J. Engine Res. 2020, 21, 742–754. [Google Scholar] [CrossRef]
  31. Maligne, D.; Bruneaux, G. Time-Resolved Fuel Film Thickness Measurement for Direct Injection SI Engines Using Refractive Index Matching; SAE International: Warrendale, PA, USA, 2011. [Google Scholar] [CrossRef]
  32. Bai, C.X.; Rusche, H.; Gosman, A.D. Modeling of Gasoline Spray Impingement. At. Sprays 2002, 12, 1–27. [Google Scholar] [CrossRef] [Green Version]
Figure 1. Schematic diagram of the experimental setup.
Applsci 12 12263 g001
Figure 2. Injector flow characteristics.
Applsci 12 12263 g002
Figure 3. The impinging spray image from this procedure and impinging spray height and width were defined.
Applsci 12 12263 g003
Figure 4. Evaporation curve of methanol and n-octanol mixed solution after deposit.
Applsci 12 12263 g004
Figure 5. Calibration equation of the fuel film thickness and the average change of light intensity.
Applsci 12 12263 g005
Figure 6. The impinging spray morphology under different D i m p .
Applsci 12 12263 g006
Figure 7. (a) Impinging spray height H i and (b) width W i of impinging spray under different D i m p .
Applsci 12 12263 g007
Figure 8. The spray morphology under different T w a l l .
Applsci 12 12263 g008
Figure 9. (a) Impinging spray height H i and (b) width W i of impinging spray under different T w a l l .
Applsci 12 12263 g009
Figure 10. The spray morphology under different P i n j (300 kPa to 500 kPa).
Applsci 12 12263 g010
Figure 11. (a) Impinging spray height H i and (b) width W i of impinging spray under different P i n j .
Applsci 12 12263 g011
Figure 12. (a) Impinging spray height H i and (b) width W i of impinging spray under different P i n j .
Applsci 12 12263 g012
Figure 13. Pseudo color images of fuel film on the wall with temperature 293 K under different D i m p . As described before, results only from 10 ms ASOI were available for analysis.
Applsci 12 12263 g013
Figure 14. (a) Fuel film area A f , (b) Fuel film thickness T f and (c) Fuel film mass M f on the wall with temperature 293 K under different D i m p .
Applsci 12 12263 g014
Figure 15. Pseudo color images of fuel film on the wall under different T w a l l .
Applsci 12 12263 g015
Figure 16. (a) Fuel film area A f , (b) Fuel film thickness T f and (c) Fuel film mass M f on the wall under different T w a l l .
Applsci 12 12263 g016
Figure 17. Pseudo color images of fuel film on the wall with temperature 293 K under different P i n j (300 kPa to 500 kPa).
Applsci 12 12263 g017
Figure 18. (a) Fuel film area A f , (b) Fuel film thickness T f and (c) Fuel film mass M f on the wall under different P i n j (300 kPa to 500 kPa).
Applsci 12 12263 g018
Figure 19. (a) Fuel film area A f , (b) Fuel film thickness T f and (c) Fuel film mass M f on the wall under different P i n j (300 kPa to 500 kPa).
Applsci 12 12263 g019
Table 1. Experimental conditions.
FuelMethanol (M100)
Density @ 293 K (g/mL)0.79
Viscosity @ 293 K (mPa·s)0.55
Surface tension @ 293 K (mN/m)18.8
Boiling point (K)337.95
Heat of vaporization @ 293 K (kJ/mol)35.295
Refractive index @ 293 K (N/D)1.3284
Table 2. Experimental conditions.
Parameters/UnitsValue
Impingement   distance   ( D i m p )/mm120, 91, 62
Wall   temperature   ( T w a l l )/K293, 323, 373, 423
Injection   pressure   ( P i n j )/kPa300, 400, 500
Injection   pulse   width   ( T i n j )/ms3
Ambient temperature/°C20
Ambient pressure/kPa94.7
Table 3. The volume and mixing ratio of mixed solution.
Mixed SolutionProportion of Methanol/%volProportion of
n-Octanol/%vol
Deposited Volume/μL
M95O59550.5, 0.6, 0.7, 0.8, 0.9, 1.0
M97O39730.5, 0.6, 0.7, 0.8, 0.9, 1.0
M99O19910.5, 0.6, 0.7, 0.8, 0.9, 1.0
Publisher’s Note: MDPI stays neutral with regard to jurisdictional claims in published maps and institutional affiliations.

