Article

A First Step towards the Definition of a Link between Ground Tilt and Earthquakes at Mt. Vesuvius (Italy)

Istituto Nazionale di Geofisica e Vulcanologia, Sezione di Napoli—‘Osservatorio Vesuviano’, 80124 Naples, Italy
*
Author to whom correspondence should be addressed.
Appl. Sci. 2022, 12(23), 12261; https://doi.org/10.3390/app122312261
Submission received: 18 October 2022 / Revised: 24 November 2022 / Accepted: 25 November 2022 / Published: 30 November 2022
(This article belongs to the Special Issue Advances in Multidisciplinary Investigations of Volcano Dynamics)

Abstract

:
One of the strategies to detect the precursors of an eruption is to define the background dynamical state of a volcano for a prompt recognition of deviations from the basic condition. Mt. Vesuvius (Italy), currently in a quiescent state, is one of the most monitored volcanoes in the world, inciting multidisciplinary advanced studies. Hence an understanding of the links among the different monitored parameters is mandatory. In recent decades the joint analyses of ground tilt and seismicity have added to the understanding of the volcano’s activity. In this paper, we outline the first steps towards a comprehension of the link between Mt. Vesuvius earthquakes and co-seismic ground tilt, after excluding the contribution of other external forces acting on the ground, such as tides, landslides or exceptional meteorological phenomena. We used the seismicity with a duration magnitude ≥ 2.0 recorded at Mt. Vesuvius in the period 2018–2020 to estimate the source parameters and to calculate the associated static displacement. Then, we compared the ground inclination retrieved from the estimated seismic deformation with the long-term ground motion trend measured by tiltmeters. We found that in most cases the two vectors have a comparable size and direction.

1. Introduction

Mt. Vesuvius is one of the most dangerous volcanoes on Earth since it is located inside the densely urbanized area which includes the city of Naples (Italy), and its past eruptions have destroyed towns and impacted thousands of victims. Although presentely Mt. Vesuvius is in a quiescent state, it is one of the most monitored volcanoes in the world. The main goal of this monitoring is the recognition of possible precursors of imminent or future eruptions. One of the strategies to reach this goal is to determine the background dynamical state which would allow for the detection of deviations from this basic condition. Multidisciplinary advanced studies using ground tilt, meteorological, ground water and seismicity monitoring have been carried out to determine significant volcano behavior [1,2,3,4]. An understanding of the links among the different monitored observables is then crucial.
In recent times the joint analyses of ground tilt and seismicity have allowed the tracking of significant changes in the activity state of volcanoes. Voight et al. discovered inflation cycles due to magma pressurization below the base of Soufriere Hills’ dome (Montserrat) in 1996–1997 using tilt data recorded at the crater rim, and the combination with seismic and volcanological data permitted the forecasting of times of increased volcanic hazard [5]. Ground tilt and seismicity recorded at Stromboli volcano (Italy) in 2008 showed that its explosive activity is accompanied by small ground inflation–deflation cycles associated with gas recharge and discharge in the magma inside the conduit [6]. Honda et al. modeled the pressure source beneath the eruption center during the unrest of Hakone volcano (Japan) in 2015, by using the earthquake swarm activity and the simultaneous rapid tilt changes and established that the intrusion of hydrothermal water may have triggered the phreatic eruption [7].
Mt. Vesuvius, Campi Flegrei and Ischia, the volcanoes of the Campanian district (southern Italy), are study areas for several investigations in which seismicity and ground tilt, sometimes together with other parameters (meteorological, geochemical, etc.), are jointly used to shed light on the dynamics of the volcanic/hydrothermal system [1,4,8]. In particular, Ricco et al. [1] outlined the dynamics of Mt. Vesuvius in the years 2012–2019 using combined investigations of ground tilt, seismicity, and geofluid circulation. These authors identified a change in the activity state occurring after the minimum level of volcanic activity of 2014. They noted the migration towards the SE of the centroid of the surface manifestations, such as seismicity, differential ground tilt, and thermal and compositional anomalies in groundwater and fumaroles. Ricco et al. stressed that the occasional variations of co-seismic and aseismic deformation could be correctly interpreted only in conjunction with the other observables, otherwise, those changes would likely have been interpreted as pseudo-random oscillations of the background signals.
Mt. Vesuvius is a stratovolcano (1281 m high and 10 km wide) which is part of the Somma–Vesuvius volcanic complex in the Campanian Plan. It is located at the intersection of two regional tectonic fault systems (NW–SE and NE–SW), whereas the main eruptive fractures and local faults are mostly aligned in the E–W and N–S directions [9,10]. Volcanic activity controlled by the dynamics of the Adriatic slab has been characterized by explosive and effusive phases, and periods of quiescence. Four Plinian and sub-Plinian eruptions occurred in the last 20 kyr: Pomici di Base (18–20 kyr), Mercato (8.0 kyr), Avellino (3.9 kyr), and Pompei (79 AD). The last period of activity started in 1631 A.D. and ended in 1944, with a strombolian eruption from the Gran Cano crater. Since then, Mt. Vesuvius has been in a state of weak activity, characterized by general subsidence, diffuse CO2 degassing and low-temperature fumarolic emissions in the crater area, and low seismicity rates [1].
The seismicity of Mt. Vesuvius mostly consists of Volcano Tectonic (VT) earthquakes, characterized by clear P-wave onsets, high frequency spectral content (>5 Hz), shear failure source mechanism [1,11] and low-to-moderate magnitudes (up to 3.6, in 1999). For the latest decades the seismogenic region has appeared to be separated into two volumes located along the crater axis (Figure 1). The first volume coincides with the sector of the volcanic edifice that is above sea level (a.s.l.), while the second comprises depths in the range of 1–6 km b.s.l. [1,11]. For both volumes, the centroid of the hypocenter locations is less than 2 km from the crater axis. The VT source mechanisms are related to the interplay between the regional and local stress fields, as well as to fluid-driven rock fracturing triggered by pressure variations in the shallow hydrothermal system.
Double–couple (DC) dominant components [9,10] are usually retrieved for the VT source dynamics, associated with strike-slip and normal/reverse dip-slip focal mechanisms. The main orientations of the nodal planes are NW–SE and NE–SW, and for the P (direction of maximum compression) and T axes (direction of minimum compression) are NNE–SSW and ESE–WNW, respectively, and ESE–WNW and NNE/N–SSW/S, respectively [9,10,13]. Del Pezzo et al. [14] estimated the average stress drop for the deepest events in the range of 1–10 MPa, and a stress drop of up to 1 MPa for the shallowest ones. These authors suggest that these last events are triggered by an increase in pore fluid pressure due to changes in the level of the hydrothermal aquifer, whose top is located at about 1 km b.s.l., beneath the crater [15]. Conversely, the regional tectonic stress release occurring in the pre-fractured carbonate basement mainly generates the high stress drop seismicity.
Starting from 2003, atypical seismicity, with a frequency content lower than that of the VTs (<6 Hz), has also been observed [16,17]. These were classified as Low Frequency (LF) and Long-Period (LP) earthquakes and were interpreted as the response of a NaCl brine reservoir, located between 2 and 5 km b.s.l., to episodic pressurization/depressurization. The associated mechanism is a brittle slow failure of dry rocks for the LFs, and a resonance of pre-existing fluid-filled cracks for the LPs [17,18].
The study of the ground tilt inferred from more than twenty years of data acquisition shows complex and site-dependent patterns, constrained by the morphology and structural outlines of the volcanic edifice [1,19]. Ground deformation over long time scales reflects the subsidence of the southern part, consistent with a spreading phenomenon [20]. This background trend showed variations during two phases of strong seismic activity, between 1995 and 1996, and at the end of 1999. From the end of 2000 to early 2001 a reversal of the tilt directions characterized a period of significant reduction of seismic energy release [19]. Further evidence of close links among ground tilt, seismicity and hydrothermal activity were observed throughout the period 2012–2019. The common patterns of the geophysical and geochemical parameters have been interpreted as the combined effect of structural changes affecting the volcanic edifice and variations of the dynamics of the hydrothermal system [1].
In this paper we outline the first steps towards an understanding of the link between Mt. Vesuvius earthquakes and co-seismic ground tilt, and the extent to which the tiltmeters deployed on the volcano respond to the seismic activity, after removing other external forces acting on the ground (tides, landslides, meteorological phenomena, etc.). We estimate the source parameters of the VTs for the period 2018–2020 using high quality data, constraints that emerged from recent studies and by following rigorous methodologies. Then we calculate the static displacement to compare the estimated seismic deformation with the co-seismic deformation measured by tiltmeters.

2. Materials and Methods

In this study we used the data collected by the monitoring networks of the INGV-OV (Figure 1). For the seismological analyses, we selected the earthquakes located in the crater area with a duration magnitude (MD) higher or equal to 2.0, which ensured a favorable signal-to-noise ratio. To estimate the source parameters for Mt. Vesuvius VTs we used a classical approach [13,14,21,22], taking as reference stations two digital broadband seismometers, BKWB and BKSG, currently operating on the volcano (Figure 1). For a comparison between the estimated and measured deformations, we used data of tiltmeter monitoring (Figure 1). To this aim, we calculated the static ground deformation generated by the earthquakes at the four sites in which the tiltmeters are located, and then compared the theoretical ground inclination with those actually measured by the tiltmeters. The ground inclination associated with the earthquakes was evaluated by estimating the static displacement [23,24] by using Coulomb software [24]. Behind the medium elastic constants, the algorithm needs the position and dimension of the source fault and the kinematic parameters (strike, dip angle and net slip) as inputs to calculate the displacement at a certain depth.
In the following we describe the data and the methodologies that we used to estimate the seismic displacement (Section 2.1 and Section 2.2) and to calculate the ground tilt (Section 2.3 and Section 2.4).

2.1. Seismic Data

The Osservatorio Vesuviano (INGV-OV), branch of Istituto Nazionale di Geofisica e Vulcanologia, manages the permanent and the mobile seismic networks of Mt. Vesuvius (Figure 1). The permanent network is currently composed of 19 stations, both three-component digital broadband and analog short-period devices. The acquired data are telemetered in real time to the surveillance center in Naples. The mobile network consists of six temporary three-component digital broadband, standalone stations, which store the data locally. Details can be found in [25,26].
Since 1972, each VT earthquake detected by the seismic networks is noted down in a catalogue [27]. Each record of the catalogue reports origin time, epicenter coordinates, focal depth and MD.
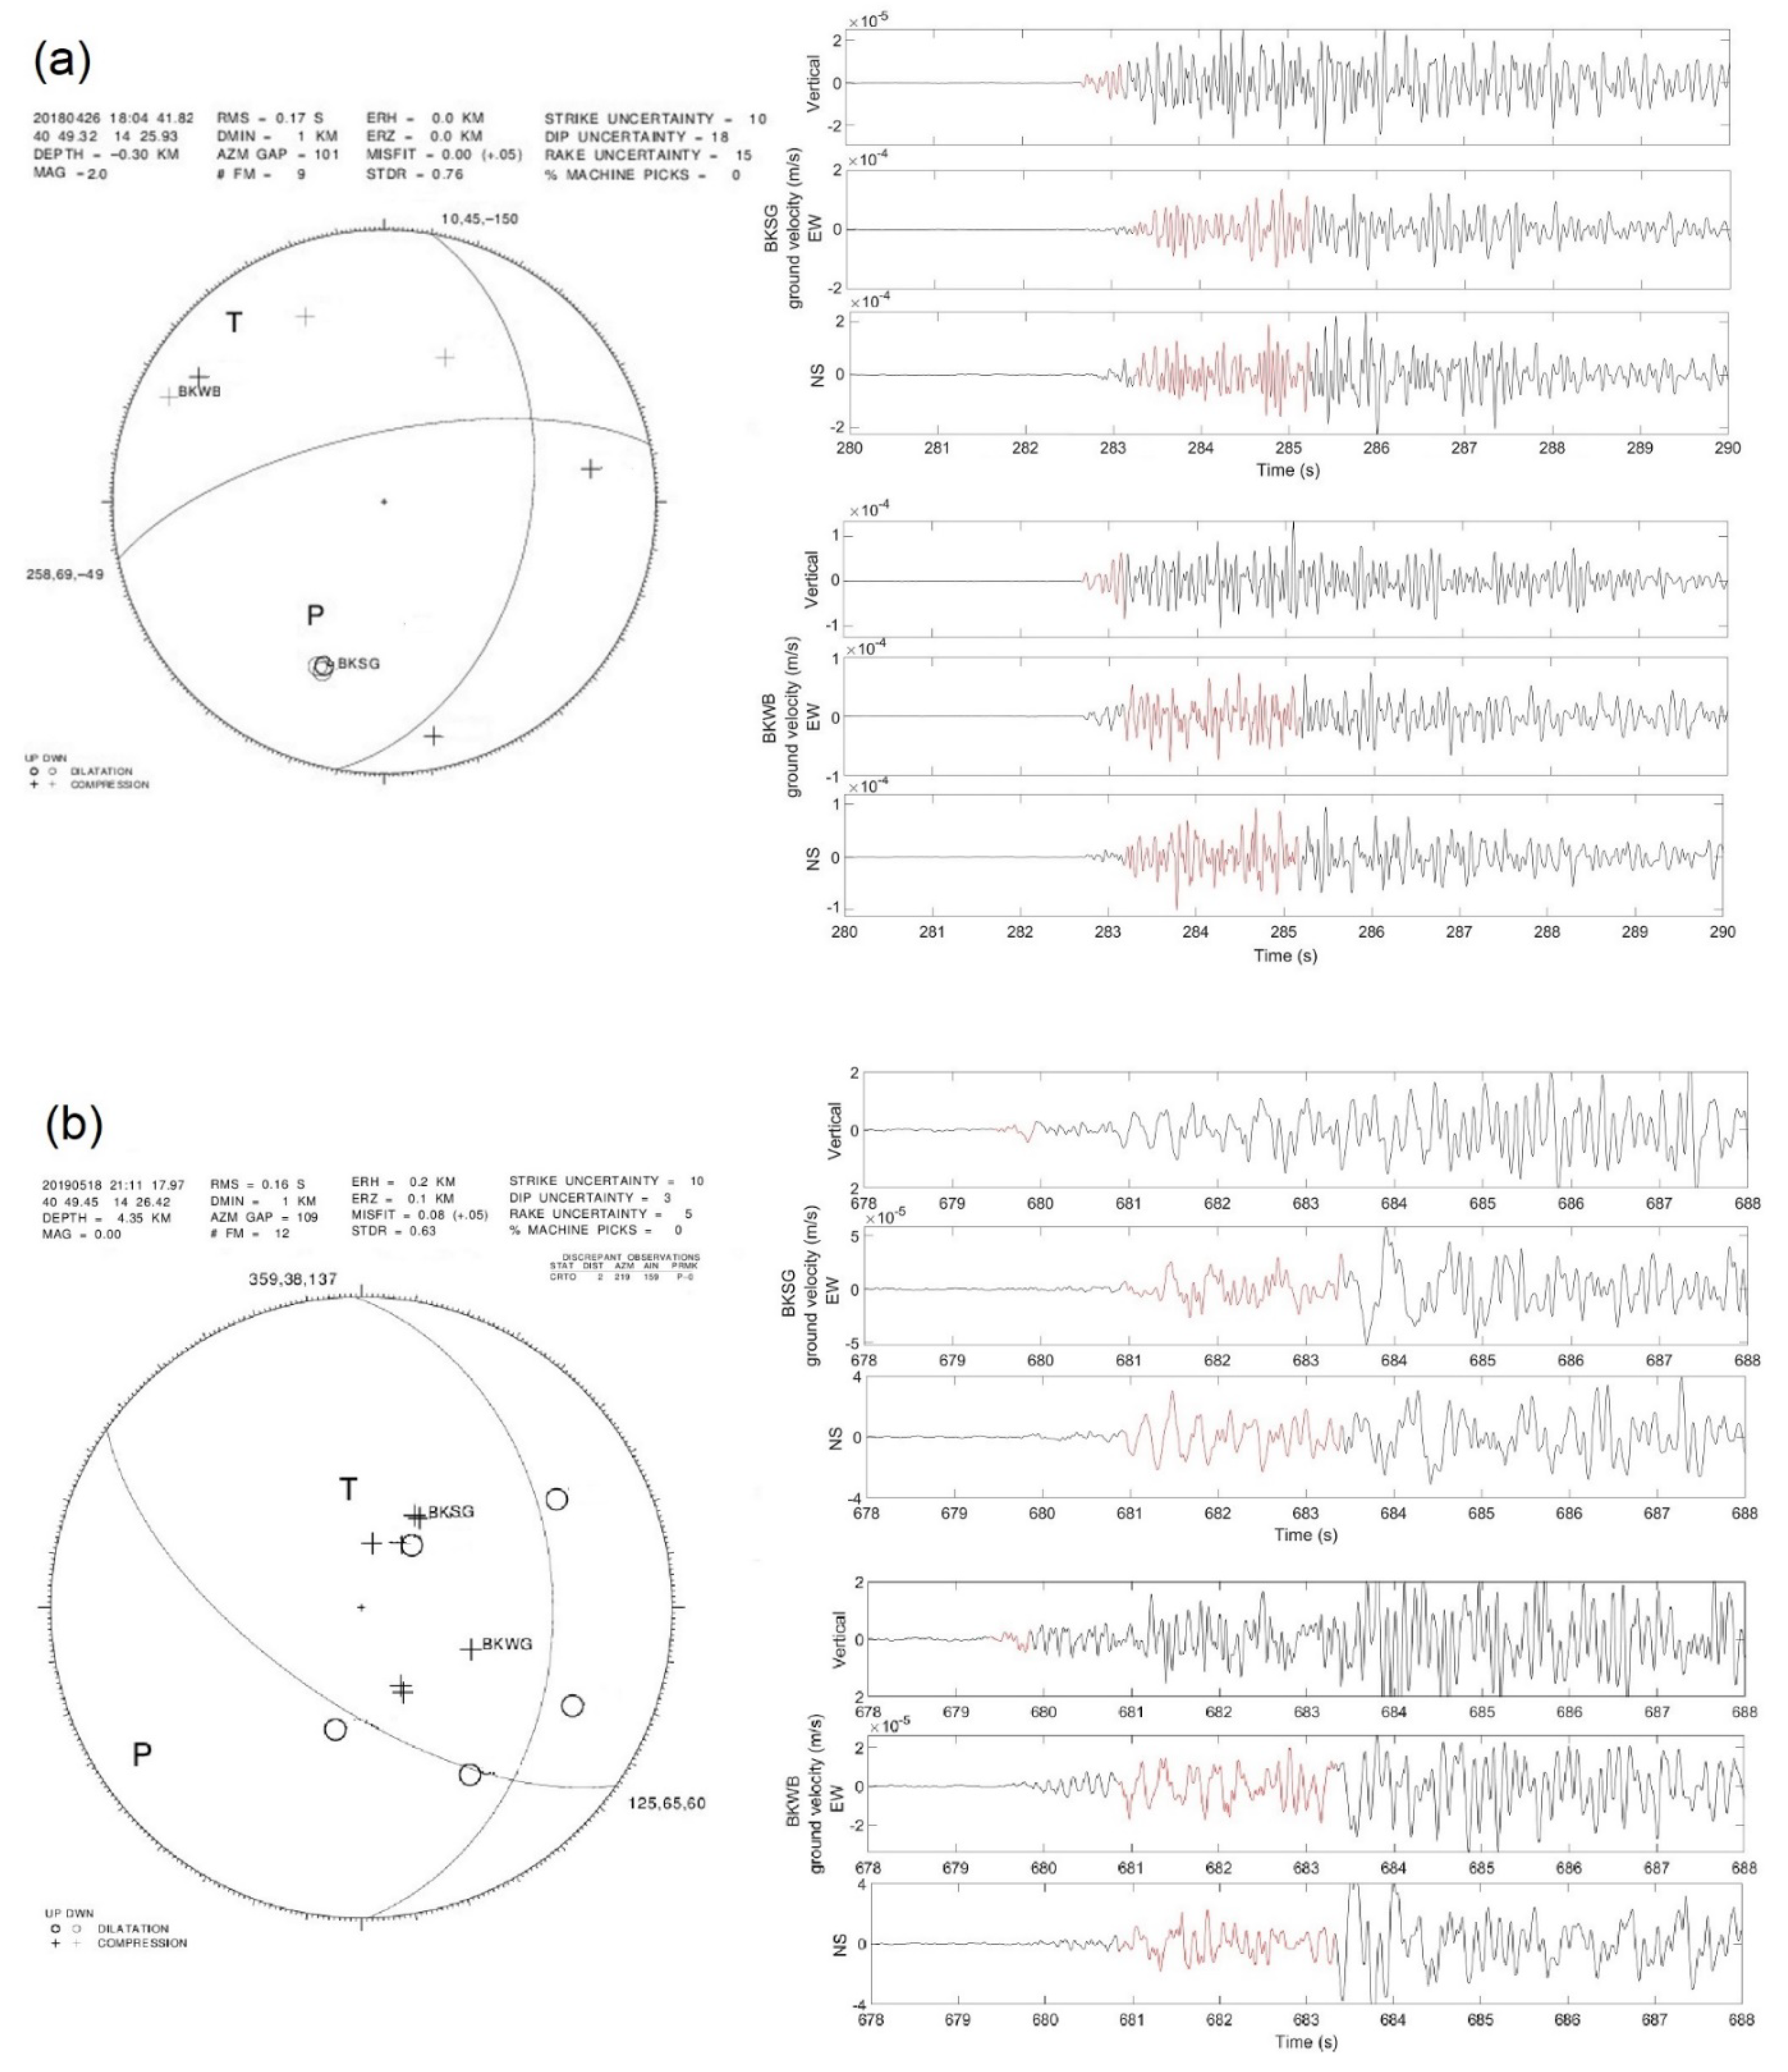
The seismological dataset used in this work consists of 24 VT earthquakes with MD ≥ 2.0 that occurred at Mt. Vesuvius in the time span 2018–2020 (Table 1). Examples of seismograms are shown in Figure 2.

2.2. Seismological Methods: Focal Mechanism, Source Spectra and Static Displacement

To determine the seismic source geometry, we used the program FPFIT [28] which performs a grid-search of double–couple focal mechanism solutions. The search algorithm uses the P- and S-wave polarities (up or down) and takeoff angles, azimuths, and source-station distances obtained from a location procedure. The earthquakes’ location has been obtained with a probabilistic 3D method developed by Lomax et al. [29] and based on nonlinear optimization. FPFIT provides the strike, dip and rake of the most reliable focal mechanism and the uncertainties associated with each parameter. In the caption of Table 1 the convention on the geometrical parameters is reported.
To estimate the source dimensions and the net slip on the fault, we used a classical approach [30]. The amplitude spectra of the direct S-waves, estimated through Fast Fourier Transform of the ground displacement possibly corrected for propagation and site effects, were used to estimate the scalar seismic moment, M0, and the corner frequency, f0. Considered a pulse-like source shape, at the limit of the low-frequency asymptote and for a constant moment time rate, M0 can be estimated as [31]:
M 0 = 4 π ρ 0 1 2 ρ x 1 2 ρ 0 β 0 5 2 β x 1 2 R Ω 0 2 Y θ ϕ
where ρ0 and ρx are the medium densities of the source and receiver regions, respectively, β0 and βx are the shear-wave velocity at the source (Haskell model) and receiver, respectively, R is the hypocentral distance, Ω0 is the S-wave radiated energy at the limit of low-frequency asymptote, the factor 2 takes into account the free surface contribution and Yθϕ is the radiation pattern term (0.55, the average over the focal sphere). The corner frequency, fc, can be calculated as the intersection of the low- and high-frequency asymptotes in a loglog plot of the source spectra [30].
Assuming a constant fault rupture velocity βr and no directivity effects, the linear dimension of the source can be estimated as L = (0.37 * βr/fc) (Brune radius). To estimate the net slip on the fault we used the relation [30]:
u ¯ = M 0 μ L 2
μ is the rigidity, that we calculated as μ = E/(2 * (1 + σ)), where E is Young’s modulus.
Displacements and strains due to shear and tensile faults, in a half-space for both point and finite rectangular sources in a homogeneous elastic and Poissonian half-space, can be estimated following the approach of Okada [32]. Taking into account the body force equivalent relations, the internal displacement field, due to a dislocation across a surface in an isotropic medium, can be expressed by a combination of the displacement fields (u) due to the strain nuclei (∂uj/∂ξk). Internal deformation field formulas are then derived for strike, dip, tensile and inflation sources, as functions of fault length along the fault strike direction (L), width along the perpendicular direction to the strike (W), and elastic moduli (E and σ).
To estimate the static displacement generated by the VTs, we used Coulomb [23,24], a software developed in Matlab environment [33]. The software follows the approach of Okada [32] to calculate static displacements, strains, and stresses, generated by fault slip, magmatic intrusion, or dike expansion/contraction, at a certain depth inside an isotropic elastic half-space. The static displacement can be evaluated at free surface or in correspondence with a deformation measurement point (e.g., GPS).

2.3. Ground Tilt Data

The ground tilt is measured on Mt. Vesuvius by a network of sensors, able to detect slight tilt variations, in both direction and amplitude, of the volcano edifice caused by the endogenous (e.g., hydrothermal activity, possible dyke intrusions) and exogenous dynamics (e.g., earth and ocean tides).
INGV-OV manages the current tilt network composed of seven stations: three equipped with surface short base-length platform tiltmeters deployed in shallow wells and four borehole digital tiltmeters. The signals are acquired with a resolution less than 5 × 10⁻⁹ radians and a sampling rate of one sample per minute; the whole dataset is telemetered in real time to the surveillance center in Naples. Details can be found in [1,19].
The elevation and installation depths of the borehole tiltmeters on which our study has focused are as follows: IMB (974 m a.s.l., −22 m), CMT (842 m a.s.l., −20 m), TRC (372 m a.s.l., −28 m) and CMG (117 m a.s.l., −25 m) (Figure 1).

2.4. Tiltmeter Methods: Ground Tilt Calculation from Displacement

To test whether the static displacement field was consistent with the actually recorded tilt, the horizontal derivatives of the vertical deformation, corresponding to the west-east and south-north components of tilt, were calculated for each earthquake and for each station with the following equations:
Δ WE = Uz x = Uz ( x + h , y , z ) Uz ( x h , y , z ) 2 h Δ SN = Uz y = Uz ( x , y + h , z ) Uz ( x , y h , z ) 2 h
where Uz is the vertical static displacement, (x,y) are the coordinates of the tilt station, (x − h,x + h) are the coordinates of the neighborhood points to the W and E and (y − h,y + h) are the coordinates of the neighborhood points to the S and N [34].

3. Results

3.1. Seismological Results

We carefully picked the P- and, when possible, the S-phases, and marked the polarities of the P-phases. Then we performed a 3D non-linear probabilistic location [35], which takes into account topography and lateral heterogeneities of the medium. In Figure 1 we show the epicenter positions. The sources’ depths are reported in Table 1. The average error for the 3D locations is 0.03 km for both the epicentral distance (ERH) and depth (ERZ). The output files containing P-polarity, takeoff angles, azimuths, and distances obtained from the 3D location served as input to FPFIT. We used data showing at least six reliable P-wave polarities. In Table 1 we reported the obtained strike, dip and rake for each earthquake. Two examples of the estimated focal mechanisms (beachballs) are shown in the first column of Figure 2, where the uncertainties of the calculated mechanisms are also reported.
To estimate the source dimensions and the net slip on the fault, we used the signals recorded by BKWB and BKSG mobile digital stations (Figure 1). These two stations have had a very stable operation over the studied time period, except during the earthquake MD = 2.2 of 16/08/2018, when both were not operative. Moreover, their site responses are well known [22].
For each earthquake, the displacement amplitude spectra for the direct S-waves were estimated in the frequency domain after Fast Fourier Transform of seismic time series. We selected three s-windows of signals, starting 0.2 s before the S-onset, with 5% Hanning tapering, which allowed us to calculate stable S-wave spectra, in agreement with [14,22]. The source spectrum of the S-wave is obtained as the mean value of the spectra of the two horizontal components (NS and EW). The distance between the stations and the hypocenters of the most considered VTs fall in the range 0.8–3.8 km, producing a negligible anelastic attenuation effect on the recorded spectra. Even the deeper event (2019/05/18 21:11) with a station–source distance of about 5.6 km shows an incidence of the attenuation effects of about 5% on the source spectra estimated parameters and, hence, we did not consider the attenuation effect in the following.
To estimate the source spectra parameters, we considered the values for velocities and densities inferred from the tomographic study of Lomax et al. [35], a 2D layered medium, with a P-wave velocity α = 2 km/s for the topography, α = 3 km/s from the sea level to 2 km of depth b.s.l. and α = 6 km/s below 2 km of depth [36]. The S-wave velocity values were estimated from the relation α/β = 1.9. Similarly to [21,22], we found homogeneous spectra in the 1–4/6 Hz frequency band (Figure 3).
Most of the located earthquakes are shallow, with a depth less than 2 km. For these VTs we set ρ = 2400 kg/m3, while ρ = 2700 kg/m3 for the few deeper earthquakes. Ω0 was estimated from the spectra (Figure 3) by interpolating the low frequency level, in the range 1–4/6 Hz, and averaging, when possible, the estimation for BKWB and BKSG. In general, the two stations show comparable source spectra (Figure 3).
The corner frequency, fc, was calculated as the intersection of the low-frequency and the high-frequency asymptote of the spectral envelope in a loglog plot (Figure 3). We found fc values in the interval 5–17 Hz, in good accordance with [14,21,22]. For M0 we found values in the range (0.2–10.7) × 1012 Nm, in line with the value generally found for Mt. Vesuvius [13,14,21,22] for MD ≥ 2.0.
Assuming a constant rupture velocity βr and no directivity effects, the linear dimension of the source can be estimated as L = (0.37 * βr/fc) (Brune radius), and we obtained values from a minimum of 24 m to a maximum of 157 m. To estimate the net slip on the fault we used the Equation (2), where E, the Young’s modulus, varies from 10 GPa at shallower depth to about 80 GPa, and σ, the Poisson’s ratio, varies between 0.246 and 0.250 [37]. For our analysis, considering a rectangular fault, the net slip ranges in 0.02–0.40 m.
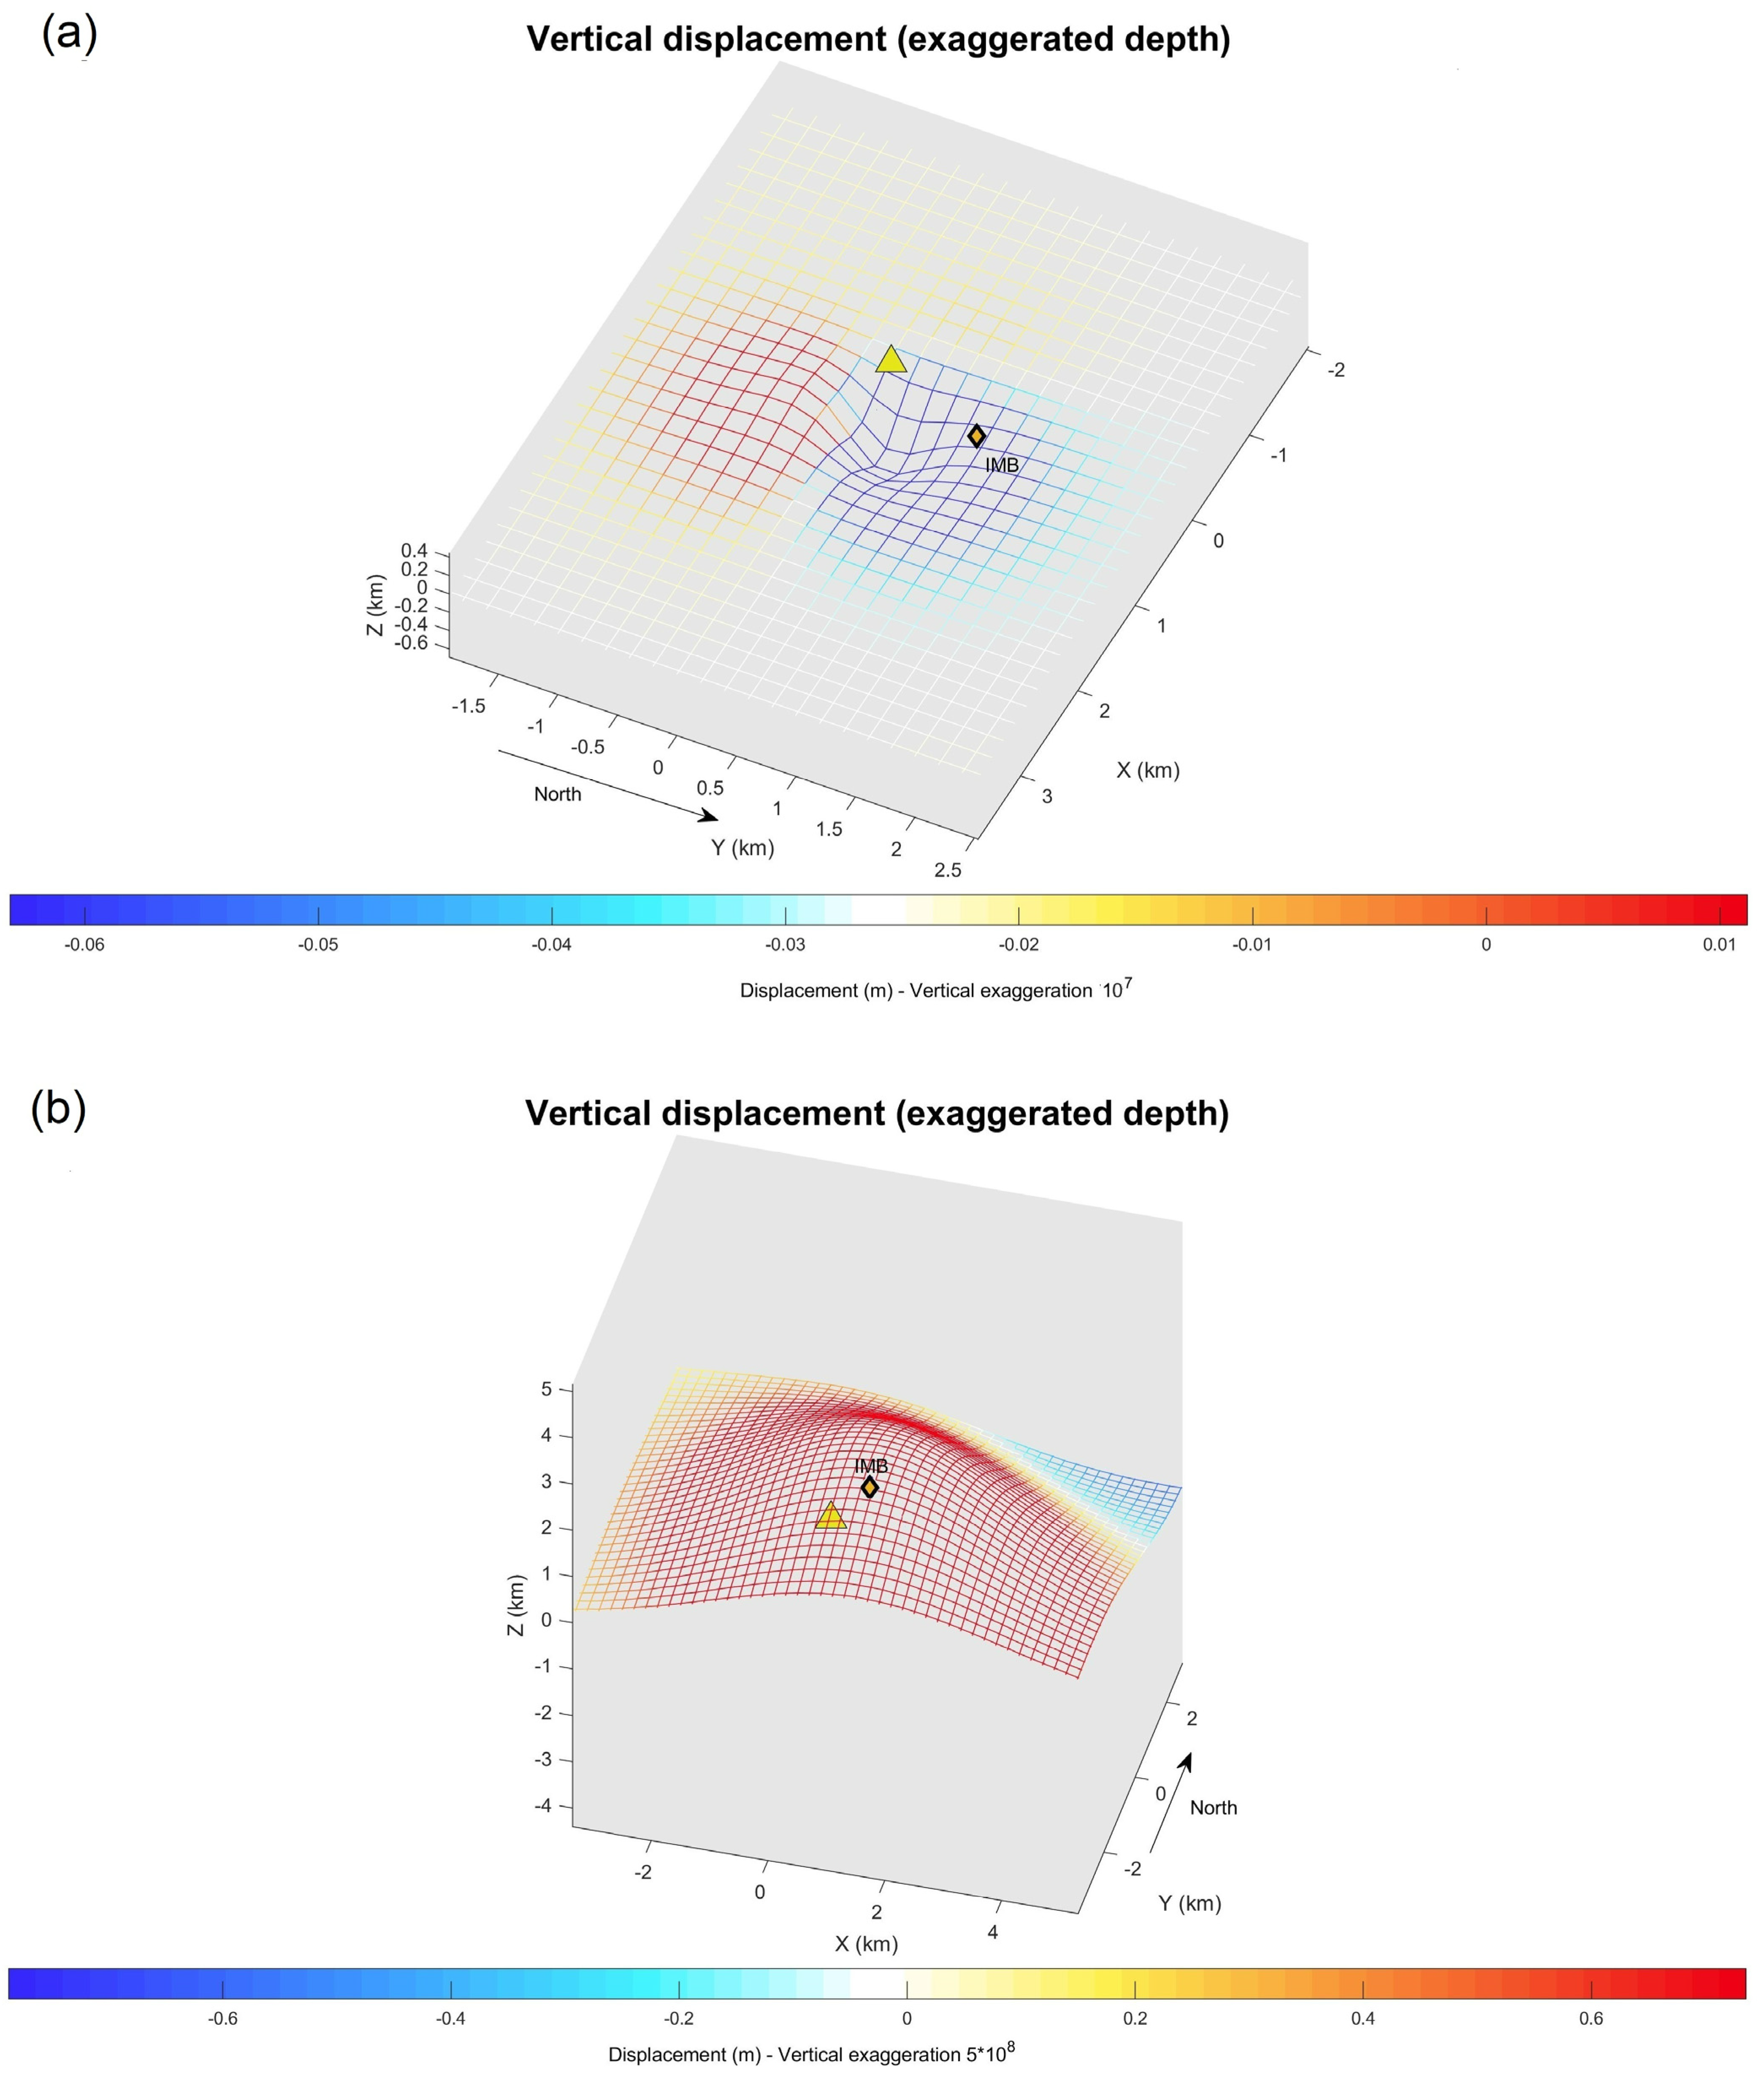
Coulomb software performs the calculations in the (x, y, z) Cartesian coordinate system, which we defined according to Table 2, so that the origin of the system, (0,0,0), coincides with the vertex of the Mt. Vesuvius crater, at an elevation of 1 km a.s.l.. The friction coefficient is left at 0.4 standard value. The input DEPTH parameter refers to the depth (positive downward) at which the deformation is estimated. In our case, it is set to the tiltmeter location (Figure 1). For each VT, we inserted the estimated geometrical and kinematic parameters associated with the relative source fault. With a fixed depth value, the software provides an ascii file containing the coordinates of the grid and the corresponding values of displacement components Ux, Uy and Uz.
Since the selected earthquakes are small magnitude (MD < 3.0), we manually applied vertical exaggeration factors on the vertical displacement of the graphs for a better rendering (Figure 4).

3.2. Tiltmeter Results

In our study, we first assessed whether the ground deformation generated by earthquakes and recorded by tiltmeters exhibited tilting patterns according to established or recurring directions. Furthermore, we tested whether the tilt could be calculated directly from the static displacement estimated from seismic data. Finally, we compared it with that directly recorded by the four borehole tiltmeters placed at various elevations and distances from the crater.
We used the signals acquired during the three-years period 2018–2020, selecting two-time windows of 24 h and 240 h for each earthquake, centered on each of the seismic events, in order to study the kinematics of deformation over two different time scales, a short one (1 day) and a long one (10 days).
We then proceeded to calculate 24 × 4 plots of the tilt vectors (one plot per earthquake and per tilt station) for both 1- and 10-day time windows. Each daily plot represents the ground tilts that are due to the response of the terrain to periodic oscillations mostly induced by lunisolar attraction (tides), but also to the strain to which the site-station is subjected during an earthquake.
We focused our study on finding a possible relationship between the tilting direction observed at the stations over a longer period of time and the pattern of static displacement. For this purpose, we analyzed the tilt signals by extracting the long-term trend, estimated by calculating the arctangent of the ratio between the NS and EW components filtered with a third-order polynomial, over a 10-day window including each seismic event, and checked whether this direction was consistent with the displacement. The two observables, displacement and tilt trend, were considered to be consistent if the trend vector pointed toward the closer relative minimum of the static displacement field with a maximum deviation of 45°.
The results obtained show that, on average, the stations closest to the epicenters present deformation patterns (inclination of the ground in correspondence with the tiltmeter stations) during earthquakes consistent with the long-term tilt direction (Table 3). In Figure 5 we show an example of a comparison between the seismic static deformation, whose values are expressed according to the color bars, and the long-term tilt direction (blue arrow) measured by IMB tiltmeter. In this case, the co-seismic ground inclination is toward NW (from red values towards colder color values), according to the direction of the tilt vector (W).
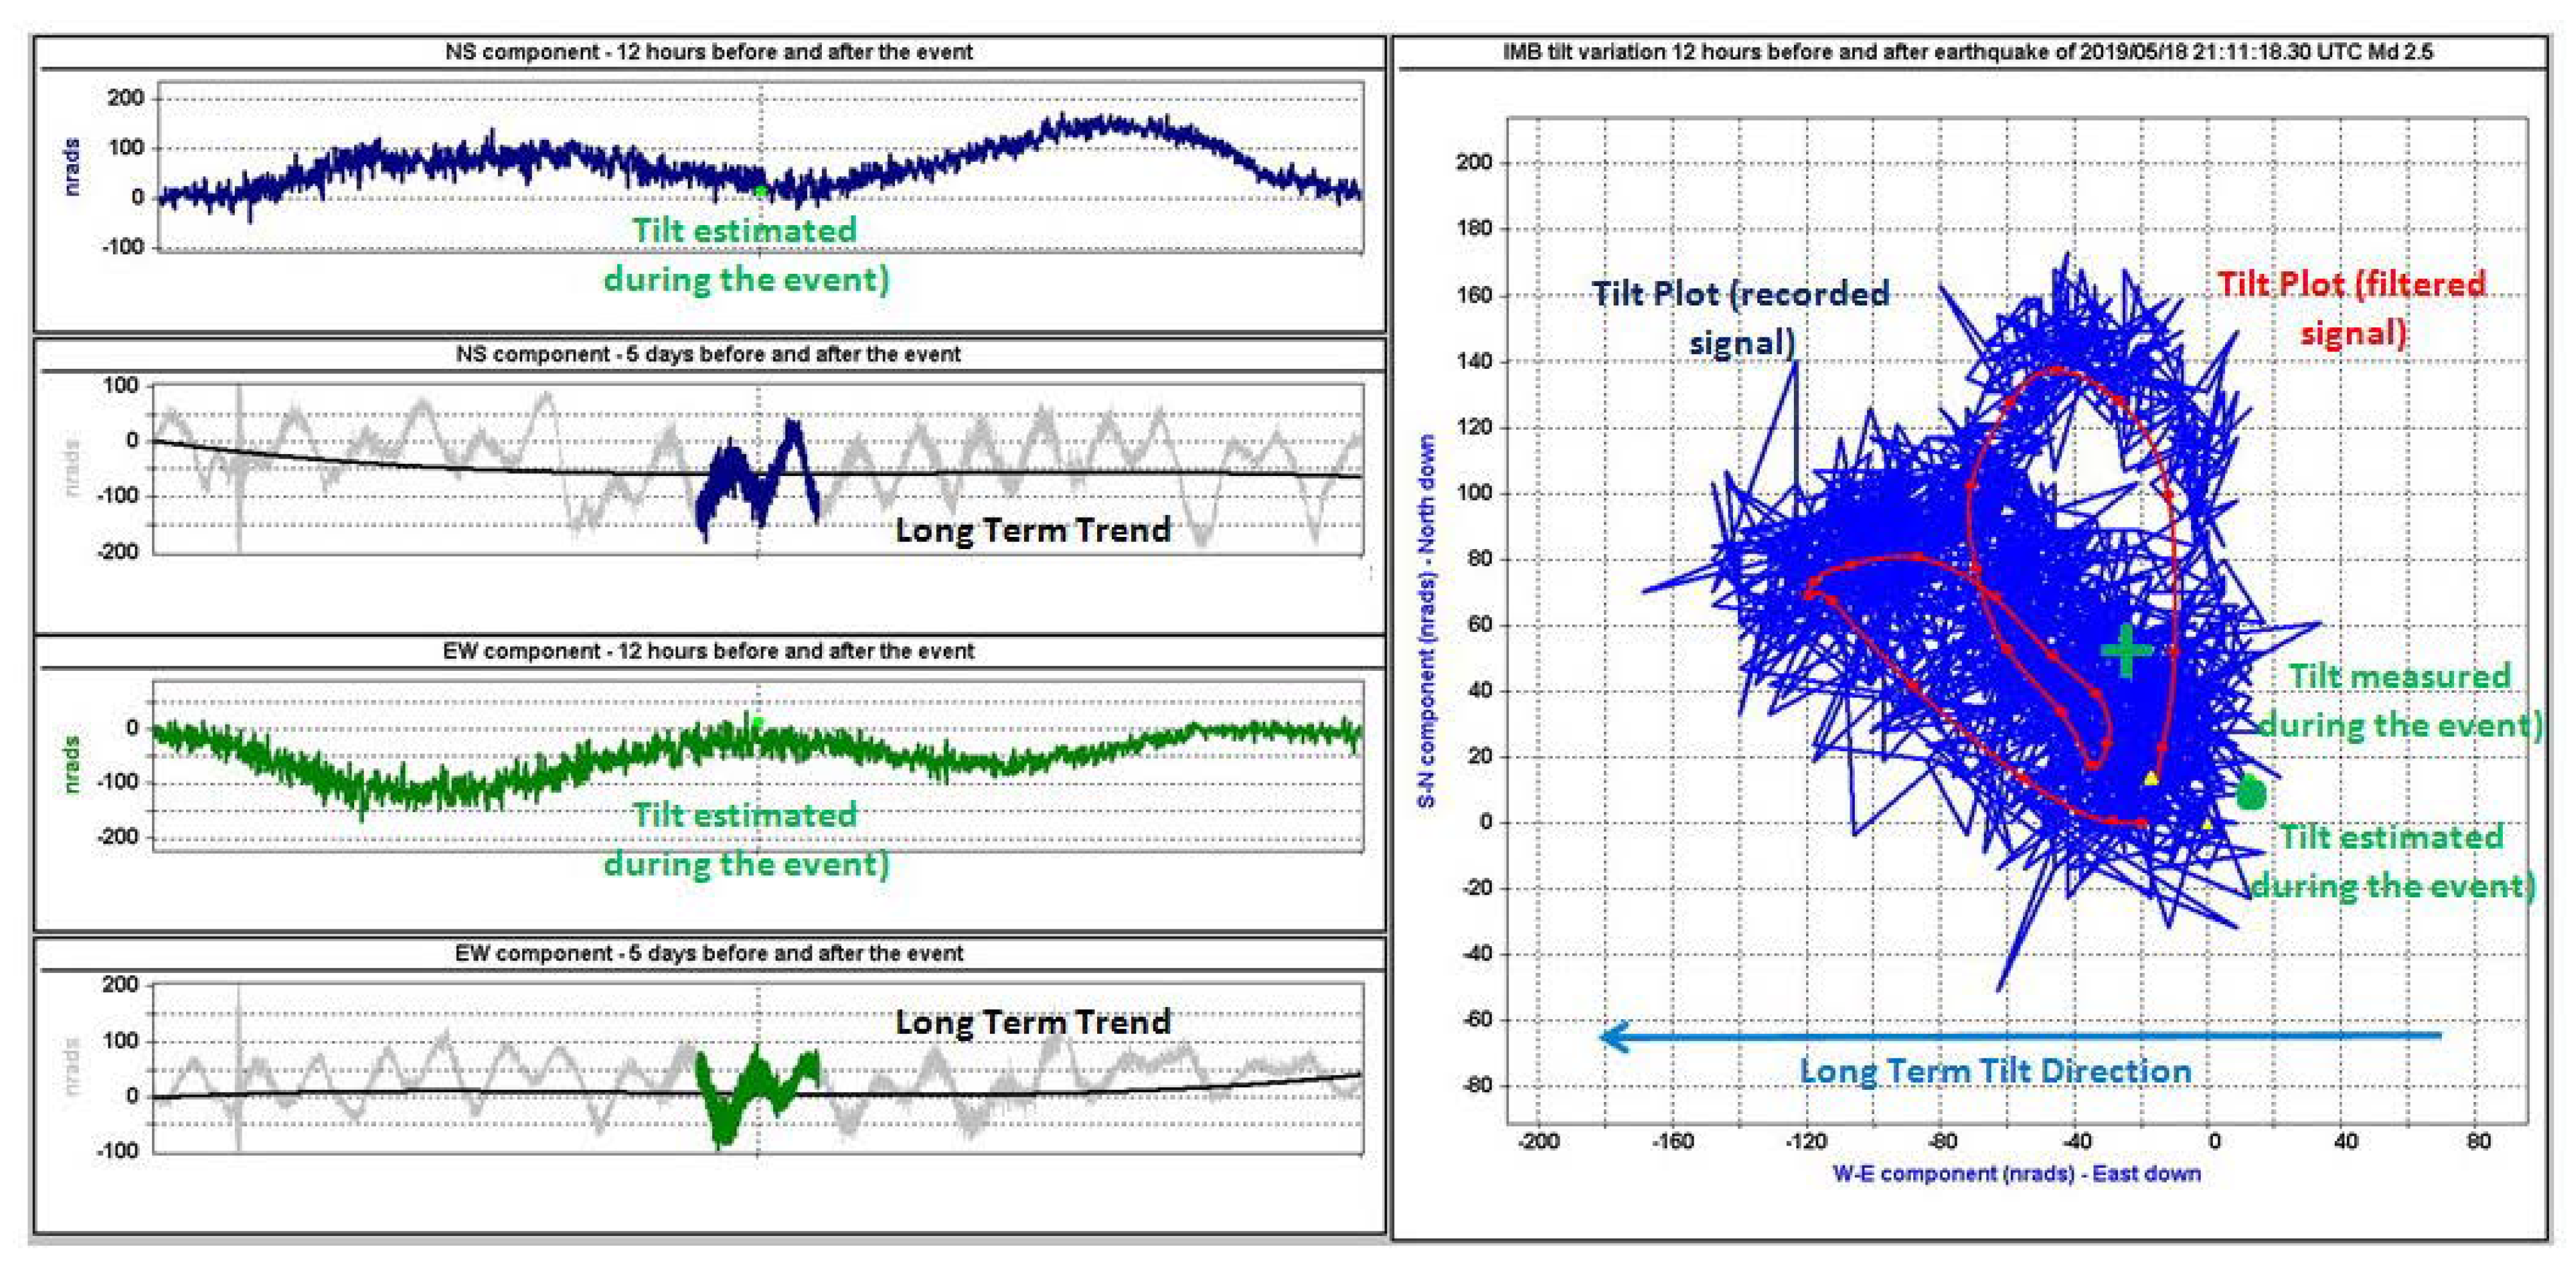
Moreover, we applied the Equation (3) to two selected earthquakes (2018/04/26 and 2019/05/18, which show compatibility between the seismic static displacement and long- term tilt direction during these two events, see Table 3) to formally calculate the static displacement derivative, and we found a good agreement with the measured tilts, since the deviation between them is always smaller than the amplitude of the tiltmeter signal. In Figure 6 we show the results for 2019/05/18 VT as example.

4. Discussion and Conclusions

In recent times the existence of a link between seismicity and ground tilt in the phenomena involved in volcanic/hydrothermal environments is well known [1,4,5,6,7,8]. In our study we look at how and to what extent the two different physical observations could be interconnected in the case of Mt. Vesuvius earthquakes. Our work was mainly devoted to the research and calibration of an approach that could allow the comparison of two physical variables: the ground velocity recorded by seismometers and the ground inclination recorded by tiltmeters, during the occurrence of an earthquake. To the knowledge of the authors, this is the first of such an attempt at Mt. Vesuvius.
The basic idea is to estimate the displacement field generated by each specific earthquake starting from the recorded seismograms. To do this we first estimate the seismic source spectra parameters, the seismic moment (M0), the corner frequency (fc), the fault dimensions and the net slip.
In recent decades, several studies have been carried out to estimate the seismic source parameters at Mt. Vesuvius [13,14,21,22]. In all those studies the quality of the data was fundamental. We concentrate our attention on the time interval 2018–2020 to ensure the simultaneous operation of the broadband digital stations and the tiltmeter network. During this period Mt. Vesuvius was characterized by a low-level seismicity, with maximum magnitude equal to 2.5. Moreover, the volcano is located inside the urban area of Naples district and is hence affected by a high level of anthropogenic noise. We selected 24 earthquakes which had the best signal-to noise ratio, considering those earthquakes with a magnitude ≥ 2.0. In the considered period the seismicity of the volcano was also characterized by a predominance of shallow focal depths [1]. We found that the focal depths clustered in two depth ranges, with 14 earthquakes located above the sea level (depths less than 1 km), nine located in depths in 0–3 km b.s.l. and one below 4 km depth b.s.l.. This depth distribution is in contrast with the observation of D’Auria et al. [11] who found the most focal depths to be in the deeper cluster for the period 1999–2012. This discrepancy could be due the decrement of the deep earthquake occurrence ascribed to the exhaustion of the effect of the 1999 seismic crisis [2]. Therefore, our dataset was significantly different from previous studies, in which the focal depth ranges in 1.5–4.2 km (and MD in 0.9–3.6) and for which a 1D-location algorithm and a layered velocity model are often suitable and preferred [14,22]. In our case the earthquake foci could be inside the volcanic edifice above the sea level and, hence, the (location) algorithm must take into account the topography (and its velocity structure) to provide reliable locations.
The estimated focal mechanisms show no clear patterns for fault geometries, in line with past studies [9,10,13,14,22]. With a particular reference to the study of D’Auria et al. [11], we found thrust mechanisms to be predominant in the shallow cluster (50%), while the deeper earthquakes show prevailing normal mechanisms (40%), with a clear presence of strike components (see Table 1), in agreement with the observations of those authors. They attribute these patterns to the effect of a local stress field which is strongly constrained by the evolution of the Somma–Vesuvius complex.
For the calculation of source spectra, we used two broadband seismic station of the mobile seismic network, since they do not present dramatic site effects [22]. In the estimation of the spectra, we did not account for propagation effects due to the short station-source distance value, in agreement with Zollo et al. [13]. Assuming the Haskell model for the source, we obtained a seismic moment in the range (0.2–6.1) × 1012 Nm and corner frequencies in the 5–17 Hz range, which are the values generally found for Mt. Vesuvius for MD ≥ 2.0 [14], as well as a Brune radius in the range 30–136 m. This last value, the only one > 100 m, corresponds to the deepest (>4 km) earthquake that occurred on 2019/05/18 and which has the maximum M0 (6.1 × 10¹² Nm) of the whole dataset. In the hypothesis of a rectangular fault, the relative stress drop is about 1.5 MPa, as expected for the deepest VTs [14].
We used the estimated focal mechanisms and the source spectra parameters to calculate the static displacement field according to the approach of Okada [32], in correspondence with the elevation of each tiltmeter. The model of Okada for seismic source assumes the approximation of the propagation medium as homogeneous isotropic half-space, whereas Mt. Vesuvius has significant topographic relief and structural variations from the volcanic edifice to the deeper underlying crust. However, this model is often used with satisfactory results in the presence of significant topography and medium inhomogeneity e.g., [34,38].
Once we obtained the deformation field in correspondence of the tiltmeters positions, we faced with the question of how to make the comparison with the ground tilt. The possibility of comparing the two observables came from the observation of clear transient signals recorded in correspondence with occurrence of the earthquakes. MD = 2.0 is the earthquake size threshold which allowed us to detect such transients. Once we individuated the transients, we checked if any other possible spurious sources were present in proximity of the sensors. Since tiltmeters are very sensitive instruments (less than 5 × 10⁻⁹ radians), we ensured that other exogenous forces, such as landslides, storms or other exceptional meteorological phenomena, did not occur, since these phenomena could generate tilt transients with an amplitude comparable with the earthquakes. The only external forces to still be considered were tides [39]. Due to their harmonic nature, tides can be removed by estimating the tilt trends over long time windows; time windows whose length is equal to an integer multiple of the tidal constituents’ proper period (in our case diurnal, T = 24 h, and semidiurnal, T = 12 h). We performed several tests to calibrate the window length over which to estimate this long-term tilt. A 10-day window containing each seismic event gave the best choice. Once we removed the tides and excluded the presence of any other spurious exogenous disturbance, the residual tilt trend is likely to be mainly determined by the seismic force. For each tiltmeter, the estimated tilt trend vector was then reported on the plots of co-seismic static displacement generated by Coulomb software. The results, summarized in Table 3, show a very satisfactory agreement. The stations closer to the Mt. Vesuvius crater, IMB and CMT, seem more sensitive to the VTs’ effect, while the two farthest stations are often insensitive. We also performed two formal tests estimating the effective derivative of the static displacement in a neighborhood of the point of the displacement grid closer to the tiltmeter position, using the selected earthquakes. We found that the two vectors, namely the long-term tilt trend and the derivative of the seismic static displacement, have a comparable size and direction (Figure 6). The discrepancies between the two vectors are likely ascribable to the propagation of uncertainties thorough the various passages (i.e., inaccuracies from simplifying assumptions) and to the presence of spurious ground motion sources that are not trivial to deal with.
The aim of this study was to find a procedure to compare the co-seismic displacement and the ground tilt, and, for this, we showed a possible approach. By applying a series of well-established seismological methodologies and formulating a new approach to perform the comparison among these two quantities, we found that the tiltmeters installed at Mt. Vesuvius are likely able to render the co-seismic static displacement well. This result can have useful repercussions, i.e., in case of need, tiltmeters could be used to integrate seismic networks.
Although the outlined procedure needs to be further tested on a wider dataset, the obtained results are promising and show that it could be easily applied in other sites. Future improvements are likely to be achieved by using more recent and realistic approaches which take into account topographic effects, heterogeneities, and the behavior of the medium. These approaches could include Seismic Moment Tensor inversion, to estimate the source mechanisms, and/or the Boundary Element Method, to quantify the static displacement.

Author Contributions

Conceptualization, P.C. and C.R.; methodology, P.C., C.R., I.A. and S.P.; software, P.C., C.R., I.A. and S.P.; validation, P.C., C.R., I.A. and S.P.; formal analysis, P.C., C.R., I.A. and S.P.; investigation, P.C., C.R., I.A. and S.P.; resources, P.C., C.R., I.A. and S.P.; data curation, P.C., C.R., I.A. and S.P.; writing—original draft preparation, P.C., C.R., I.A. and S.P.; writing—review and editing, P.C., C.R., I.A. and S.P.; visualization, P.C., C.R., I.A. and S.P.; supervision, P.C. and C.R.; project administration, S.P.; funding acquisition, S.P. All authors have read and agreed to the published version of the manuscript.

Funding

This work is part of the INGV research project LAST: Linked Analysis of Seismic and Tiltmeter observables (Ricerca Libera 2019—Del. n. 53/2020).

Institutional Review Board Statement

Not applicable.

Informed Consent Statement

Not applicable.

Data Availability Statement

Data are available upon request.

Acknowledgments

We are grateful to the three referees that revised the manuscript, whose suggestions contributed to the improvement of this paper.

Conflicts of Interest

The authors declare no conflict of interest.

References

  1. Ricco, C.; Petrosino, S.; Aquino, I.; Cusano, P.; Madonia, P. Tracking the recent dynamics of Mt. Vesuvius from joint investigations of ground deformation, seismicity and geofluid circulation. Sci. Rep. 2021, 11, 965. [Google Scholar] [CrossRef] [PubMed]
  2. Madonia, P.; Federico, C.; Cusano, P.; Petrosino, S.; Aiuppa, A.; Gurrieri, S. Crustal dynamics of Mount Vesuvius from 1998 to 2005: Effects on seismicity and fluid circulation. J. Geophys. Res. Earth Surf. 2008, 113, 1–12. [Google Scholar] [CrossRef] [Green Version]
  3. Piochi, M.; Bruno, P.P.; De Astis, G. Relative roles of rifting tectonics and magma ascent processes: Inferences from geophysical, structural, volcanological, and geochemical data for the Neapolitan volcanic region (southern Italy). Geochem. Geophys. Geosystems 2005, 6, 1–25. [Google Scholar] [CrossRef]
  4. Petrosino, S.; Ricco, C.; Aquino, I. Modulation of Ground Deformation and Earthquakes by Rainfall at Vesuvius and Campi Flegrei (Italy). Front. Earth Sci. 2021, 9, 758602. [Google Scholar] [CrossRef]
  5. Voight, B.; Hoblitt, R.P.; Clarke, A.B.; Lockhart, A.B.; Miller, A.D.; Lynch, L.; McMahon, J. Remarkable cyclic ground deformation monitored in real-time on Montserrat, and its use in eruption forecasting. Geophys. Res. Lett. 1998, 25, 3405–3408. [Google Scholar] [CrossRef]
  6. Genco, R.; Ripepe, M. Inflation-deflation cycles revealed by tilt and seismic records at Stromboli volcano. Geophys. Res. Lett. 2010, 37, L12302. [Google Scholar] [CrossRef]
  7. Honda, R.; Yukutake, Y.; Morita, Y.; Sakai, S.; Itadera, K.; Kokubo, K. Precursory tilt changes associated with a phreatic eruption of the Hakone volcano and the corresponding source model. Earth, Planets Space 2018, 70, 117. [Google Scholar] [CrossRef] [Green Version]
  8. Ricco, C.; Petrosino, S.; Aquino, I.; Del Gaudio, C.; Falanga, M. Some Investigations on a Possible Relationship between Ground Deformation and Seismic Activity at Campi Flegrei and Ischia Volcanic Areas (Southern Italy). Geosciences 2019, 9, 222. [Google Scholar] [CrossRef] [Green Version]
  9. Bianco, F.; Castellano, M.; Milano, G.; Ventura, G.; Vilardo, G. The Somma–Vesuvius stress field induced by regional tectonics: Evidences from seismological and mesostructural data. J. Volcanol. Geotherm. Res. 1998, 82, 199–218. [Google Scholar] [CrossRef]
  10. Ventura, G.; Vilardo, G. Slip tendency analysis of the Vesuvius Faults: Implications for the seismotectonic and volcanic hazard assessment. Geophys. Res. Lett. 1999, 26, 3229–3232. [Google Scholar] [CrossRef]
  11. D’Auria, L.; Massa, B.; De Matteo, A. The stress field beneath a quiescent stratovolcano: The case of Mount Vesuvius. J. Geophys. Res. Solid Earth 2014, 119, 1181–1199. [Google Scholar] [CrossRef]
  12. Bellucci Sessa, E.; Borriello, G.; Cirillo, F. NAPLES (moNitoring mAps of camPania voLcanoES). 2022. Available online: https://zenodo.org/record/5886962 (accessed on 4 February 2022).
  13. Zollo, A.; Marzocchi, W.; Capuano, P.; Lomax, A.; Iannaccone, G. Space and Time Behavior of Seismic Activity at Mt. Vesuvius Volcano, Southern Italy. Bull. Seism. Soc. Am. 2002, 92, 625–640. [Google Scholar] [CrossRef]
  14. Del Pezzo, E.; Bianco, F.; Saccorotti, G. Seismic source dynamics at Vesuvius volcano, Italy. J. Volcanol. Geotherm. Res. 2004, 133, 23–39. [Google Scholar] [CrossRef]
  15. Caliro, S.; Chiodini, G.; Avino, R.; Minopoli, C.; Bocchino, B. Long time-series of chemical and isotopic compositions of Vesuvius fumaroles: Evidence for deep and shallow processes. Ann. Geophys. 2011, 54, 137–149. [Google Scholar] [CrossRef]
  16. Bianco, F.; Cusano, P.; Petrosino, S.; Buonocunto, C.; Castellano, M.; Capello, M.; Del Pezzo, E. Small-aperture Array for Seismic Monitoring of Mt. Vesuvius. Seism. Res. Lett. 2005, 76, 334–355. [Google Scholar] [CrossRef]
  17. Petrosino, S.; Cusano, P. Low frequency seismic source investigation in volcanic environment: The Mt. Vesuvius atypical case. Adv. Geosci. 2020, 52, 29–39. [Google Scholar] [CrossRef]
  18. Galluzzo, D.; Nardone, L.; La Rocca, M.; Esposito, A.M.; Manzo, R.; Di Maio, R. Statistical moments of power spectrum: A fast tool for the classification of seismic events recorded on volcanoes. Adv. Geosci. 2020, 52, 67–74. [Google Scholar] [CrossRef]
  19. Ricco, C.; Aquino, I.; Borgstrom, I.B.S.; Del Gaudio, C. 19 years of tilt data on Mt. Vesuvius: State of the art and future perspectives. Ann. Geophys. 2013, 56, S0453. [Google Scholar] [CrossRef]
  20. Borgia, A.; Tizzani, P.; Solaro, G.; Manzo, M.; Casu, F.; Luongo, G.; Pepe, A.; Berardino, P.; Fornaro, G.; Sansosti, E.; et al. Volcanic spreading of Vesuvius, a new paradigm for interpreting its volcanic activity. Geophys. Res. Lett. 2005, 32, L03303. [Google Scholar] [CrossRef]
  21. Galluzzo, D.; Del Pezzo, E.; La Rocca, M.; Petrosino, S. Peak ground acceleration produced by local earthquakes in volcanic areas of Campi Flegrei and Mt. Vesuvius. Ann. Geophys. 2004, 47, 1377–1389. [Google Scholar] [CrossRef]
  22. Galluzzo, D.; Del Pezzo, E.; La Rocca, M.; Castellano, M.; Bianco, F. Source Scaling and Site Effects at Vesuvius Volcano. Bull. Seism. Soc. Am. 2009, 99, 1705–1719. [Google Scholar] [CrossRef]
  23. Lin, J.; Stein, R.S. Stress triggering in thrust and subduction earthquakes and stress interaction between the southern San Andreas and nearby thrust and strike-slip faults. J. Geophys. Res. Solid Earth 2004, 109, B02303. [Google Scholar] [CrossRef] [Green Version]
  24. Toda, S.; Stein, R.S.; Sevilgen, V.; Lin, J. Coulomb 3.3 Graphic-Rich Deformation and Stress-Change Software for Earthquake, Tectonic, and Volcano Research and Teaching-User Guide. 2011. Available online: https://pubs.usgs.gov/of/2011/1060/ (accessed on 27 December 2021).
  25. La Rocca, M.; Galluzzo, G. Seismic monitoring of Campi Flegrei and Vesuvius by stand-alone instruments. Ann. Geophys. 2015, 58, S0544. [Google Scholar] [CrossRef]
  26. Orazi, M.; D’Auria, L.; Tramelli, A.; Buonocunto, C.; Capello, M.; Caputo, A.; De Cesare, W.; Giudicepietro, F.; Martini, M.; Peluso, R.; et al. The seismic monitoring network of Mt. Vesuvius. Ann. Geophys. 2013, 56, S0450. [Google Scholar] [CrossRef]
  27. Lo Bascio, D.; Ricciolino, P. Cataloghi Sismici Dei Vulcani Campani. Stazione OVO Vesuvio dal 1972 al 2021 (Version 1.0); Istituto Nazionale di Geofisica e Vulcanologia (INGV): Rome, Italy, 2021. [CrossRef]
  28. Reasenberg, P.A.; Oppenheimer, D. FPFIT, FPPLOT, and FPPAGE: Fortran Computer Programs for Calculating and Displaying Earthquake Fault-Plane Solutions 1985. Available online: https://pubs.er.usgs.gov/publication/ofr85739 (accessed on 22 October 2021).
  29. Lomax, A.; Virieux, J.; Volant, P.; Berge, C. Probabilistic Earthquake Location in 3D and Layered Models: Introduction of a Metropolis-Gibbs method and comparison with linear locations. In Advances in Seismic Event Location; Thurber, C.H., Rabinowitz, N., Eds.; Kluwer: Dordrecht, The Netherlands, 2000; pp. 101–134. [Google Scholar] [CrossRef]
  30. Lay, T.; Wallace, T.C. Modern Global Seismology; Academic Cambridge Press: London, UK, 1995. [Google Scholar]
  31. Aki, K.; Richards, P. Quantitative Seismology: Theory and Methods; Freeman: San Francisco, CA, USA, 1980. [Google Scholar]
  32. Okada, Y. Internal deformation due to shear and tensile faults in a half-space. Bull. Seism. Soc. Am. 1992, 82, 1018–1040. [Google Scholar] [CrossRef]
  33. MathWorks Inc. MATLAB 1994–2022. Available online: https://it.mathworks.com/products/matlab.html (accessed on 24 February 2022).
  34. Battaglia, M.; Cervelli, P.; Murray, J. Modeling of Volcanic Processes. In Modeling Crustal Deformation near Active Faults and Volcanic Centers—A Catalog of Deformation Models; CreateSpace Independent Publishing Platform: Scotts Valley, CA, USA, 2013. [Google Scholar]
  35. Lomax, A.; Zollo, A.; Capuano, P.; Virieux, J. Precise, absolute earthquake location under Somma–Vesuvius volcano using a new 3D velocity model. Geophys. J. Int. 2001, 146, 313–331. [Google Scholar] [CrossRef]
  36. Iannaccone, G.; Alessio, G.; Borriello, G.; Cusano, P.; Petrosino, S.; Ricciolino, P.; Talarico, G.; Torello, V. Characteristics of the seismicity of Vesuvius and Campi Flegrei during the year 2000. Ann. Geophys. 2009, 44, 1075–1091. [Google Scholar] [CrossRef]
  37. Tammaro, U.; Riccardi, U.; Romano, V.; Meo, M.; Capuano, P. Topography and structural heterogeneities in surface ground deformation: A simulation test for Somma-Vesuvius volcano. Adv. Geosci. 2021, 52, 145–152. [Google Scholar] [CrossRef]
  38. Aloisi, M.; Mattia, M.; Monaco, C.; Pulvirenti, F. Magma, faults, and gravitational loading at Mount Etna: The 2002–2003 eruptive period. J. Geophys. Res. Earth Surf. 2011, 116, B05203. [Google Scholar] [CrossRef]
  39. Wyatt, F.; Cabaniss, G.; Agnew, D.C. A comparison of tiltmeters at tidal frequencies. Geophys. Res. Lett. 1982, 9, 743–746. [Google Scholar] [CrossRef]
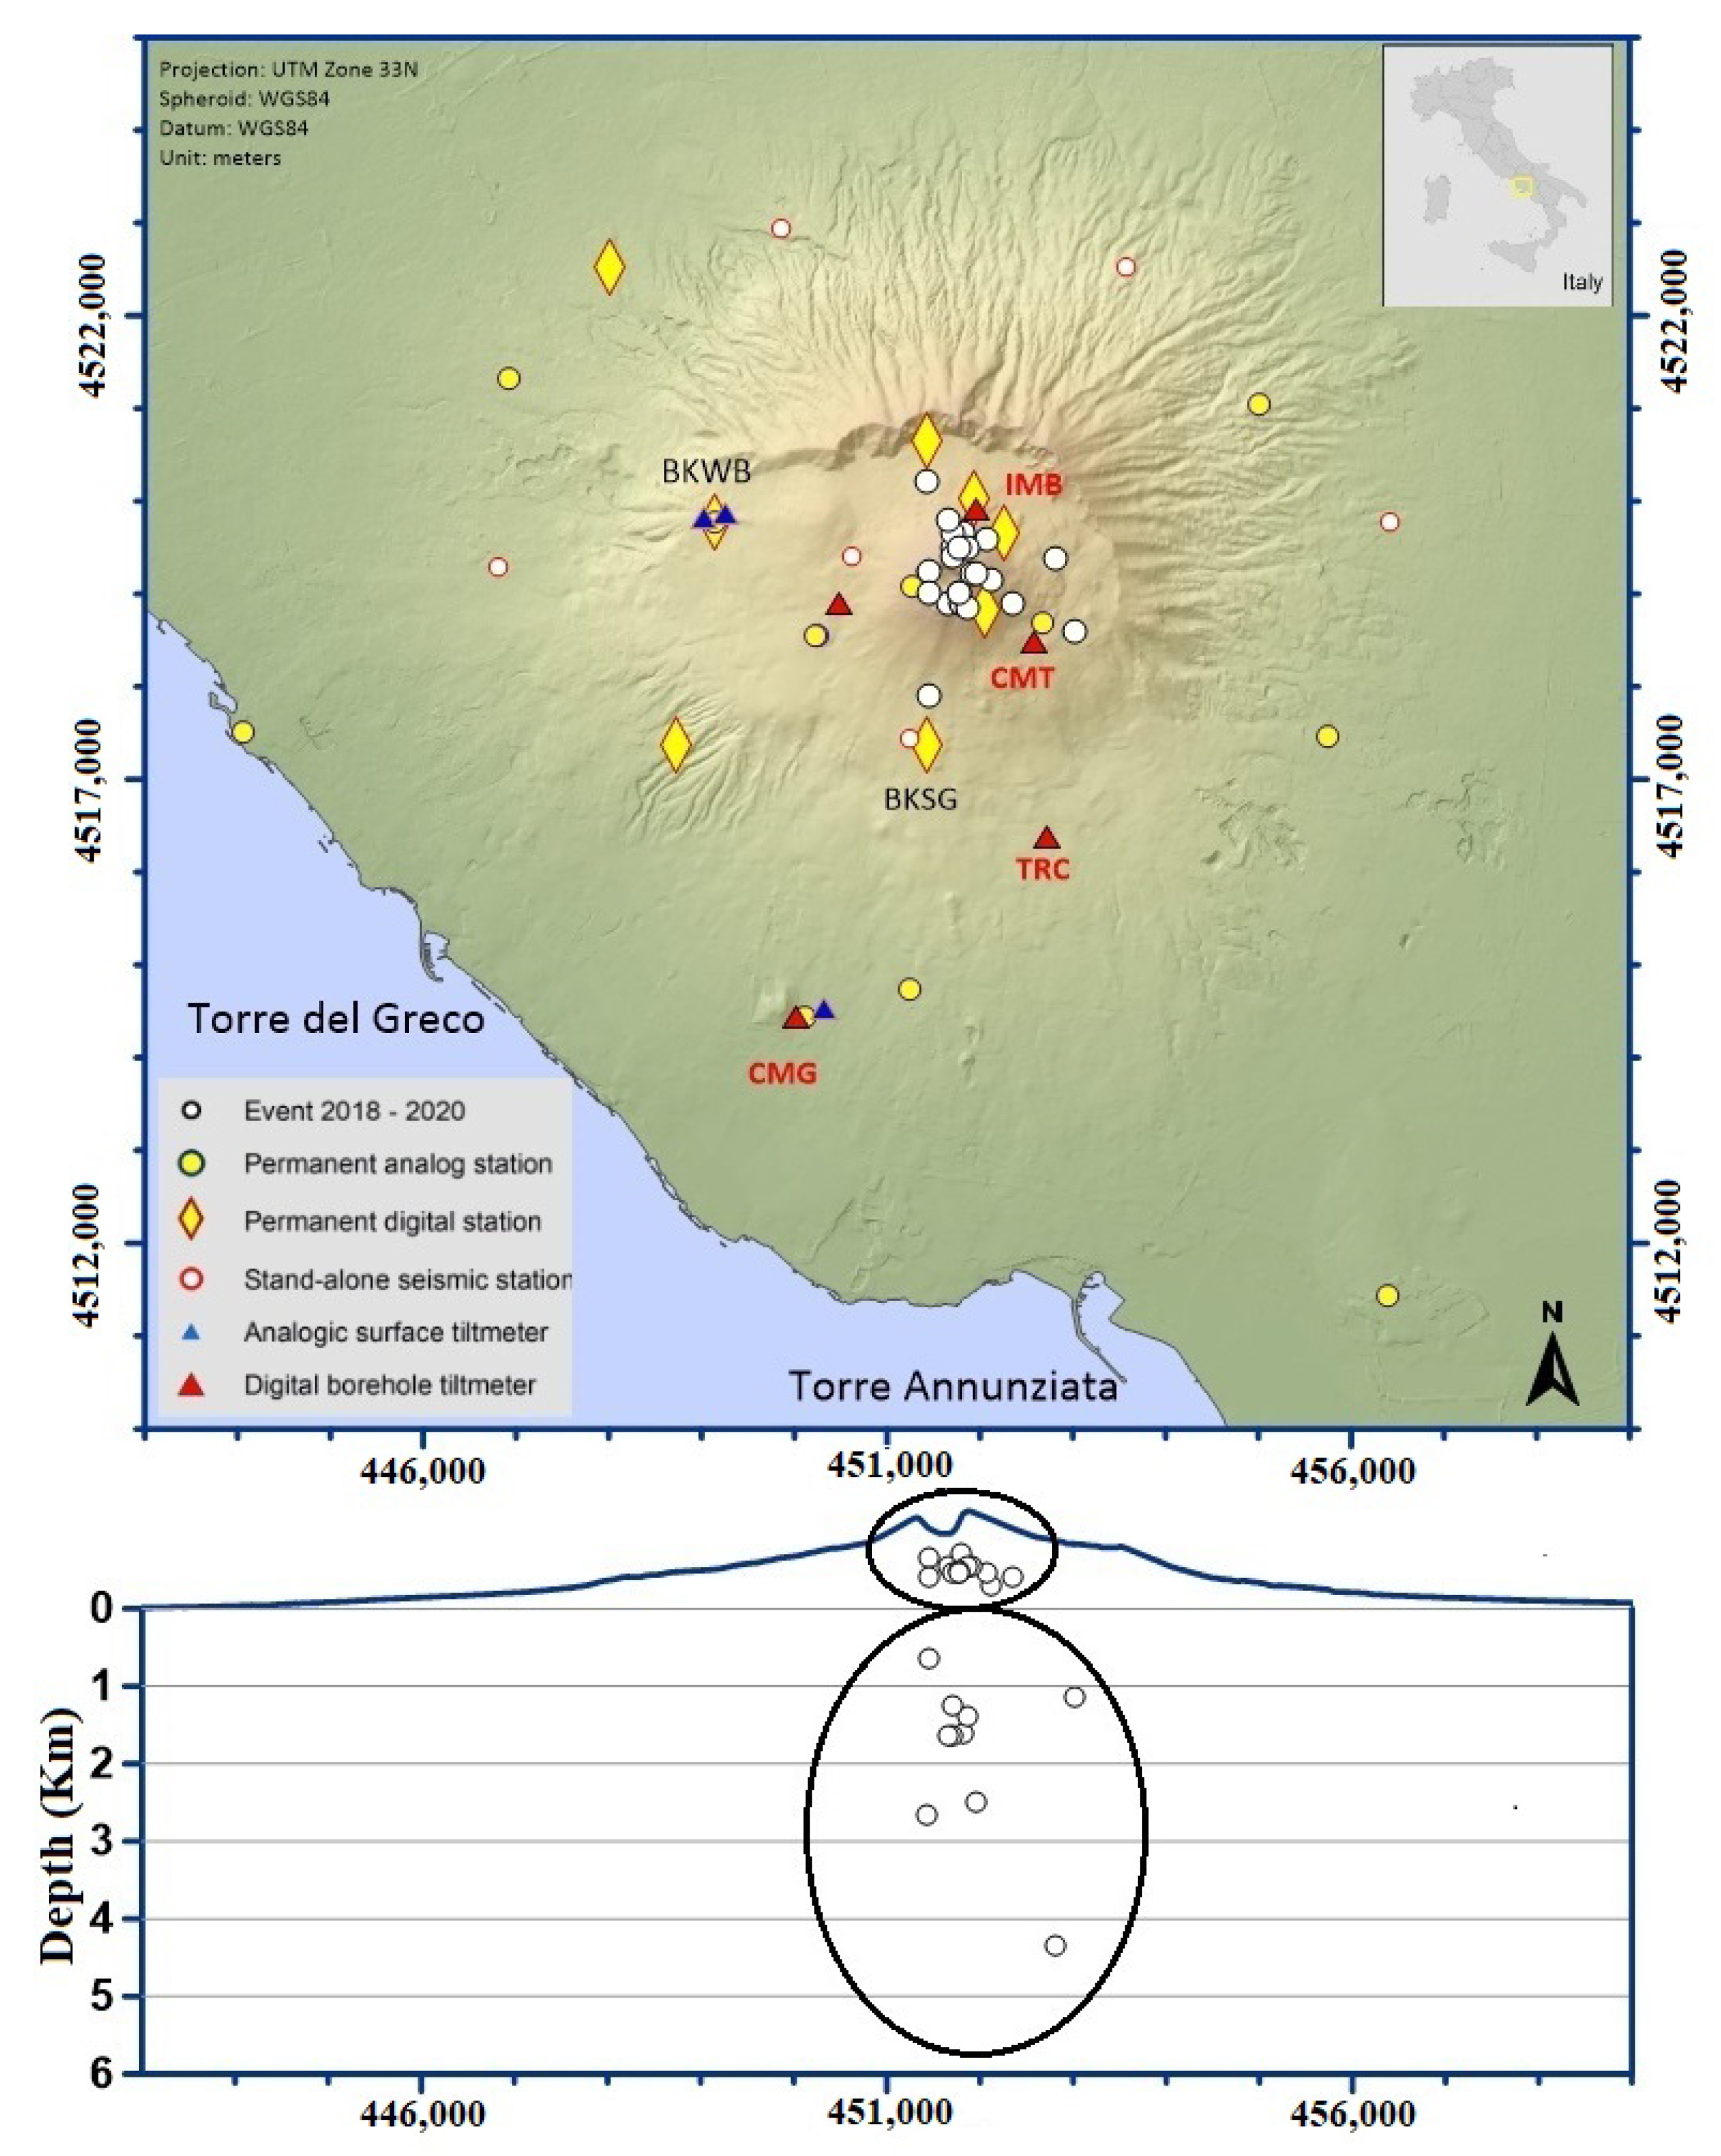
Figure 1. On the (top) OV-INGV seismic and tiltmeter monitoring networks at Mt. Vesuvius and location of the VT earthquakes with MD ≥ 2.0 (black edged white circles) used in this study (courtesy of Dr. E. Bellucci Sessa [12]). On the (bottom) is an EW section with VT focal depths. The black ellipses roughly indicate the two source volumes individuated for the recent Mt. Vesuvius seismicity. The horizontal coordinates are expressed in UTM.
Applsci 12 12261 g001
Figure 2. (a) The 2018/04/26 18:04 VT earthquake. On the left, a beachball representing the focal mechanism estimated by FPFIT software, with the calculated parameters. On the right top, seismograms for the three components of BKSG station (black line). The selected S-wave packet is marked in red. On the right bottom, seismograms for the three components of BKWB station (black line). The selected S-wave packet is marked in red. (b) The same for the 2019/05/18 21:11 VT earthquake. ERZ and ERH values equal to 0.0 indicate location errors ≤ 0.1 km.
Applsci 12 12261 g002
Figure 3. Examples of source spectra, in loglog plots. For BKWB station, the spectra are shown in black, the linear interpolations of the low-frequency level are reported in dark blue, and the high-frequency pattern interpolations (~17–27 Hz) are in red. For BKSG, the spectra are gray, the low-frequency levels are light blue, and the high-frequency patterns are magenta. (a,b) show the temporal indication and the MD value. The fc values are calculated from the intersection of the low- and high-frequency asymptotes (shown by a gold oval).
Applsci 12 12261 g003
Figure 4. Example of 3D displacement estimated with Coulomb. Static displacement generated for (a) the 2018/04/26 and (b) the 2019/05/18 VT earthquakes in correspondence with IMB tiltmeter depth. The tiltmeter is indicated by a golden diamond. The yellow triangle indicates the vertex of the Mt. Vesuvius crater. The color bars specify the displacement values, to which a magnification was applied to better visualize the vertical displacement spatial pattern.
Applsci 12 12261 g004
Figure 5. An example of long-term coherence (LTC—i.e., coherent with the displacement pattern represented in 3D and 2D) recorded at IMB on 2019/05/18. The blue arrows indicate the long-term tilt direction. The color bars specify the seismic displacement values, to which a magnification was applied to better visualize the vertical displacement spatial pattern. The red cross marks the absolute maximum value of the displacement field, while the blue cross indicates the absolute minimum deformation.
Applsci 12 12261 g005
Figure 6. Left side, from top left to bottom: NS component recorded at IMB 12-h before and after the earthquake of 2019/05/18; same component recorded five days before and after the earthquake (the signal highlighted in blue corresponds to the 24-h time window); EW component recorded 12 h before and after the earthquake; same component recorded five days before and after the earthquake (the signal highlighted in green corresponds to the 24-h time window). Right side: ground tilt recorded at IMB in a 24-h period straddling the earthquake. The curve in red represents the filtered signal while the blue arrow indicates the direction of ground tilt calculated over ten days (LTC). The green cross symbol indicates the tilt actually recorded during the event while the solid dot indicates that calculated by the displacement.
Applsci 12 12261 g006
Table 1. Earthquakes’ origin time, epicenter location, focal depth and source kinematic parameters.
Origin Time
(yyyymmdd hh:MM s)
Latitude N
(deg min)
Longitude E
(deg min)
Depth 1
(km)
MDStrike 2Dip 3Rake 4
20180426 18:04 41.8240 49.3214 25.93−0.302.11045−150
20180509 21:58 07.6740 49.1814 25.60−0.552.3507080
20180522 15:37 35.1640 49.5914 25.711.602.37570140
20180816 13:14 09.3740 49.5614 25.89−0.452.2556540
20181016 01:07 14.1340 49.1814 25.71−0.702.57580130
20181129 15:55 12.4640 49.5114 25.641.652.315510−40
20181201 10:11 08.9140 49.5114 25.751.402.2035−140
20181202 19:09 18.5740 49.5914 25.641.252.514530−50
20181202 23:42 50.5040 49.6714 25.601.652.524080140
20181209 12:24 29.6840 49.1814 26.10−0.402.120400
20190518 21:11 17.9740 49.4514 26.424.352.51256560
20190816 20:15 44.1740 49.1814 25.71−0.502.11545−140
20200115 18:43 52.0340 49.0214 26.571.152.317050−50
20200213 19:14 44.5040 49.8914 25.432.652.2570−80
20200319 03:48 07.1640 49.2414 25.68−0.452.42858510
20200424 00:17 04.7140 49.3714 25.46−0.652.31560−140
20200427 04:47 38.0140 49.3514 25.78−0.552.124085−40
20200708 23:51 31.1540 49.2414 25.46−0.402.114525−50
20200720 05:57 59.2140 49.4514 25.64−0.452.23256520
20200803 02:07 05.4640 49.1614 25.75−0.552.360350
20200811 17:53 49.4840 49.3514 25.822.502.01703520
20200902 01:16 27.1940 49.2414 25.68−0.502.1803010
20200923 21:45 51.8840 48.6414 25.460.652.36590−20
20201122 23:39 32.0840 49.5114 25.68−0.452.120350
1 Depth is negative above sea level and positive downwards. 2 Strike is measured clockwise from North. 3 Dip is measured down from horizontal. 4 Rake of 0 = left lateral, 90 = reverse, ±180 = right lateral, −90 = normal.
Table 2. Coulomb grid parameters used to estimate static ground displacement [24].
Grid Parameters Value (km)
Start-x−6.5
Start-y−5.0
Finish-x6.5
Finish-y5.0
x-increment0.2
y-increment0.2
Size ParametersValue
Plot size2.0
Shade/Color increment2.0
Exaggeration for disp.& dist.5,000,000.00
Cross section defaultValue (km)
Start-x−6.5
Start-y−5.0
Finish-x6.5
Finish-y5.0
Distant-increment0.5
Z-depth5.0
Z-increment0.25
Map info (°)value
min. lon14.3482406
max. lon14.5016126
zero lon14.4248700
min. lat40.7751370
max. lat40.8659860
zero lat40.8205900
Table 3. The table shows the coherence (LTC) or inconsistency (NC) between tilting direction for each earthquake and tilt station calculated over 10-day windows and the displacement pattern. LTCs were observed in 72% of earthquakes at IMB, 69% at CMT, 36% at TRC and 22% at CMG, while earthquakes were too far (TF) from stations in 11% of cases at IMB, 13% at CMT, 59% at TRC and 74% at CMG.
Earthquakes Depth
(km)
MDIMB CMTTRCCMG
120180426−0.302.1LTCLTCTFTF
220180509−0.552.3LTCLTCTFTF
3201805221.602.3LTCNCLTCTF
420180816−0.452.2No VT and Tilt dataNo VT dataNo VT and Tilt dataNo VT data
520181016−0.702.5No Tilt dataLTCTFTF
6 201811291.652.3No Tilt dataLTCLTC although TFLTC
7201812011.402.2No Tilt dataNCLTCTF
8201812021.252.5No Tilt dataNCLTCLTC
9201812021.652.5No Tilt dataLTCLTCLTC
1020181209−0.402.1LTCLTCTFTF
11201905184.352.5LTCLTCLTCLTC
1220190816−0.502.1NCLTCTFTF
13202001151.152.3LTCLTCLTCLTC
14202002132.652.2NCLTCLTCLTC unclear
1520200319−0.452.4LTCLTCTFLTC although TF
1620200424−0.652.3LTCTFTFTF
1720200427−0.552.1LTCLTC although TFTFLTC although TF
1820200708−0.402.1NCLTCTFTF
1920200720−0.452.2LTCLTCTFTF
2020200803−0.552.3TFLTCTFTF
21202008112.502.0LTCLTCLTCNC
2220200902−0.502.1TFLTC unclearTFTF
23202009230.652.3LTCLTCNCTF
2420201122−0.452.1LTCTFTFTF
Legend: LTC = Long Term tilt direction Coherent with displacement. NC = long term tilt direction Not Coherent with displacement. TF = Tiltmeter too Far from the epicenter.
Publisher’s Note: MDPI stays neutral with regard to jurisdictional claims in published maps and institutional affiliations.