1. Introduction
An interlaboratory comparison (ILC) is an exercise carried out by a group of laboratories to compare their performance or to assess a measurement standard, and is typically used to (1) assess random variation in measurements across a population of laboratories, (2) determine the systematic differences in results among a fixed set of laboratories, or (3) determine the value of a physical property of an artifact or a population of artifacts [
1]. An ILC was conducted to evaluate the variability of
226Ra and
228Ra activity concentrations (hereafter referred to as concentrations) in groundwater and an adjacent surface water impoundment (Impoundment) at a former U mine and mill (Site) located in Converse County, WY, USA. Assessment of
226Ra +
228Ra trends at the Site compliance well and selected groundwater monitoring wells has shown that
226Ra +
228Ra concentrations are highly variable, and there is some uncertainty regarding the quality of isotopic Ra data reported for the Site.
The most common isotopes of Ra are
226Ra (produced by radioactive decay of
238U) and
228Ra (produced during radioactive decay of
232Th) [
2,
3]. At the Site,
228Ra is the dominate Ra isotope in groundwater, whereas
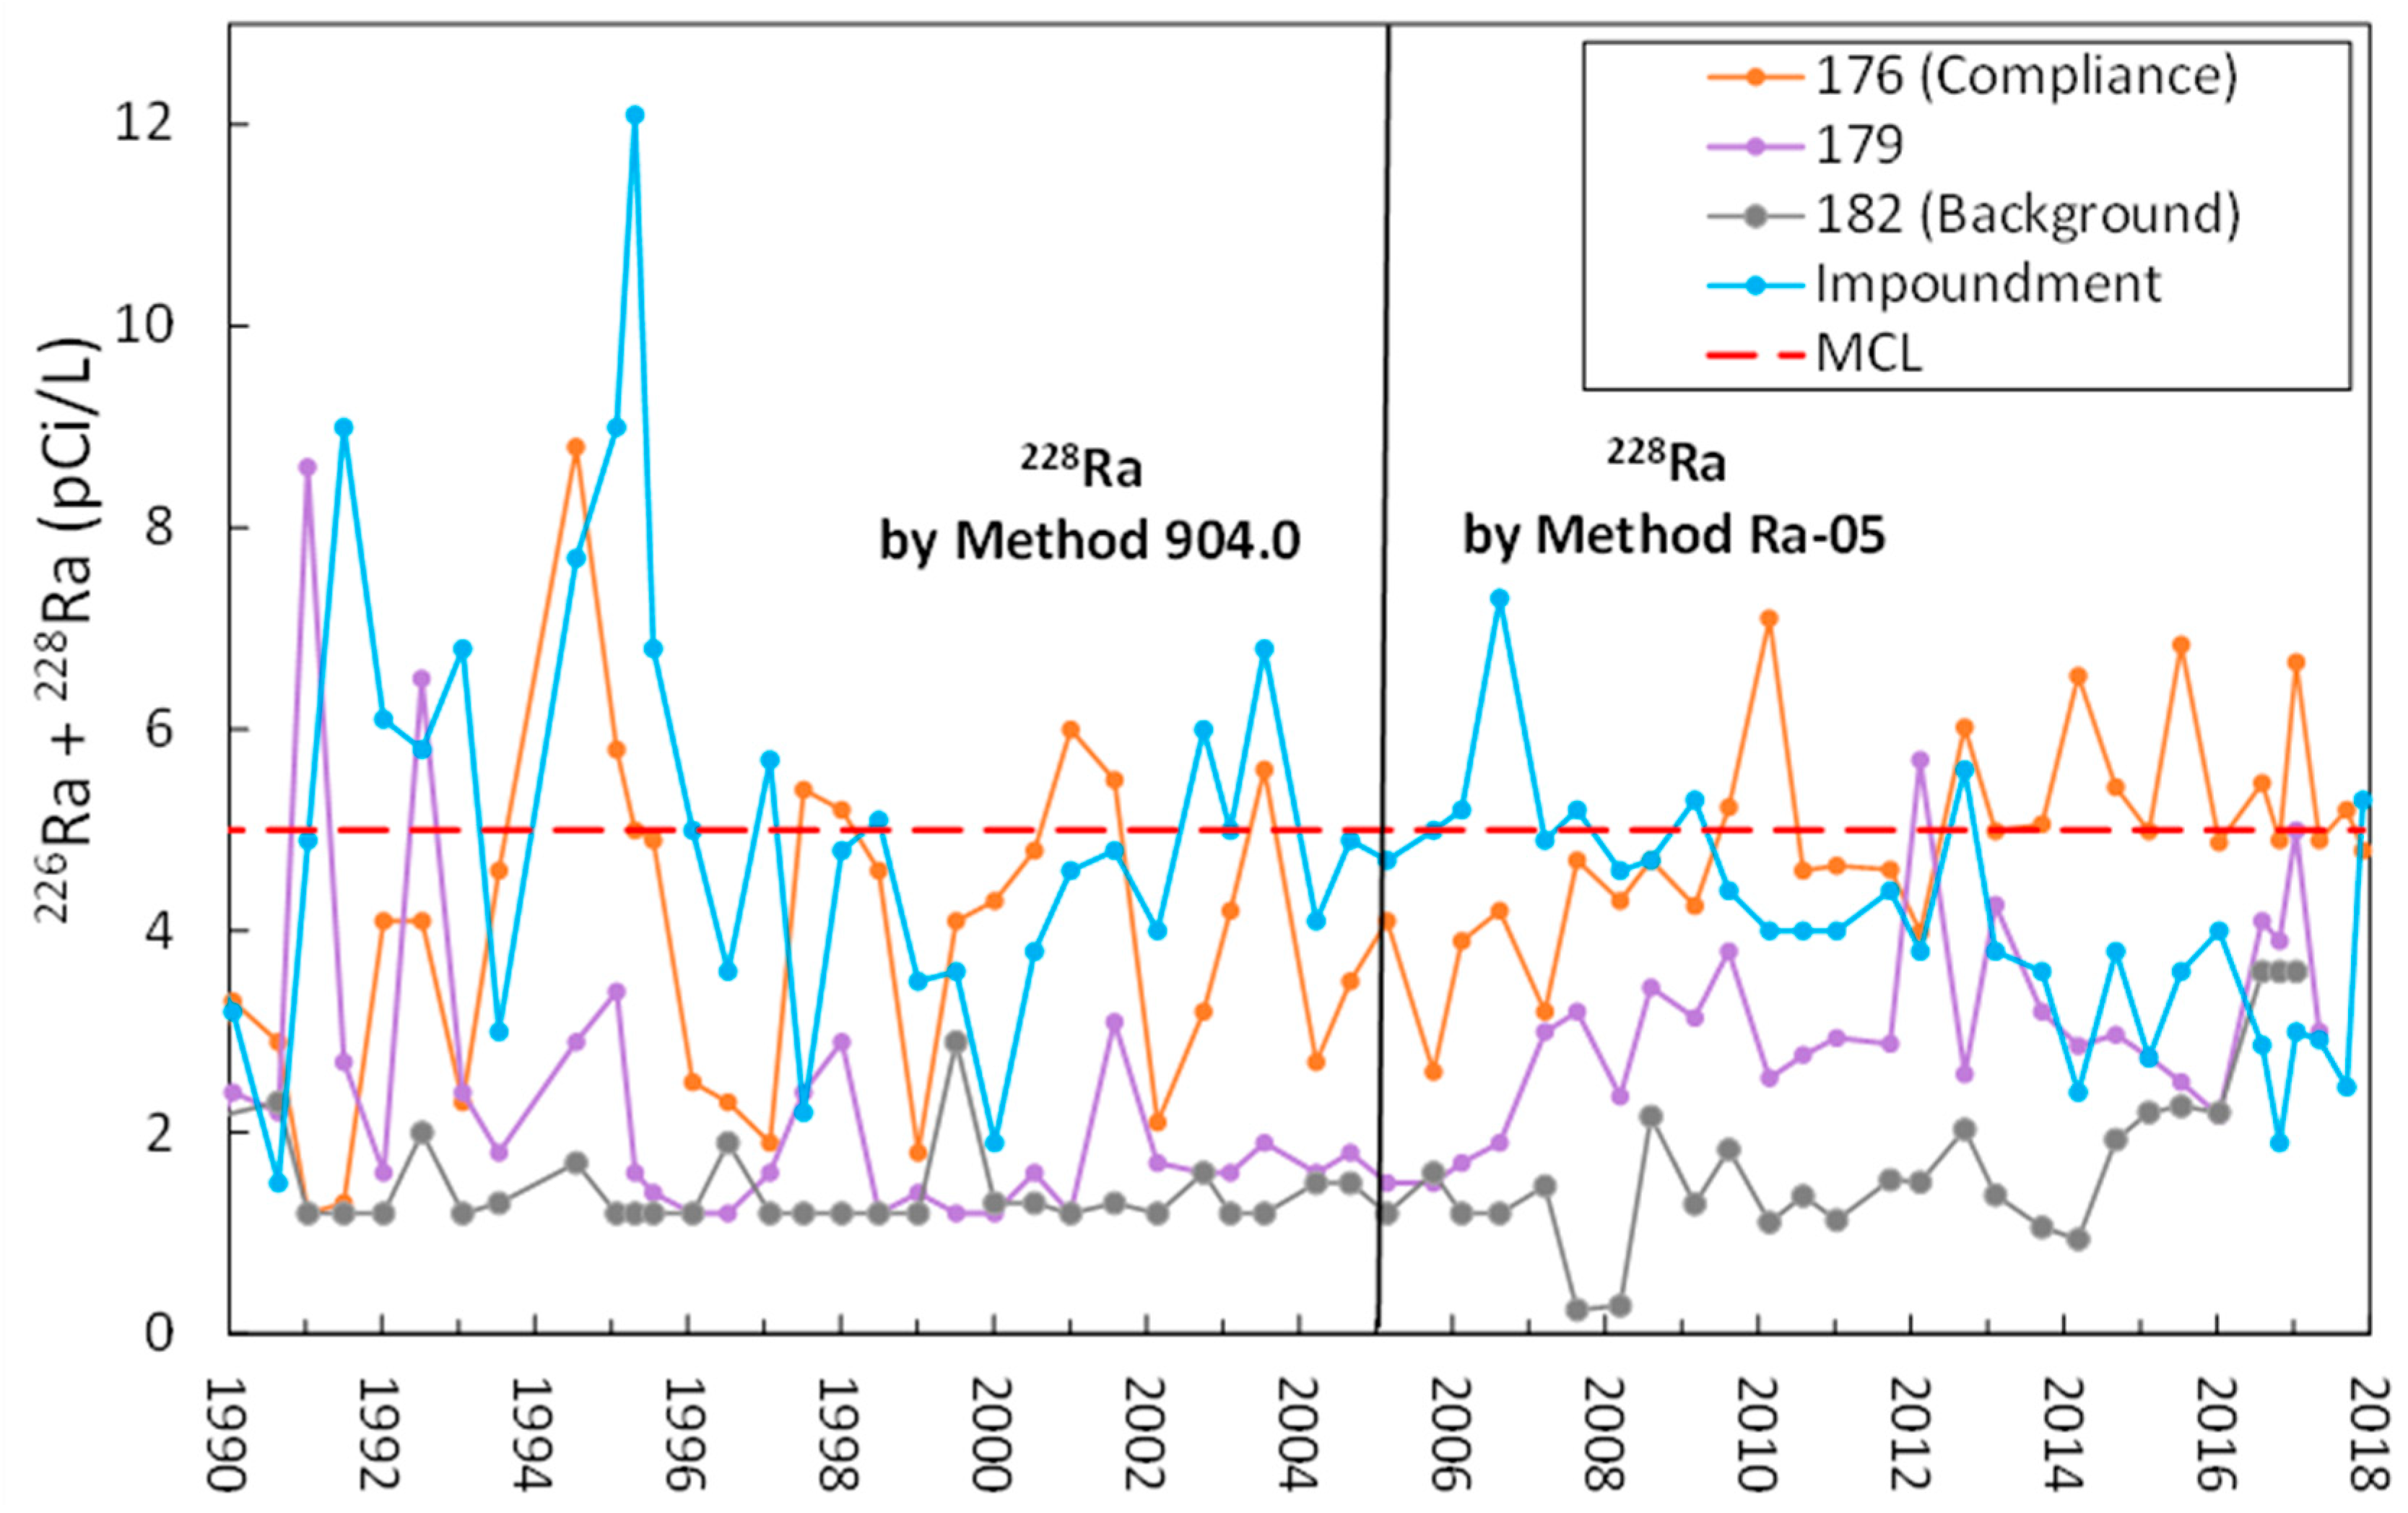
226Ra is the dominant Ra isotope in the adjacent Impoundment. At the Site compliance well (Well 176), the historic concentrations of
226Ra +
228Ra have periodically exceeded the compliance standard (USEPA Maximum Contaminant Level, MCL) of 5 pCi/L; since approximately 2005, however, the concentrations have shown an increasing trend and with more frequent exceedances of the MCL. In addition to a downgradient well (Well 179), an unexpected increasing trend and high variability in
226Ra +
228Ra concentrations have also been measured in the unimpacted Site background well (Well 182) since 2005 (
Figure 1). The implication of
226Ra +
228Ra concentrations exceeding the MCL at the compliance location (Well 176) is that the Site boundary may potentially need to be expanded to demonstrate that downgradient groundwater
226Ra +
228Ra concentrations will remain protective of human health and the environment.
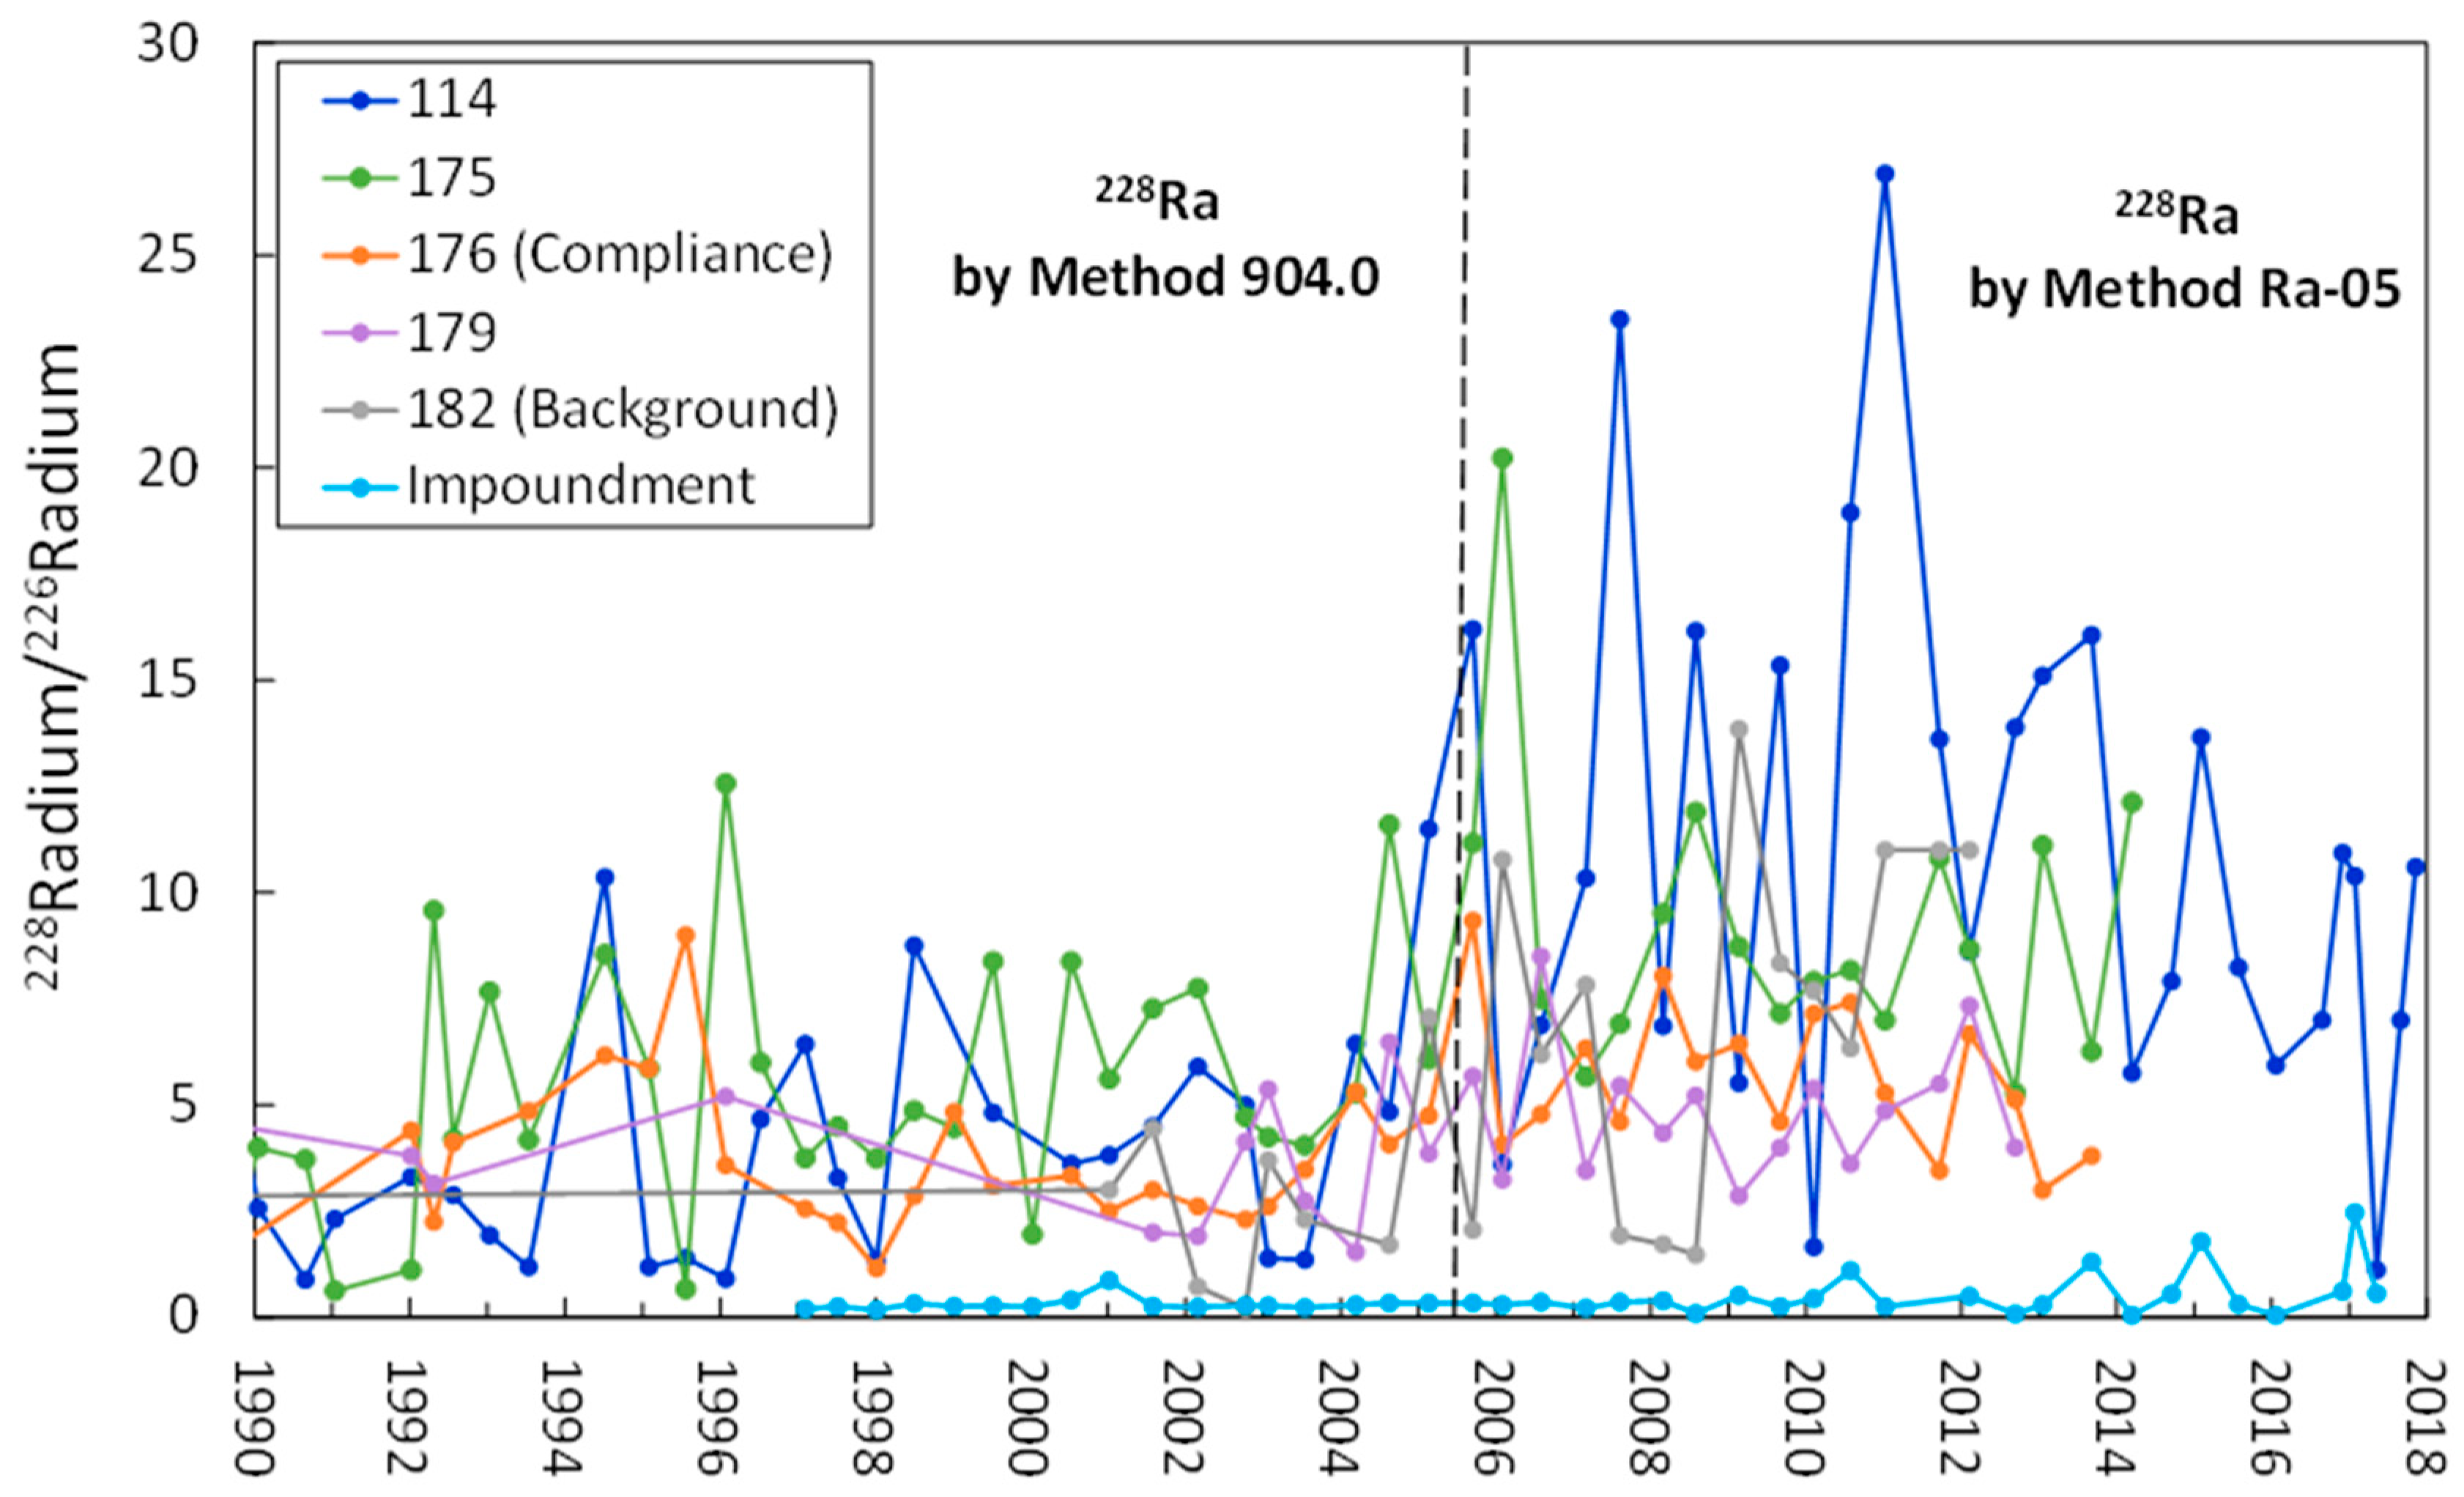
A preliminary internal evaluation of
226Ra +
228Ra results for Site groundwater indicated that increasing trends and high variability could be the result of analytical error by the contract laboratory based on several key observations: (1) increases in both
226Ra +
228Ra and
228Ra/
226Ra ratios occurred subsequent to a change in the
228Ra analytical method from Method 904.0 (M904.0) to Method Ra-05 (Ra-05) in 2005 (
Figure 1 and
Figure 2), (2) ratios of
228Ra/
226Ra have been increasing in the non-impacted Site background Well 182 concurrently with several other monitoring wells and the Impoundment (
Figure 2), and (3) re-analysis of samples with unusually elevated
228Ra has demonstrated at least one occurrence of poor reproducibility and significant analytical error in
228Ra measurements. For example, the reported
228Ra value for Site Well 174 (3rd Quarter in 2016) was 8.6 pCi/L, while the field duplicate value was reported as <1.3 pCi/L. Re-analysis results for these two samples were reported as 2.8 pCi/L
228Ra for the primary sample and 2.7 pCi/L
228Ra for the duplicate sample. In addition to the poor reproducibility of the field duplicate, additional
228Ra results appeared to be inaccurate. For instance,
228Ra for the unimpacted background well (Well 182) was reported as 27 pCi/L which is not consistent with much lower historical results for the background location. Reanalysis of the sample from Well 182 produced a revised result of 2.0 pCi/L. Out of nine total samples which were reanalyzed, the initial results from five samples exceeded the MCL for
226Ra +
228Ra based on
228Ra alone, but were reported as below the MCL after reanalysis. The contract laboratory was unable to provide an explanation as to why the reanalysis produced significantly different results from those initially reported.
Therefore, an ILC of 226Ra and 228Ra in selected groundwater wells and the adjacent Impoundment was conducted to evaluate the potential role of random variability and/or systematic error in producing the high variability in 226Ra + 228Ra concentrations and 228Ra/226Ra ratios observed during recent years. Four separate laboratories were evaluated which are designated as Lab A (Site contract laboratory), Lab B, Lab C, and Lab D. The specific objectives were to (1) evaluate potential differences between 226Ra results when using a screening method (M903.0) and compare those results to a 226Ra-specific method (M903.1) and (2) evaluate potential differences between 228Ra between laboratories using M904.0 and compare those results to 228Ra when using Method Ra-05. Additional questions include the following: (1) Are there detectable levels of 232Th in groundwater which could be migrating and influencing ratios of 228Ra/226Ra? (2) Are there differences between total (unfiltered) and dissolved (filtered, 0.45 µm) 226Ra or 228Ra, and if so, how do those fractions vary across laboratories? And (3) does M903.0 for 226Ra (which measures all alpha-emitting isotopes) overestimate 226Ra concentrations compared to M903.1 which is specific to 226Ra? If the presence of additional alpha emitters were to produce higher apparent 226Ra concentrations, it may be recommended to use M903.1, rather than M903.0, for future compliance monitoring at the Site.
2. Materials and Methods
The quality of
226Ra and
228Ra data reported by the existing contract laboratory (Lab A) was investigated using an ILC which included analysis of primary samples, a duplicate sample, and field blanks. Groundwater samples were collected from the Site compliance well (Well 176), the Site background well (Well 182), and from an intermediate well located outside of the Site boundary (Well 179). Surface water was collected from the adjacent Impoundment where the U ore was originally mined. Samples were collected for analysis of
226Ra and
228Ra, in addition to
232Th to evaluate the potential role of
232Th as a source of
228Ra. Water samples were split and processed accordingly to evaluate their dissolved (filtered, 0.45 µm pore-size filter) and total (unfiltered) forms. A duplicate was collected from Well 176, and field blanks (filtered and unfiltered) were prepared using deionized H
2O supplied by each laboratory. All sample collection, preservation, and storage protocols followed standard methods for water sample collection [
4]. At each location, the filtered and non-filtered samples were split into four groups and submitted to four laboratories designated as Lab A (existing contract laboratory), Lab B, Lab C, and Lab D. Each laboratory and their corresponding analytical methods are summarized in
Table 1.
The methods used for
232Th varied among laboratories but are all based on alpha spectroscopy; the methods used for
226Ra and
228Ra have been approved by the U.S. Environmental Protection Agency (USEPA) [
5] and also varied among the laboratories (
Table 2). For
226Ra, three of the laboratories (Labs A, B, C) used Method 903.0 (M903.0). Although the results are reported as
226Ra, M903.0 measures the total alpha emitting isotopes of Ra (
223Ra,
224Ra,
226Ra) and is therefore considered a screening method. Method 903.1 (M903.1), which is specific to
226Ra, was used by Lab D and can be compared to results from M903.0 to determine if other alpha emitting isotopes contribute to the reported
226Ra concentrations for the Site. For
228Ra, two of the laboratories used Method 904.0 (M904.0) (Labs B, C), while Lab A and Lab D used Method Ra-05. Each Ra method in
Table 2 has been approved for drinking water compliance analysis by the USEPA and therefore should not produce significantly different results [
6].
3. Results
The analytical results for total and dissolved
226Ra and
228Ra at all locations reported by the four laboratories are provided in
Table 3. All dissolved
232Th results were below the detection limit (0.0131 to 1.11 pCi/L) and only two total
232Th measurements were detectable at low concentrations (0.0074 and 0.017 pCi/L); therefore, the
232Th results are not tabulated. This section provides (1) a summary of the quality assurance/quality control (QA/QC) results (
Section 3.1), (2) a general overview of the dissolved and total
226Ra and
228Ra results from the various laboratories, (3) a more detailed comparison of dissolved and total
226Ra and
228Ra, and (4) an evaluation of the combined
226Ra +
228Ra results between laboratories relative to the MCL.
3.1. Quality Assurance/Quality Control (QA/QC) Summary
Laboratory data quality was evaluated based on results from method blanks (MB), laboratory control samples (LCS), LCS duplicates (LCSD), matrix spikes (MS), and MS duplicates (MSD) using USEPA guidelines [
7]. In the MBs, all
226Ra and
228Ra results were below their minimum detectable concentration (MDC). Data accuracy evaluation showed the percent recovery values for the LCS, LCSD, MS, and MSD were within recommended limits. Data precision evaluation showed that the relative percent differences (RPDs) for analytical duplicate samples and field duplicate samples were also within laboratory control limits for all analyses. Total
228Ra was detected above the MDC in the field blank by Lab A and Lab B, and dissolved
226Ra was detected above the MDC in the field blank by Lab C. Dissolved
228Ra was also detected above the MDC in the field blank by Lab D. Sample results containing less than 10× the amount found in the field blanks were qualified as being estimated with high bias (
Table 3) and were assigned a J+ qualifier.
Radiological data such as 226Ra and 228Ra are typically reported as the measured value ± the degree of precision. When a value is below the MDC, the actual value is still reported but the datum is flagged as non-detect and the MDC is provided. The sum of the 226Ra and 228Ra is subsequently calculated to determine the combined Ra (226Ra + 228Ra) that is typically used for compliance in the USA. If either of the 226Ra or 228Ra values are below detection, the value of the MDC for the non-detect value is summed with the detectable value to calculate the 226Ra + 228Ra concentration. When both 226Ra and228Ra values are below detection, the respective MDC values are summed to obtain the MDC for the combined 226Ra and228Ra, which is then reported as below detection. The sum of individual precision values for 226Ra and 228Ra is used as the overall precision for 226Ra + 228Ra.
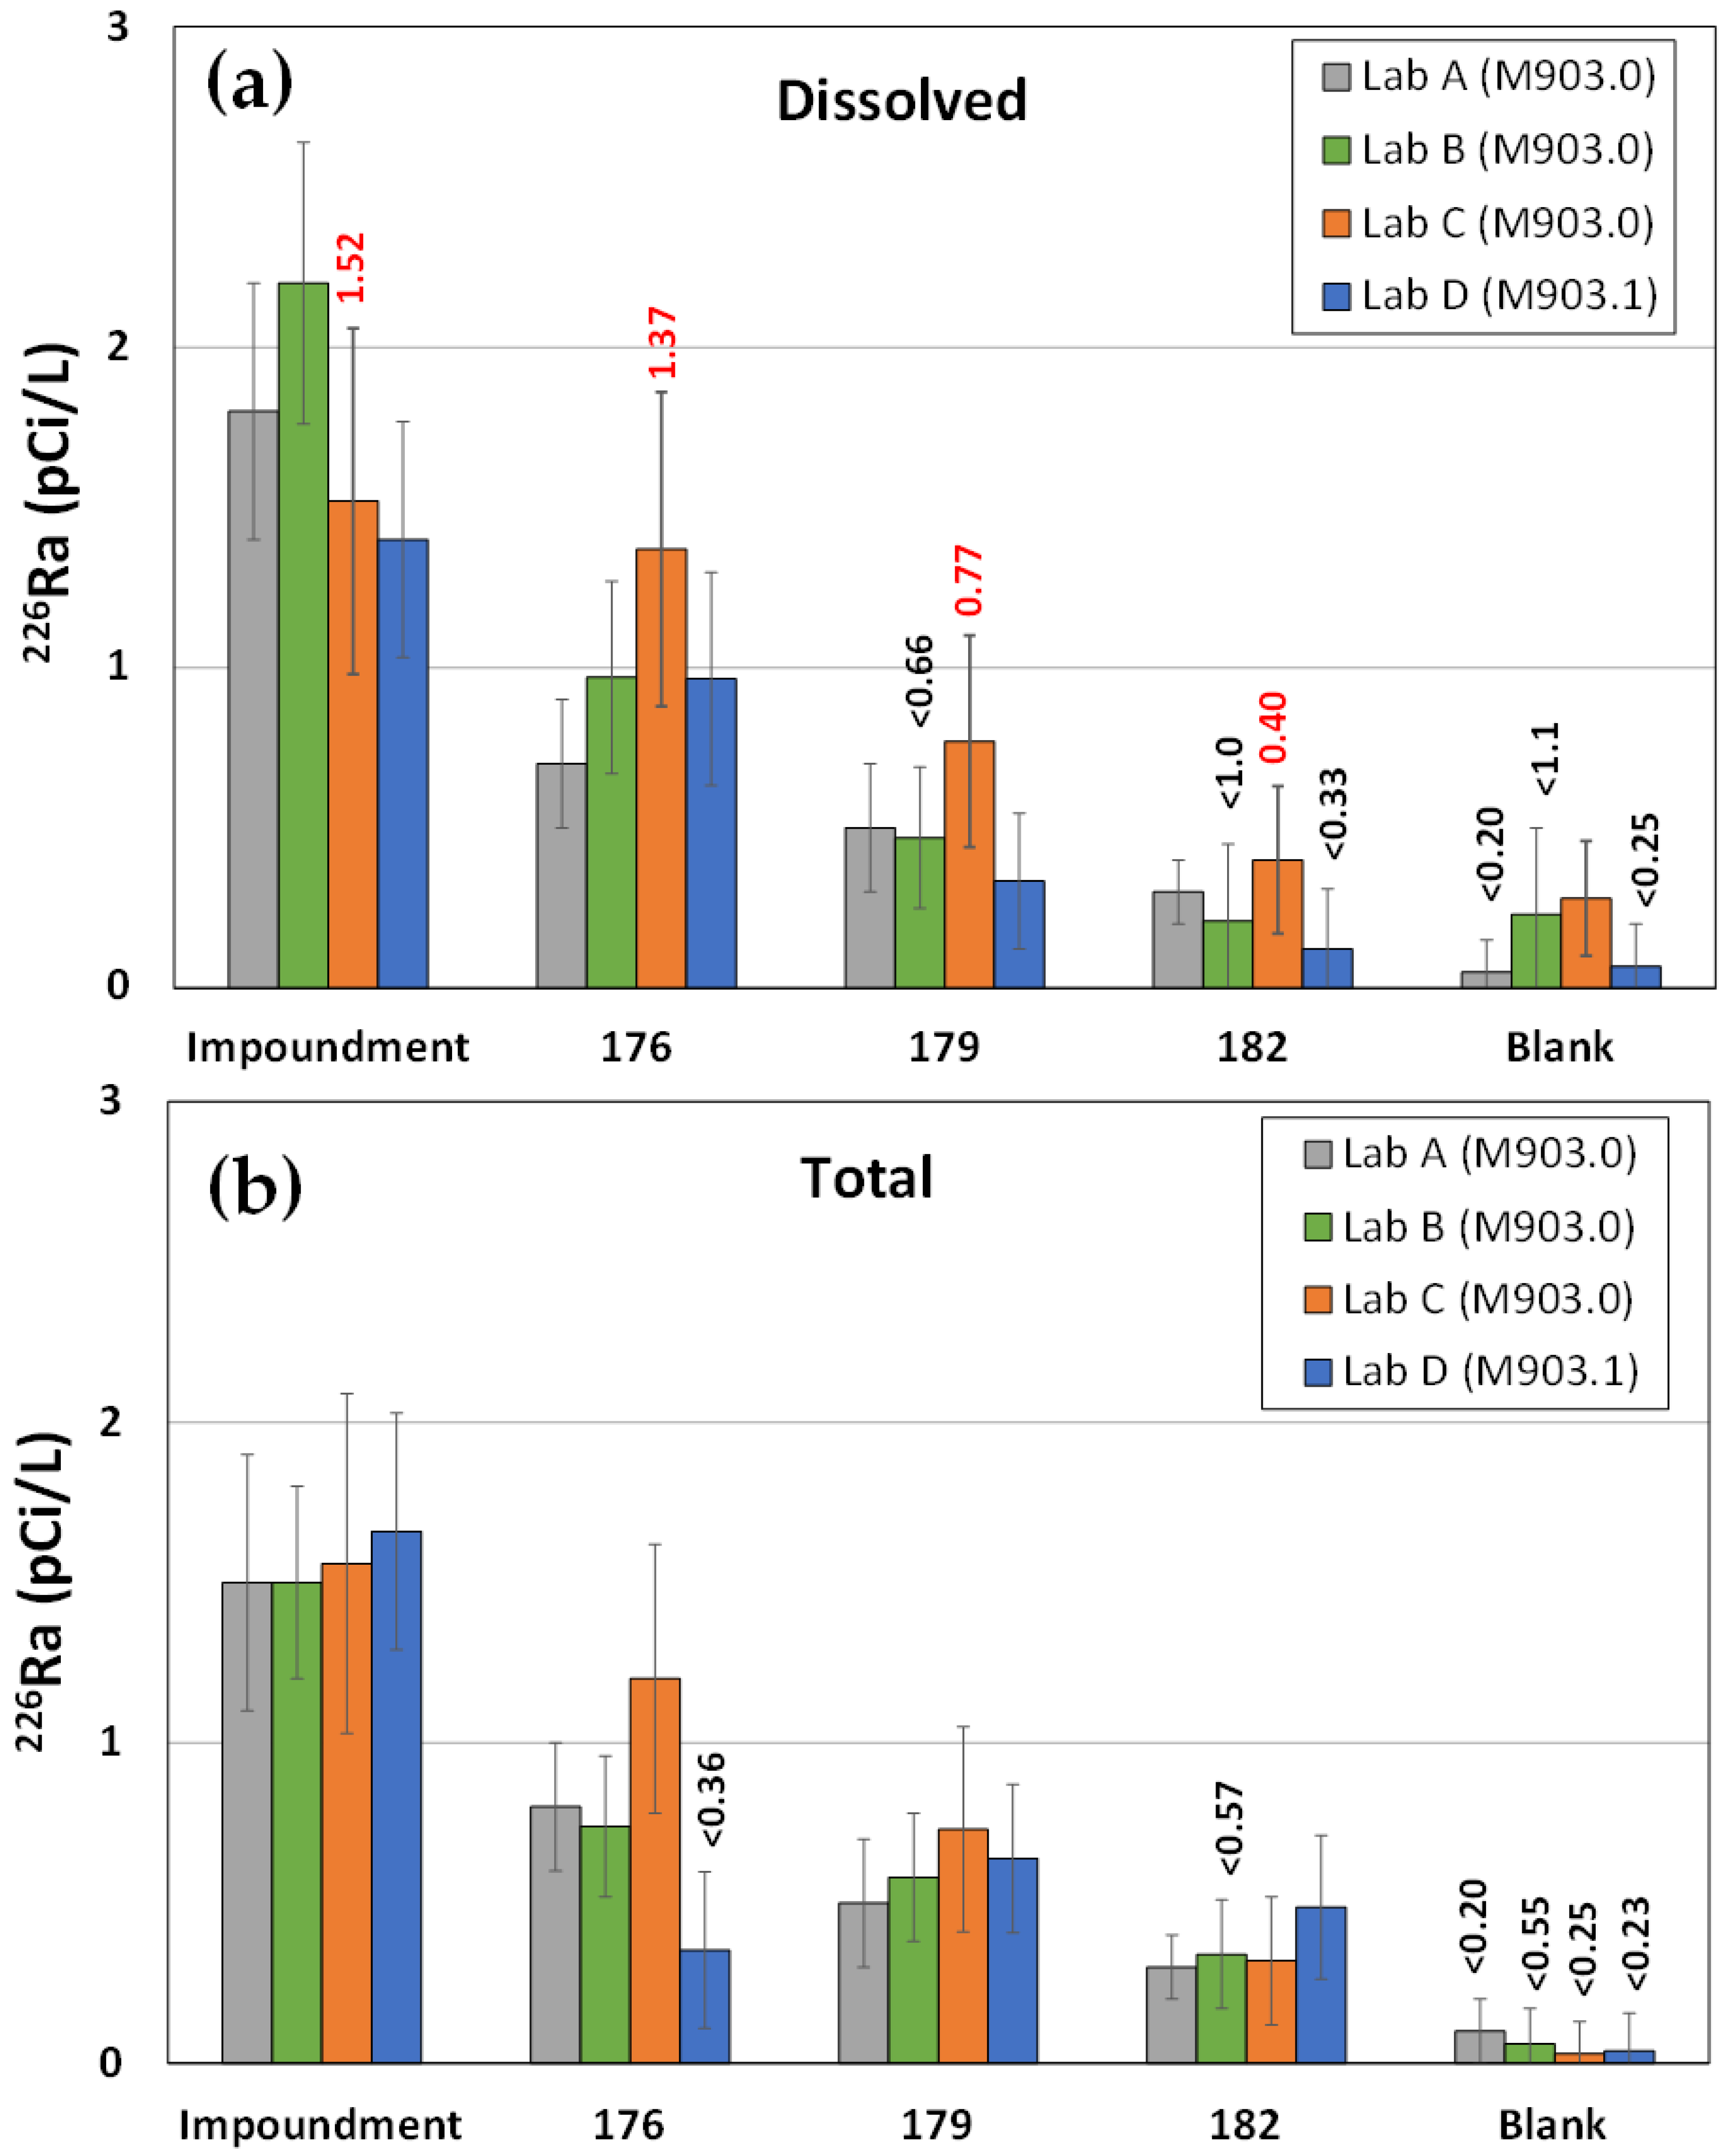
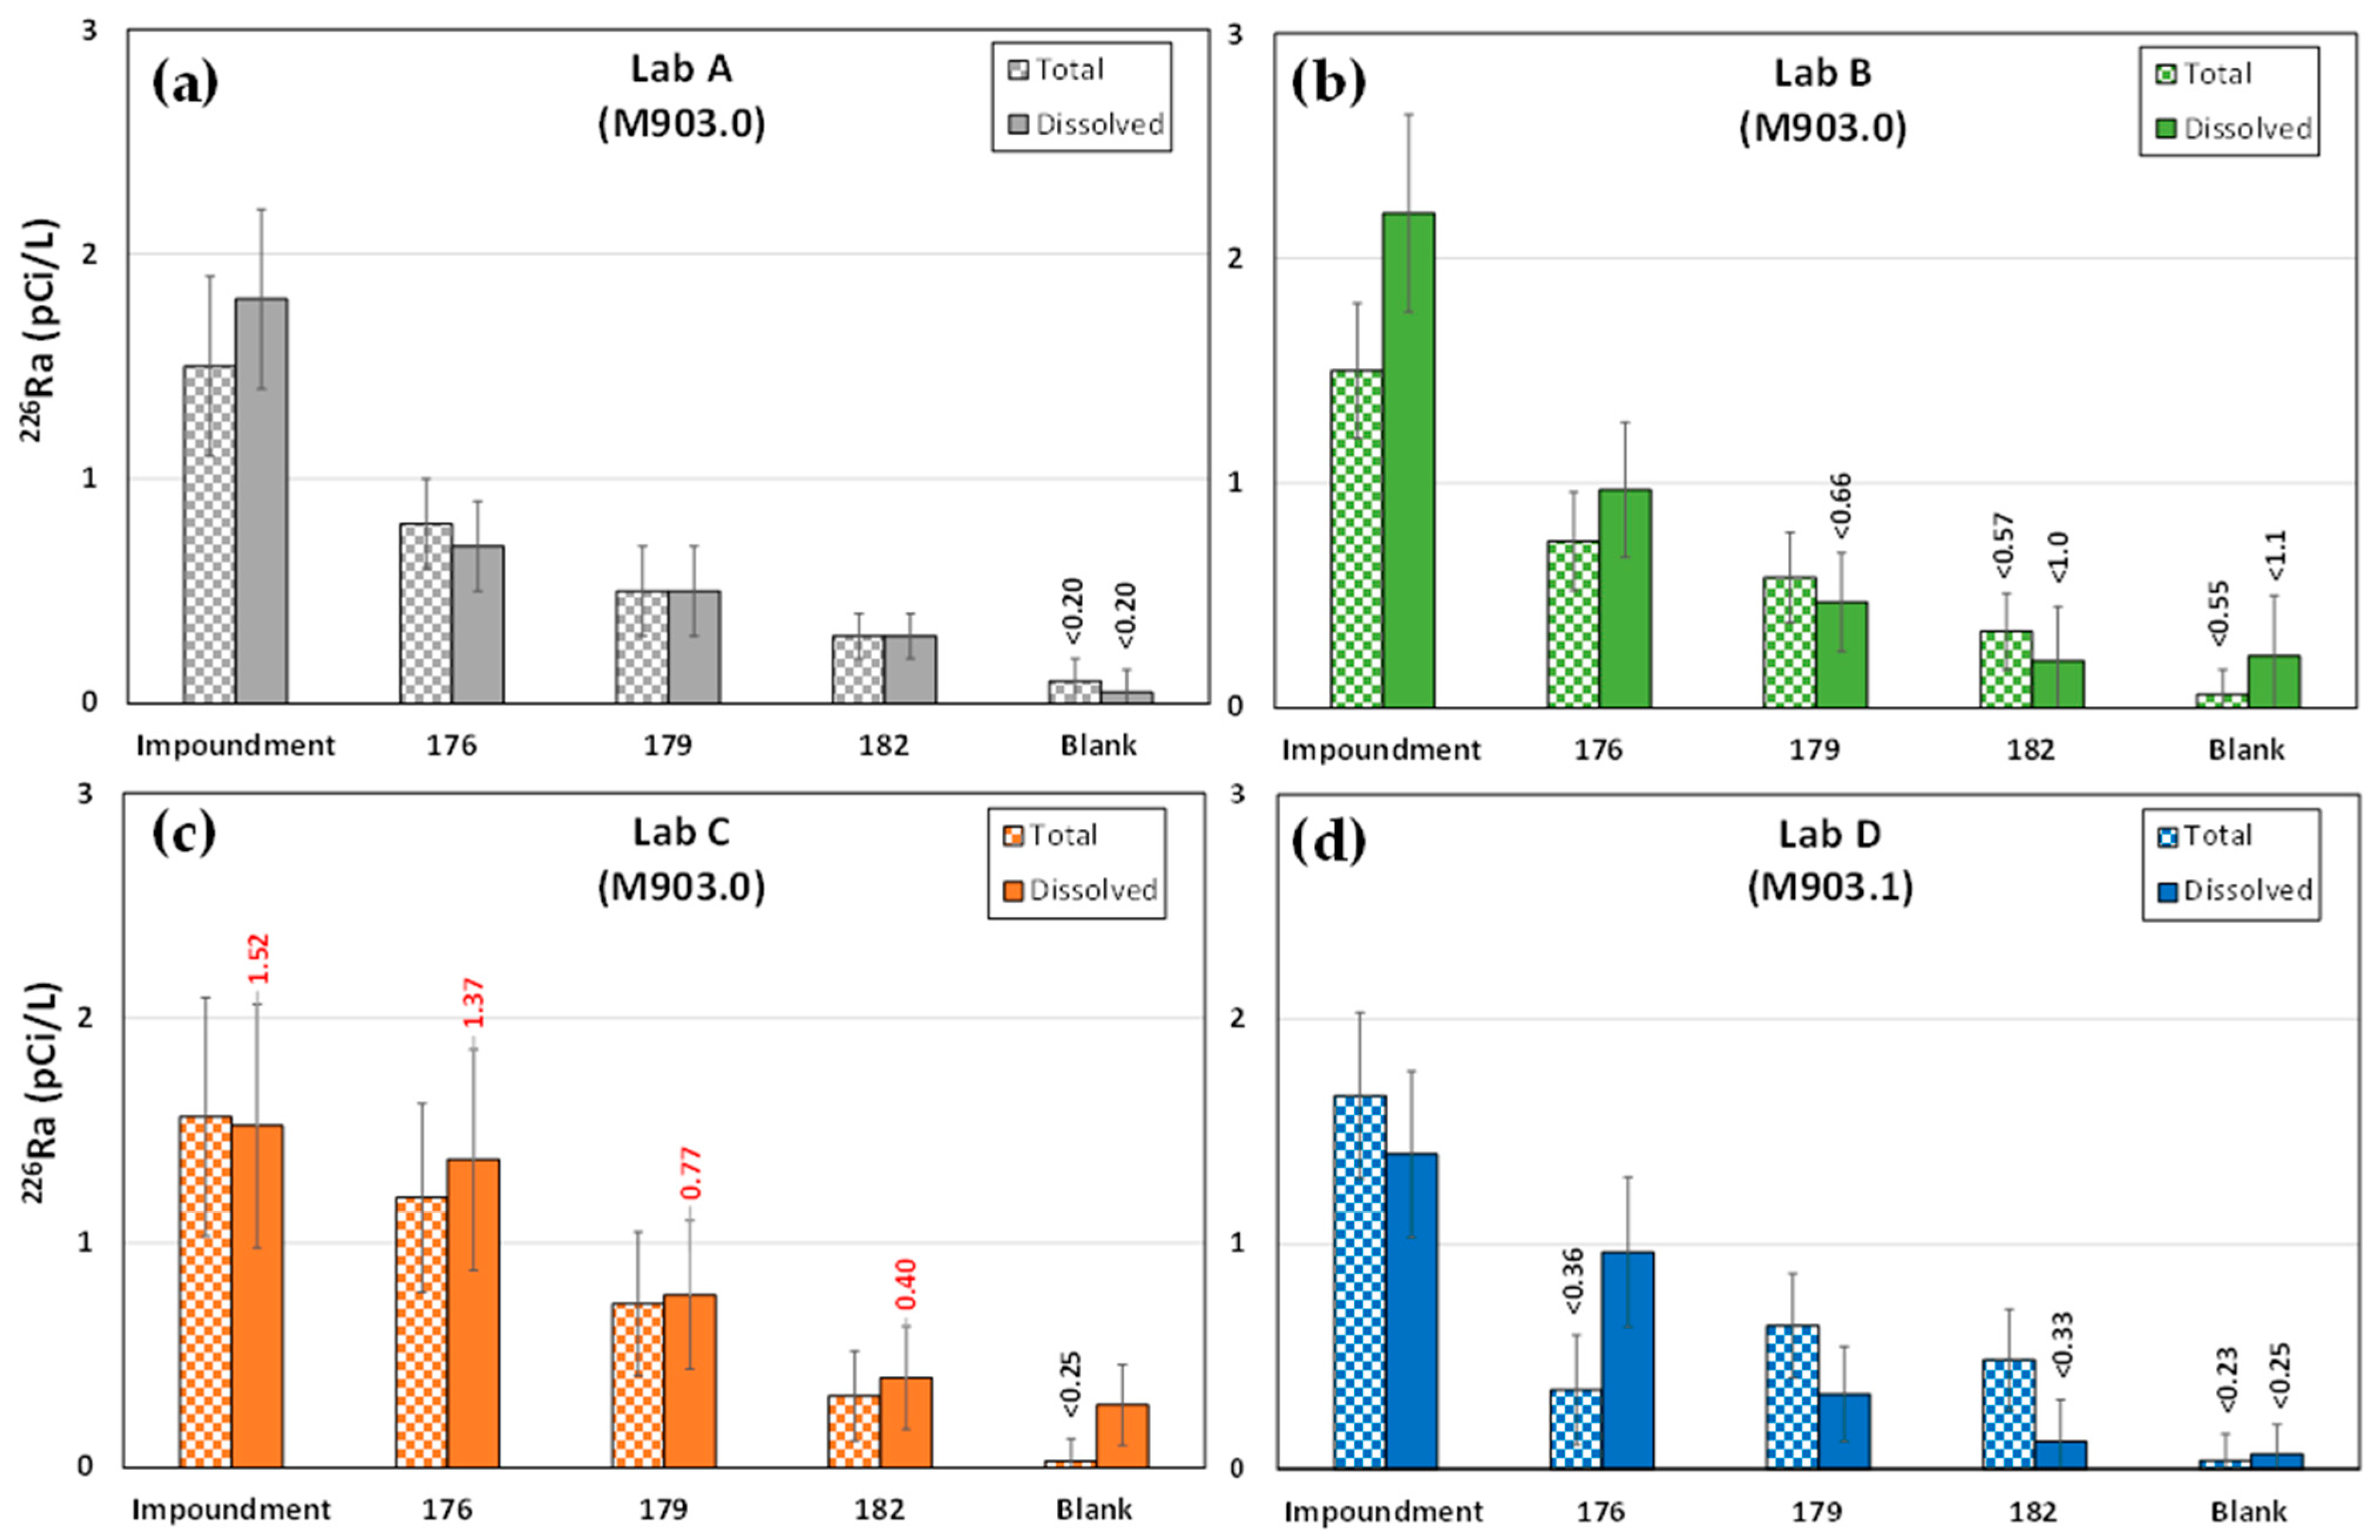
3.2. Summary of 226Ra Results
The dissolved and total
226Ra results for all samples are shown in
Figure 3. The error bars represent the precision in the analyses. Any reported value which was below the MDC is indicated with the MDC shown in black, and any J+ qualified value (estimated with high bias) is shown in red. None of the dissolved
226Ra results were significantly different based on their range in precision. The results from Lab C were J+ qualified and were the highest reported at each location, except for the Impoundment. The values reported by Lab D using M903.1, which is specific to
226Ra, tended to be lower for all samples, with the exception of Well 176 where the Lab A value was slightly lower (
Figure 3).
The trend in lower values using M903.1 was not observed for total
226Ra (
Figure 3), except in Well 176 where total
226Ra was below detection. However, the value of <0.36 pCi/L for total
226Ra in Well 176 should be equal to or greater than the dissolved value because the sample was not filtered; therefore, the value of <0.36 pCi/L is suspect. No
226Ra was detected in the unfiltered field blanks, and therefore none of total
226Ra values were qualified as estimated with high bias (
Table 3,
Figure 3).
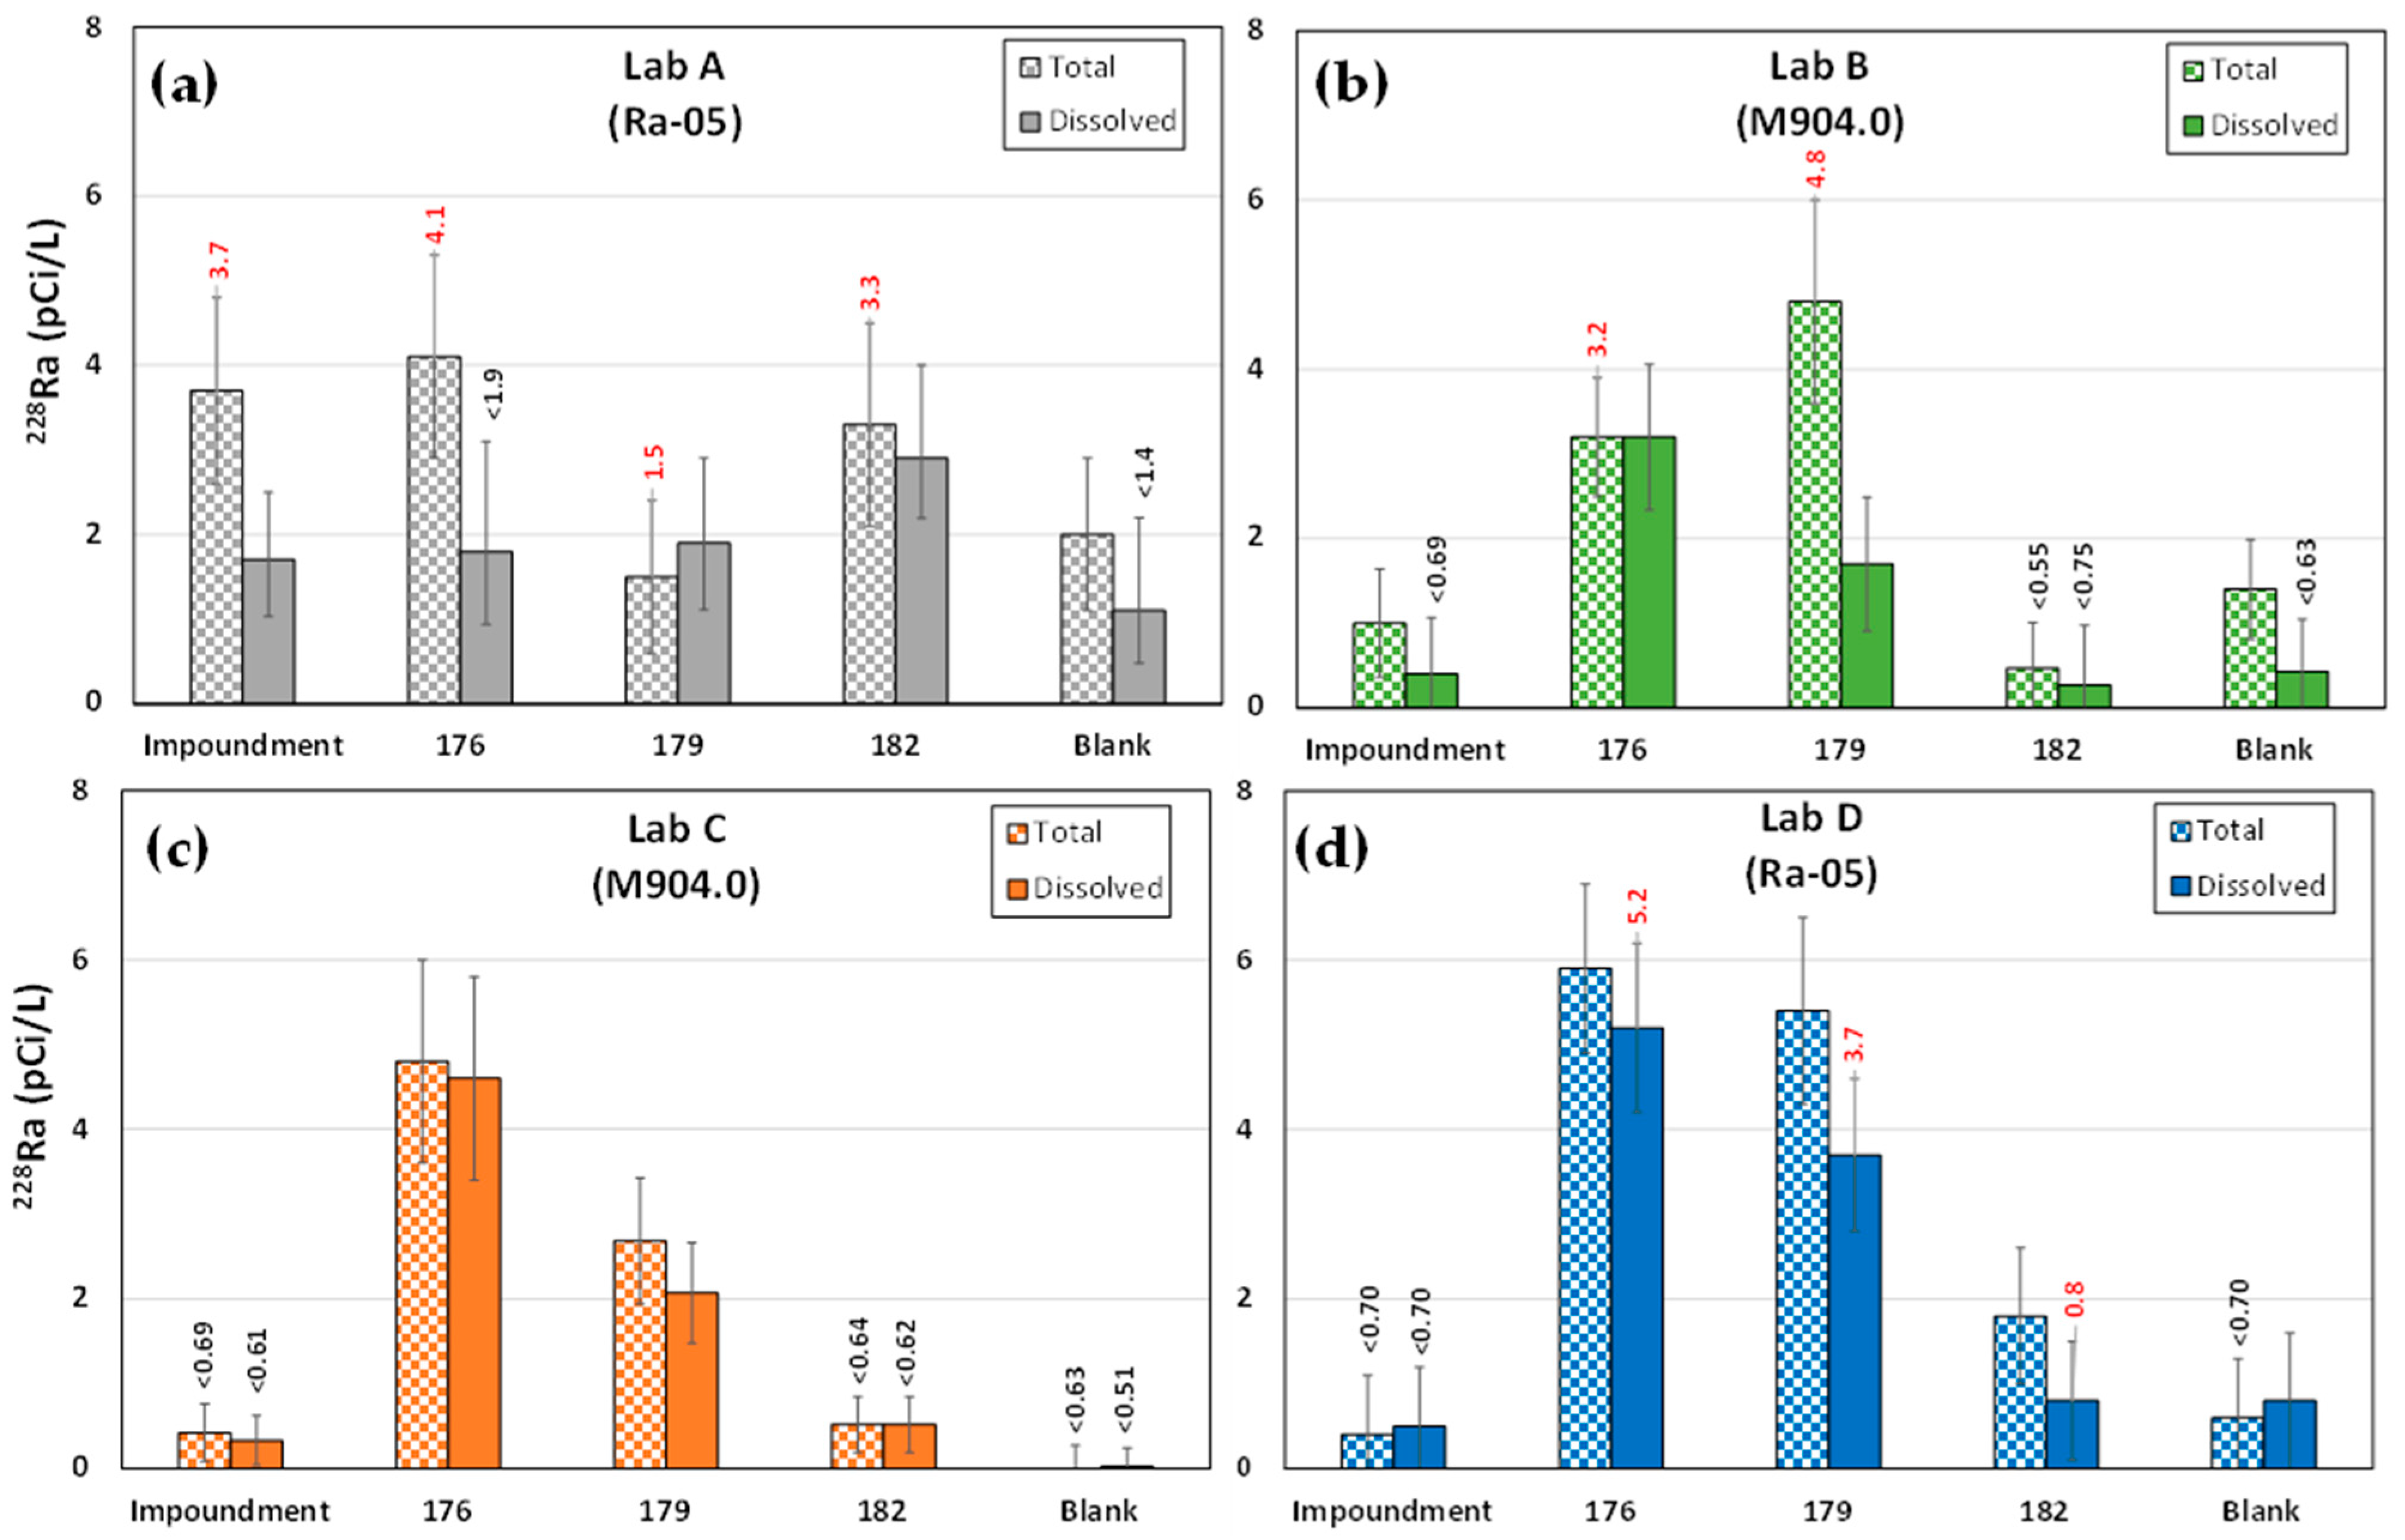
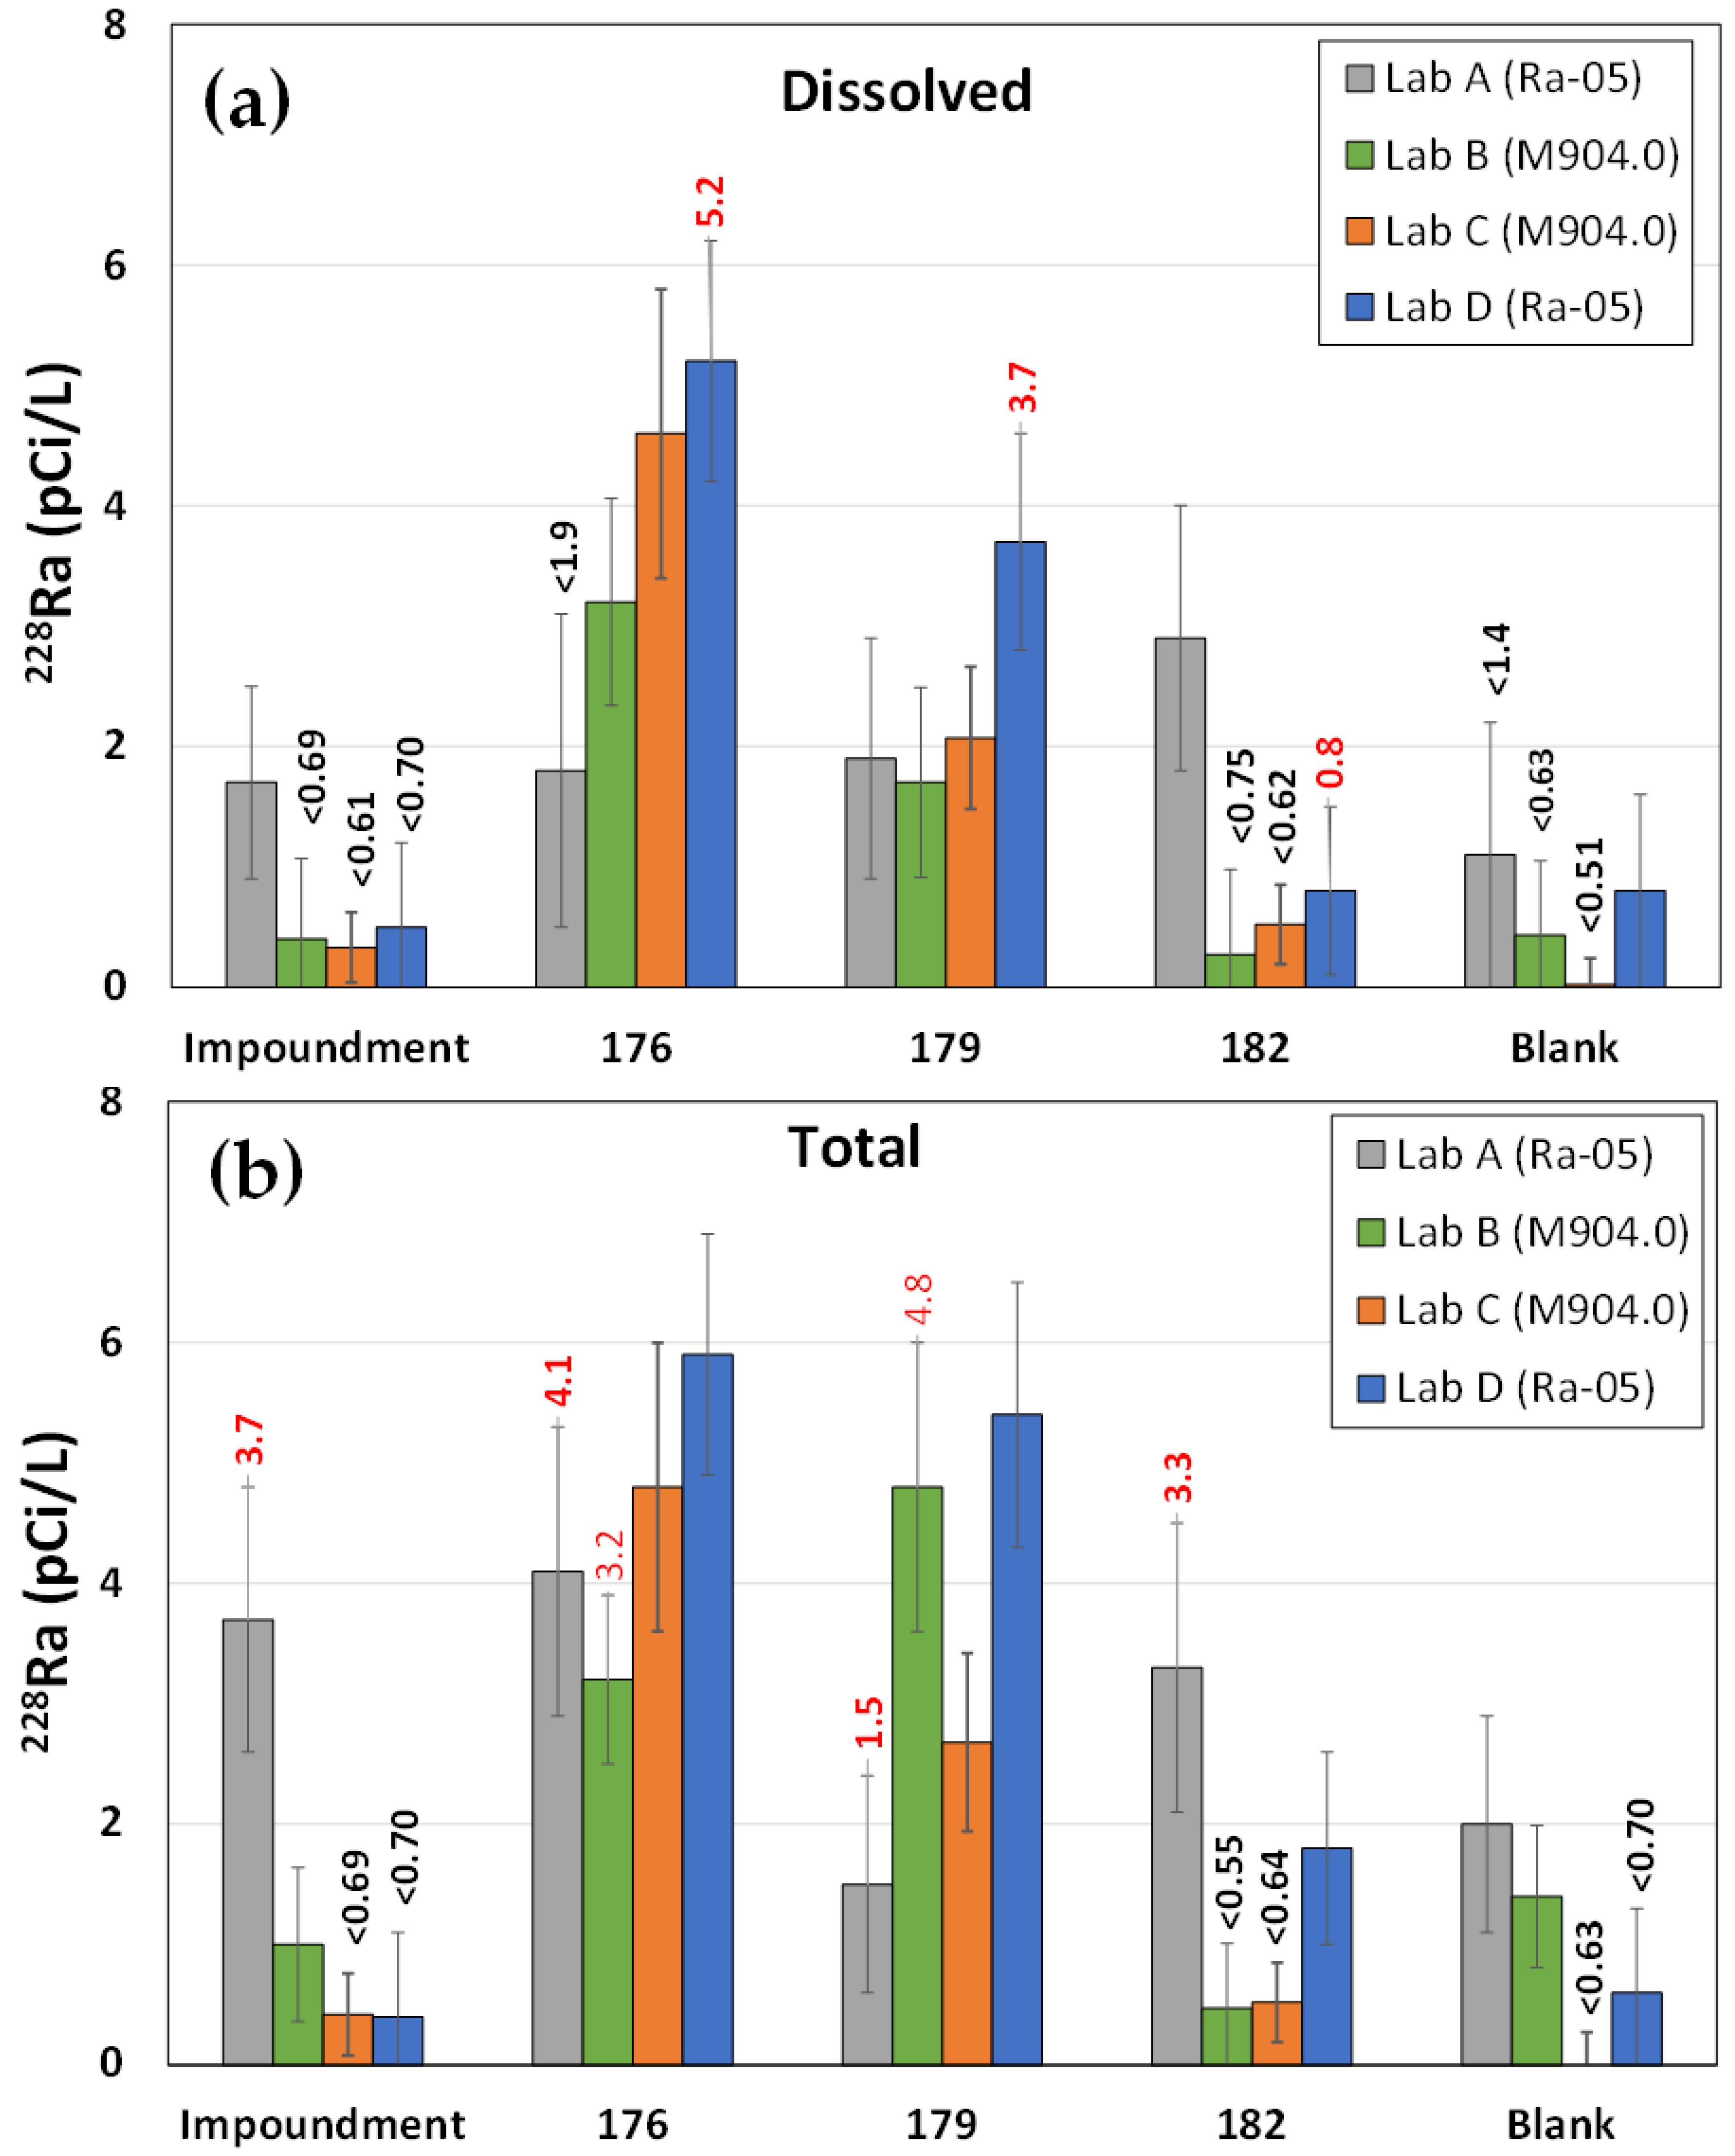
3.3. Summary of 228Ra Results
Overall, the
228Ra results (
Figure 4) tended to be more variable across locations and between laboratories compared to
226Ra (
Figure 3). A comparison of these results shows that
226Ra tends to be higher in the Impoundment, whereas
228Ra is higher in the groundwater, consistent with historical Site observations. However, no regular trends are apparent based on the method or laboratory used for dissolved
228Ra. For example, although Lab A and Lab D use Ra-05, the Lab D results were notably higher than Lab A in samples where
228Ra concentrations were overall higher (≥2 pCi/L). The Lab D results were qualified as estimated with high bias due to detection of
228Ra in the field blank. Although a higher concentration of
228Ra was reported by Lab A for the field blank, the detection limit (<1.4 pCi/L) was higher compared to other laboratories and methods (
Figure 4,
Table 2). In samples containing overall lower
228Ra concentrations (≤2 pCi/L), the results from Lab A were notably higher compared to Lab D. The results from Lab B and Lab C using M904.0 tended to be intermediate between those from Lab A and Lab D, where Ra-05 was used (
Figure 4).
Similar trends were observed for total
228Ra compared to dissolved
228Ra (
Figure 4). However, for total
228Ra, the results from Lab A, rather than Lab D, were qualified as estimated with high bias due to detection of
228Ra in the field blank (
Table 3,
Figure 4). Lab A reported 2 pCi/L of
228Ra in the field blank, and similar to
226Ra values, results from Lab A were notably higher in samples containing overall low
228Ra (Impoundment, Well 182).
3.4. Detailed Comparison of Total vs. Dissolved Ra
A comparison of total and dissolved
226Ra from each laboratory is shown in
Figure 5. The error bars represent the precision in the analyses, with non-detect values shown in black and all J+ qualified values shown in red. Theoretically, total concentrations should be equal to or greater than dissolved concentrations, with the extent of Ra partitioning to suspended particles depending on factors such as total suspended solids concentration and pH [
2]. Total and dissolved
226Ra were generally the same in all samples based on the range in precision of the analyses (
Figure 5). However, the difference between the actual reported values in total vs. dissolved at a given location were not consistent between laboratories. For example, the reported total
226Ra in the Impoundment was higher than dissolved for the Lab D data, lower than dissolved for Lab A and Lab B, and almost equal for Lab C. In the background Well 182, the reported total
226Ra was greater than dissolved for Lab D and Lab B, less than dissolved for Lab C, and approximately equal for Lab A.
For the
228Ra data shown in
Figure 6, total
228Ra was more consistently greater than or equal to the dissolved fraction when compared to
226Ra in
Figure 5. It is also apparent that both total and dissolved
228Ra values from Lab A are elevated in the samples containing low Ra (Impoundment, Well 182, and field blank) compared to the other lab results, including those from Lab D where the same method (Ra-05) was used. In addition, the values reported for total
228Ra in the field blank were higher compared to non-detectable dissolved
228Ra from Lab A and Lab B. Differences between total and dissolved
228Ra in the field blank suggests that processing of the sample for total analysis could have produced false positive results.
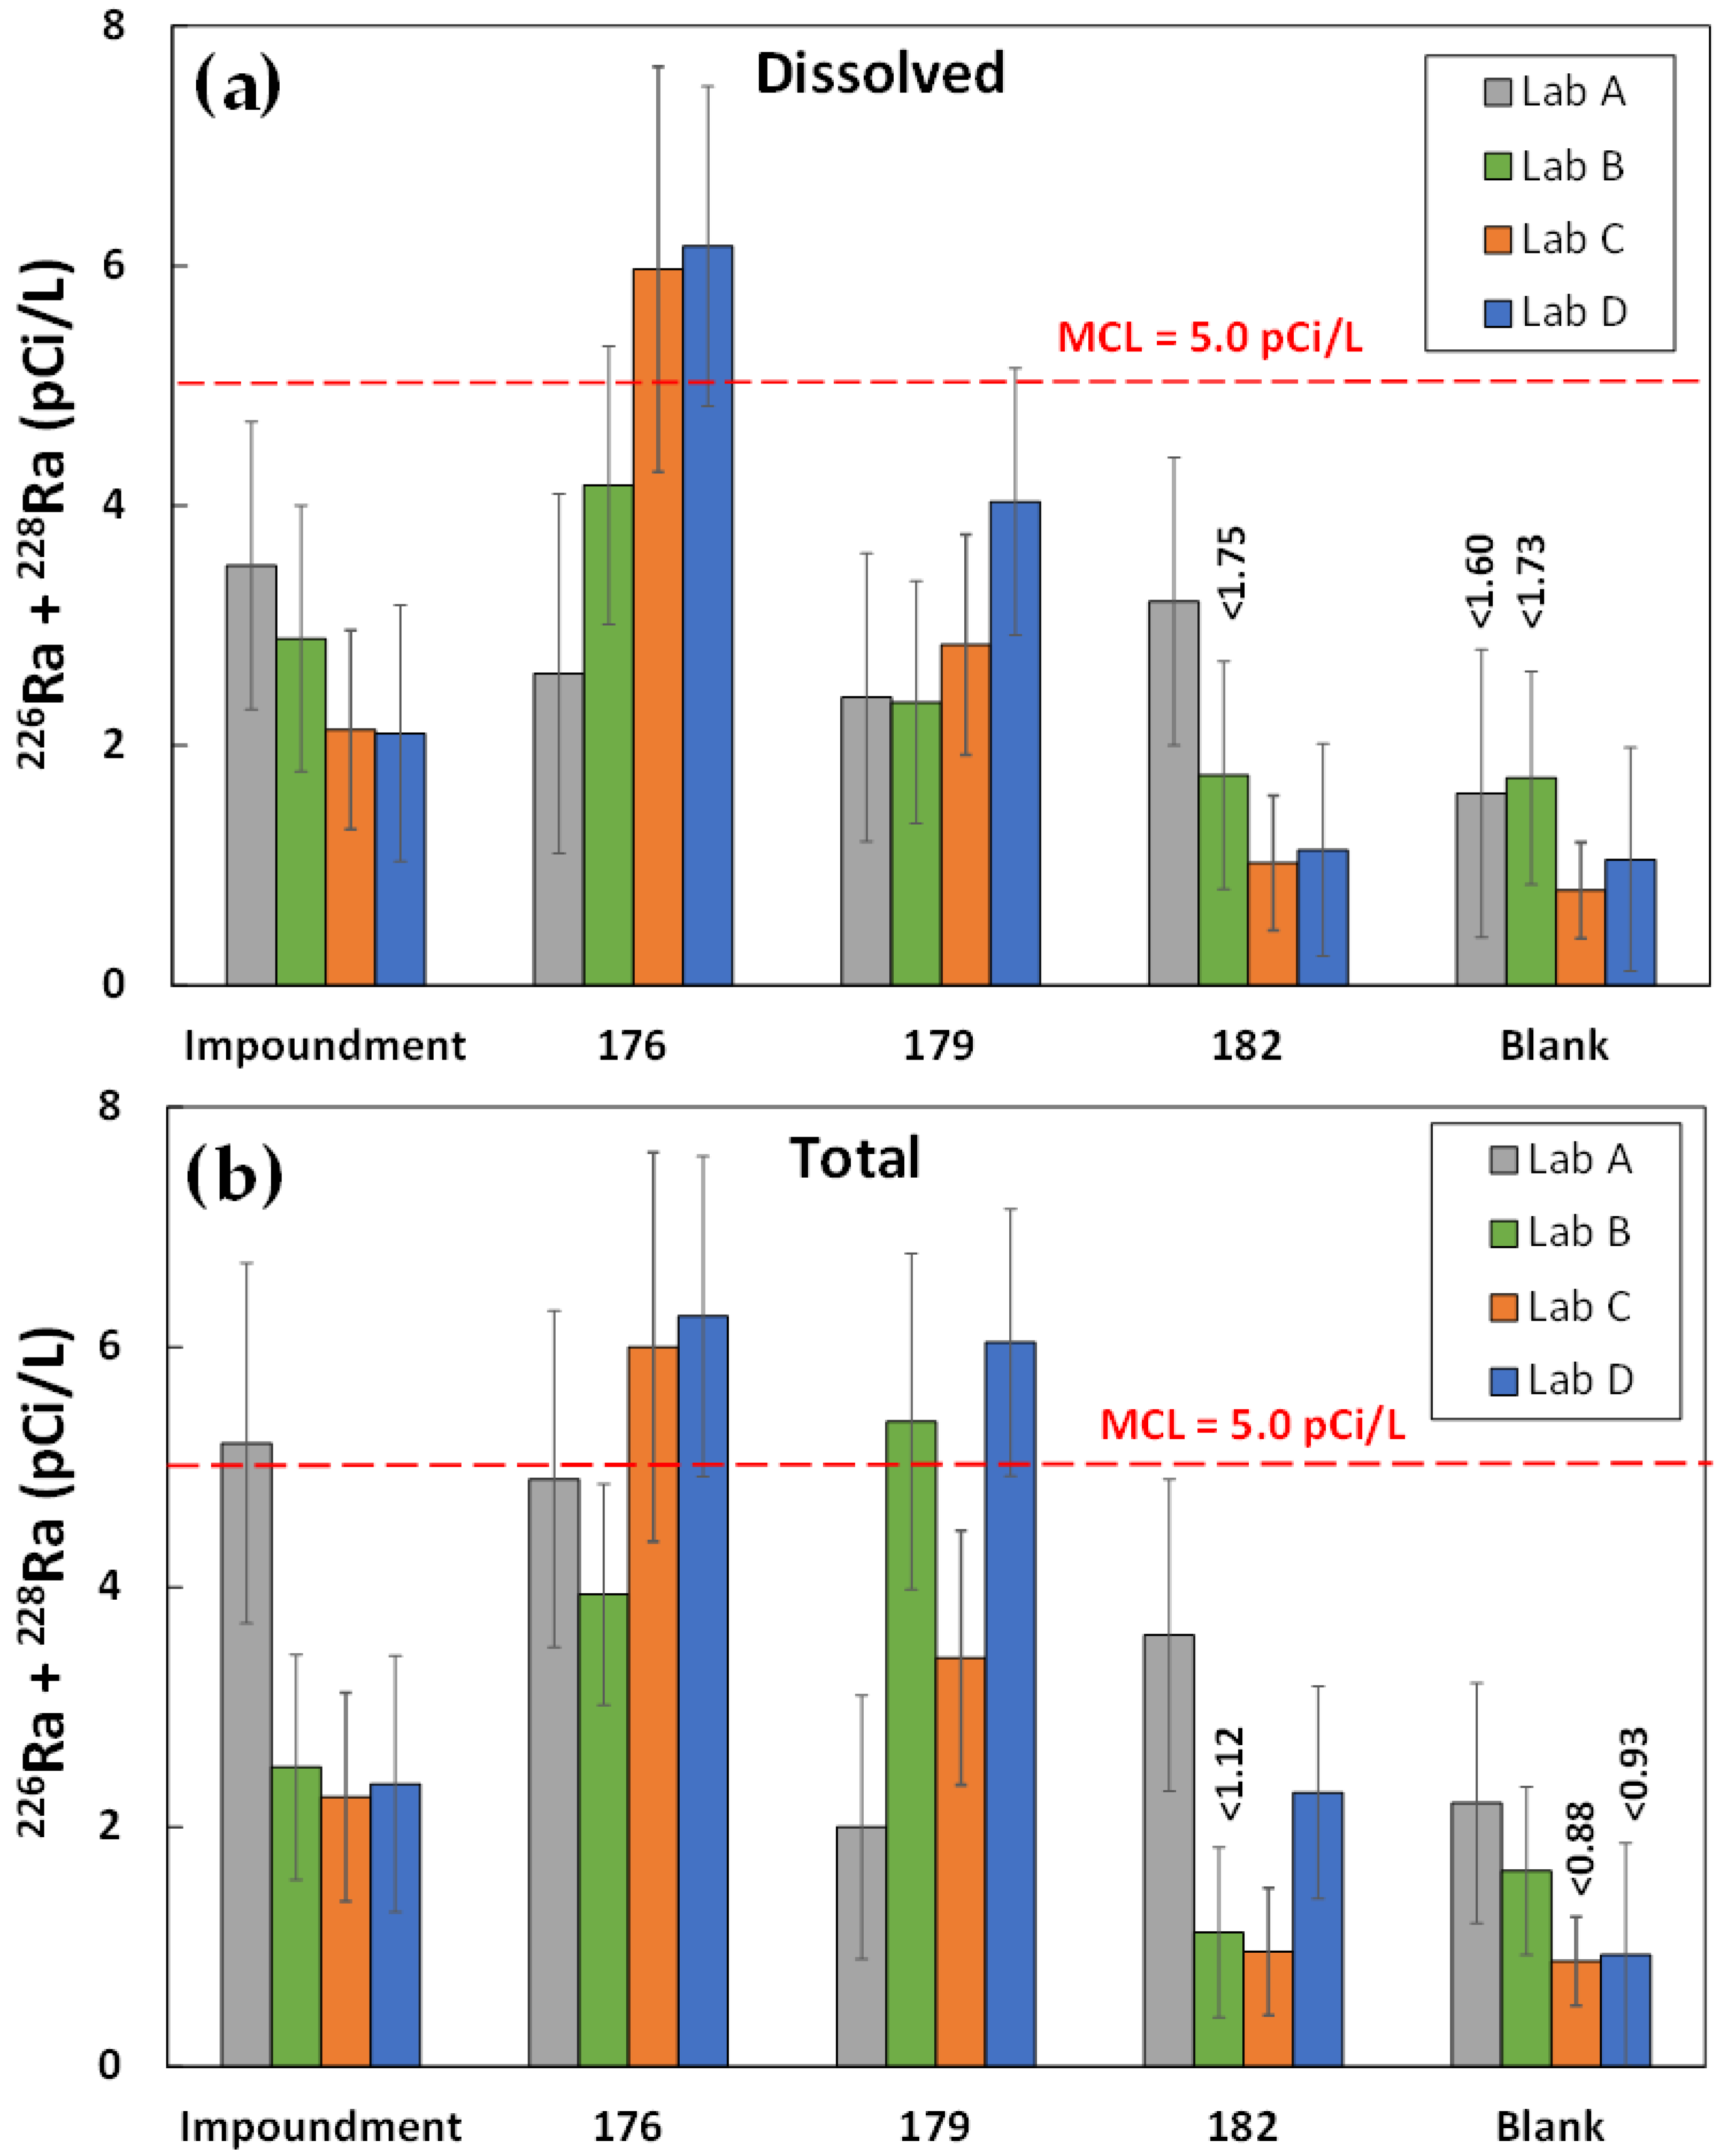
3.5. Combined 226Ra + 228Ra Results
The
226Ra +
228Ra values for the dissolved and total fractions are shown in comparison to the 5 pCi/L compliance value in
Figure 7. The dissolved
226Ra +
228Ra values reported by Lab C and Lab D exceeded the MCL at Well 176. Total
226Ra +
228Ra reported by Lab C and Lab D also exceeded the MCL at Well 176, in addition to total
226Ra +
228Ra reported by Lab A for the Impoundment and total
226Ra +
228Ra reported by Lab B and Lab D at Well 179. Overall, the trends are not entirely consistent between laboratories. For example, there was little difference between dissolved and total
226Ra +
228Ra for the Impoundment and Well 176 in the data reported by Lab B, Lab C, and Lab D, while the total
226Ra +
228Ra values reported by Lab A were higher than dissolved for the same two locations. Conversely, values were higher for total
226Ra +
228Ra compared to dissolved
226Ra +
228Ra at Well 179 for the data reported by Lab B add Lab D, while total vs. dissolved
226Ra +
228Ra concentrations reported by Lab A were similar. The dissolved
226Ra +
228Ra in the field blank was below detection as reported by Lab A and Lab B, while total
226Ra +
228Ra was detectable; the opposite trend was observed for the data reported by Lab C and Lab D (
Figure 7).
4. Summary and Discussion
This ILC of 226Ra and 228Ra was conducted to understand the potential reasons for high variability and increasing trends in 226Ra + 228Ra concentrations that have been observed in Site monitoring wells, including the compliance Well 176 and background Well 182. The results for 226Ra were fairly consistent between laboratories, and with the exception of dissolved 226Ra reported by Lab C, all 226Ra concentrations were below detection in the field blanks. The concentrations of 228Ra were more variable between laboratories and with a higher frequency of detection in the field blanks.
For both 226Ra and 228Ra, there were no consistent trends with respect to the total vs. dissolved concentrations across laboratories, which were essentially equal in most samples when the range in measured precision was considered. The largest differences between reported values for total vs. dissolved Ra were observed in the Lab A data for 228Ra, where the total 228Ra data were qualified as estimated with high bias. For both dissolved and total 226Ra + 228Ra, the results from Lab C and Lab D for the compliance Well 176 exceeded the MCL, whereas the results from Lab A and Lab B were below the MCL. Therefore, compliance with the MCL was either achieved or not achieved, depending on which laboratory conducted the analyses.
Results for 226Ra obtained using M903.1 (specific to 226Ra) were usually equal to or slightly lower than those generated using M903.0; however, the differences are insignificant and may be due to analytical variability rather than method specificity. Results for 228Ra reported by Lab D when using Method Ra-05 were more consistent with those from Lab B and Lab C when using M904.0. The 228Ra results reported by Lab A when using Method Ra-05 tended to be higher in samples where the remaining laboratories reported low 228Ra concentrations (<2 pCi/L), and tended to be lower in samples where the remaining laboratories reported higher 228Ra concentrations (>2 pCi/L). Lab A also reported the highest measured 228Ra concentration of all field blanks (2 pCi/L), and consequently those data for total 228Ra were qualified as estimated with high bias.
A prior study relating to radionuclide variability in water samples [
6] showed that radionuclide activity in groundwater can vary up to four-fold due to seasonal effects, but also noted that the variability could reflect issues related to method and laboratory variability. The greatest source of error for
226Ra is counting uncertainty, but the overall accuracy and precision for
226Ra results was acceptable among various laboratories. For
228Ra, however, the methods are generally not as robust as those used for
226Ra. No single laboratory was able to provide consistently accurate
228Ra results, and due to the much greater relative standard deviation (RSD) values, it was concluded that the accuracy of
228Ra results is dependent on laboratory technique and skill and “may also reflect less rugged analytical methods” [
5].
5. Conclusions and Recommendations
The results obtained from this ILC of Site groundwater and surface water samples are generally consistent with the findings from the prior 2011 study [
6] with respect to observed variability in
226Ra compared to
228Ra. The current ILC indicate that
228Ra data reported by the existing contract laboratory (Lab A) are biased high relative to those reported by Lab B, Lab C, Lab D, and this may be due to differences in laboratory skill and technique among the various laboratory technicians [
6]. However, the resulting upward trends in
228Ra/
226Ra ratios (observed in both impacted wells and the background location) after the
228Ra method was changed from 904.0 to Ra-05 are more difficult to explain.
Although the trends were not entirely consistent, the results from this study show a tendency for total Ra to be higher than dissolved Ra, especially for 228Ra. For samples where the majority of the laboratories reported low 228Ra concentrations (<2 pCi/L), it appears that the method and techniques used by Lab A for total 228Ra is contributing to higher apparent 228Ra concentrations. Therefore, it was recommended that 226Ra and 228Ra analyses (in additional to uranium and other radionuclides) be conducted on a filtered sample for Site compliance evaluations. Analysis for dissolved concentrations would also then be consistent with remaining metals analyses which are also analyzed as dissolved.
For
226Ra, it was recommended that M903.0 be replaced with M903.1 which is specific to
226Ra. Method 903.0 includes all alpha emitters and therefore can result in over-reporting of
226Ra concentrations. The primary additional alpha emitter which could contribute to overestimation of
226Ra is
224Ra, which originates from
232Th. Although
232Th concentrations were very low to non-detect in the Site samples, the presence of
232Th in the solid phase of aquifer materials could release
224Ra into solution. Even though this study did not indicate that M903.0 results in consistent over-reporting of
226Ra concentrations, use of M903.1 would better ensure that the appropriate analysis for
226Ra is being conducted. Alternatively, it could be requested that the laboratory employ a 14-day waiting time which will effectively reduce the contribution of
224Ra to the reported
226Ra [
6].
For
228Ra, this study indicates that specific laboratory techniques, rather than the method (Ra-05) used by Lab A are potentially contributing to excessively elevated values being reported for
228Ra at the Site. It should be noted that even though standard methods [
5] are being used, many laboratories have developed their own customized Standard Operating Procedures (SOPs) which are often proprietary and difficult to obtain. However, it is recommended that any location whose reported
226Ra +
228Ra concentrations exceed groundwater or surface water standards in the future be immediately re-sampled and re-analyzed by the existing laboratory, with a sample split also being collected and sent to an outside laboratory for additional confirmatory analysis.


