Abstract
Strip steel is an important raw material for the related industries, such as aerospace, shipbuilding, and pipelines, and any quality defects in the strip steel would lead to huge economic losses. However, it is still a challenge task to effectively detect the defects from the background of the strip steel due to its complex variations, including variable flaws, chaotic background, and noise invasion. This paper proposes a novel strip steel defect detection method based on a U-shaped residual network, including an encoder and a decoder. The encoder is a fully convolutional neural network in which attention mechanisms are embedded to adequately extract multi-scale defect features and ro ignore irrelevant background regions. The decoder is a U-shaped residual network to capture more contextual data from different scales, without significantly increasing the computational cost due to the pooling operations used in the U-shaped network. Furthermore, a residual refinement module is designed immediately after the decoder to further optimize the coarse defect map. Experimental results show that the proposed method can effectively segment surface defect objects from irrelevant background noise and is superior to other advanced methods with clear boundaries.
1. Introduction
Strip steel has been widely used in aerospace, shipbuilding, automotive, and other fields, and minor quality defects may adversely affect the performance and service life of strip steel, resulting in huge economic losses [1]. Therefore, it is a crucial task to detect the defects in the strip steel to guarantee the quality of industrial production. However, this task is often handled manually, which is laborious and time-consuming. Thus, many automatic surface defection methods based on computer vision technologies are used to detect defect objects in the strip steel. Inspired by the human visual system, saliency detection [2] has been used to detect defective objects by filtering out plenty of redundant background interferences. Additionally, saliency detection has been widely to enable image understanding [3], person reidentification [4,5], defect detection [6], semantic segmentation [7], and so on.
In industrial surface defect detection, the saliency object detection method is mainly composed of methods based on traditional models or based on deep learning. The former uses manually designed feature extraction factors to extract visual features, such as Gabor filters [8] and wavelet transform [9], and then a classification is applied to the extracted features to identify the corresponding defect objects [10]. However, the model is very sensitive to changes in real-world situations and susceptible to light and cluttered backgrounds. Recently, deep learning has been introduced into surface defect detection due to its excellent ability to automatically learn deep features of images, which greatly solves the problems existing in the ones based on traditional methods. Soukup and Huber [11] applied the convolutional neural networks to steel surface defect detection and improved the network recognition performance using the normalized method.
Benefiting from strong representation ability, saliency detection methods based on deep learning, especially those based on convolutional neural networks, have achieved remarkable results [12]. However, the problems still exist in terms of target integrity and boundary conservation. From Figure 1a, the traditional methods cannot detect defective targets with slender features due to artificial features failing to effectively capture the global and high-level semantic information of the defective object. In addition, the existing deep learning methods based on saliency defect detection still have deficiencies in capturing the complete boundary of defective objects (as shown in Figure 1b). Last but not least, it is difficult for saliency defect detection methods to segment small defect objects from the compact background images (see Figure 1c). In addition, from Figure 1, we can find that inclusions account for a relatively small proportion of the defective image of strip steel; patches often have dark and uneven illumination features; scratches have a big difference in size and shape. Therefore, accurately detecting surface defects of strip steel is a challenging task. Under this condition, early models fail to obtain enough features and, thus, they often detect incomplete defect regions and mistakenly confuse the background region with the defect region.
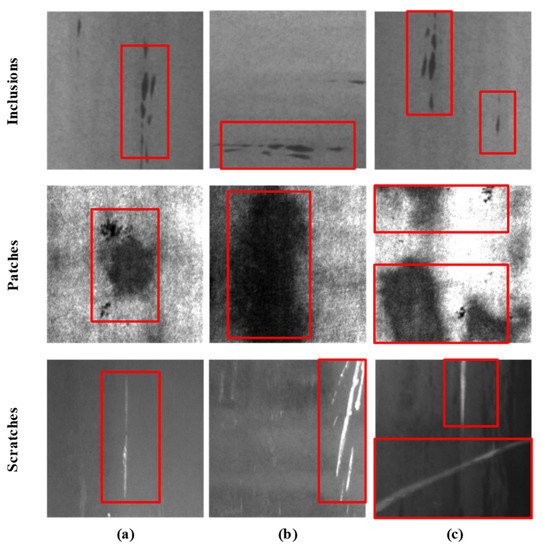
Figure 1.
Three common strip surface defects, as follows: (a–c) represent ordinary, close to the defects of the edge, and the chaotic background defective image, respectively. The red box indicates the defective region.
In order to solve the problem above, we propose a nested U-shaped residual codec network (NURCNet) for strip steel defect detection, which consists of three submodules. The first submodule is the encoder network, which consisting of the attention mechanism and the fully convolutional residual network; the fully convolutional network is used to extract rich multiscale features and the lightweight attention mechanism is to make the extracted features pay more attention to defective objects. Between the encoder and the decoder, dilated convolutions with different dilation rates were used in a bridge to enlarge the receptive field and capturing multiscale context information. The decoder is the U-shaped residual network proposed by Qin et al. [13], since the network is able to capture more contextual information from different scales without significantly increasing the computational cost. The encoder–decoder forms a nested U-shaped residual codec network. In addition, the introduction of a residual refinement network allows the model to capture defective objects with clear boundaries.
Overall, the advantages of the proposed NURCNet can be summarized as follows:
- (1)
- We designed a fully convolutional residual network with a lightweight attention mechanism as the encoder to fully extract multiscale defect features which pay more attention to defective objects;
- (2)
- We introduced a U-shaped residual network proposed by Qin et al. [13] as the decoder to capture more contextual information from different scales without significantly increasing the computational cost; the encoder and decoder form a nested U-shaped residual codec network;
- (3)
- We proposed a residual refinement network, which is used to further optimize the coarse saliency map of the lack of boundary information output at the encoder–decoder stage;
- (4)
- The thorough evaluation of the proposed NURCNet on a challenging strip steel dataset [14] indicates that our model achieves state-of-the-art results in both regional positioning and boundary recovery.
2. Related Work
The traditional methods are as follows. Traditional methods detect defective objects by making use of handmade features (each pixel is classified as a defect or non-defect) to evaluate the saliency value [15,16]. For example, a novel probabilistic salience framework was proposed by [17] to utilize two specific saliency features to represent the initial significance of each pixel, and this changed the intensity of each pixel according to significance during the iterative process. Huang et al. [18] took a saliency detection problem as the task of multi-instance learning (MIL), where the super-pixels evaluated by the proposed proposals are instances of MIL. Their work improved the accuracy of extracting significant targets at the expense of computational cost. A novel model with two structural regularization methods was constructed by Peng et al. [19], which suppose that images can be compressed into two matrices: the low-level matrix and the low-level matrix, where the former matrix represents the visual consistent background and the latter represents the different foreground object regions. The disadvantage of traditional salient object detection is that artificial features are easy to miss details due to the influence of noise and clutter. Therefore, if the image is unevenly illuminated or the contrast between the defective and non-defective areas is low, these hand-crafted features will limit their application due to the difficulty of obtaining satisfactory results.
Patch-wise deep methods are discussed as follows. Inspired by the superior performance of the image classification of deep convolutional neural networks, patch-wise deep salient object detection methods classify patches as salient or non-salient objects from local image pixels which are extracted from a single or multiple scales [20]. Many patch-wise deep methods which have been proposed, such as by Zhao et al. [21], tackle low-level saliency cues or priors and do not produce good enough saliency detection results by proposing a multi-context deep learning framework, which employ deep convolutional neural networks to model saliency of objects in images. For learning high-quality visual saliency objects, Li et al. [22] proposed a patch-wise deep salient object detection method which has fully connected layers on top of CNNs responsible for feature extraction at three different scales. Spatial information is missing due to the introduction of the fully connected layer and, thus, these methods usually output coarse saliency maps.
The FCN-based methods are discussed as follows. Due to the powerful representation ability of the fully convolutional neural network, the salient object detection methods based on the fully convolutional neural network has been significantly improved compared to the depth method of the patch. The methods based on fully convolutional neural networks can extract multi-level features. The low-level features from the shallow layer are used by fully convolutional neural network to reconstruct the spatial details, and the high-level features codes from the deep layer are used to obtain the semantic information of the abstract description of the object. In [23], two sub-models based on pooling operations were used to gradually optimize the extracted features and generate the well-structured saliency maps. Zhao et al. [24] proposed a novel model focusing on both context features and spatial features, and this model obtains saliency images with rich boundary details by fusing the channel attention and the spatial feature mapping spatial attention of context feature mapping. Wu et al. [25] proposed a novel cascading framework in which the decoder discards shallow, unimportant features to accelerate the model and directly refine the saliency map obtained by deep feature fusion. The framework enables fast and accurate object detection. A detailed and comprehensive survey of deep saliency detection can be seen in the literature [12].
Coarse-to-fine deep methods are as follows. Recently, lots of refinement subnetworks have been proposed to capture richer border information or to obtain a better structure. Liu et al. [26] proposed a deep hierarchical saliency network that can gradually improve the details of the saliency map by learning various global structural saliency cues. To obtain global context information, a pyramid pooling module and a multistage refinement mechanism were proposed to optimize saliency mapping [27]. Later, ref. [28] proposed to locate salient objects in the global scope, and then improve them through local boundary refinement modules. Although these methods have greatly improved the detection efficiency, there is still large room for improvement in terms of the fine structure segment quality and boundary recovery accuracy.
3. Methodology
In this section, we proposed a nested U-shaped residual codec network (NURCNet) for strip steel defect detection, which is composed of the following three submodules: the encoder network, decoder network, and refinement network. Figure 2 shows the framework of NURCNent, where the encoder is a fully convolutional residual network, to extract both the rich low-level spatial details and high-level contextual information, and an attention block followed each residual block makes the extract multiscale defect features, paying more attention to defective objects. Similar to [13], a U-shaped residual network is designed by composing a convolutional network with U-shaped residual blocks (URBs). Unlike Qin et al. [13] of which both the encoder and the decoder use U-shaped networks to extract salient object features, we only use the U-structure in the decoding stage to reduce the model complexity. Furthermore, a U-shaped residual block is designed to extract defect object features and reduce the computational cost. Finally, a refinement network followed the decoder network to further optimize the coarse saliency map of the lack of boundary information output at the encoder–decoder stage.
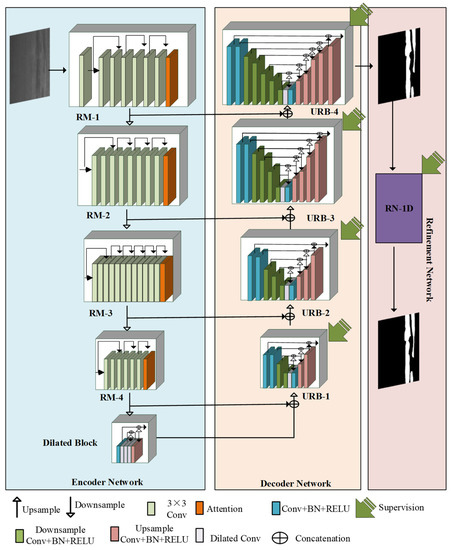
Figure 2.
Architecture of our proposed nested U-shaped residual codec network, named NURCNet.
3.1. Encoder Network
The encoder network is to draw both the rich low-level spatial details and high-level contextual information and, therefore, ResNet-34 [29], a fully convolutional residual network, is selected as the backbone network of the encoder to extract defect features, while skip-layer connections in the network are used to avoid the disappearance of the gradient. Specifically, the backbone network consists of a convolutional layer and four basic residual blocks (e.g., “conv2_x”, “conv3_x”) of ResNet-34. As shown in Figure 2, the input convolution layer and the four residual blocks are all from ResNet-34. Moreover, unlike ResNet-34, the input layer has 64 channels with a kernel size of 3 × 3 and a stride of 1 rather than a kernel size of 7 × 7 and a stride of 2, and a maximum pooling operation with a stride of 2 is added at the end of the first convolutional layer of the backbone network to increase the range of the receptive fields.
In recent years, the attention mechanism has been widely used in object detection tasks because it can make the network pay more attention to the task-relevant area. Therefore, a lightweight convolutional attention module is embedded into the residual blocks of the backbone network, which is defined as RM-a (a1, 2, 3, 4). The RM-a consists of residual basic block, a channel attention submodule, and a spatial attention submodule, as shown in Figure 3. In the channel attention submodule, the maximum pooling aims to extract the significant feature of each channel, and the average pooling is used to capture the whole statistics feature of the channel. Following the pooling operations, a multilayer perceptron (MLP) squeezes the spatial information obtained by pooling operations and finds the importance of features per channel, focusing more on the channel with a greater amount of information. In the spatial attention submodule, the maximum pooling aims to highlight the saliency feature of local regions, and the average pooling is used to integrate global spatial information. Following the pooling operations, a convolution layer with the kernel size of 7 × 7 is used to generate a spatial attention map, which help the encoder network to emphasize the significant regions and suppress the spatial noise. Finally, the input of the RM and the final output of the spatial attention submodule are added through the skip connection operation to enhance the representational ability of the network.
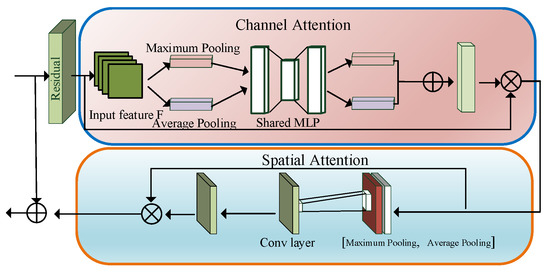
Figure 3.
The structure of the attention module (RM).
To further capture the global information, we designed a dilated convolution block composed of three dilated convolutional layers with a dilation rate of 1, 2, and 4, respectively (kernel size = 3 × 3, channel = 512). The advantage of dilated convolution is that it increases the receptive field without loss information and, thus, enhances the ability of the location and segmentation of large defect objects [30]. Furthermore, through adjusting dilation rates, multiscale context information with different receptive fields is obtained [31].
3.2. Decoder Network
Inspired by U2-Net [13], a U-shaped residual decoder network is proposed by composing a convolutional network with designed U-shaped residual blocks (URB) which draw multi-scale features without degrading the feature map resolution. In salient object detection and other segmentation tasks, convolution kernels with a size of 1 × 1 or 3 × 3 are often used by classic convolutional models, including ResNet [29] and VGG [20] for feature extraction. However, the receptive field of the convolution kernel is too small to capture global information and, thus, the output features of the shallow layer only contain local feature size. As discussed in Section 3.1, dilated convolution can be used to enlarge the receptive fields to extract both local and non-local features [32]. The shortcoming of running multiple dilated convolutions is that it consumes much more computation time and memory resources [31]. Pooling techniques, including upsampling and downsampling, are often used to prevent this issue [23]. Therefore, URB is designed by combining dilated convolutions and pooling techniques into U-shape residual blocks, as shown in Figure 2.
Figure 4 shows the structure detail of each URB (Cin, k, and Cout), where k represents the number of channels in the internal layers, and Cin and Cout represent the input and output channels, respectively. The URB firstly obtains the intermediate feature map G1(x) from the input feature mapping x with size of H × W × Cin using a convolutional layer with a kernel size of 3 × 3 and a channel number equal to Cin. Then, URB feeds G1(x) as input into a U-shaped structure pyramidal feature hierarchy network with downsampling (upsampling) pools to reduce (expend) feature map sizes, where the bottom-up pathway is to extract multi-scale space and context features, outputting U (G1(x)). The top-down pathway and concatenation connections of the U-shaped network fuse low-level feature maps with high space information and high-level maps with high semantical information to enhance the ability of locating defect objects. Finally, there is a skip connection that merges local features and multiscale features through addition. This structure is designed to enable the URB to immediately extract features of multiple scales from the residual block.
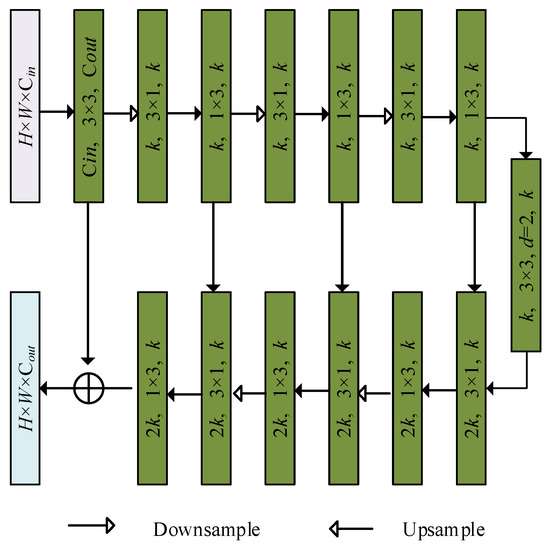
Figure 4.
Illustration of the proposed residual U-shaped residual blocks (URB).
The computational overhead of the URB is small due to downsampling (upsampling) used for reducing (expending) feature map sizes. In order to further reduce the computing complexity, two convolutional layers with kernel sizes of 1 × 3 and 3 × 1 were used to replace a convolutional layer with a kernel size of 3 × 3. Furthermore, a dilated convolution layers with a kernel size of 3 × 3 and dilation rate equal to 2 was designed as the bridge between the bottom-up pathway and top-down pathway to extend the URBs’ receptive fields.
3.3. Refinement Network
In order to effectively utilize the features of defect objects, a deep supervision mechanism [33] was proposed to supervise the coarse saliency map generated by each URB of the decoder network, as shown in Figure 2. Furthermore, a residual refinement network (RN_1D) consisting of one-dimensional filters is proposed to further refine the last prediction map of the URB output, as shown in Figure 5. We choose the last prediction map because of its richer significant information.
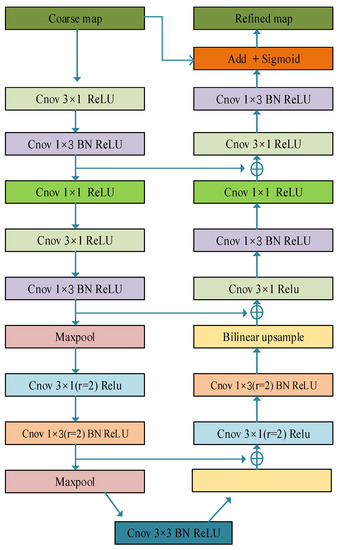
Figure 5.
Refinement network structure diagram.
Here, RN_1D uses maximum pooling in the bottom-up way to adjust the feature size and reduce calculation complexity. The reason why we use the maximum pooling operation instead of average pooling is that small defects are easily lost in average pooling. The maximum pooling can solve this problem well and make the URB more concerned about significant defective areas. As with URB in Section 3.2, we use one-dimensional 3 × 1 and 1 × 3 convolutions instead of 3 × 3 convolutions, which greatly saves on computational costs. A dilated convolutional layer with a kernel size of 3 × 3 and a dilation rate equal to 2 was used as the bridge between the feature extraction layer (bottom-up pathway) and feature fusion layers (top-down pathway), which not only obtains the large receptive field, but also improves the detection accuracy. A batch normalization [34] and a ReLU [35] activation function follows this dilated convolutional layer. Furthermore, non-overlapping max pooling is used for downsampling in the feature extraction layer (bottom-up pathway), and bilinear interpolation is utilized for the upsampling in the feature fusion layers (top-down pathway). Finally, we use the prediction map after the refinement network as the final prediction map of the NURCNet.
3.4. Loss Function
Most of the previous salient object detection methods have always used cross-entropy for training loss. When these methods capture target objects, it is difficult to obtain complete details, resulting in blurred boundaries or incomplete detection results. Inspired by Qin et al. [36], a hybrid loss is constructed to supervise the network and to learn more detailed information concerning boundary location and structure capture. The fusion loss is composed of binary cross-entropy (BCE) [37], boundary intersection over union (boundary IoU) [38], and structural similarity (SSIM) [39]. Therefore, the total loss of NURCNet is defined as follows:
where K denotes the total number of the outputs. As described in Section 3.2 and Section 3.3, our NURCNet is deeply supervised with five outputs, i.e., K = 5, including four outputs from the encoder–decoder network and one output from the refinement network.
The BCE loss [37] is one of the most often used losses in binary classification and segmentation, defined as follows:
where Gr,c ∈ {0, 1} is the ground truth label of the pixel (r, ) and Sr,c is the predicted probability of being defective object.
The SSIM [39] is originally proposed for image quality assessment, and it captures the structural information of an image. Let X= {xj: j = 1,..., N2} and Y= {yj: j = 1, …, N2} be the pixel values of two corresponding patches cropped from the predicted probability map S and the binary ground truth mask G, respectively; the SSIM is defined as follows:
where μx, μy and , are the mean and standard of x and y, respectively, σxy is their covariance, and C1 = 0.012 and C2 = 0.032 are used to avoid dividing by zero.
Boundary IOU [38] loss is adopted to further penalize the inaccurate classification, and it is defined as follows:
4. Evaluation Metrics
Evaluation metrics are essential for evaluating the effectiveness of algorithms and, traditionally, the mean absolute error (MAE) [40] is one of the most frequently used metrics for the saliency object detection. The MAE aims to measure the dissimilarity between the predicted saliency map ypred and the ground truth ygt, defined as follows:
where N is the number of test saliency defect images.
However, MAE is inadequate for the strip steel defect detection problem due to the sparsity of defect objects. In lieu of MAE, other assessment metrics, including the weighted F-measure (WF) [41] score and structure-measure (SM) [42] are frequently adopted in the research community to evaluate the performance of models for strip steel defect detection. The WF is designed based on the precision (the proportion of true foreground pixels in the predicted foreground pixels) and recall (the proportion of predicted foreground pixels in the true foreground pixels). Specifically, the precision and recall are defined as follows:
where TF, FF, and FB indicate the number of foreground pixels predicted as foreground pixels (true foreground), background pixels predicted as foreground pixels (false foreground), and foreground pixels as background pixels, respectively. Based on precision and recall, WF is defined as follows:
where β, often set to be 1, is a coefficient for adjusting the relative importance of precision with respect to recall. Therefore, f-measure is a harmonic mean between recall and precision.
The SM [42] is another often used measure to evaluate the performance of models for the strip steel defect detection, defined as follows:
Where So is an object-aware structural similarity evaluation definition, and Sr is a region-aware structural similarity evaluation definition. Therefore, SM is a structural similarity evaluation metric, which simultaneously considers the object-aware and region-aware structural similarity between the predicted saliency map and ground truth. We set α = 0.5 in our implementation.
The boundary quality is an important indicator for evaluating the detection effect of the model. The Pratt’s figure of merit (PFOM [43]) is often used to evaluate the boundary quality of predicted saliency map, defined by the combination of three factors, namely the missed detection of the real edge, the misunderstanding of the pseudo-edge, and the positioning error of the edge. Formally, PFOM is defined as follows:
where Ne and Nd are the number of ideal and real edge points, respectively, dk is the pixel miss distance between the k-th ideal edge point and the corresponding detected edge point, and β is a scaling constant chosen to 1/9 to provide a relative penalty between smeared edges and isolated, but offset, edges.
5. Experiments and Discussion
5.1. Experimental Setup
We verify the performance of our model on the public strip steel dataset SD-saliency-900 [14], which includes 900 cropped images with a size of 200 × 200 pixels. Furthermore, in this dataset, there are three defects, namely inclusions, patches, and scratches.
Inspired by [44], we use a standard training set to compare the proposed method with various deep models. This training set contains 810 images, of which 540 images (180 images per defect type) are randomly picked from the original dataset and 270 noise images (90 images per defect type) are obtained by using the disturbing method of salt and pepper noise (ρ = 10%). Similar to [44], in the training process, each image is resized to 256 × 256 and randomly cropped to 224 × 224, and then normalized by . The parameters of the encoder network are initialized through initialization strategy [45] instead of using a pretrained ResNet-34 [29]. The batch size was set to be 8, and the number of training steps was 50K due to the fact that the loss converges after 50K iterations without adopting a validation set, as shown in Figure 6. We use the RMSprop optimizer [46] as the optimizer with a learning rate equal to 0.001 and an alpha equal to 0.9. During the test, we first adjust the image to 256 × 256 and then input it into the network to obtain its saliency map. To keep the resolution of the input and output images consistent, bilinear interpolation is used to restore the saliency map.
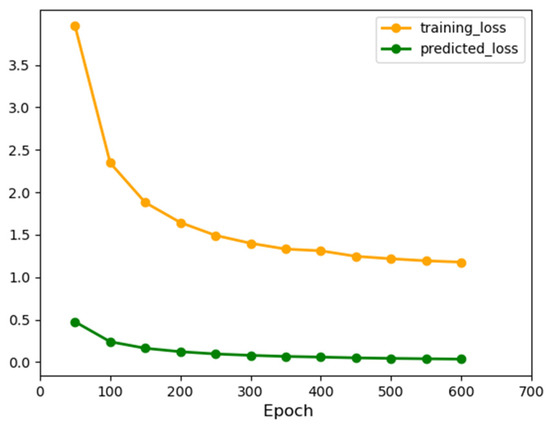
Figure 6.
Convergence curve for NURCNet.
We implement the proposed model using the Pytorch framework [47] and train all experiments with an NVIDIA TITAN Xp GPU. With the acceleration of the GPU, the whole training process takes approximately 7 h. When testing, our model only requires 0.035 s to process a 200 × 200 image.
5.2. Ablation Analysis
5.2.1. Structural Analysis
In this subsection, we perform an ablation study to analyze the seven configurations of the proposed NURCNet using mean absolute error (MAE), the weighted F-measure (WF), and structure-measure (SM) metrics, as shown in Figure 7 and Table 1. From Figure 7, we observe that the proposed model with all components, i.e., attention, URB, and RRS_ID, captures more detailed information concerning defect objects and, thus, achieves the best performance. Table 1 further validates the observation, as the performance of the model gradually improves with the addition of each key component, and the model with all components has the best prediction results in terms of MAE, WF, and SM. In addition, Table 1 shows that NURCNet reduces MAE by 26% and, respectively, improves WF and SM by 3.2% and 1.4% compared to the baseline model. This observation indicates that all the key components in the proposed model are useful and necessary for obtaining the best defective object detection results.
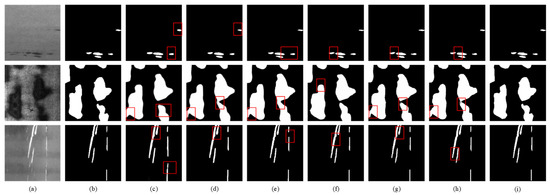
Figure 7.
Visual comparison of saliency detection results under the models composed of the different key components. From left to right, as follows: (a) input image; (b) ground truth; (c) baseline (B); (d) B + attention; (e) B + URB; (f) B + URB + RN_1D; (g) NURCNet-URB*; (h) NURCNet-RN_1D*; (i) NURCNet.

Table 1.
The results of using different key components.
5.2.2. Loss Analysis
On the NURCNet architecture, we verify the rationality of hybrid loss through a series of comparative experiments using different loss terms, as shown in Figure 8 and Table 2. From Figure 8, we can observe that the proposed model with fusion loss captures more rich border details of defect objects, and that the interference of non-defective information is well removed; thus, our NURCNet output a saliency defect map of the clear boundary. Table 2 shows that NURCNet (i.e., the fusion loss items) offers better performance compared to other variations. In addition, compared to the counterpart adopting widely-used cross-entropy loss , the WF and SM are, respectively, increased by 2.5% and 0.56%, while the MAE is reduced by 14%.
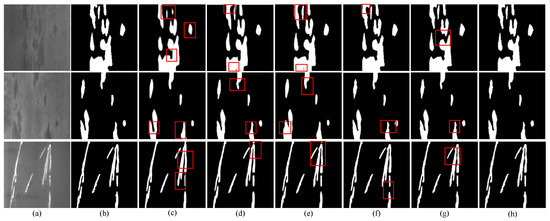
Figure 8.
Visualization of the results of different losses. (a) Strip steel surface images; (b) ground truth; (c) ; (d) ; (e) ; (f) +; (g) +; and (h) (ours). Red boxes indicate areas where defects are incomplete.

Table 2.
The results of different losses.
5.3. Comparison Results and Discussion
The proposed NURCNet is compared with eight of the conventional or deep learning saliency detection methods, i.e., RCRR [48], 2LSG [49], BC [50], SMD [19], PoolNet [23], PiCANet [51], CPD [25], and BASNet [36]. Table 3 presents the corresponding results of the nine methods.

Table 3.
Comparison of results from nine competitive methods.
From Table 3, we can find that NURCNet achieves excellent performance on four evaluation metrics, i.e., MAE, WF, SM, and PFOM. Specifically, compared to RCRR, 2LSG, BC, SMD, PoolNet, PiCANet, CPD, and BASNet, NURCNet reduces MAE by 94.5%, 94.6%, 90.8%, 93%, 59.7%, 60.4%, 60.6%, and 13.1%, respectively, and improves WF (SM) by 257.3%, 203.8%, 144.7%, 152.9%, 25.8%, 21.5%, 26.3%, and 1.2% (79.4%, 77.2%, 61.7%, 62.9%, 15.8%, 12.0%, 14.5%, and 3%), respectively. Furthermore, we observe from Table 3 that NURCNet achieves more accurate identification of defect contours. Specifically, NURCNet improves PFOM by 188.9%, 156.8%, 170.4%, 41.9%, 28.4%, 20.1%, 23.5%, and 2.1% when compared to RCRR, 2LSG, BC, SMD, PoolNet, PiCANet, CPD, and BASNet, respectively. These results indicate that the performance of the NURCNet is better than the eight state-of-the-art models. Therefore, our model will be a better choice in industrial defect detection applications.
Table 4 records the comparison of the model size (MB) and the average running time (seconds per image) on the SD-Saliency-900 dataset. In Table 4, “M” presents that the code is written in MATLAB, “C” means that the code is written in CAFFE, and “P” denotes that the code is written in PYTORCH. It can be found that our model only needs 0.037 s to detect a 200 × 200 image, which makes our model stand out among all models. In real-world industrial defect detection, lightweight models are highly sought after by factories. However, our model size is slightly large when compared with the other models. Therefore, in future work, we will adopt some lightweight techniques to reduce the size of our model.

Table 4.
Comparison of the model size and the average running time.
6. Conclusions
In this paper, we propose a novel nested u-shaped residual codec network (NURCNet) to improve conventional convolutional neural networks (CNNs) for the industrial defect detection problem. The embedding of the dilated convolution, attention mechanism, and fusion loss ensures that NURCNet can capture abundant details without increasing the calculation amount too much. In the encoder, we use a fully convolutional neural network and attention mechanism to extract both the rich low-level spatial details and high-level contextual information. Then, to aggregate multiscale deep features, we utilize the U-shaped decoder to progressively integrate deep features in a top-down way. the encoder and decoder forms a nested U-shaped residual codec network. Finally, a residual refinement network is introduced to further optimize the coarse saliency map which is output by the encoder–decoder stage. Experimental results show that, compared to the eight state-of-the-art models, our model has the best performance in the industrial defect detection problem. In addition, our NURCNet model does not require any postprocessing.
Author Contributions
Conceptualization, H.G., S.Z., L.Z., W.Z., Y.S. and J.W.; methodology, H.G., S.Z., L.Z. and Y.S.; software, H.G. and S.Z.; validation, H.G., S.Z. and L.Z.; formal analysis, H.G., S.Z., L.Z., W.Z., Y.S. and J.W.; investigation, H.G., S.Z., L.Z., W.Z. and Y.S.; resources, H.G., L.Z.; data curation, H.G., S.Z., L.Z., Y.S. and J.W.; writing—original draft preparation, H.G., S.Z. and L.Z.; writing—review and editing, H.G.; visualization, H.G. and S.Z.; supervision, H.G., S.Z. and L.Z.; project administration, H.G., S.Z., L.Z. and Y.S. All authors have read and agreed to the published version of the manuscript.
Funding
I wish to thank the anonymous editor and the reviewers for their constructive comments and recommendations, which have significantly improved the presentation of this paper. This work is in part supported by [National Natural Science Found of China], grant no. [31900710], [Science and Technology Research key Project of the Education Department of Henan Province], grant no. [22A520008] and [Xinyang Normal University Graduate Research Innovation Fund], grant no. [2021KYJ10], [Natural Science Foundation of Henan Province], grant no. [222300420275, 222300420274].
Institutional Review Board Statement
Not applicable.
Informed Consent Statement
Not applicable.
Data Availability Statement
Not applicable.
Conflicts of Interest
The authors declare no conflict of interest.
References
- Chen, J.; Feng, Q.; Wang, F.; Zhang, H.; Song, H. Research on Burst Tests of Pipeline with Spiral Weld Defects. In Proceedings of the International Pipeline Conference. American Society of Mechanical Engineers 2012, Calgary, AB, Canada, 24–28 September 2012; Volume 3, pp. 53–60. [Google Scholar]
- Achanta, R.; Hemami, S.S.; Estrada, F.J.; Süsstrunk, S. Frequency-tuned salient region detection. In Proceedings of the 2009 IEEE Conference on Computer Vision and Pattern Recognition, Miami, FL, USA, 20–25 June 2009; pp. 1597–1604. [Google Scholar]
- Zhang, F.; Du, B.; Zhang, L. Saliency-Guided Unsupervised Feature Learning for Scene Classification. IEEE Trans. Geosci. Remote Sens. 2015, 53, 2175–2184. [Google Scholar] [CrossRef]
- Bi, S.; Li, G.; Yu, Y. Person Re-Identification Using Multiple Experts with Random Subspaces. J. Image Graph. 2014, 2, 151–157. [Google Scholar] [CrossRef]
- Zhao, R.; Ouyang, W.; Wang, X. Unsupervised Salience Learning for Person Re-identification. In Proceedings of the CVPR, IEEE Computer Society Conference on Computer Vision and Pattern Recognition, Washington, DC, USA, 16–18 June 2013; pp. 3586–3593. [Google Scholar]
- Sun, J.; Wang, P.; Luo, Y.-K.; Li, W. Surface Defects Detection Based on Adaptive Multiscale Image Collection and Convolutional Neural Networks. IEEE Trans. Instrum. Meas. 2019, 68, 4787–4797. [Google Scholar] [CrossRef]
- Sun, G.; Wang, W.; Dai, J.; Van Gool, L. Mining cross-image semantics for weakly supervised semantic segmentation. In Proceedings of the European Conference on Computer Vision, Glasgow, UK, 23–28 August 2020; pp. 347–365. [Google Scholar]
- Bissi, L.; Baruffa, G.; Placidi, P.; Ricci, E.; Scorzoni, A.; Valigi, P. Automated defect detection in uniform and structured fabrics using Gabor filters and PCA. J. Vis. Commun. Image Represent. 2013, 24, 838–845. [Google Scholar] [CrossRef]
- Li, W.-C.; Tsai, D.-M. Wavelet-based defect detection in solar wafer images with inhomogeneous texture. Pattern Recognit. 2012, 45, 742–756. [Google Scholar] [CrossRef]
- Halfawy, M.R.; Hengmeechai, J. Automated defect detection in sewer closed circuit television images using histograms of oriented gradients and support vector machine. Autom. Constr. 2014, 38, 1–13. [Google Scholar] [CrossRef]
- Soukup, D.; Huber-Mörk, R. Convolutional neural networks for steel surface defect detection from photometric stereo images. In Proceedings of the International Symposium on Visual Computing, Las Vegas, NV, USA, 8–10 December 2014; pp. 668–677. [Google Scholar]
- Wang, W.; Lai, Q.; Fu, H.; Shen, J.; Ling, H.; Yang, R. Salient Object Detection in the Deep Learning Era: An In-Depth Survey. IEEE Trans. Pattern Anal. Mach. Intell. 2021, 44, 3239–3259. [Google Scholar] [CrossRef]
- Qin, X.; Zhang, Z.; Huang, C.; Dehghan, M.; Zaiane, O.R.; Jagersand, M. U2-Net: Going deeper with nested U-structure for salient object detection. Pattern Recognit. 2020, 106, 107404. [Google Scholar] [CrossRef]
- Song, G.; Song, K.; Yan, Y. Saliency detection for strip steel surface defects using multiple constraints and improved texture features. Opt. Lasers Eng. 2020, 128, 106000. [Google Scholar] [CrossRef]
- Srivatsa, R.S.; Babu, R.V. Salient object detection via objectness measure. In Proceedings of the 2015 IEEE International Conference on Image Processing (ICIP), Quebec City, QC, Canada, 27–30 September 2015; pp. 4481–4485. [Google Scholar]
- Zhang, J.; Sclaroff, S.; Lin, Z.; Shen, X.; Price, B.; Mech, R. Minimum barrier salient object detection at 80 fps. In Proceedings of the IEEE International Conference on Computer Vision, Santiago, Chile, 7–13 December 2015; pp. 1404–1412. [Google Scholar]
- Yan, Y.; Kaneko, S.; Asano, H. Accumulated and aggregated shifting of intensity for defect detection on micro 3D textured surfaces. Pattern Recognit. 2020, 98, 107057. [Google Scholar] [CrossRef]
- Huang, F.; Qi, J.; Lu, H.; Zhang, L.; Ruan, X. Salient object detection via multiple instance learning. IEEE Trans. Image Process. 2017, 26, 1911–1922. [Google Scholar] [CrossRef]
- Peng, H.; Li, B.; Ling, H.; Hu, W.; Xiong, W.; Maybank, S.J. Salient object detection via structured matrix decomposition. IEEE Trans. Pattern Anal. Mach. Intell. 2016, 39, 818–832. [Google Scholar] [CrossRef]
- Simonyan, K.; Zisserman, A. Very deep convolutional networks for large-scale image recognition. arXiv 2014, arXiv:14091556. [Google Scholar]
- Zhao, R.; Ouyang, W.; Li, H.; Wang, X. Saliency detection by multi-context deep learning. In Proceedings of the IEEE conference on Computer Vision and Pattern Recognition, Boston, MA, USA, 7–12 June 2015; pp. 1265–1274. [Google Scholar]
- Li, G.; Yu, Y. Visual saliency detection based on multiscale deep CNN features. IEEE Trans. Image Process. 2016, 25, 5012–5024. [Google Scholar] [CrossRef]
- Liu, J.-J.; Hou, Q.; Cheng, M.-M.; Feng, J.; Jiang, J. A simple pooling-based design for real-time salient object detection. In Proceedings of the IEEE/CVF Conference on Computer Vision and Pattern Recognition, Long Beach, CA, USA, 15–20 June 2019; pp. 3917–3926. [Google Scholar]
- Zhao, T.; Wu, X. Pyramid feature attention network for saliency detection. In Proceedings of the IEEE/CVF Conference on Computer Vision and Pattern Recognition, Long Beach, CA, USA, 15–20 June 2019; pp. 3085–3094. [Google Scholar]
- Wu, Z.; Su, L.; Huang, Q. Cascaded partial decoder for fast and accurate salient object detection. In Proceedings of the IEEE/CVF Conference on Computer Vision and Pattern Recognition, Long Beach, CA, USA, 15–20 June 2019; pp. 3907–3916. [Google Scholar]
- Liu, N.; Han, J. Dhsnet: Deep hierarchical saliency network for salient object detection. In Proceedings of the IEEE Conference on Computer Vision and Pattern Recognition, Las Vegas, NV, USA, 27–30 June 2016; pp. 678–686. [Google Scholar]
- Peng, C.; Zhang, X.; Yu, G.; Luo, G.; Sun, J. Large kernel matters–improve semantic segmentation by global convolutional network. In Proceedings of the IEEE Conference on Computer Vision and Pattern Recognition, Honolulu, HI, USA, 21–26 July 2017; pp. 4353–4361. [Google Scholar]
- Wang, T.; Zhang, L.; Wang, S.; Lu, H.; Yang, G.; Ruan, X.; Borji, A. Detect globally, refine locally: A novel approach to saliency detection. In Proceedings of the IEEE Conference on Computer Vision and Pattern Recognition, Salt Lake City, UT, USA, 18–22 June 2018; pp. 3127–3135. [Google Scholar]
- He, K.; Zhang, X.; Ren, S.; Sun, J. Deep residual learning for image recognition. In Proceedings of the IEEE Conference on Computer Vision and Pattern Recognition, Las Vegas, NV, USA, 27–30 June 2016; pp. 770–778. [Google Scholar]
- Yu, F.; Koltun, V. Multi-scale context aggregation by dilated convolutions. arXiv 2015, arXiv:151107122. [Google Scholar]
- Chen, L.-C.; Papandreou, G.; Kokkinos, I.; Murphy, K.; Yuille, A.L. Deeplab: Semantic image segmentation with deep convolutional nets, atrous convolution, and fully connected crfs. IEEE Trans. Pattern Anal. Mach. Intell. 2017, 40, 834–848. [Google Scholar] [CrossRef]
- Zhang, L.; Dai, J.; Lu, H.; He, Y.; Wang, G. A bi-directional message passing model for salient object detection. In Proceedings of the IEEE Conference on Computer Vision and Pattern Recognition, Salt Lake City, UT, USA, 18–22 June 2018; pp. 1741–1750. [Google Scholar]
- Xie, S.; Tu, Z. Holistically-nested edge detection. In Proceedings of the IEEE International Conference on Computer Vision, Santiago, Chile, 7–13 December 2015; pp. 1395–1403. [Google Scholar]
- Ioffe, S.; Szegedy, C. Batch normalization: Accelerating deep network training by reducing internal covariate shift. In Proceedings of the International Conference on Machine Learning, Lille, France, 7–9 July 2015; pp. 448–456. [Google Scholar]
- Glorot, X.; Bordes, A.; Bengio, Y. Deep sparse rectifier neural networks. In Proceedings of the Fourteenth International Conference on Artificial Intelligence and Statistics, Fort Lauderdale, FL, USA, 11–13 April 2011; pp. 315–323. [Google Scholar]
- Qin, X.; Zhang, Z.; Huang, C.; Gao, C.; Dehghan, M.; Jagersand, M. BASNet: Boundary-Aware Salient Object Detection. In Proceedings of the IEEE/CVF Conference on Computer Vision and Pattern Recognition, Long Beach, CA, USA, 15–20 June 2019. [Google Scholar]
- De Boer, P.-T.; Kroese, D.P.; Mannor, S.; Rubinstein, R.Y. A tutorial on the cross-entropy method. Ann. Oper. Res. 2005, 134, 19–67. [Google Scholar] [CrossRef]
- Rahman, M.A.; Wang, Y. Optimizing intersection-over-union in deep neural networks for image segmentation. In Proceedings of the International Symposium on Visual Computing, Lake Tahoe, NV, USA, 5–7 December 2016; pp. 234–244. [Google Scholar]
- Wang, Z.; Simoncelli, E.P.; Bovik, A.C. Multiscale structural similarity for image quality assessment. In Proceedings of the Thrity-Seventh Asilomar Conference on Signals, Systems & Computers, Pacific Grove, CA, USA, 9–12 November 2003; Volume 2, pp. 1398–1402. [Google Scholar]
- Perazzi, F.; Krähenbühl, P.; Pritch, Y.; Hornung, A. Saliency filters: Contrast based filtering for salient region detection. In Proceedings of the 2012 IEEE Conference on Computer Vision and Pattern Recognition, Providence, RI, USA, 16–21 June 2012. [Google Scholar]
- Margolin, R.; Zelnik-Manor, L.; Tal, A. How to Evaluate Foreground Maps. In Proceedings of the IEEE Computer Society Conference on Computer Vision and Pattern Recognition, Columbus, OH, USA, 23–28 June 2014. [Google Scholar]
- Cheng, M.-M.; Fan, D.-P. Structure-Measure: A New Way to Evaluate Foreground Maps. Int. J. Comput. Vis. 2021, 129, 2622–2638. [Google Scholar] [CrossRef]
- Abdou, I.E.; Pratt, W.K. Quantitative design and evaluation of enhancement/thresholding edge detectors. Proc. IEEE 1979, 67, 753–763. [Google Scholar] [CrossRef]
- Song, G.; Song, K.; Yan, Y. EDRNet: Encoder–Decoder Residual Network for Salient Object Detection of Strip Steel Surface Defects. IEEE Trans. Instrum. Meas. 2020, 69, 9709–9719. [Google Scholar] [CrossRef]
- He, K.; Zhang, X.; Ren, S.; Sun, J. Delving deep into rectifiers: Surpassing human-level performance on imagenet classification. In Proceedings of the IEEE International Conference on Computer Vision, Santiago, Chile, 7–13 December 2015; pp. 1026–1034. [Google Scholar]
- Tieleman, T.; Hinton, G. Rmsprop: Divide the gradient by a running average of its recent magnitude. coursera: Neural networks for machine learning. COURSERA Neural Netw. Mach. Learn. 2012, 4, 26–31. [Google Scholar]
- Paszke, A.; Gross, S.; Chintala, S.; Chanan, G.; Yang, E.; DeVito, Z.; Lin, Z.; Desmaison, A.; Antiga, L.; Lerer, A. Automatic differentiation in pytorch. In Proceedings of the 31st Conference on Neural Information Processing Systems(NIPS), Long Beach, CA, USA, 4–9 December 2017; pp. 1–4. [Google Scholar]
- Yuan, Y.; Li, C.; Kim, J.; Cai, W.; Feng, D.D. Reversion correction and regularized random walk ranking for saliency detection. IEEE Trans. Image Process. 2017, 27, 1311–1322. [Google Scholar] [CrossRef]
- Zhou, L.; Yang, Z.; Zhou, Z.; Hu, D. Salient region detection using diffusion process on a two-layer sparse graph. IEEE Trans. Image Process. 2017, 26, 5882–5894. [Google Scholar] [CrossRef] [PubMed]
- Zhu, W.; Liang, S.; Wei, Y.; Sun, J. Saliency optimization from robust background detection. In Proceedings of the IEEE Conference on Computer Vision and Pattern Recognition, Columbus, OH, USA, 23–28 June 2014; pp. 2814–2821. [Google Scholar]
- Liu, N.; Han, J.; Yang, M.-H. Picanet: Learning pixel-wise contextual attention for saliency detection. In Proceedings of the IEEE Conference on Computer Vision and Pattern Recognition, Salt Lake City, UT, USA, 18–22 June 2018; pp. 3089–3098. [Google Scholar]
Publisher’s Note: MDPI stays neutral with regard to jurisdictional claims in published maps and institutional affiliations. |
© 2022 by the authors. Licensee MDPI, Basel, Switzerland. This article is an open access article distributed under the terms and conditions of the Creative Commons Attribution (CC BY) license (https://creativecommons.org/licenses/by/4.0/).