Article

Supplementation of an Anthocyanin-Rich Elderberry (Sambucus nigra L.) Extract in FVB/n Mice: A Healthier Alternative to Synthetic Colorants

by
Tiago Azevedo
1,2,
Tiago Ferreira
1,2,
João Ferreira
3,4,
Filipa Teixeira
5,
Diana Ferreira
5,
Rita Silva-Reis
1,2,6,
Maria João Neuparth
7,8,9,
Maria João Pires
1,2,
Maria de Lurdes Pinto
4,
Rui M. Gil da Costa
1,2,10,11,12,13,
Margarida M. S. M. Bastos
11,12,
Rui Medeiros
10,14,15,16,17,
Luís Félix
1,2,*,
Carlos Venâncio
1,2,4,
Maria Inês Dias
18,19,
Isabel Gaivão
3,4,
Lillian Barros
18,19 and
Paula A. Oliveira
1,2,*
1
Centre for the Research and Technology of Agro-Environmental and Biological Sciences (CITAB), University of Trás-os-Montes and Alto Douro, 5000-801 Vila Real, Portugal
2
Inov4Agro—Institute for Innovation, Capacity Building and Sustainability of Agri-Food Production, University of Trás-os-Montes and Alto Douro, 5000-801 Vila Real, Portugal
3
Department of Genetics and Biotechnology, School of Life and Environmental Sciences, University of Trás-os-Montes and Alto Douro, 5000-801 Vila Real, Portugal
4
Animal and Veterinary Research Centre (CECAV), University of Trás-os-Montes and Alto Douro, Quinta de Prados, 5000-801 Vila Real, Portugal
5
School of Life and Environmental Sciences, University of Trás-os-Montes and Alto Douro, 5000-801 Vila Real, Portugal
6
LAQV-REQUIMTE, Department of Chemistry, University of Aveiro, 3810-193 Aveiro, Portugal
7
Research Center in Physical Activity, Health and Leisure (CIAFEL), Faculty of Sports, University of Porto, 4200-319 Porto, Portugal
8
TOXRUN—Toxicology Research Unit, University Institute of Health Sciences, CESPU, 4585-116 Gandra, Portugal
9
Laboratory for Integrative and Translational Research in Population Health (ITR), 4050-600 Porto, Portugal
10
Molecular Oncology and Viral Pathology Group, Research Center of IPO Porto (CI-IPOP)/RISE@CI-IPOP (Health Research Network), Portuguese Oncology Institute of Porto (IPO Porto), Porto Comprehensive Cancer Center (Porto.CCC), 4200-072 Porto, Portugal
11
Laboratory for Process Engineering, Environment, Biotechnology and Energy (LEPABE), Faculty of Engineering, University of Porto, 4200-465 Porto, Portugal
12
Associate Laboratory in Chemical Engineering (ALiCE), Faculty of Engineering, University of Porto, 4200-465 Porto, Portugal
13
Postgraduate Programme in Adult Health (PPGSAD), Department of Morphology, Federal University of Maranhão (UFMA), UFMA University Hospital (HUUFMA), São Luís 65020-070, Brazil
14
Research Department of the Portuguese League against Cancer Regional Nucleus of the North (LPCC-NRN), 4200-177 Porto, Portugal
15
Faculty of Medicine, University of Porto, 4200-319 Porto, Portugal
16
Institute of Biomedical Sciences Abel Salazar (ICBAS), 4050-313 Porto, Portugal
17
Biomedical Research Center (CEBIMED), Faculty of Health Sciences of Fernando Pessoa University (UFP), 4249-004 Porto, Portugal
18
Centro de Investigação de Montanha (CIMO), Instituto Politécnico de Bragança, Campus de Santa Apolónia, 5300-253 Bragança, Portugal
19
Laboratório Associado para a Sustentabilidade e Tecnologia em Regiões de Montanha (SusTEC), Instituto Politécnico de Bragança, Campus de Santa Apolónia, 5300-253 Bragança, Portugal
*
Authors to whom correspondence should be addressed.
Appl. Sci. 2022, 12(23), 11928; https://doi.org/10.3390/app122311928
Submission received: 31 October 2022 / Revised: 16 November 2022 / Accepted: 19 November 2022 / Published: 23 November 2022
(This article belongs to the Special Issue Potential Health Benefits of Fruits and Vegetables II)

Abstract

:

Featured Application

Due to anthocyanins’ potential as colorants, this anthocyanin-rich elderberry extract presents a healthier alternative to commercially available colorants and has the potential to be used at industry level.

Abstract

Sambucus nigra L., popularly known as elderberry, is renowned for its amazing therapeutic properties, as well as its uses as a food source, in nutraceuticals, and in traditional medicine. This study’s aim was to investigate the effects of an elderberry extract (EE) on mice for 29 days, as well as the safety of the extract when used as a natural colorant. Twenty-four FVB/n female mice (n = 6) were randomly assigned to one of four groups: control, 12 mg/mL EE (EE12), 24 mg/mL EE (EE24), or 48 mg/mL EE (EE48). The predominant anthocyanins detected were cyanidin-3-O-sambubioside and cyanidin-3-O-glucoside. Food and drink intake were similar between groups, with the exception of EE48, who drank significantly less compared with the Control. Biochemical analysis of the liver showed that the changes observed in histological analysis had no pathological significance. The EE, at doses of 24 and 48 mg/mL, significantly reduced the oxidative DNA damage compared with the non-supplemented group. The S. nigra extract showed a favorable toxicological profile, affording it potential to be used in the food industry.

1. Introduction

The genus Sambucus belong to the Adoxaceae family and consists of 5 to 30 species, with Sambucus nigra L. being the most commonly occurring species [1,2,3]. This species, which is native to the northern hemisphere and may be found on practically every continent, is sometimes referred to as “black elder, European elder, or elderberry” [4]. It is a 6 m tall deciduous shrub that thrives in locations with direct sunlight. Between the spring and summer, the elderberry produces white hermaphrodite flowers, and in the late summer, the fruits mature [5]. The fruits of S. nigra L. are dark purple berries in a cluster with a diameter of up to 6 mm [5], and are a good source of vitamins, sugars, organic acids, fatty acids, protein, and essential oils [3,6,7,8]. Elderberry is also rich in phenolic compounds, especially anthocyanins. In folk medicine, elderberry has been widely consumed for many years due to its therapeutic effects; the berries have been used for the preparation of juice and tea to treat several illnesses, such as constipation, common cold, and diarrhea [8,9,10].
In the food industry, elderberry fruits and flowers are used to produce several products, such as liqueurs, jams, and juices [11]. Moreover, S. nigra can be used as a functional food for the prevention and the treatment of numerous diseases, as it has demonstrated antioxidant, anti-inflammatory, immune-stimulating, anti-cancer, and atheroprotective properties [12,13].
The largest class of water-soluble pigments, anthocyanins, afford many fruits and vegetables their red, purple, and blue hues [14]. These natural pigments can be found in flowers, roots, and vegetables, and are mostly associated with red fruits [14,15]. Furthermore, the food industry’s interest in natural dyes has been increasing in order to replace synthetic dyes, as the latter have demonstrated disadvantages, such as allergenic, toxic, and even carcinogenic effects [16]. Cyanidin-3-glucoside and cyanidin-3-sambubioside are the most abundant anthocyanins found in elderberry juice [11,17]. Furthermore, anthocyanin cyanidin-3-glucoside has demonstrated anti-cancer [18,19], anti-angiogenic [20] and anti-obesity properties [21]. As such, anthocyanins have the added benefit of being used to prevent a variety of diseases, in addition to being of particular interest due to their great colorant properties, and could be used as a potential natural colorant [14,15]. The aim of this research was to evaluate the effect of an anthocyanin-rich elderberry extract (EE) supplementation on mice’s physiological parameters.

2. Materials and Methods

2.1. Sample Preparation

Sambucus nigra L. fruits were collected in mid-September 2019 in Braganza, Portugal, when the maturation process was complete (Figure 1). The harvested fruits were immediately separated from the stems, washed, and frozen at −20 °C. The frozen fruits were crushed using a knife mill (model A327R1, Moulinex, Madrid, Spain) with a small amount of water to obtain juice; this process was facilitated by the previous freezing of the fruits, and later centrifuging them (K24OR refrigerated centrifuge, Centurion, West Sussex, UK) to separate the husks and small seeds. The supernatant obtained was frozen, lyophilized, reduced to a fine, dried powder (35 mesh), and stored for further analysis.

Stability of the Aqueous Extract

The stability of the aqueous extract was assessed taking into consideration the anthocyanin profile of these fruits and the respective percentage of degradation over four days. The anthocyanin phenolic profile was previously described by other authors [17]; nonetheless, a new identification was performed for this sample following the procedure previously described by Bastos et al. (2015) [22]. Two anthocyanins were identified, cyanidin-3-O-sambubioside and cyanidin-3-O-glucoside, and, as such, the stability of the aqueous extract was assessed by measuring the percentage of anthocyanin loss by high-performance liquid chromatography coupled with a diode array detector (HPLC-DAD) using 520 nm as preferred wavelength.
The dried lyophilized extract of S. nigra was re-hydrated with water (100%) at a final concentration of 5 mg/mL and stored for 96 h at room temperature (~25 °C, mimicking the conditions under which the animals would be supplemented with these extracts, described below) and protected from light (to avoid the maximum degradation of the extracts). An aliquot of the samples was collected at 24, 72, and 96 h, injected into the chromatography system, and quantified using a 7-level calibration curve of the most similar standard compound available in the laboratory, cyanidin-3-O-glucoside (y = 105,078x − 12,437; R2: 0.9993; LOD = 0.28 µg/mL; LOQ = 0.84 µg/mL). The results were expressed as the percentage of anthocyanin loss (%).

2.2. Experimental Design

The University of Trás-os-Montes and Alto Douro Ethics Committee (approval no. 10/2013) and the Portuguese Veterinary Authorities (approval no. 0421/000/000/2014) approved this study. The national law (Decree-Law 113/2013) and European Directive 2010/63/EU on the protection of animals used in scientific research were both followed in all animal procedures.

Animals

As this is a preliminary study, to best apply the 3Rs for animal experiments (replacement, reduction, and refinement) and obtain enough data, we estimated the minimum number of animals required using a power analysis. Twenty-four FVB/n 8-week-old female mice (Mus musculus), obtained from a colony at University of Trás-os-Montes and Alto Douro’s animal facility, were randomly divided into four different groups (n = 6/group) using a computer-generated randomization sequence.
The control group drank tap water, while EE12, EE24, and EE48 were supplemented with increasing concentrations of a S. nigra extract, 12 mg/mL, 24 mg/mL, and 48 mg/mL, respectively, dissolved in normal tap water and changed every 2–3 days due to the compounds’ stabilities. Drink and food (Diet Standard 4RF21 Certificate, 4RF21, Mucedola, Milan, Italy) were available ad libitum for every group. Under controlled conditions of temperature (19 ± 2 °C), 12 h:12 h light–dark cycle, and relative humidity (50 ± 10%), the animals were housed in separate open polycarbonate cages with bedding made of corn cob and provided with environmental enrichment.
Weekly, several murinometric parameters were evaluated, such as the body weight and temperature of each animal, as well as drink and food consumption by each group. The same researcher examined humane endpoints on a weekly basis using a previously published grading sheet [23]. Animals with a cumulative score of four or higher at any point in time were designated for euthanasia.
Twenty-nine days after the beginning of the experiment, the animals were sacrificed by intraperitoneal administration of ketamine (Imalgene 1000, Vetoquinol, Barcarena, Portugal) and xylazine (Rompun® 2% Bayer, Healthcare S.A., Kiel, Germany), followed by cardiac puncture and exsanguination according to the Federation of European Laboratory Animal Science Associations guidelines [24].
Complete necropsies were performed, and organs were collected and weighed on a precision balance (KERN® PLT 6200-2A, Dias de Sousa S.A., Alcochete, Portugal). These organs were fixed by immersion in 10% neutral-buffered formalin. Liver and kidney samples were stored at −80 °C for further analysis of oxidative stress.

2.3. Hematological Analysis

2.3.1. Microhematocrit

Microhematocrit values were obtained after the blood samples were centrifuged at 4500× g for 5 min (PrO-Vet, Centurion Scientific Limited, Chichester, UK) in capillary tubes, and the column of red blood cells was measured with a ruler.

2.3.2. Serum Biochemistry

Blood collected into lithium–heparin tubes (FL MEDICAL, Torreglia, Italy) was centrifuged at 1400× g (Heraeus Labofuge™ 400R, Thermo Fischer Scientific, Waltham, MA, USA) for 15 min, at 4 °C, and plasma was stored at −80 °C. Using an autoanalyzer (Prestige 24i, Cormay PZ, Warsaw, Poland), spectrophotometric methods were used to measure the concentrations of creatinine, urea, aspartate aminotransferase (ASAT), and alanine aminotransferase (ALAT).

2.4. Comet Assay

Mononuclear blood cells were used to perform the alkaline (pH > 13) comet assay, following the methods of Collins (2004) [25], and a system of twelve gels per slide, as adopted by Marques et al. (2021) [26], was used to increase the yield. Six slides precoated with normal-melting-point agarose were used for each treatment, with three replicates per animal. One set was used to run the assay with the repair enzyme, formamidopyrimidine DNA glycosylase (Fpg), and the other was used to conduct the assay without it. In order to precisely identify oxidative damage to DNA, particularly 8-oxoguanines and other changed purines, Fpg converted oxidized purines into DNA single-strand breaks. Peripheral blood was diluted in ice-cold phosphate-buffered saline (PBS), and this cell suspension was combined with 1% low-melting-point agarose. Twelve drops were placed on each of the twelve precoated slides, and the slides were refrigerated for solidification. The samples were then incubated in a lysis solution (2.5 M NaCl, 0.1 M EDTA, 10 mM Tris, 1% Triton X-100, pH 10) and rinsed (40 mM HEPES, 0.1 M KCl, 0.5 mM EDTA, 0.2 mg/mL bovine serum albumin, pH 8.0).
The slides with and without Fpg treatment were then incubated for 30 min at 4 °C in an alkaline electrophoresis solution (0.3 M NaOH and 1 mM EDTA, pH > 13) and electrophoresed for 30 min at 25 V and 300 mA. The cells were then neutralized with PBS, followed by distilled water, and then dehydrated in 70% and absolute ethanol. A fluorescent microscope at 400× magnification (Olympus BX41, Olympus America Inc., Hauppauge, NY, USA) was used to view the DNA stained with 4,6-diamidino-2-phenylindole (DAPI).
The comets were then classified visually based on a five-class scale of severity (class 0, no damage, and class 4, highest damage) [25]. Three hundred nucleoids were classified per animal (100 per mini gel) and, using the following formula, the total score was expressed as a genetic damage index (GDI) with a range of 0 to 400 arbitrary units:
G D I = %   nucleoids   class   i × i
where I represents the number of each class.
Untreated GDI values were subtracted from the Fpg incubation scores (GDIFpg) to calculate the net enzyme-sensitive sites (NSSFpg).

2.5. Hepatic and Renal Histology

The organs underwent routine processing for paraffin embedding, including sectioning. Hematoxylin and eosin (H&E)-stained tissue sections that were 3 μm thick were examined under a light microscope for histological analysis.
Liver histological analysis included the recording of the presence or absence of hydropic changes, their distribution, as well as the presence of inflammatory cells. Kidneys were examined to assess the presence of inflammatory lesions.

2.6. Hepatic and Renal Oxidative Stress

Samples of the liver and kidney were homogenized in a cold buffer solution (0.32 mM sucrose, 20 mM HEPES, 1 mM MgCl2, and 0.5 mM phenylmethylsulfonylfluoride (PMSF), pH 7.4) and the supernatants were collected following centrifugation and analyzed as previously described [27]. Briefly, excitation at 485 nm and emission at 530 nm were employed to assess the production of reactive oxygen species (ROS) using the probe 2′,7′-dichlorofluorescein diacetate (DCFH-DA). The inhibition of nitroblue tetazolium (NBT) reduction was used to assess the superoxide dismutase (SOD) activity at 560 nm. The H2O2 decay at 240 nm was used to evaluate the catalase (CAT) activity. The oxidation of NADPH to NADP+ at 340 nm was employed to assess the glutathione peroxidase (GPx) activity. The reaction of glutathione’s thiol group with 1-chloro-2,4-dinitrobenzene (CDNB) was used to determine the activity of glutathione S-transferase (GST) at 340 nm. Derivatization with ortho-phthalaldehyde at 320 nm and 420 nm (excitation and emission, respectively) was used to assess the quantities of reducing glutathione (GSH) and oxidized glutathione (GSSG). The ratio of GSH to GSSG was used to calculate the oxidative stress index (OSI). Malondialdehyde (MDA), a lipid peroxidation (LPO) biomarker, was measured at 530 nm using a thiobarbituric acid (TBA)-based technique.

2.7. Statistical Analysis

Statistical analysis was performed using IBM SPSS version 20 (Statistical Package for the Social Sciences, Chicago, IL, USA). The Shapiro–Wilk test was used to ensure that the data followed a normal distribution. A statistical one-way ANOVA was conducted, followed by the Bonferroni’s multiple-comparison test. For histological analysis, the Chi-square test was performed. For oxidative stress analysis, statistical analyses were performed using one-way ANOVA followed by Tukey’s multiple-comparison test or the Kruskal–Wallis test followed by Dunn’s test. At p ≤ 0.05 (*), p ≤ 0.01 (**), p ≤ 0.001 (***), or p < 0.0001 (****), data were deemed statistically significant.

3. Results

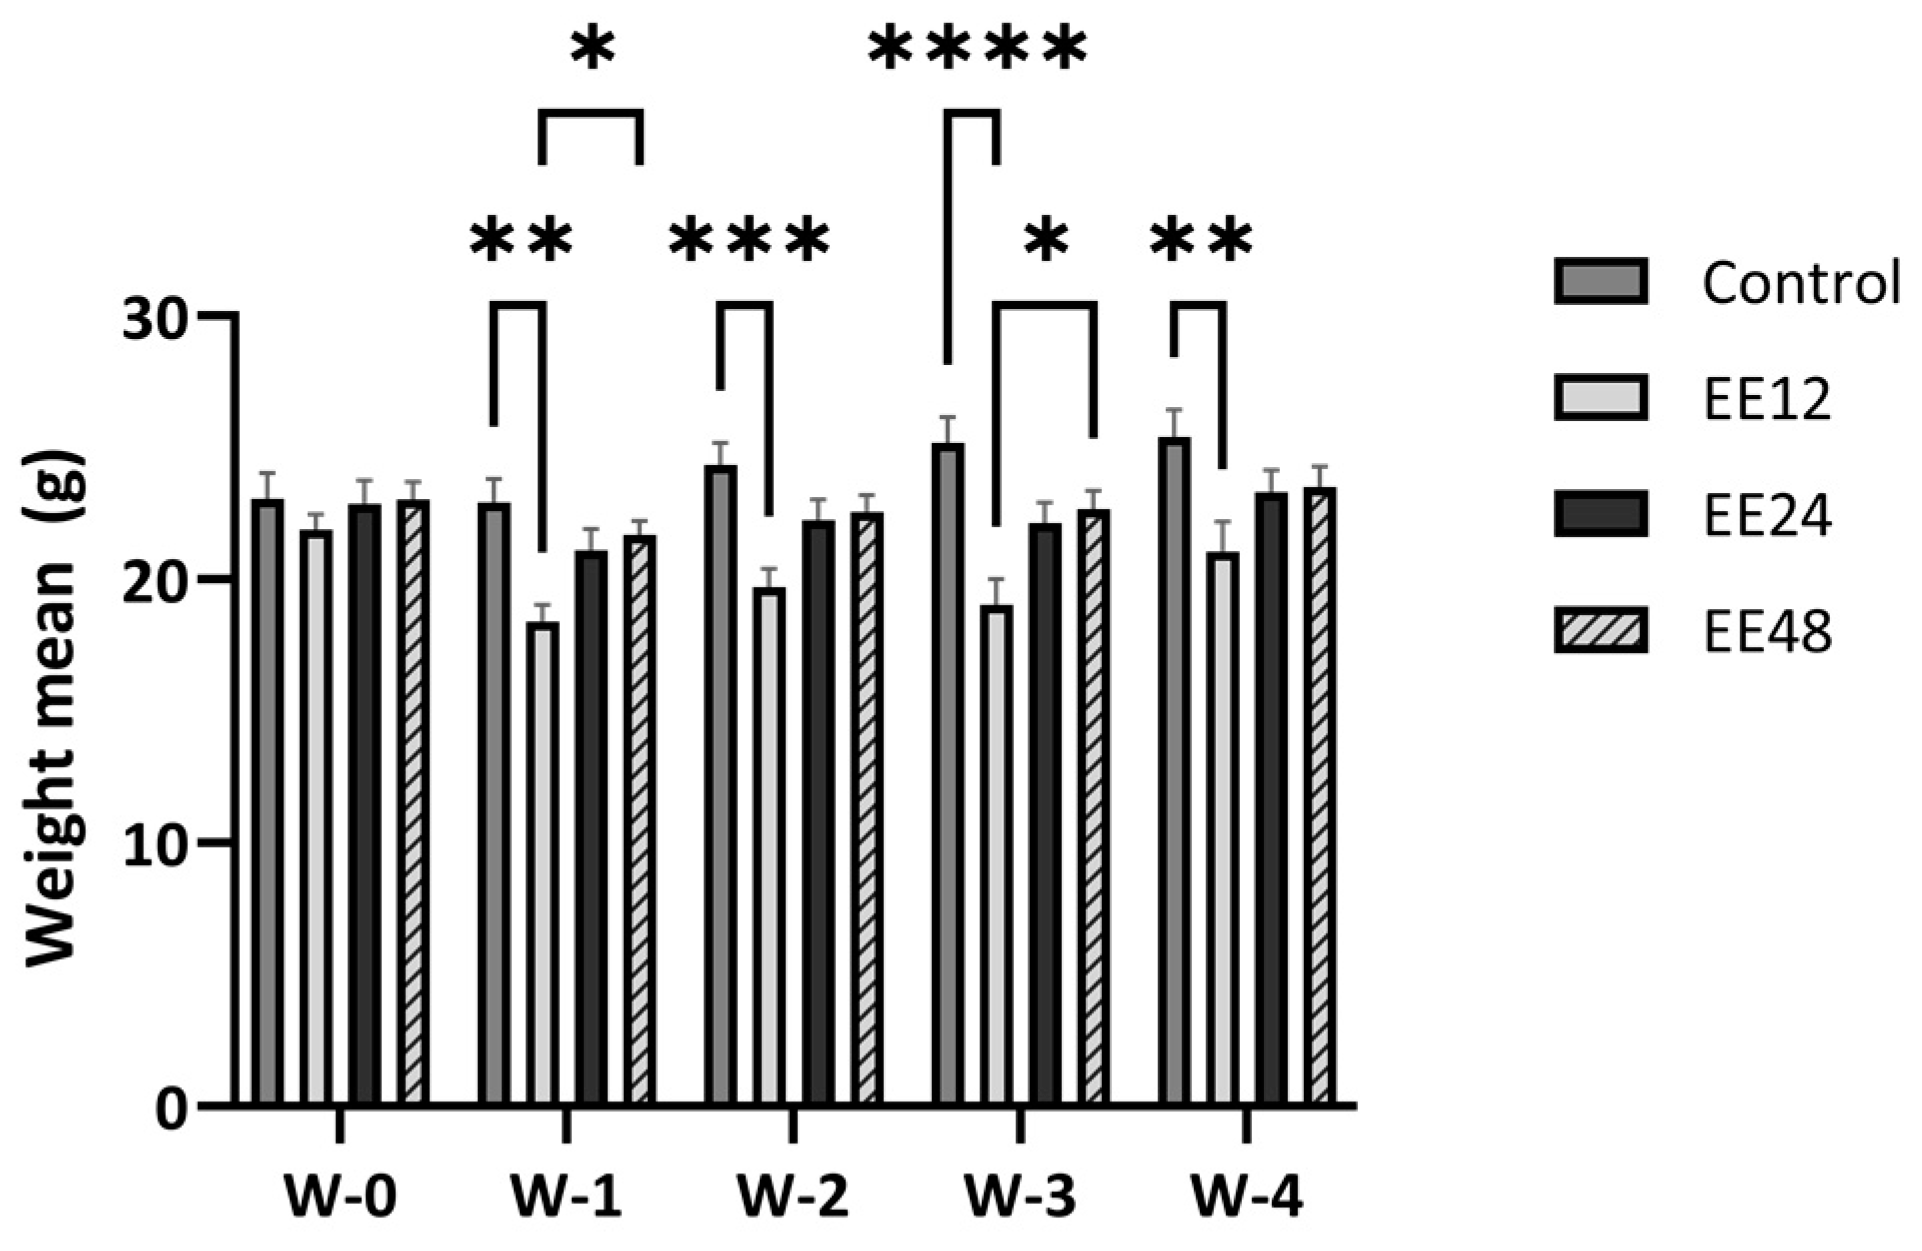
3.1. General Findings

The anthocyanin extract stability was assessed by HPLC-DAD (data not shown), revealing a maximum percentage of anthocyanin loss of 41.7% after 96 h of storage. In the first 48 and 72 h, the anthocyanin losses were 4.2 and 23.1%, respectively. Given these results, replacement of the supplementation water enriched with the anthocyanin-enriched extract occurred every two to three days during the experimental trial.
The animals in this study were monitored daily, and there were no phenotypic and/or behavioral changes in the mice in this study, as well as no deaths during the experiment. The aforementioned humane endpoint table was used to assess animal well-being, with no animal achieving the required score for euthanasia or any other notable behavioral change.
This study lasted for 29 days, during which almost no alteration was observed regarding the murinometric parameters evaluated. However, animals from EE12 (p = 0.012) lost a significant amount of body weight when compared with the control group (in weeks 1–4) and EE48 (in weeks 1 and 3), whereas animals from EE24 and EE48 did not show any significant differences when compared with the control group (Figure 2).
Regarding food and drink intake, all of the groups had relatively similar average daily food and drink intake values (Table 1).
The relative organ weight of the heart (Table 2) was significantly higher in EE12 compared with the control (p = 0.011), EE24 (p = 0.02), and EE48 (p = 0.01). Additionally, the left kidney’s relative organ weight was significantly higher in the control than EE12 (p = 0.013) and EE24 (p = 0.013).

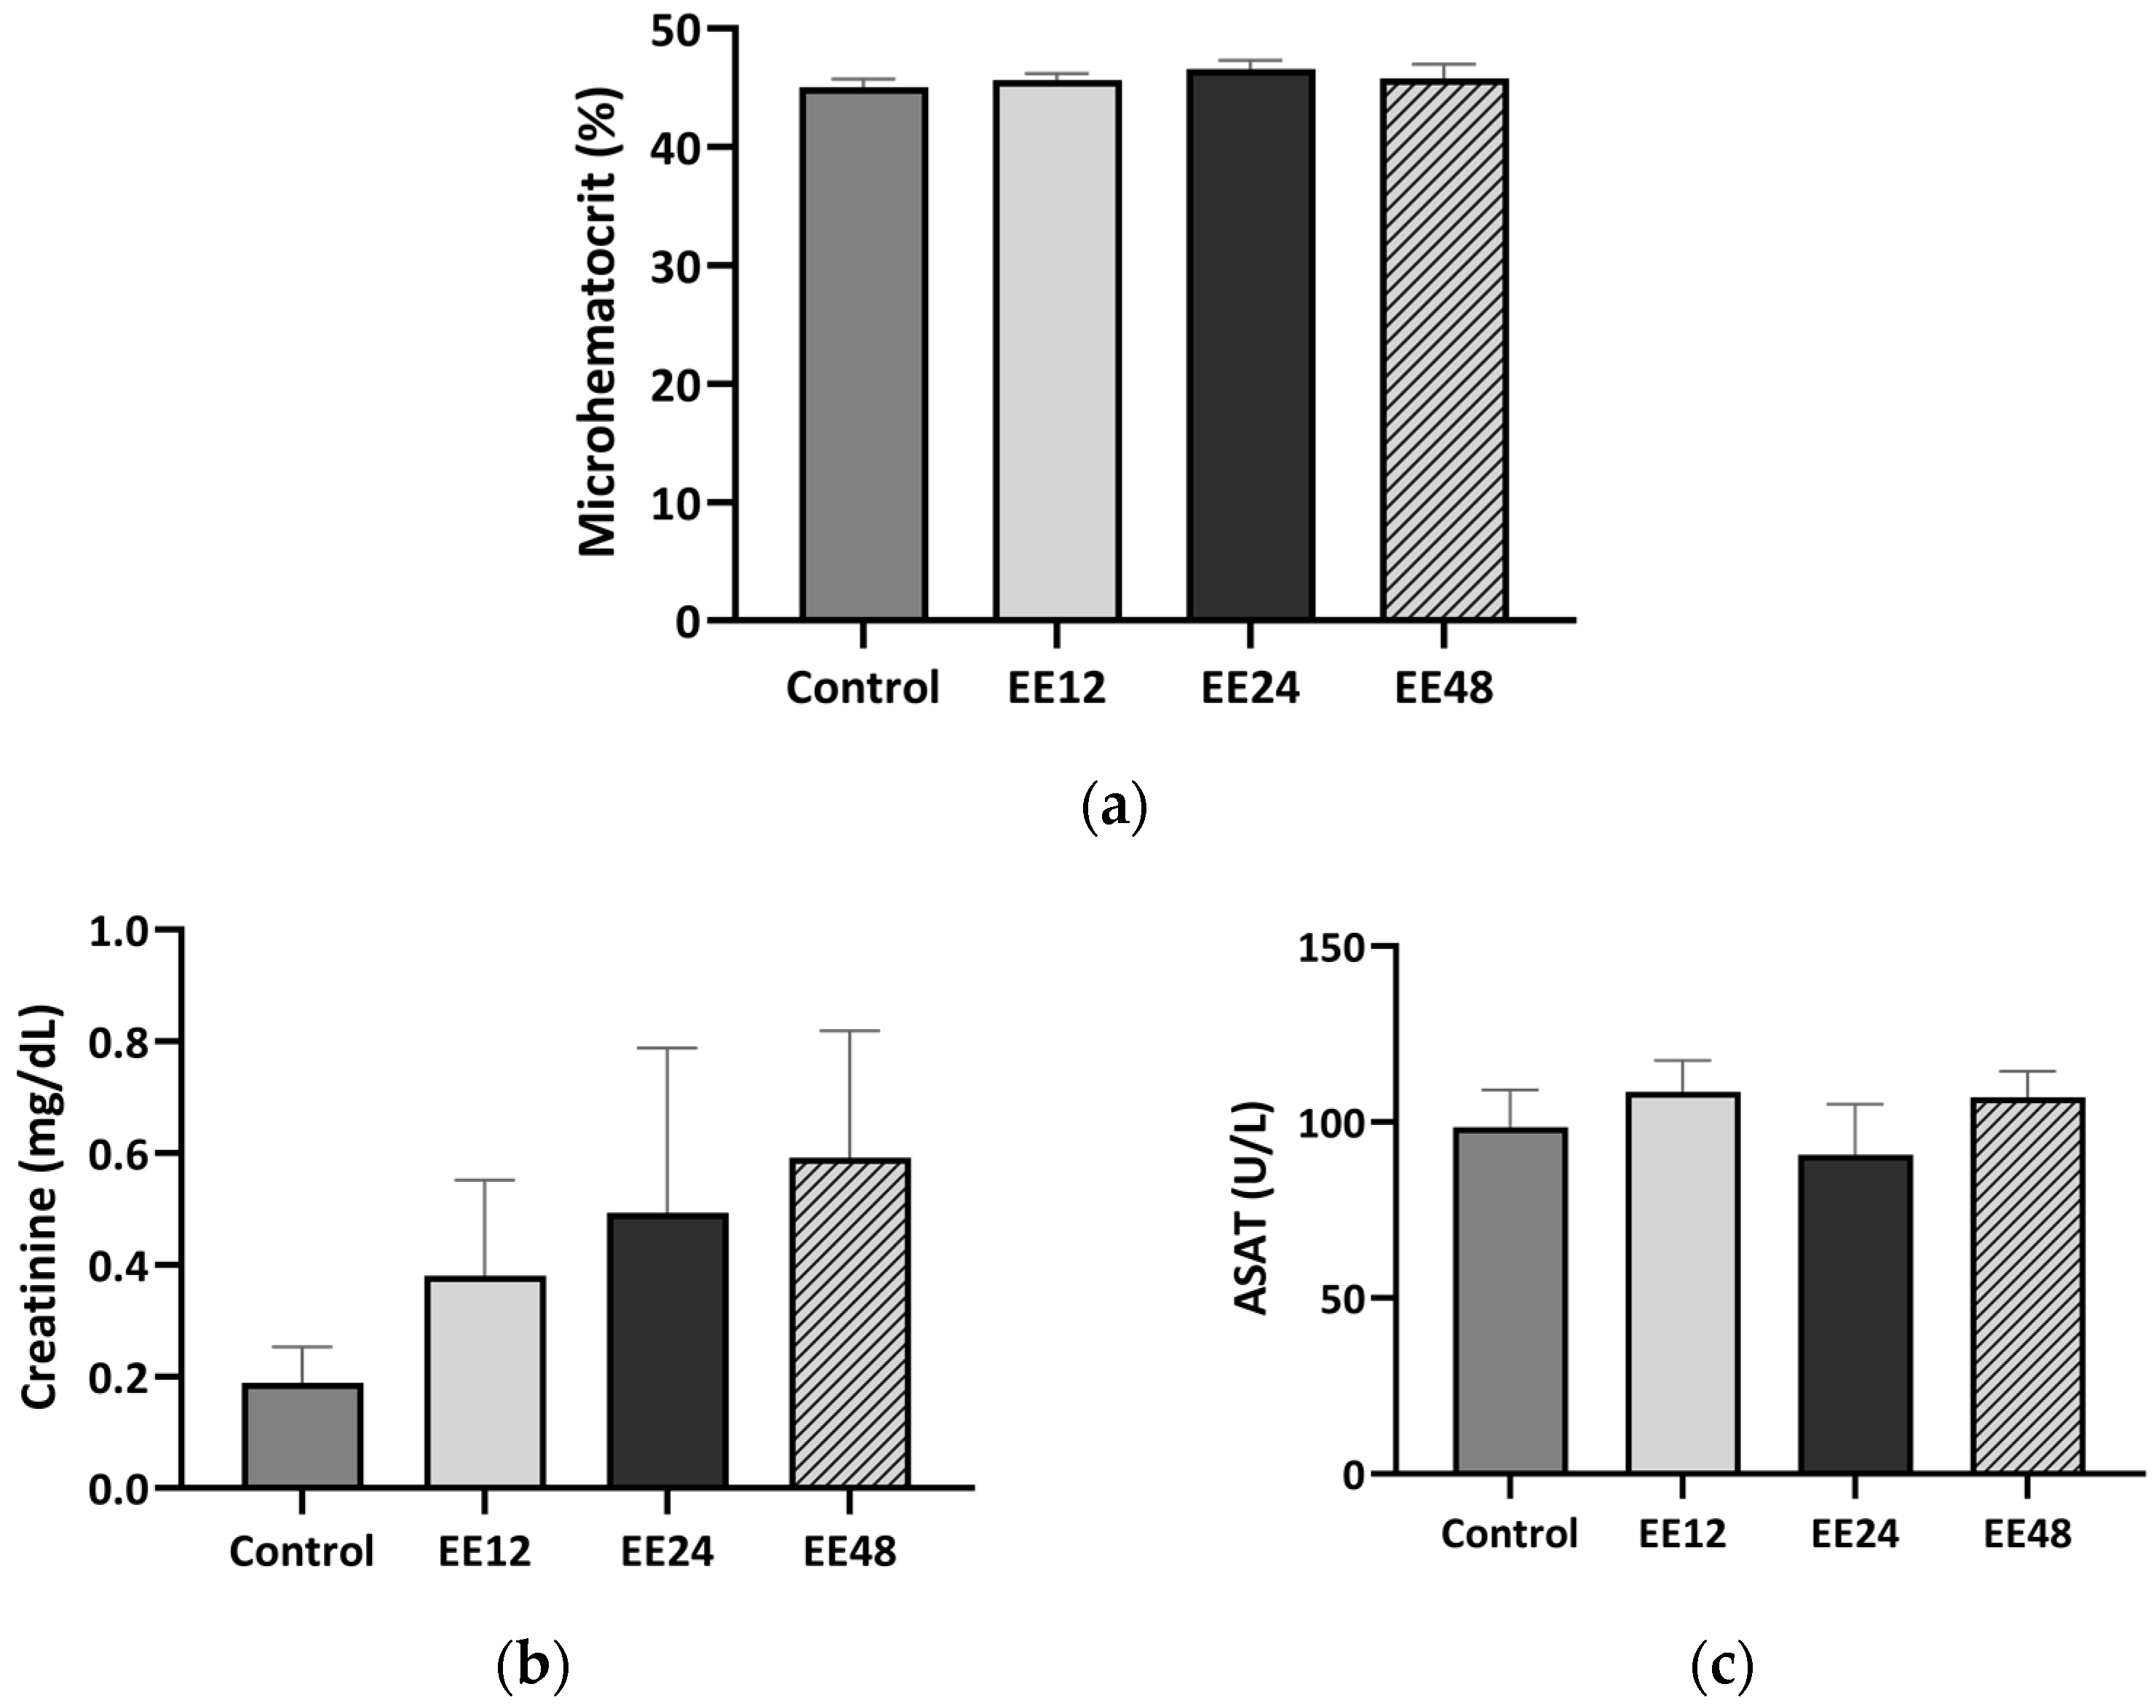
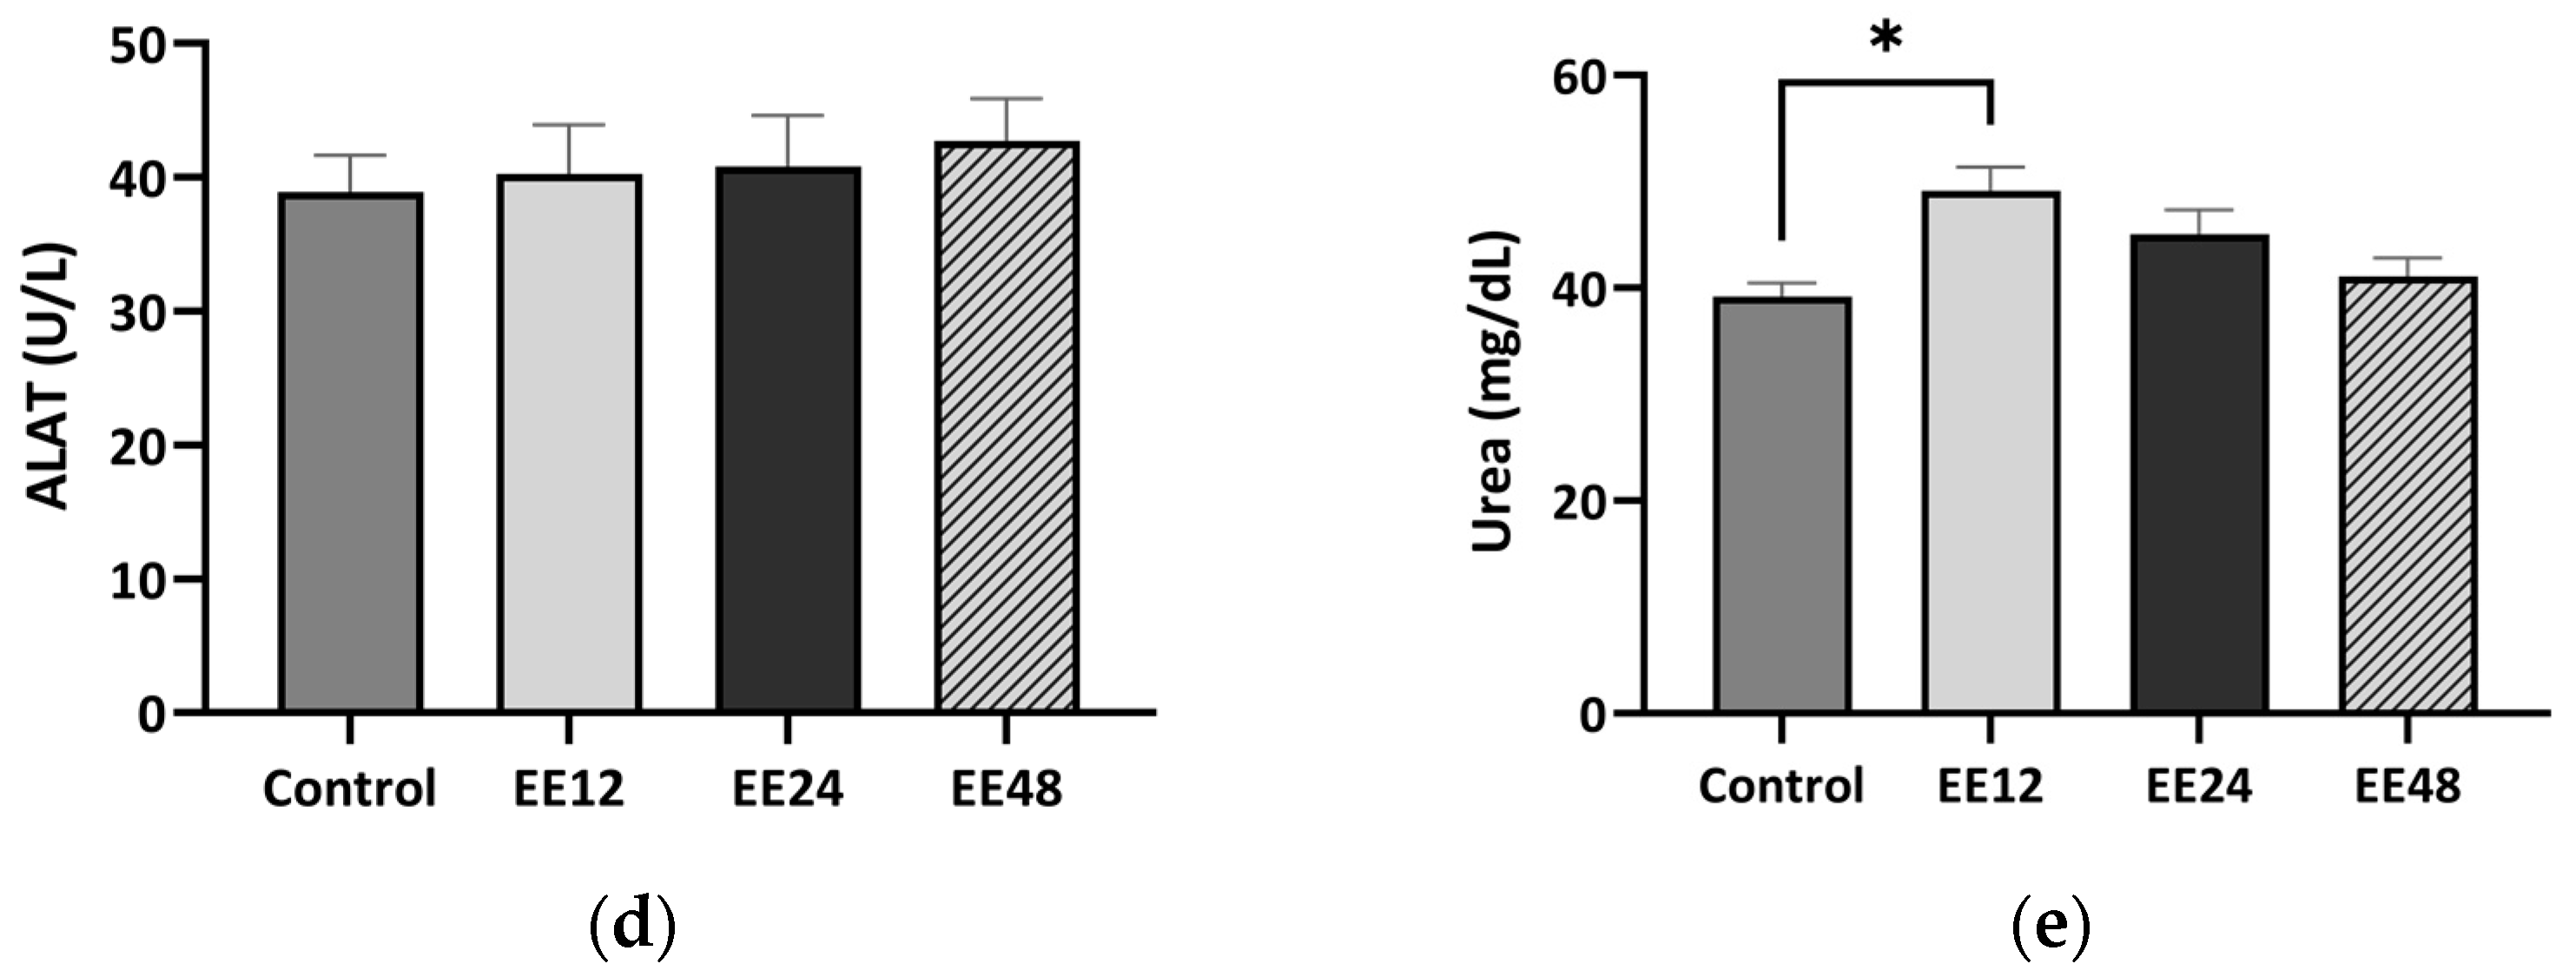
3.2. Haematological Analysis

The microhematocrit values per animal group are shown in Figure 3a (Supplementary Table S1), which were not significantly different between the experimental groups. Regarding the serum biochemical parameters (Figure 3c–e), there were no significant differences between the groups, except for the urea values (Figure 3e) in the control group and EE12 (p = 0.011).

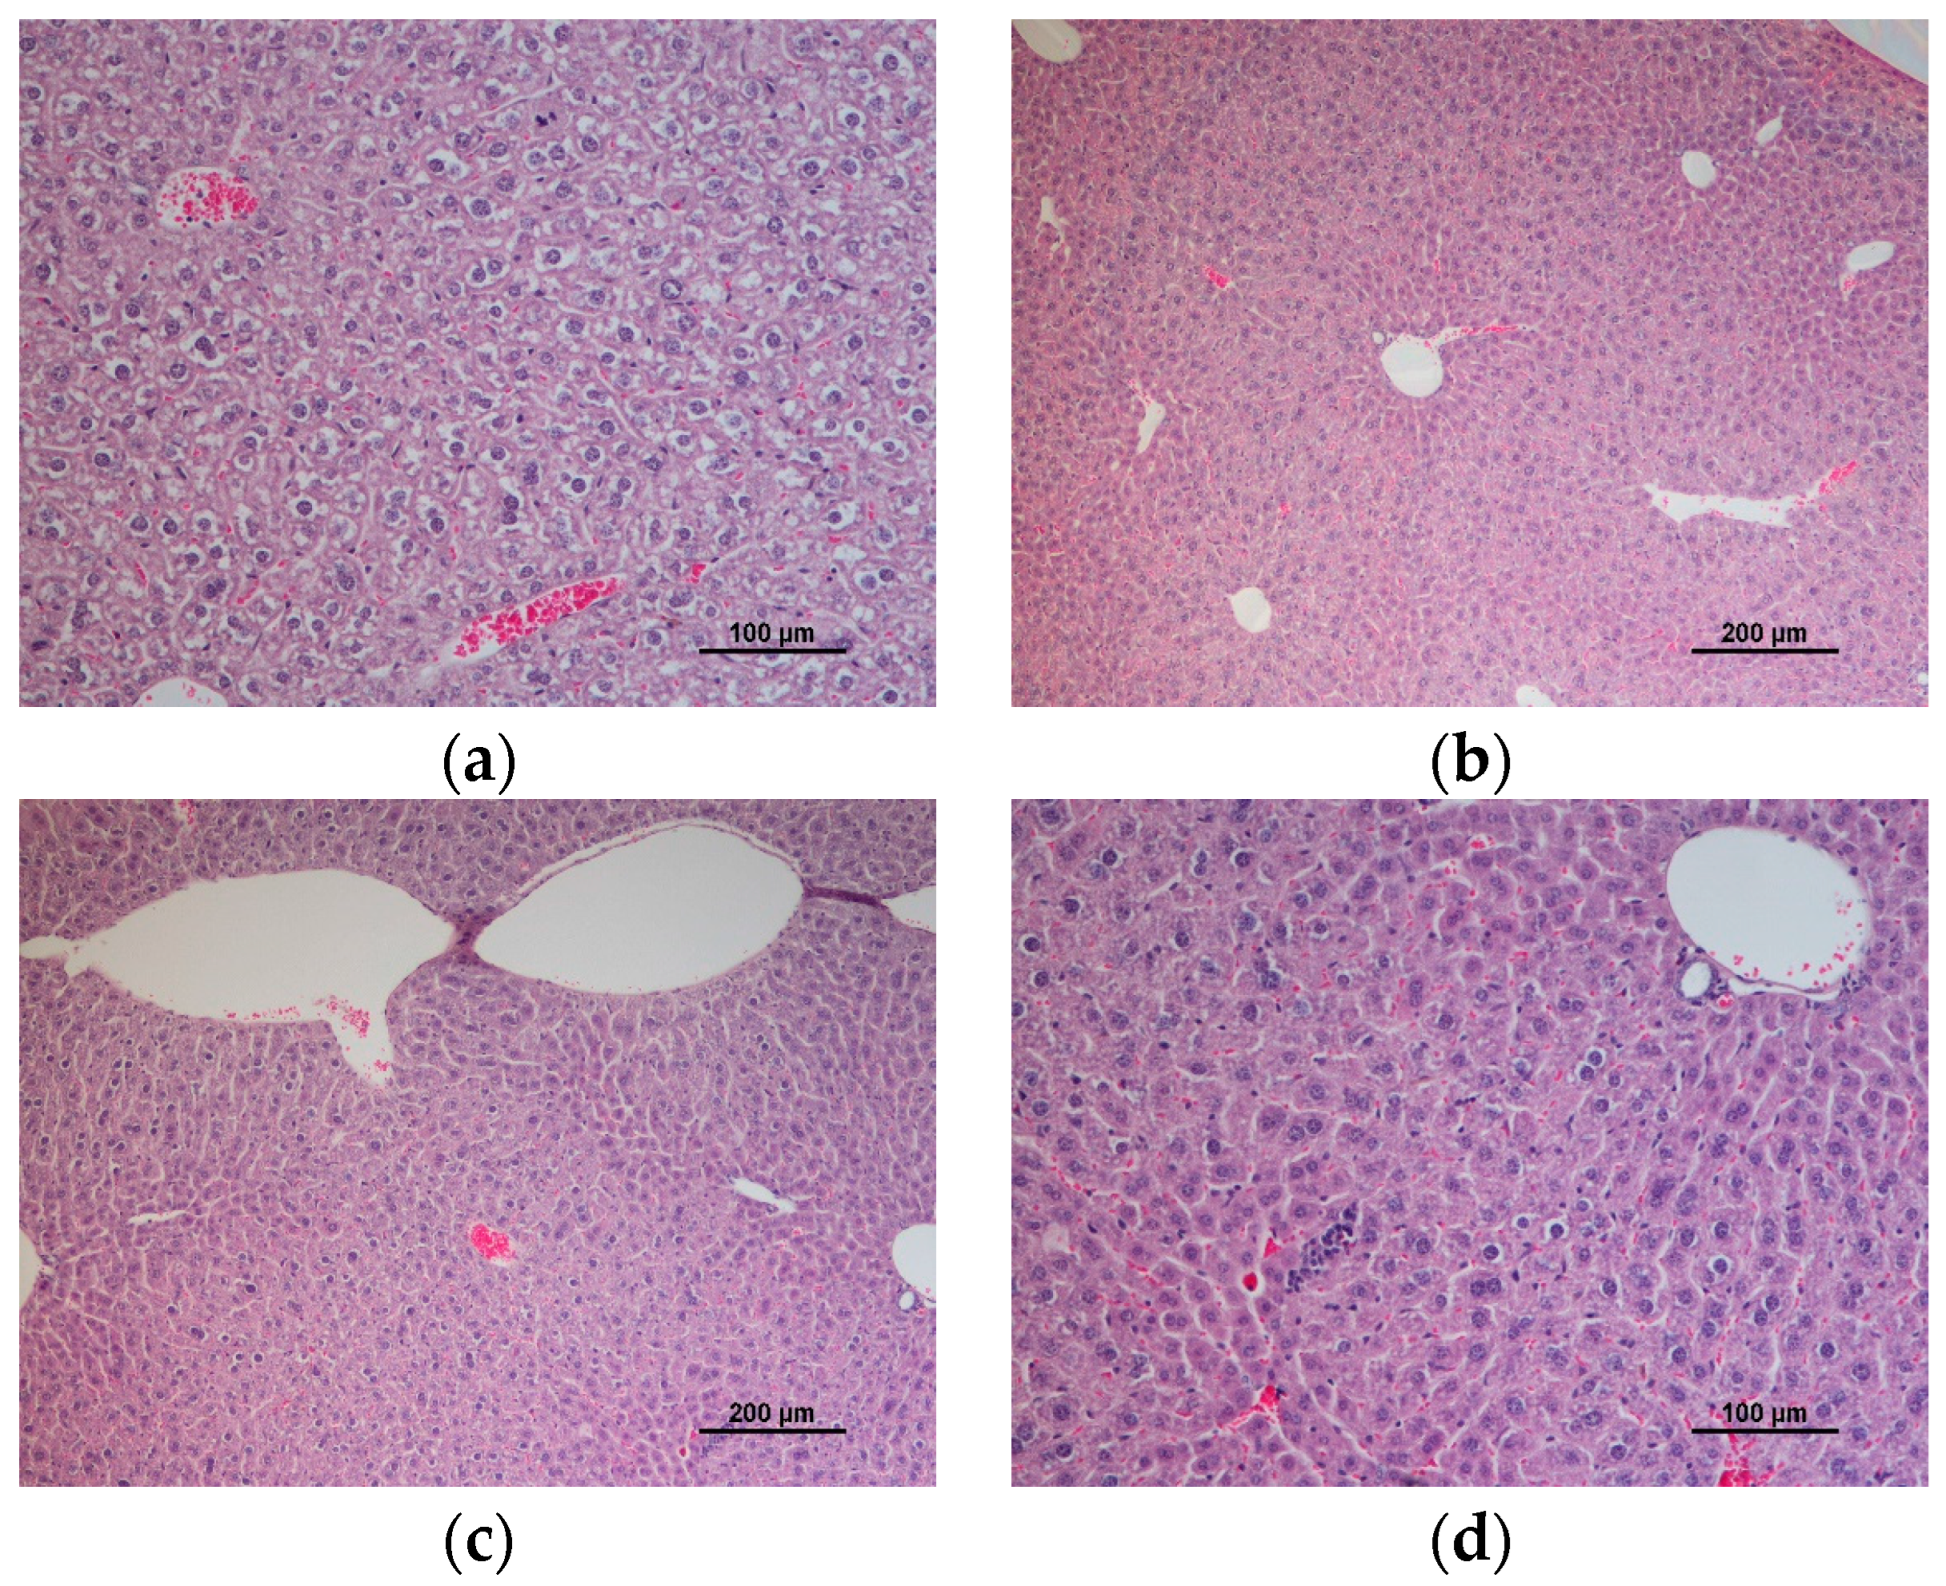
3.3. Hepatic and Renal Histology
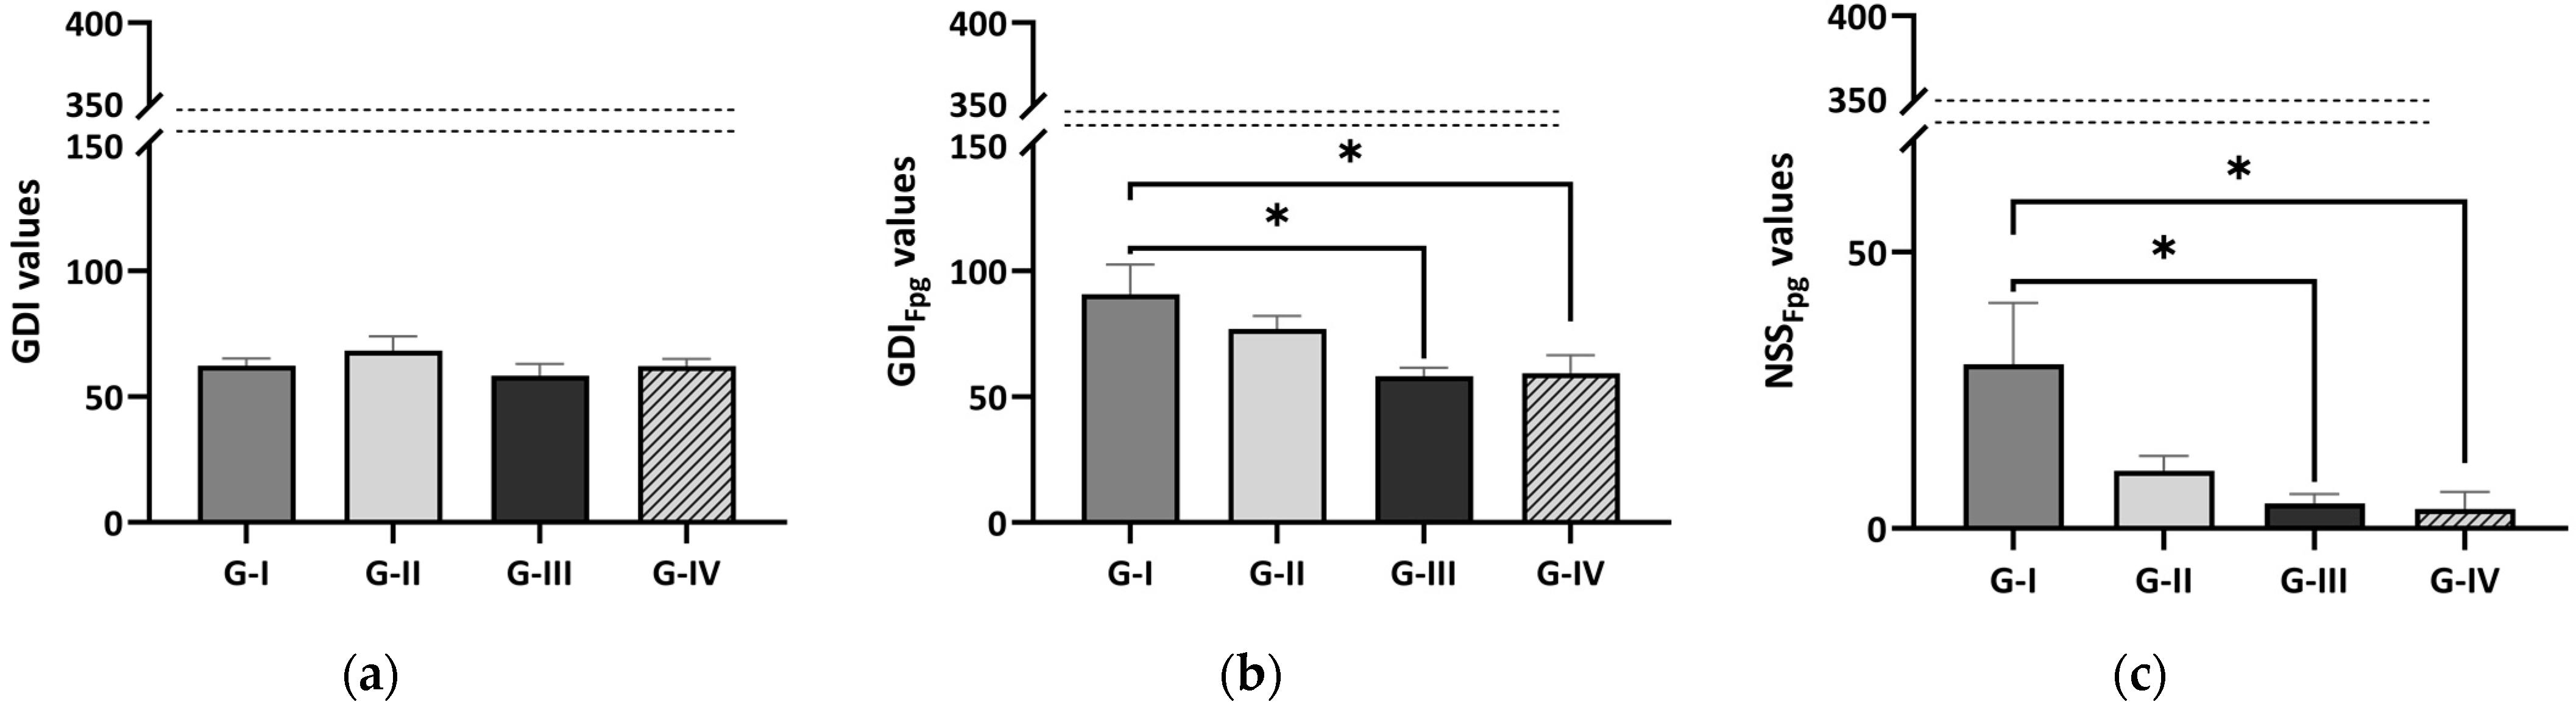
A significant difference between the control group and EE12 was seen in the liver’s histology (p = 0.036), with the control group’s histology displaying overall hydropic changes (Table 3). When compared with the other groups, the control mice showed a generalized distribution of these changes (p = 0.006), while the other groups showed hydropic changes at the centrilobular zone. With at least one animal in each group displaying chronic focal hepatitis, liver inflammation was also evaluated; the findings did not statistically differ between groups. Except for one instance of chronic interstitial nephritis in EE24, no histological alterations were seen in the experimental animals (Figure 4).

3.4. Comet Assay

The parameters evaluated with the comet assay (GDI, GDIFpg, and NSSFpg) were measured in peripheral blood mononuclear cells (Figure 5). Regarding the GDI values, there were no statistically significant differences between the experimental groups. However, the GDIFpg values were significantly greater in the control group than EE24 (p = 0.037) and EE48 (p = 0.047). Regarding NSSFpg, the value in the control group was also significantly higher compared with those in EE24 (p = 0.043) and EE48 (p = 0.033).

3.5. Liver and Kidney Oxidative Stress

The liver and kidney oxidative stress analysis (Table 4) showed significant differences in the antioxidant enzymes SOD and CAT. The liver SOD activity increased in the EE48 group in comparison with the control and EE12 groups (p < 0.01). In the opposite direction, liver CAT activity decreased in the EE48 group in comparison with the control group (p < 0.01). Concerning kidney oxidative parameters, the only significant differences observed between groups were the increased activity of SOD in the EE48 group in comparison with the control (p < 0.01).

4. Discussion

A previous study evaluated the extract’s cytotoxicity in five different cell lines: human breast adenocarcinoma (MCF-7), human non-small lung carcinoma (NCI-H460), human cervical carcinoma (HeLa), human hepatocellular carcinoma (HepG2), and porcine liver cells (PLP2) [17]. These authors reported that the extract had significant capacity to inhibit the proliferation of these tumor cell lines, while low concentrations of EE had no effect on the normal cell line. After cell studies, a correct approach is to switch to an experimental animal protocol. To the best of our knowledge, this is the first study to assess the safety of different concentrations of an elderberry colorant extract in mice. Although the FVB/n strain is normally used for genetic and transgenic experiments, wild-type FVB/n mice have also been employed in metabolic and toxicology studies [28,29,30,31].
Animals supplemented with EE had considerably lower mean body weight values, particularly EE12, which was significantly inferior to the control group. In vitro assays have revealed that the primary components of this extract have an anti-obesity activity [32]. In a before-and-after clinical trial, Chrubasik et al. (2008) reported that a combination of S. nigra and Asparagus officinalis was significantly effective in lowering the mean body weight and blood pressure while improving the participants’ physical and emotional well-being and quality of life [33]. The same occurrence appeared to happen to the EE-supplemented animals, especially at the lowest dose. Given that these animals consumed identical amounts of food and that the humane endpoint analysis revealed no changes in behavior associated with toxicity, the inclusion of anthocyanins in their diet appeared to influence their body weight gain. Another study discovered that dietary supplementation with purified mulberry (Morus australis Poir) anthocyanins suppressed body weight gain in high-fat-diet-fed C57BL/6 mice by reducing the epididymal fat weight and adipocyte size [34]. A future study should explore this extract’s effect on adipose tissue and how it can affect body weight gain. Food consumption was standard compared with other studies developed by our group with the same diet [27,30]. The mice’s initial reactions to the extract were not very positive, but, over time, the overall average consumption by the supplemented groups became similar to that by the control group. As this particularly occurred for the group supplemented with the highest concentration of EE, this difference may be due to the extract’s flavor, which might have been too strong or overbearing. The values regarding drink intake were, however, consistent with those of the aforementioned works.
The relative weight of the heart in EE12 significantly increased when compared with the other groups, probably due to residual blood after cardiac puncture. Regarding hydropic changes, animals from the control group exhibited a generalized distribution of these changes. According to the literature, these represent acute and reversible, sublethal cell injuries [35], and in the absence of biochemical evidence of liver damage in these animals, the changes observed in the control group were not regarded as having pathological significance. In the present study, the animals supplemented with EE at the lowest concentration showed minor and zone-restricted hydropic changes when compared with the control group. This effect may be related to the anthocyanins present in the EE, because, in chronic ethanol-induced liver injury in male Wistar rats and CCl4-induced Kunming mice [36,37], these substances have been reported to have an hepatoprotective effect.
Our results regarding the renal function markers, particularly the urea levels in EE12, which were considerably greater than those of the control group, were in conflict with the literature, as anthocyanins are usually associated with a reduction in urea levels [38,39]. Our values are, however, in accordance with those of other studies regarding this parameter in FVB/n mice and do not raise suspicion of renal impairment [28,40]. As an increase in urea levels can occur in settings unrelated to renal disease, creatinine is seen as a more reliable marker of renal function [41]. Although there was a slight increase in creatinine levels, there was no statistically significant difference between the groups. The left kidney’s relative weight was significantly higher in EE12 and EE24 compared with that of the control group, but, as no kidney lesions were registered by the histological analysis, this increase in the relative weight and biochemical parameters may be unrelated to renal function impairment. It is also crucial to note that the EE supplementation was chronic, i.e., the animals consumed the extract in their drinking water for a lengthy period of time without interruption, which may not occur if it is incorporated into a product that is not the consumer’s whole diet.
As mentioned above, elderberry extract supplementation did not cause hepatotoxicity at the biochemical level, as the hepatic transaminases (ALAT and ASAT) showed no significant statistical differences. These results are corroborated by another study that used an extract of S. nigra [42].
In terms of the comet assay results, our findings show that this extract did not appear to be genotoxic. Interestingly, when the Fpg enzyme was added, there were statistically significant differences between the control group and the two highest concentrations. As such, this leads us to believe that this extract, although not antigenotoxic, may protect against oxidative DNA damage. These findings are consistent with the literature [13,43], which indicates that S. nigra has antimutagenic and antigenotoxic effects, mainly due to its antioxidant properties. Olejnik et al. (2016) reported that, in a non-transformed, non-tumorigenic colon cell line (NCM460), an S. nigra extract was capable of protecting these cells against oxidative stress’s detrimental effects to DNA [44]. In another study, Ferreira-Santos and collaborators employed an S. nigra aqueous extract for treating human colon carcinoma cells (RKO) and observed that this extract at concentrations of 200 and 400 µg/mL neither protected RKO cells from the oxidative activity induced by H2O2 nor triggered DNA repair activity [45]. The authors only observed a reduction in DNA damage of around 20% when the cells were treated for 24 h. The same was not observed when the cells were treated for 48 h; however, the results were not shown to be significantly different from those of the control group at both times [45]. Our findings regarding NSSFpg indicate that this extract, particularly the two highest concentrations (EE24 and EE48), had a strong capacity for repairing oxidative DNA damage.
The group treated with a higher concentration of extract (EE48) also exhibited increased SOD activity, the primary intrinsic antioxidant enzyme, in the hepatic and renal tissue, confirming the stimulation of antioxidant activity previously reported for anthocyanins in the extracts of S. nigra [46,47]. However, CAT activity decreased in the same group only at the hepatic level. This discrepancy in activities recorded for SOD and CAT has been previously reported between tissues for the effect of anthocyanins [48] and in the same tissue attributed to different forms of modulation [49] that need further studies to understand the antioxidant mechanisms of these compounds. Moreover, the remaining parameters of oxidative stress did not vary significantly, which confirms the safety of the use of this extract at the tested doses.
Although synthetic food colorants are frequently used in the food industry, consuming them continuously could be toxic and have several side effects [50]. For this reason, natural origin colorants have gradually taken their place, adding potential health benefits as well [51]. Given their numerous reported medicinal properties, including antioxidant activity and anti-carcinogenic and anti-inflammatory properties, these natural dyes, particularly anthocyanins, have a significant potential to replace synthetic colorants in the food industry [52].

5. Conclusions

As a result of the decreased liver lesions and the potent defense against oxidative DNA damage, our research shows that this anthocyanin-rich elderberry extract has a favorable toxicological profile. The two highest concentrations (EE24 and EE48) appeared to perform exactly as intended, which was to create a natural colorant that had no negative effects on the health of individuals who consumed it and might even have some positive effects. In the future, further research may be needed to confirm our findings.

Supplementary Materials

The following supporting information can be downloaded at: https://www.mdpi.com/article/10.3390/app122311928/s1, Table S1. Hematological parameters evaluated (mean ± SE).

Author Contributions

Methodology and writing—original draft: T.A. and T.F.; Conceptualization: T.A., T.F., R.M.G.d.C., M.M.S.M.B., R.M., L.B. and P.A.O.; Supervision and project administration: R.M.G.d.C., M.M.S.M.B., R.M., L.B. and P.A.O.; Sample preparation and HPLC: M.I.D. and L.B.; Conducted the experiments with live animals and preparation of the drink: T.A., T.F. and R.S.-R.; Participated in the sacrifice of the animals: T.A., T.F., R.S.-R., M.J.P. and P.A.O.; Participated in biochemical analysis and microhematocrit: M.J.N. and M.J.P.; Performed the comet assay: T.A., J.F. and I.G.; Prepared the histology samples, histological analysis, and image capture: T.A., T.F. and M.d.L.P.; Participated in oxidative stress: F.T., D.F., L.F. and C.V.; Statistical analysis: T.A., T.F., R.M.G.d.C., M.M.S.M.B., R.M. and P.A.O. All authors have read and agreed to the published version of the manuscript.

Funding

This work is supported by National Funds by FCT—Portuguese Foundation for Science and Technology—under the project UIDB/04033/2020. This work was supported by the projects UIDB/CVT/00772/2020+UIDP/CVT/00772/2020 and LA/P/0059/2020 funded by the Portuguese Foundation for Science and Technology (FCT). Thanks are due to CESAM and FCT/MCTES for the financial support to UIDP/50017/2020+UIDB/50017/2020 through national funds. The authors acknowledge the financial support from the Portuguese Foundation for Science and Technology (FCT) through a Doctoral Grant (2020.04789.BD, Tiago Ferreira). The authors are grateful to the Foundation for Science and Technology (FCT, Portugal) for financial support through national funds FCT/MCTES (PIDDAC) to CIMO (UIDB/00690/2020 and UIDP/00690/2020) and SusTEC (LA/P/0007/2021); and L. Barros and M.I. Dias thank FCT, P.I., through the institutional scientific employment program contract, for their contracts (CEEC Institutional). This work was supported by LA/P/0045/2020 (ALiCE), UIDB/00511/2020 and UIDP/00511/2020 (LEPABE), funded by nationals funds through FCT/MCTES (PIDDAC); 2SMART (NORTE-01-0145-FEDER-000054), supported by Norte Portugal Regional Operational Programme (NORTE 2020), under the PORTUGAL 2020 Partnership Agreement, through the European Regional Development Fund (ERDF).

Institutional Review Board Statement

This study was conducted according to the guidelines of the Portuguese Competent Authority (“DGAV—Direção Geral de Alimentação e Veterinária”, approval no. 10/2013) and reviewed by an Ethics Review Body (“ORBEA—Órgão Responsável pelo Bem-Estar e Ética Animal” under reference 0421/000/000/2014).

Informed Consent Statement

Not applicable.

Data Availability Statement

Data is contained within the article.

Conflicts of Interest

The authors declare no conflict of interest.

References

  1. Schmitzer, V.; Veberic, R.; Stampar, F. European Elderberry (Sambucus Nigra L.) and American Elderberry (Sambucus Canadensis L.): Botanical, Chemical and Health Properties of Flowers, Berries and Their Products. In Berries: Properties, Consumption and Nutrition; Nova Biomedical: Waltham, MA, USA, 2012; pp. 127–148. [Google Scholar]
  2. Salvador, Â.C.; Silvestre, A.J.D.; Rocha, M.S. Sambucus Nigra L.: A Potential Source of Healthpromoting Components. Front. Nat. Prod. Chem. 2016, 2, 343–392. [Google Scholar]
  3. Młynarczyk, K.; Walkowiak-Tomczak, D.; Łysiak, G.P. Bioactive Properties of Sambucus Nigra L. as a Functional Ingredient for Food and Pharmaceutical Industry. J. Funct. Foods 2018, 40, 377–390. [Google Scholar] [CrossRef] [PubMed]
  4. Ağalar, H.G. Elderberry (Sambucus Nigra L.). In Nonvitamin and Nonmineral Nutritional Supplements; Elsevier: Amsterdam, The Netherlands, 2019; pp. 211–215. ISBN 978-0-12-812491-8. [Google Scholar]
  5. Atkinson, M.D.; Atkinson, E. Sambucus Nigra L. J. Ecol. 2002, 90, 895–923. [Google Scholar] [CrossRef]
  6. Veberic, R.; Jakopic, J.; Stampar, F.; Schmitzer, V. European Elderberry (Sambucus Nigra L.) Rich in Sugars, Organic Acids, Anthocyanins and Selected Polyphenols. Food Chem. 2009, 114, 511–515. [Google Scholar] [CrossRef]
  7. Sidor, A.; Gramza-Michałowska, A. Advanced Research on the Antioxidant and Health Benefit of Elderberry (Sambucus Nigra) in Food—A Review. J. Funct. Foods 2015, 18, 941–958. [Google Scholar] [CrossRef]
  8. Charlebois, D.; Byers, P.L.; Finn, C.E.; Thomas, A.L. Elderberry: Botany, Horticulture, Potential. Horticultural Reviews; Janick, J., Ed.; John Wiley & Sons, Inc.: Hoboken, NJ, USA, 2010; Volume 37, pp. 213–280. ISBN 978-0-470-54367-2. [Google Scholar]
  9. Barros, L.; Dueñas, M.; Carvalho, A.M.; Ferreira, I.C.F.R.; Santos-Buelga, C. Characterization of Phenolic Compounds in Flowers of Wild Medicinal Plants from Northeastern Portugal. Food Chem. Toxicol. 2012, 50, 1576–1582. [Google Scholar] [CrossRef] [Green Version]
  10. Vlachojannis, C.; Zimmermann, B.F.; Chrubasik-Hausmann, S. Quantification of Anthocyanins in Elderberry and Chokeberry Dietary Supplements. Phytother. Res. 2015, 29, 561–565. [Google Scholar] [CrossRef]
  11. Cejpek, K.; Maloušková, I.; Konečný, M.; Velíšek, J. Antioxidant Activity in Variously Prepared Elderberry Foods and Supplements. Czech J. Food Sci. 2009, 27, S45–S48. [Google Scholar] [CrossRef] [Green Version]
  12. Małgorzata, D.; Aleksandra, P.; Monika, T.; Ireneusz, K. A New Black Elderberry Dye Enriched in Antioxidants Designed for Healthy Sweets Production. Antioxidants 2019, 8, 257. [Google Scholar] [CrossRef] [Green Version]
  13. Ferreira, S.S.; Silva, A.M.; Nunes, F.M. Sambucus Nigra L. Fruits and Flowers: Chemical Composition and Related Bioactivities. Food Rev. Int. 2020, 38, 1–29. [Google Scholar] [CrossRef]
  14. Khoo, H.E.; Azlan, A.; Tang, S.T.; Lim, S.M. Anthocyanidins and Anthocyanins: Colored Pigments as Food, Pharmaceutical Ingredients, and the Potential Health Benefits. Food Nutr. Res. 2017, 61, 1361779. [Google Scholar] [CrossRef]
  15. Mateus, N.; de Freitas, V. Anthocyanins as Food Colorants. In Anthocyanins: Biosynthesis, Functions, and Applications; Winefield, C., Davies, K., Gould, K., Eds.; Springer: New York, NY, USA, 2009; pp. 284–304. ISBN 978-0-387-77335-3. [Google Scholar]
  16. Saxena, S.; Raja, A.S.M. Natural Dyes: Sources, Chemistry, Application and Sustainability Issues. In Roadmap to Sustainable Textiles and Clothing: Eco-Friendly Raw Materials, Technologies, and Processing Methods; Muthu, S.S., Ed.; Textile Science and Clothing Technology; Springer: Singapore, 2014; pp. 37–80. ISBN 978-981-287-065-0. [Google Scholar]
  17. Da Silva, R.F.R.; Barreira, J.C.M.; Heleno, S.A.; Barros, L.; Calhelha, R.C.; Ferreira, I.C.F.R. Anthocyanin Profile of Elderberry Juice: A Natural-Based Bioactive Colouring Ingredient with Potential Food Application. Molecules 2019, 24, 2359. [Google Scholar] [CrossRef] [PubMed] [Green Version]
  18. Ding, M.; Feng, R.; Wang, S.Y.; Bowman, L.; Lu, Y.; Qian, Y.; Castranova, V.; Jiang, B.-H.; Shi, X. Cyanidin-3-Glucoside, a Natural Product Derived from Blackberry, Exhibits Chemopreventive and Chemotherapeutic Activity. J. Biol. Chem. 2006, 281, 17359–17368. [Google Scholar] [CrossRef] [PubMed] [Green Version]
  19. Cho, E.; Chung, E.Y.; Jang, H.-Y.; Hong, O.-Y.; Chae, H.S.; Jeong, Y.-J.; Kim, S.-Y.; Kim, B.-S.; Yoo, D.J.; Kim, J.-S.; et al. Anti-Cancer Effect of Cyanidin-3-Glucoside from Mulberry via Caspase-3 Cleavage and DNA Fragmentation in Vitro and in Vivo. Anticancer Agents Med. Chem. 2017, 17. [Google Scholar] [CrossRef] [PubMed]
  20. Ma, X.; Ning, S. Cyanidin-3-glucoside Attenuates the Angiogenesis of Breast Cancer via Inhibiting STAT3/VEGF Pathway. Phytother. Res. 2019, 33, 81–89. [Google Scholar] [CrossRef] [PubMed] [Green Version]
  21. You, Y.; Han, X.; Guo, J.; Guo, Y.; Yin, M.; Liu, G.; Huang, W.; Zhan, J. Cyanidin-3-Glucoside Attenuates High-Fat and High-Fructose Diet-Induced Obesity by Promoting the Thermogenic Capacity of Brown Adipose Tissue. J. Funct. Foods 2018, 41, 62–71. [Google Scholar] [CrossRef]
  22. Bastos, C.; Barros, L.; Dueñas, M.; Calhelha, R.C.; Queiroz, M.J.R.P.; Santos-Buelga, C.; Ferreira, I.C.F.R. Chemical Characterisation and Bioactive Properties of Prunus Avium L.: The Widely Studied Fruits and the Unexplored Stems. Food Chem. 2015, 173, 1045–1053. [Google Scholar] [CrossRef] [PubMed] [Green Version]
  23. Oliveira, M.; Nascimento-Gonçalves, E.; Silva, J.; Oliveira, P.A.; Ferreira, R.; Antunes, L.; Arantes-Rodrigues, R.; Faustino-Rocha, A.I. Implementation of Human Endpoints in a Urinary Bladder Carcinogenesis Study in Rats. In Vivo 2017, 31. [Google Scholar] [CrossRef] [Green Version]
  24. Forbes, D.; Blom, H.J.M.; Kostomitsopoulos, N.; Moore, G.; Perretta, G. FELASA EUROGUIDE. On the Accomodation and Care of Animals Used for Experimental and Other Scientific Purposes; The Royal Society of Medicine Press Ltd.: London, UK, 2007; ISBN 978-1-85315-751-6. [Google Scholar]
  25. Collins, A.R. The Comet Assay for DNA Damage and Repair: Principles, Applications, and Limitations. Mol. Biotechnol. 2004, 26, 249–261. [Google Scholar] [CrossRef]
  26. Marques, A.; Ferreira, J.; Abreu, H.; Pereira, R.; Pinto, D.; Silva, A.; Gaivão, I.; Pacheco, M. Comparative Genoprotection Ability of Wild-Harvested vs. Aqua-Cultured Ulva Rigida Coupled with Phytochemical Profiling. Eur. J. Phycol. 2021, 56, 105–118. [Google Scholar] [CrossRef]
  27. Martins, T.; Oliveira, P.A.; Pires, M.J.; Neuparth, M.J.; Lanzarin, G.; Félix, L.; Venâncio, C.; Pinto, M.d.L.; Ferreira, J.; Gaivão, I.; et al. Effect of a Sub-Chronic Oral Exposure of Broccoli (Brassica Oleracea L. Var. Italica) By-Products Flour on the Physiological Parameters of FVB/N Mice: A Pilot Study. Foods 2022, 11, 120. [Google Scholar] [CrossRef]
  28. Ribeiro-Silva, C.M.; Faustino-Rocha, A.I.; Gil da Costa, R.M.; Medeiros, R.; Pires, M.J.; Gaivão, I.; Gama, A.; Neuparth, M.J.; Barbosa, J.V.; Peixoto, F.; et al. Pulegone and Eugenol Oral Supplementation in Laboratory Animals: Results from Acute and Chronic Studies. Biomedicines 2022, 10, 2595. [Google Scholar] [CrossRef] [PubMed]
  29. Martins, T.; Matos, A.F.; Soares, J.; Leite, R.; Pires, M.J.; Ferreira, T.; Medeiros-Fonseca, B.; Rosa, E.; Oliveira, P.A.; Antunes, L.M. Comparison of Gelatin Flavors for Oral Dosing of C57BL/6J and FVB/N Mice. J. Am. Assoc. Lab. Anim. Sci. 2022, 61, 89–95. [Google Scholar] [CrossRef] [PubMed]
  30. Rodrigues, P.; Ferreira, T.; Nascimento-Gonçalves, E.; Seixas, F.; Gil da Costa, R.M.; Martins, T.; Neuparth, M.J.; Pires, M.J.; Lanzarin, G.; Félix, L.; et al. Dietary Supplementation with Chestnut (Castanea Sativa) Reduces Abdominal Adiposity in FVB/n Mice: A Preliminary Study. Biomedicines 2020, 8, 75. [Google Scholar] [CrossRef] [PubMed] [Green Version]
  31. Sachse, B.; Meinl, W.; Glatt, H.; Monien, B.H. Ethanol and 4-Methylpyrazole Increase DNA Adduct Formation of Furfuryl Alcohol in FVB/N Wild-Type Mice and in Mice Expressing Human Sulfotransferases 1A1/1A2. Carcinogenesis 2016, 37, 314–319. [Google Scholar] [CrossRef] [PubMed] [Green Version]
  32. Porras-Mija, I.; Chirinos, R.; García-Ríos, D.; Aguilar-Galvez, A.; Huaman-Alvino, C.; Pedreschi, R.; Campos, D. Physico-Chemical Characterization, Metabolomic Profile and in Vitro Antioxidant, Antihypertensive, Antiobesity and Antidiabetic Properties of Andean Elderberry (Sambucus Nigra Subsp. Peruviana). J. Berry Res. 2020, 10, 193–208. [Google Scholar] [CrossRef]
  33. Chrubasik, C.; Maier, T.; Dawid, C.; Torda, T.; Schieber, A.; Hofmann, T.; Chrubasik, S. An Observational Study and Quantification of the Actives in a Supplement with Sambucus Nigra and Asparagus Officinalis Used for Weight Reduction. Phytother. Res. 2008, 22, 913–918. [Google Scholar] [CrossRef]
  34. Wu, T.; Qi, X.; Liu, Y.; Guo, J.; Zhu, R.; Chen, W.; Zheng, X.; Yu, T. Dietary Supplementation with Purified Mulberry (Morus Australis Poir) Anthocyanins Suppresses Body Weight Gain in High-Fat Diet Fed C57BL/6 Mice. Food Chem. 2013, 141, 482–487. [Google Scholar] [CrossRef] [PubMed]
  35. Wallig, M.A.; Janovitz, E.B. Chapter 4—Morphologic Manifestations of Toxic Cell Injury. In Haschek and Rousseaux’s Handbook of Toxicologic Pathology, 3rd ed.; Haschek, W.M., Rousseaux, C.G., Wallig, M.A., Eds.; Academic Press: Boston, MA, USA, 2013; pp. 77–105. ISBN 978-0-12-415759-0. [Google Scholar]
  36. Hou, Z.; Qin, P.; Ren, G. Effect of Anthocyanin-Rich Extract from Black Rice ( Oryza Sativa L. Japonica ) on Chronically Alcohol-Induced Liver Damage in Rats. J. Agric. Food Chem. 2010, 58, 3191–3196. [Google Scholar] [CrossRef]
  37. Wang, L.; Zhao, Y.; Zhou, Q.; Luo, C.-L.; Deng, A.-P.; Zhang, Z.-C.; Zhang, J.-L. Characterization and Hepatoprotective Activity of Anthocyanins from Purple Sweet Potato (Ipomoea Batatas L. Cultivar Eshu No. 8). J. Food Drug Anal. 2017, 25, 607–618. [Google Scholar] [CrossRef] [PubMed] [Green Version]
  38. Curtis, P.J.; Kroon, P.A.; Hollands, W.J.; Walls, R.; Jenkins, G.; Kay, C.D.; Cassidy, A. Cardiovascular Disease Risk Biomarkers and Liver and Kidney Function Are Not Altered in Postmenopausal Women after Ingesting an Elderberry Extract Rich in Anthocyanins for 12 Weeks. J. Nutr. 2009, 139, 2266–2271. [Google Scholar] [CrossRef]
  39. Salvador, Â.; Król, E.; Lemos, V.; Santos, S.; Bento, F.; Costa, C.; Almeida, A.; Szczepankiewicz, D.; Kulczyński, B.; Krejpcio, Z.; et al. Effect of Elderberry (Sambucus Nigra L.) Extract Supplementation in STZ-Induced Diabetic Rats Fed with a High-Fat Diet. Int. J. Mol. Sci. 2016, 18, 13. [Google Scholar] [CrossRef] [Green Version]
  40. Medeiros-Fonseca, B.; Mestre, V.F.; Colaço, B.; Pires, M.J.; Martins, T.; Gil da Costa, R.M.; Neuparth, M.J.; Medeiros, R.; Moutinho, M.S.S.; Dias, M.I.; et al. Laurus Nobilis (Laurel) Aqueous Leaf Extract’s Toxicological and Anti-Tumor Activities in HPV16-Transgenic Mice. Food Funct. 2018, 9, 4419–4428. [Google Scholar] [CrossRef] [Green Version]
  41. Gounden, V.; Bhatt, H.; Jialal, I. Renal Function Tests. In StatPearls; StatPearls Publishing: Treasure Island, FL, USA, 2021. [Google Scholar]
  42. Opris, R.; Tatomir, C.; Olteanu, D.; Moldovan, R.; Moldovan, B.; David, L.; Nagy, A.; Decea, N.; Kiss, M.L.; Filip, G.A. The Effect of Sambucus Nigra L. Extract and Phytosinthesized Gold Nanoparticles on Diabetic Rats. Colloids Surf. B Biointerfaces 2017, 150, 192–200. [Google Scholar] [CrossRef] [PubMed]
  43. Gonçalves, S.; Gaivão, I. Natural Ingredients Common in the Trás-Os-Montes Region (Portugal) for Use in the Cosmetic Industry: A Review about Chemical Composition and Antigenotoxic Properties. Molecules 2021, 26, 5255. [Google Scholar] [CrossRef] [PubMed]
  44. Olejnik, A.; Olkowicz, M.; Kowalska, K.; Rychlik, J.; Dembczyński, R.; Myszka, K.; Juzwa, W.; Białas, W.; Moyer, M.P. Gastrointestinal Digested Sambucus Nigra L. Fruit Extract Protects In Vitro Cultured Human Colon Cells against Oxidative Stress. Food Chem. 2016, 197, 648–657. [Google Scholar] [CrossRef] [PubMed]
  45. Ferreira-Santos, P.; Badim, H.; Salvador, Â.C.; Silvestre, A.J.D.; Santos, S.A.O.; Rocha, S.M.; Sousa, A.M.; Pereira, M.O.; Wilson, C.P.; Rocha, C.M.R.; et al. Chemical Characterization of Sambucus Nigra L. Flowers Aqueous Extract and Its Biological Implications. Biomolecules 2021, 11, 1222. [Google Scholar] [CrossRef]
  46. Domínguez, R.; Zhang, L.; Rocchetti, G.; Lucini, L.; Pateiro, M.; Munekata, P.E.S.; Lorenzo, J.M. Elderberry (Sambucus Nigra L.) as Potential Source of Antioxidants. Characterization, Optimization of Extraction Parameters and Bioactive Properties. Food Chem. 2020, 330, 127266. [Google Scholar] [CrossRef]
  47. Silva, P.; Ferreira, S.; Nunes, F.M. Elderberry (Sambucus Nigra L.) by-Products a Source of Anthocyanins and Antioxidant Polyphenols. Ind. Crop. Prod. 2017, 95, 227–234. [Google Scholar] [CrossRef]
  48. Hassimotto, N.M.; Lajolo, F.M. Antioxidant Status in Rats after Long-Term Intake of Anthocyanins and Ellagitannins from Blackberries: Anthocyanin Intake Improves Antioxidant Status in Rats. J. Sci. Food Agric. 2011, 91, 523–531. [Google Scholar] [CrossRef]
  49. Fernández-Pachón, M.S.; Berná, G.; Otaolaurruchi, E.; Troncoso, A.M.; Martín, F.; García-Parrilla, M.C. Changes in Antioxidant Endogenous Enzymes (Activity and Gene Expression Levels) after Repeated Red Wine Intake. J. Agric. Food Chem. 2009, 57, 6578–6583. [Google Scholar] [CrossRef]
  50. Amchova, P.; Kotolova, H.; Ruda-Kucerova, J. Health Safety Issues of Synthetic Food Colorants. Regul. Toxicol. Pharmacol. 2015, 73, 914–922. [Google Scholar] [CrossRef] [PubMed]
  51. Rodriguez-Amaya, D.B. Update on Natural Food Pigments—A Mini-Review on Carotenoids, Anthocyanins, and Betalains. Food Res. Int. 2019, 124, 200–205. [Google Scholar] [CrossRef] [PubMed]
  52. Roy, S.; Rhim, J.-W. Anthocyanin Food Colorant and Its Application in PH-Responsive Color Change Indicator Films. Crit. Rev. Food Sci. Nutr. 2021, 61, 2297–2325. [Google Scholar] [CrossRef] [PubMed]
Figure 1. Elderberry tree with the ripe fruit used to obtain the extract.
Applsci 12 11928 g001
Figure 2. Body weight (g) mean [±Standard error (SE)] throughout the experiment. Statistically significant differences are denoted by asterisks: * p < 0.05; ** p < 0.01; *** p < 0.001; **** p < 0.0001.
Applsci 12 11928 g002
Figure 3. Hematological parameters evaluated (mean ± SE): (a) microhematocrit, (b) creatinine, (c) ASAT (aspartate aminotransferase), (d) ALAT (alanine aminotransferase), and (e) urea. * Statistically significant differences (p < 0.05).
Applsci 12 11928 g003aApplsci 12 11928 g003b
Figure 4. Microscopic images (staining with H&E) of liver sections from the different groups under study. (a) Cellular tumefaction and hydropic changes in a mouse’s liver from the control group, 200×. (b) Hydropic changes observable only in the centrilobular region of an animal’s liver from EE12, 100×. (c) Cellular tumefaction and centrilobular hydropic changes in a mouse’s liver from EE24, 100×. (d) Cellular tumefaction, centrilobular hydropic changes, and multifocal inflammatory infiltration in an animal from EE48, 200×.
Applsci 12 11928 g004
Figure 5. Genetic damage index values (mean ± SE and expressed as arbitrary units) determined by the comet assay, corresponding to untreated slides (a) and slides treated (b) with Fpg and the resulting NSSFpg (c). * Statistically significant differences (p < 0.05).
Applsci 12 11928 g005
Table 1. Mean daily values of food and drink intake (g) per experimental group during the four weeks.
GroupsFood (g)Drink (mL)
InitialFinalInitialFinal
Control22.1423.0227.9029.33
EE1219.9925.2726.1226.60
EE2422.5121.5727.0928.12
EE4821.4721.6022.0827.12
Table 2. Mean (±SE) relative organ weights (organ weight (mg)/body weight of the animal (g)) from the experimental groups.
Group/OrganControlEE12EE24EE48
Thymus1.92 ± 0.1291.71 ± 0.2592.02 ± 0.1942.29 ± 0.255
Heart4.69 ± 0.148 a5.50 ± 0.186 b4.50 ± 0.147 a4.49 ± 0.156 a
Lungs6.92 ± 0.3497.37 ± 0.3147.13 ± 0.2577.78 ± 0.494
Spleen3.89 ± 0.2794.15 ± 0.2394.08 ± 0.2453.94 ± 0.344
Liver54.56 ± 1.29349.61 ± 0.90450.50 ± 2.28751.64 ± 2.171
Left Kidney6.00 ± 0.118 a6.99 ± 0.114 b6.95 ± 0.196 b6.51 ± 0.271 a,b
Right Kidney6.05 ± 0.3087.36 ± 0.1346.33 ± 0.4566.77 ± 0.330
Left Adrenal0.42 ± 0.1020.46 ± 0.1260.47 ± 0.0760.48 ± 0.101
Right Adrenal0.32 ± 0.0750.45 ± 0.0640.29 ± 0.0690.34 ± 0.060
Significant statistical differences between groups are indicated by different letters (a and b) (p < 0.05).
Table 3. Numbers of animals with hepatic and renal histological lesions per experimental group (%).
ControlEE12EE24EE48
Liver
Normal1/5 (20.0%) a5/6 (83.3%) b4/6 (66.7%) a,b4/6 (66.7%) a,b
Hydropic changes (HC)4/5 (80.0%) a1/6 (16.7%) b2/6 (33.3%) a,b2/6 (33.3%) a,b
 HC general4/5 (80.0%) a0/6 (0.0%) b0/6 (0.0%) b0/6 (0.0%) b
 HC centrilobular0/5 (0.0%)1/6 (16.7%)2/6 (33.3%)2/6 (33.3%)
Inflammation
 Absent3/5 (60.0%)5/6 (83.3%)3/6 (50.0%)3/6 (50.0%)
 Chronic focal hepatitis2/5 (40.0%)1/6 (16.7%)3/6 (50.0%)3/6 (50.0%)
Kidney
Normal5/5 (100.0%)6/6 (100.0%)5/6 (83.3%)6/6 (100.0%)
Chronic interstitial nephritis0/0 (0.0%)0/0 (0.0%)1/6 (16.7%)0/0 (0.0%)
Significant statistical differences between groups are indicated by different letters (a and b) (p < 0.05). HC: hydropic changes.
Table 4. Values of liver and kidney oxidative parameters. Data are expressed as mean ± standard deviation for parametric data distribution or median (25th–75th quartile) for non-parametric data.
Biochemical ParametersControlEE12EE24EE48
Liver
ROS1212 (1115–1623)1649 (1330–1729)2051 (1678–3046)1896 (1408–2308)
SOD 231 (169–271) a250 (239–255) a274 (233–322) a,b333 (290–382) b
CAT5956 (5047–6608) a4001 (3197–4482) a,b3906 (2960–5081) a,b2925 (2241–3612) b
GPx0.41 ± 0.20.46 ± 0.130.61 ± 0.190.3 ± 0.27
GST0.17 ± 0.010.18 ± 0.020.2 ± 0.030.19 ± 0.02
GSH14.58 ± 3.414.71 ± 1.8613.33 ± 5.5512.95 ± 2.68
GSSG270 ± 63.6272.9 ± 138.5339.7 ± 109318.8 ± 141.6
OSI0.05 ± 0.010.03 ± 0.020.04 ± 0.0040.04 ± 0.01
MDA205.1 ± 45.1189.8 ± 23.8207.0 ± 60.3176.0 ± 28.6
Kidney
ROS1460 ± 3231545 ± 3381429 ± 4431337 ± 322
SOD161 (139–188) a203 (178–271) a,b333 (267–432) a,b341 (305–374) b
CAT78.55 ± 7.1976.05 ± 10.1277.37 ± 12.2177.89 ± 13.25
GPx0.15 (0.13–0.22)0.08 (0.04–0.13)0.07 (0.05–0.1)0.08 (0.04–0.11)
GST0.058 ± 0.010.045 ± 0.0020.058 ± 0.010.045 ± 0.002
GSH148.1 ± 31.60131.4 ± 16.69146.2 ± 35.49132.8 ± 21.63
GSSG18.18 ± 13.0223.07 ± 14.4318.54 ± 8.7814.93 ± 6.07
OSI5.83 ± 1.928.01 ± 2.759.57 ± 5.1210.6 ± 5.21
MDA5600 ± 11894960 ± 7285501 ± 13785040 ± 864
Significant statistical differences between groups are indicated by different letters (a and b) (p < 0.05). ROS: reactive oxygen species; SOD: superoxide dismutase; CAT: catalase; GPx: glutathione peroxidase; GST: glutathione S-transferase; GSH: reducing glutathione; GSSG: oxidized glutathione (GSSG); OSI: oxidative stress index; MDA: malondialdehyde.
Publisher’s Note: MDPI stays neutral with regard to jurisdictional claims in published maps and institutional affiliations.

