
Effects of the Injector Spray Angle on Combustion and Emissions of a 4-Stroke Natural Gas-Diesel DF Marine Engine


Abstract
1. Introduction
2. Numerical Analysis
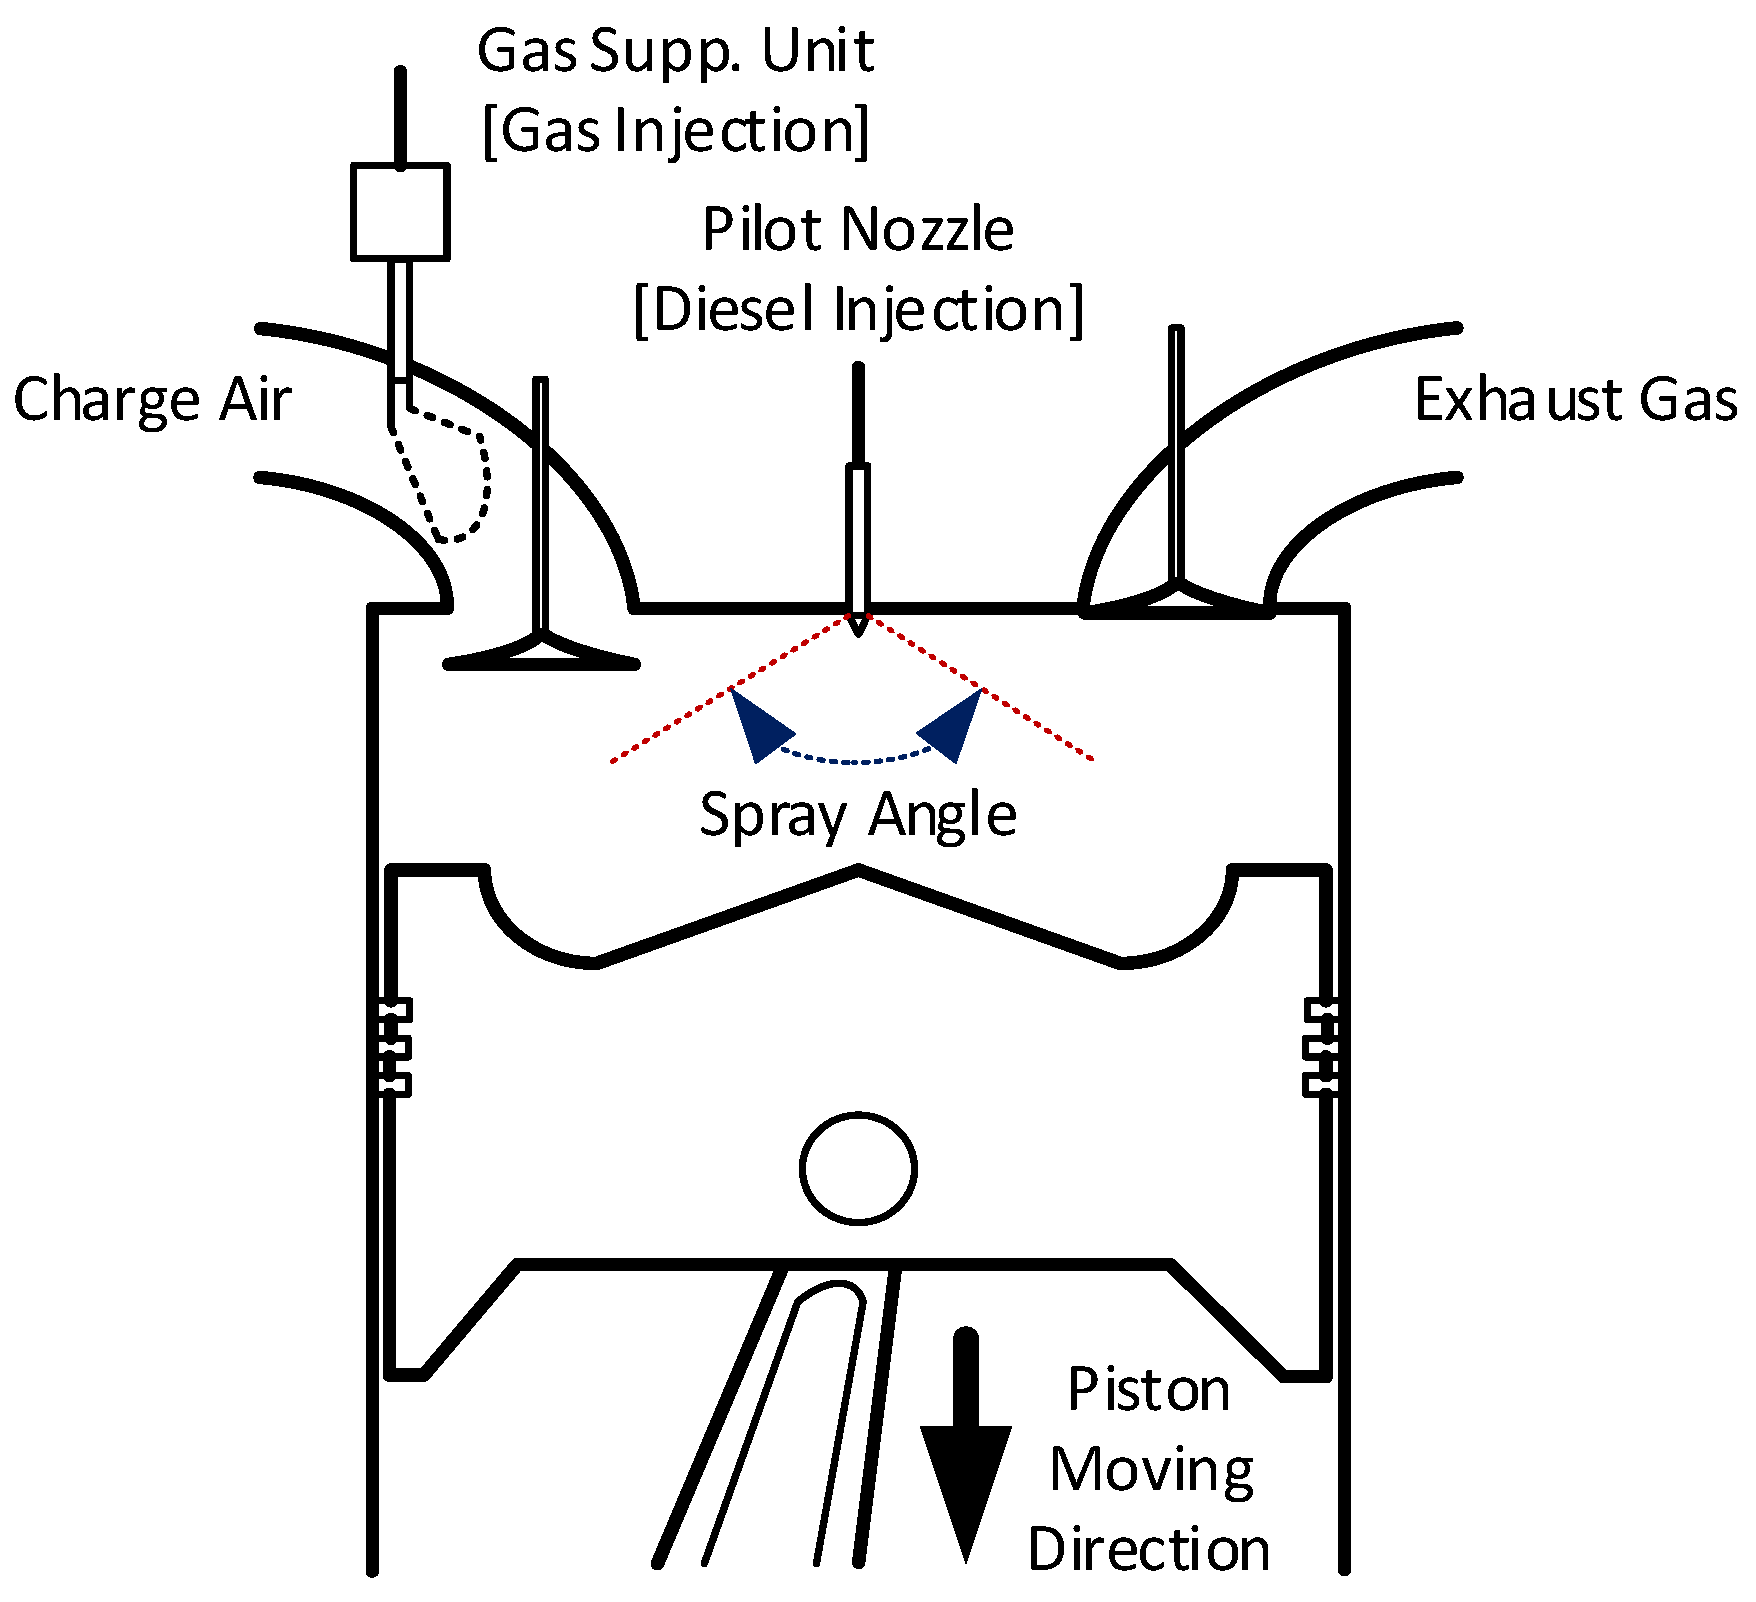
2.1. Specifications of the Researched Engine
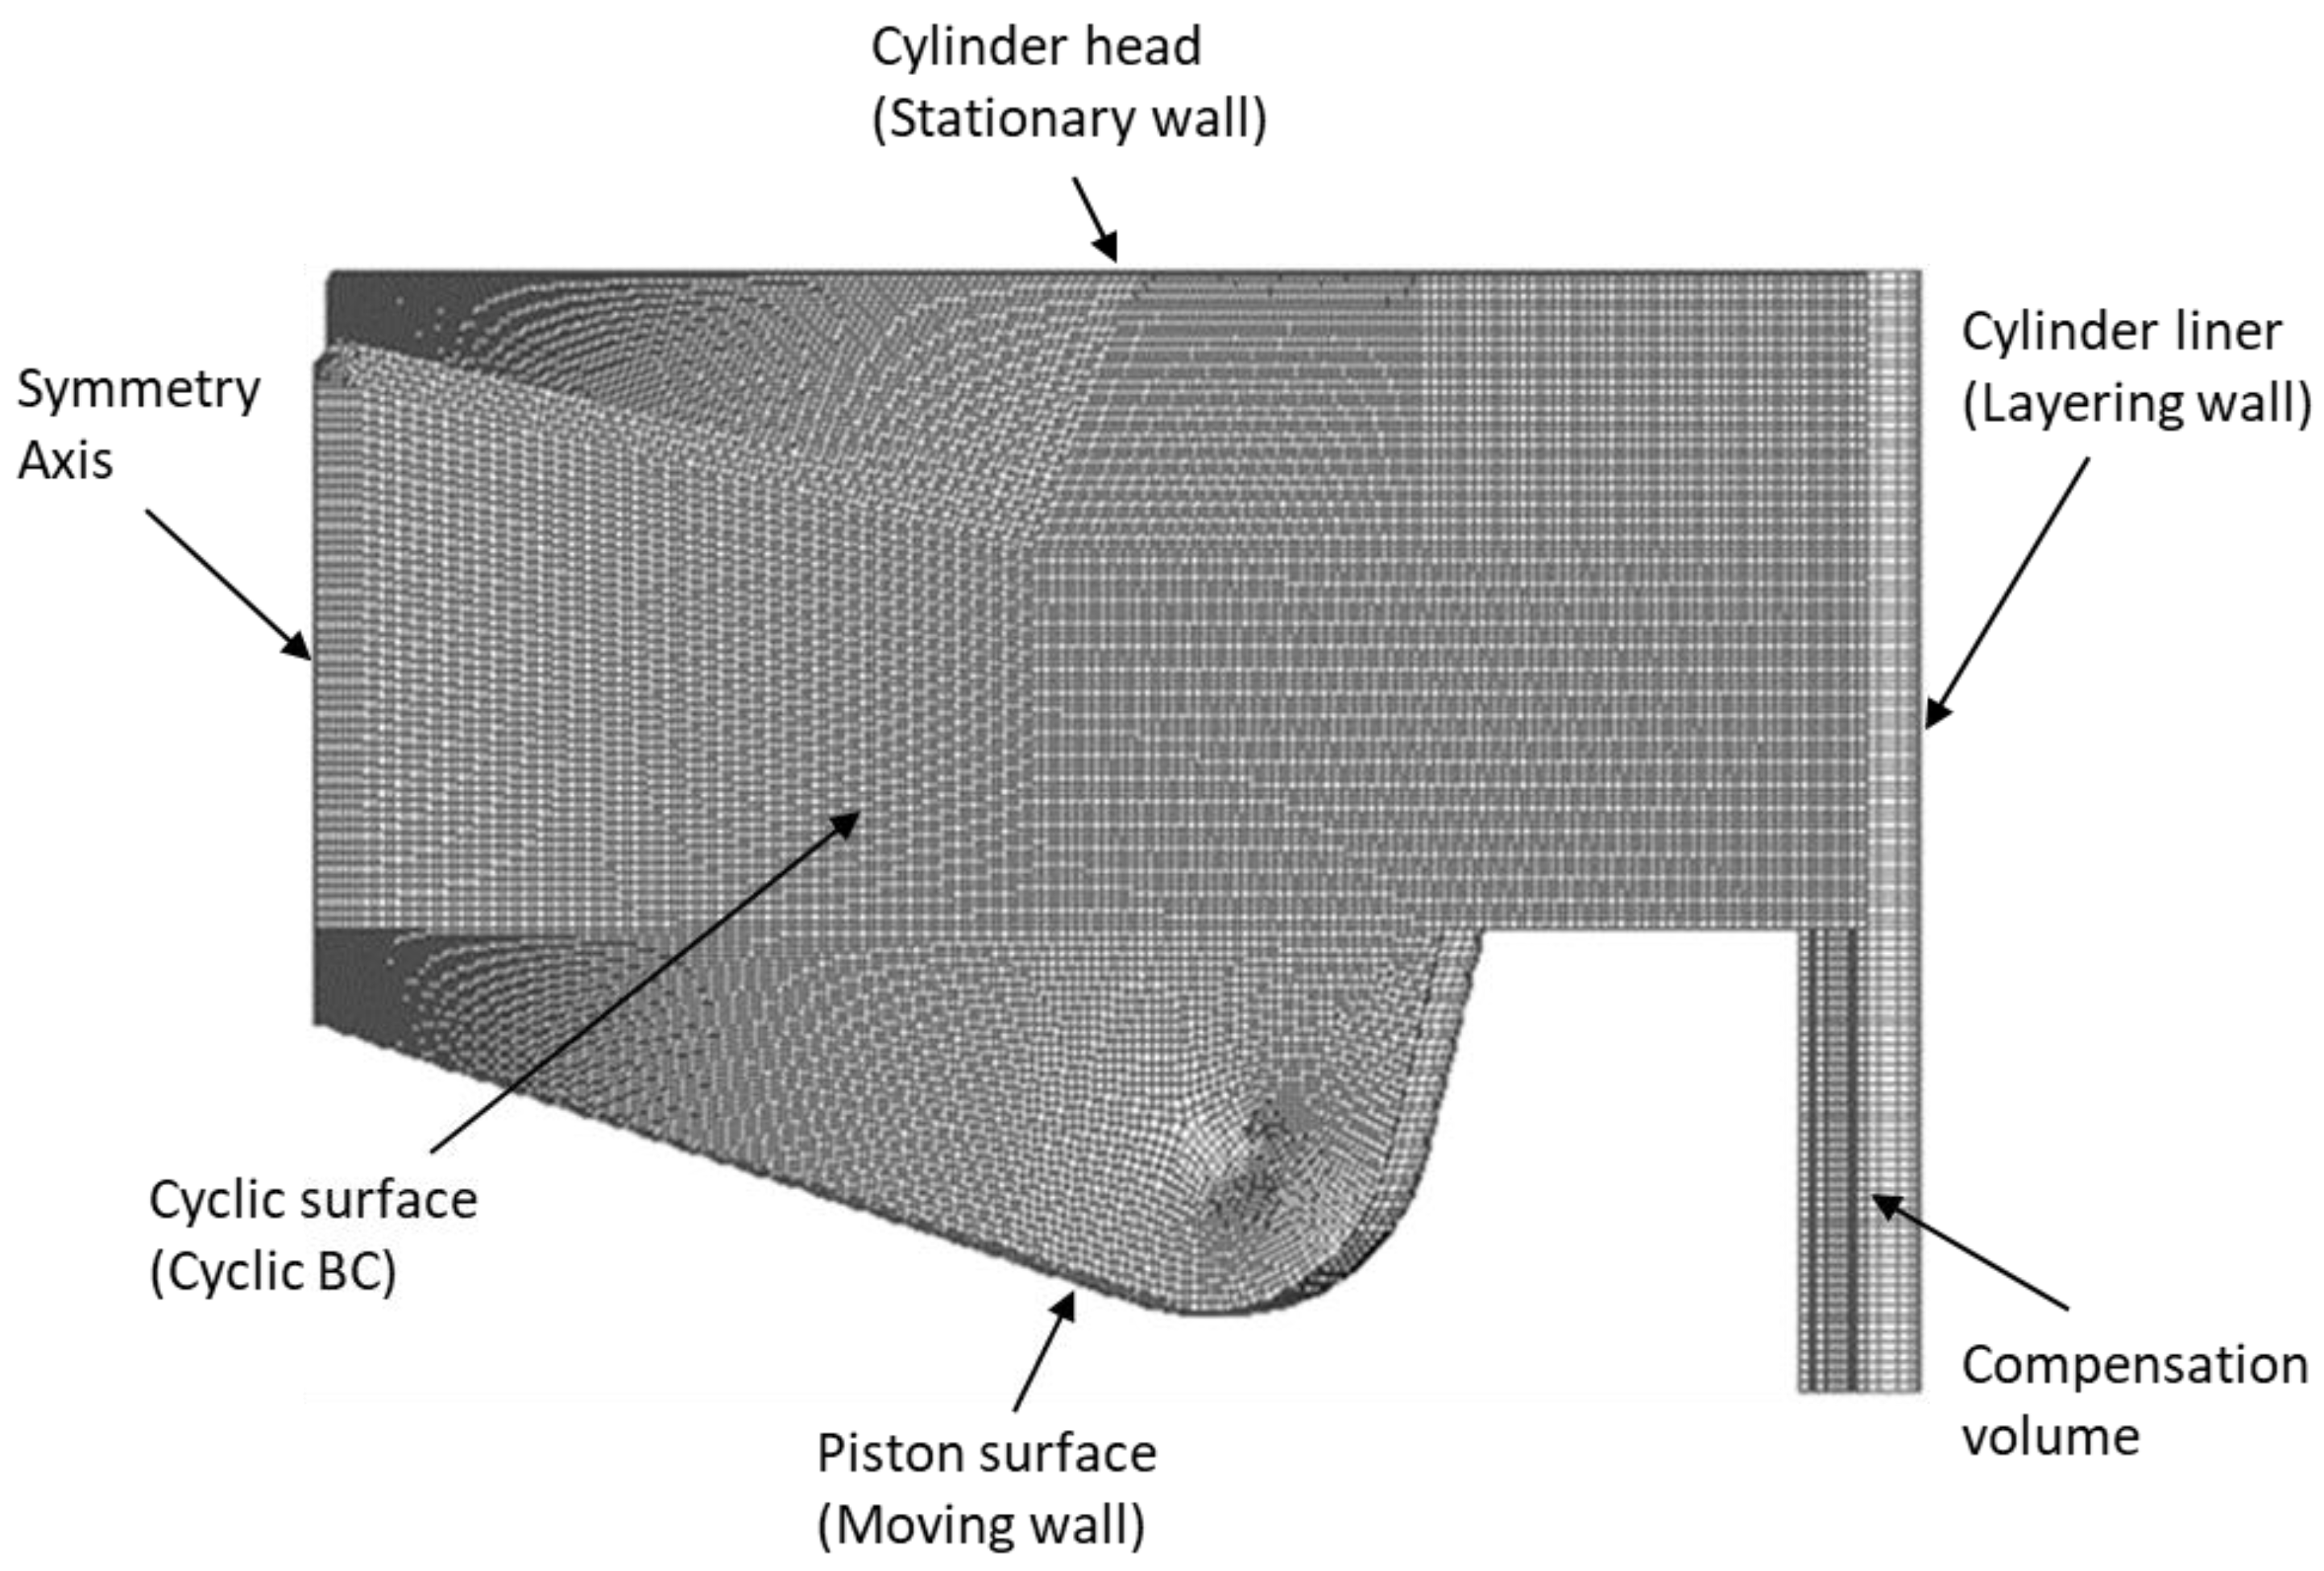
2.2. Computational Mesh, Initial and Boundary Conditions
2.3. Simulation Cases
2.4. CFD Models
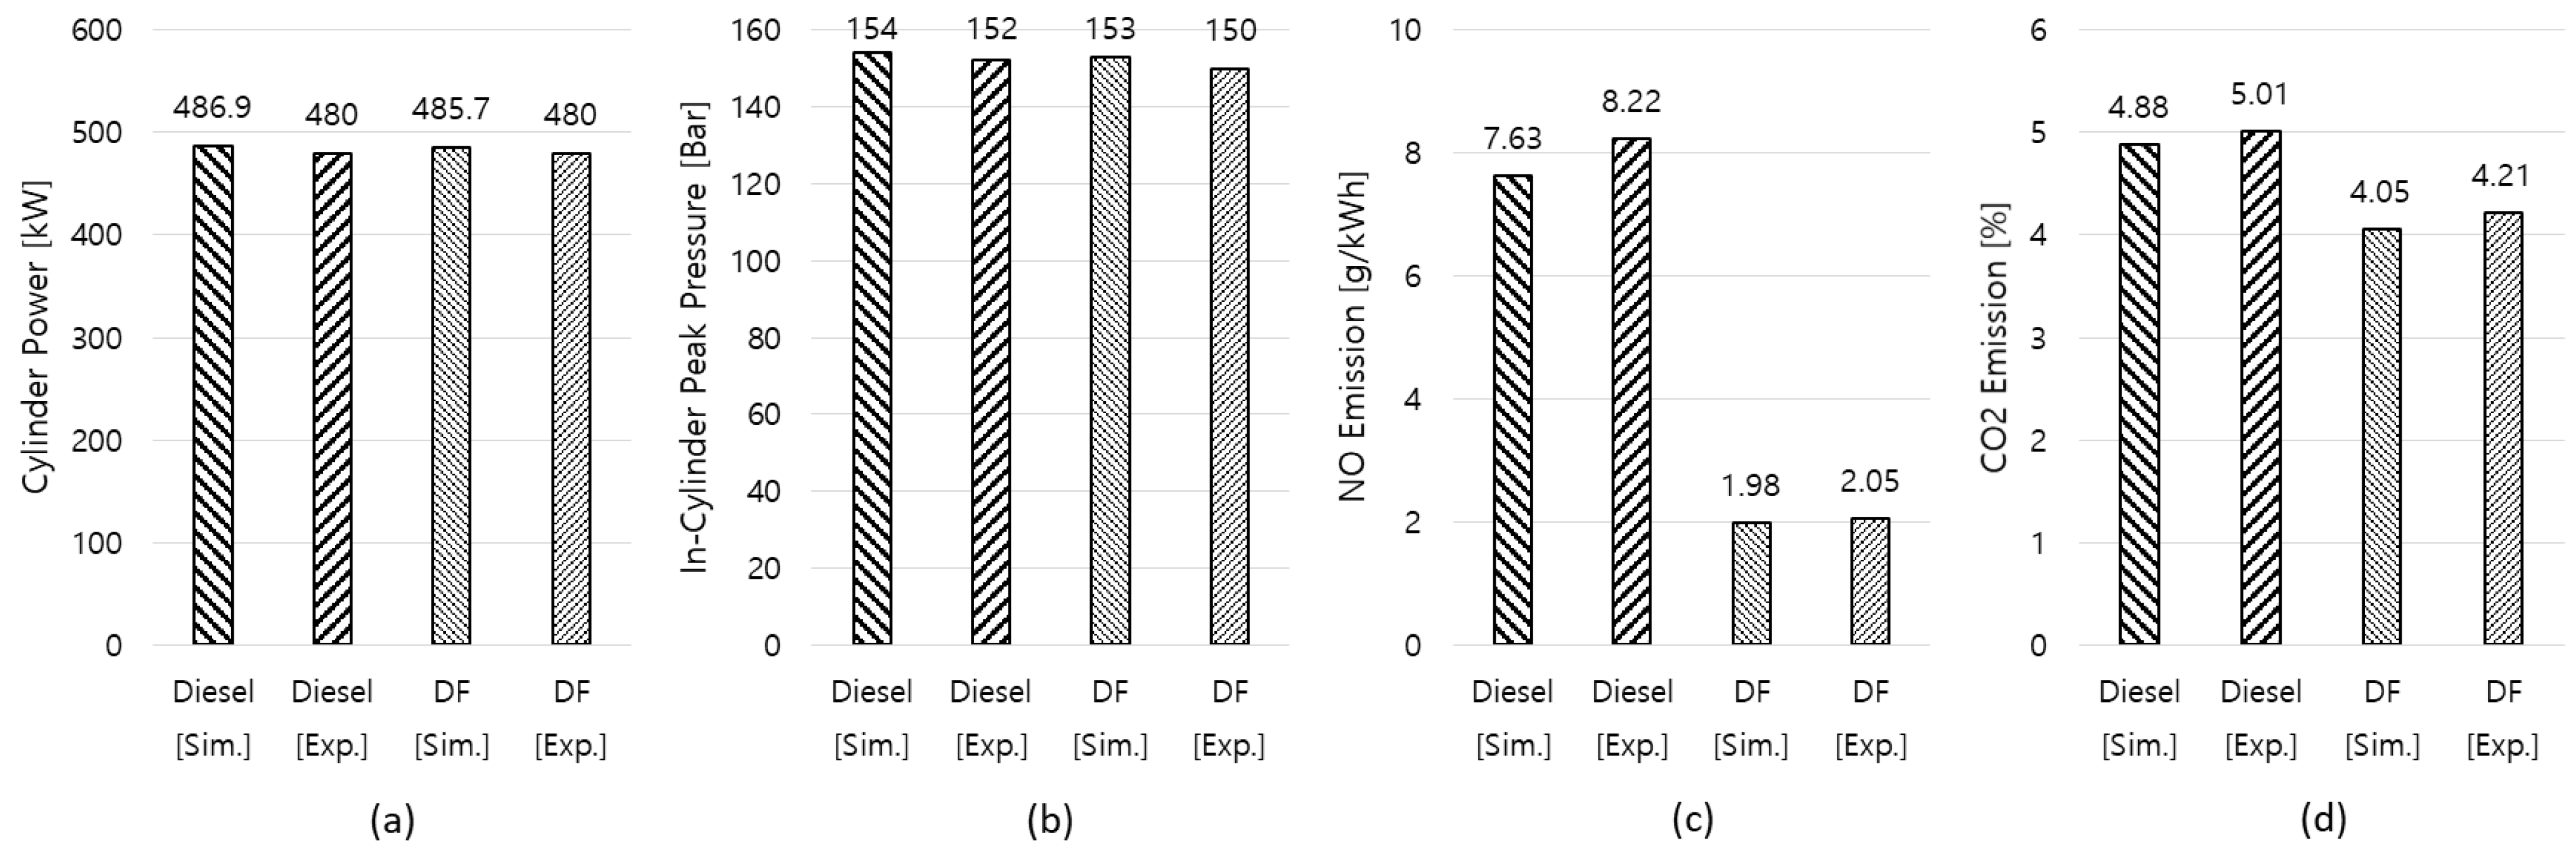
2.5. CFD Model Validation
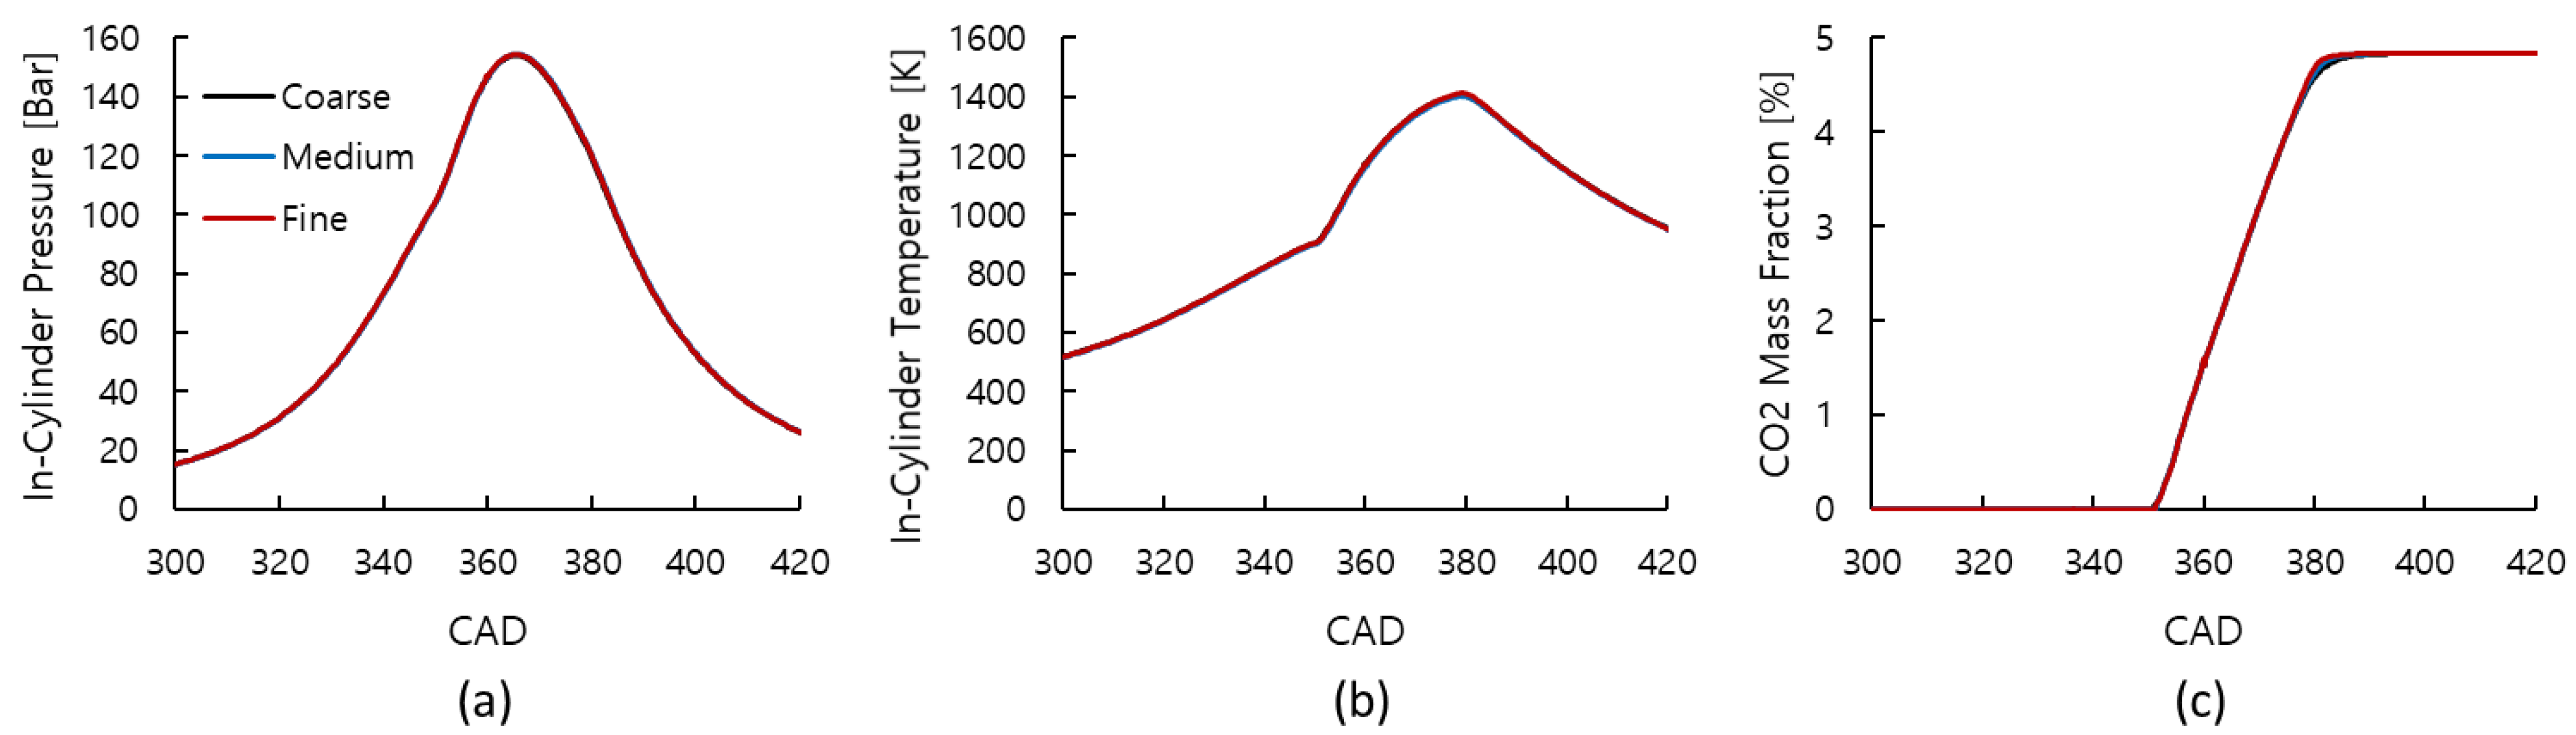
2.6. Mesh Independence Analysis
3. Results
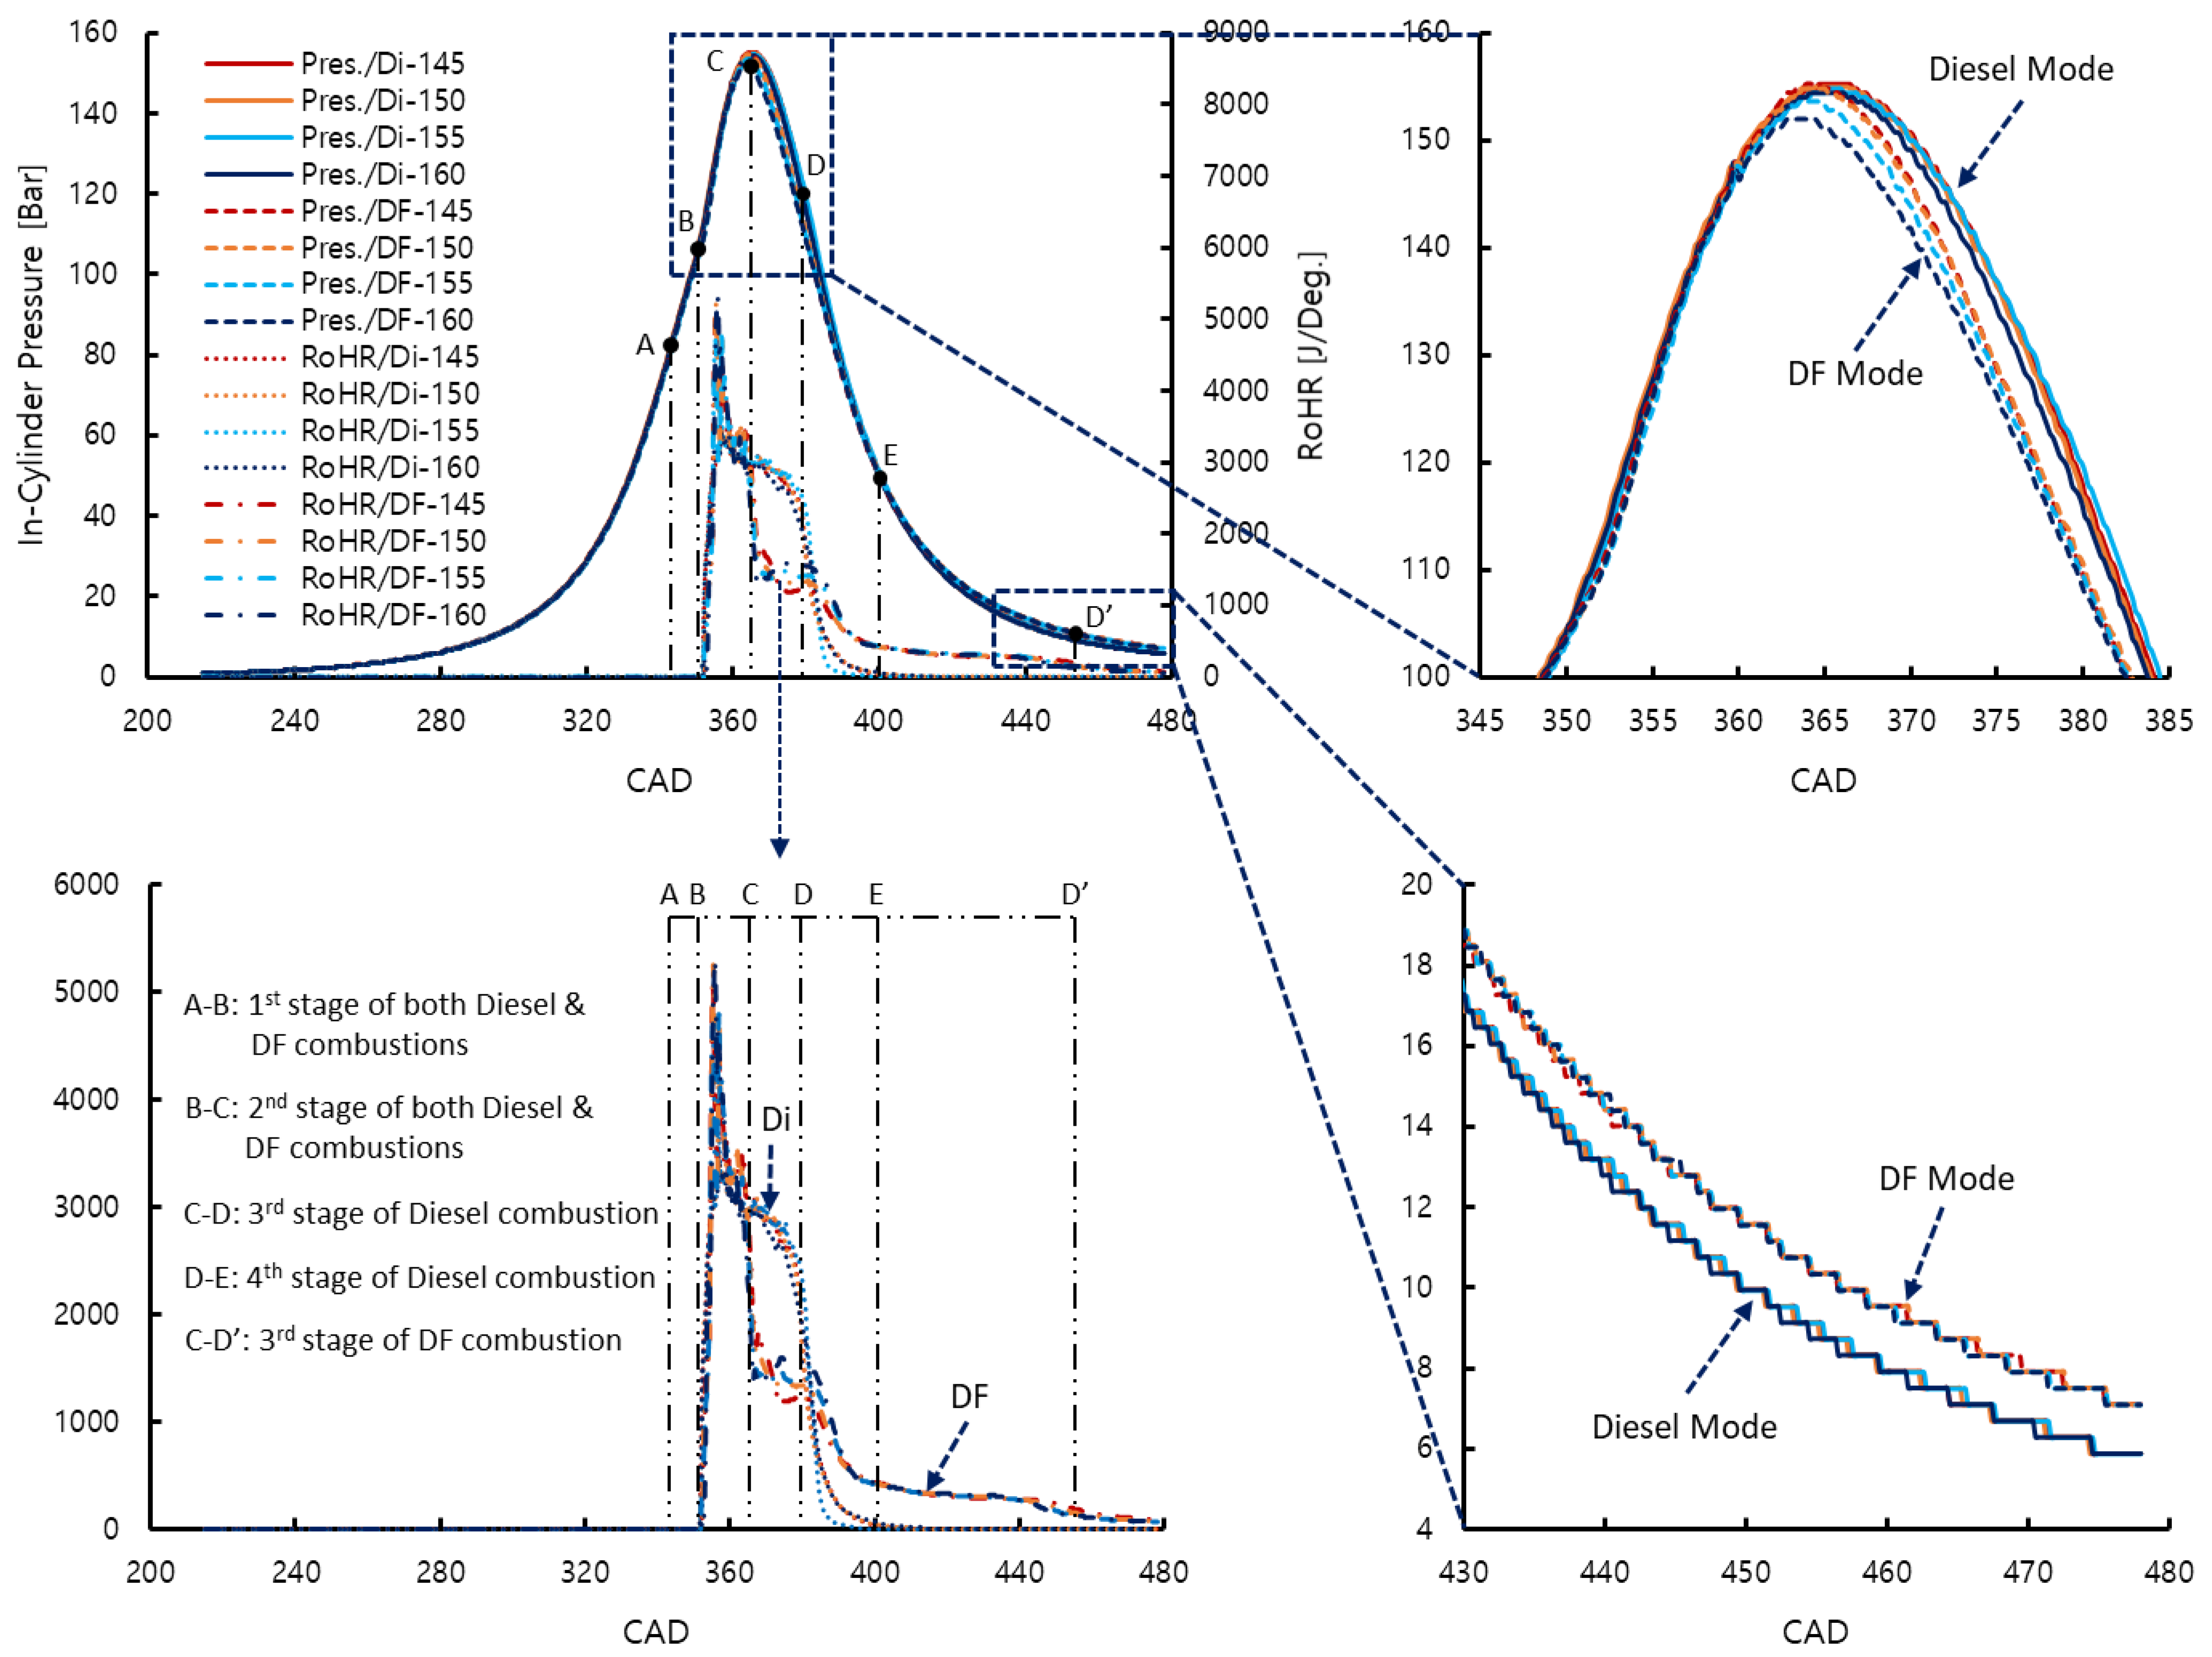
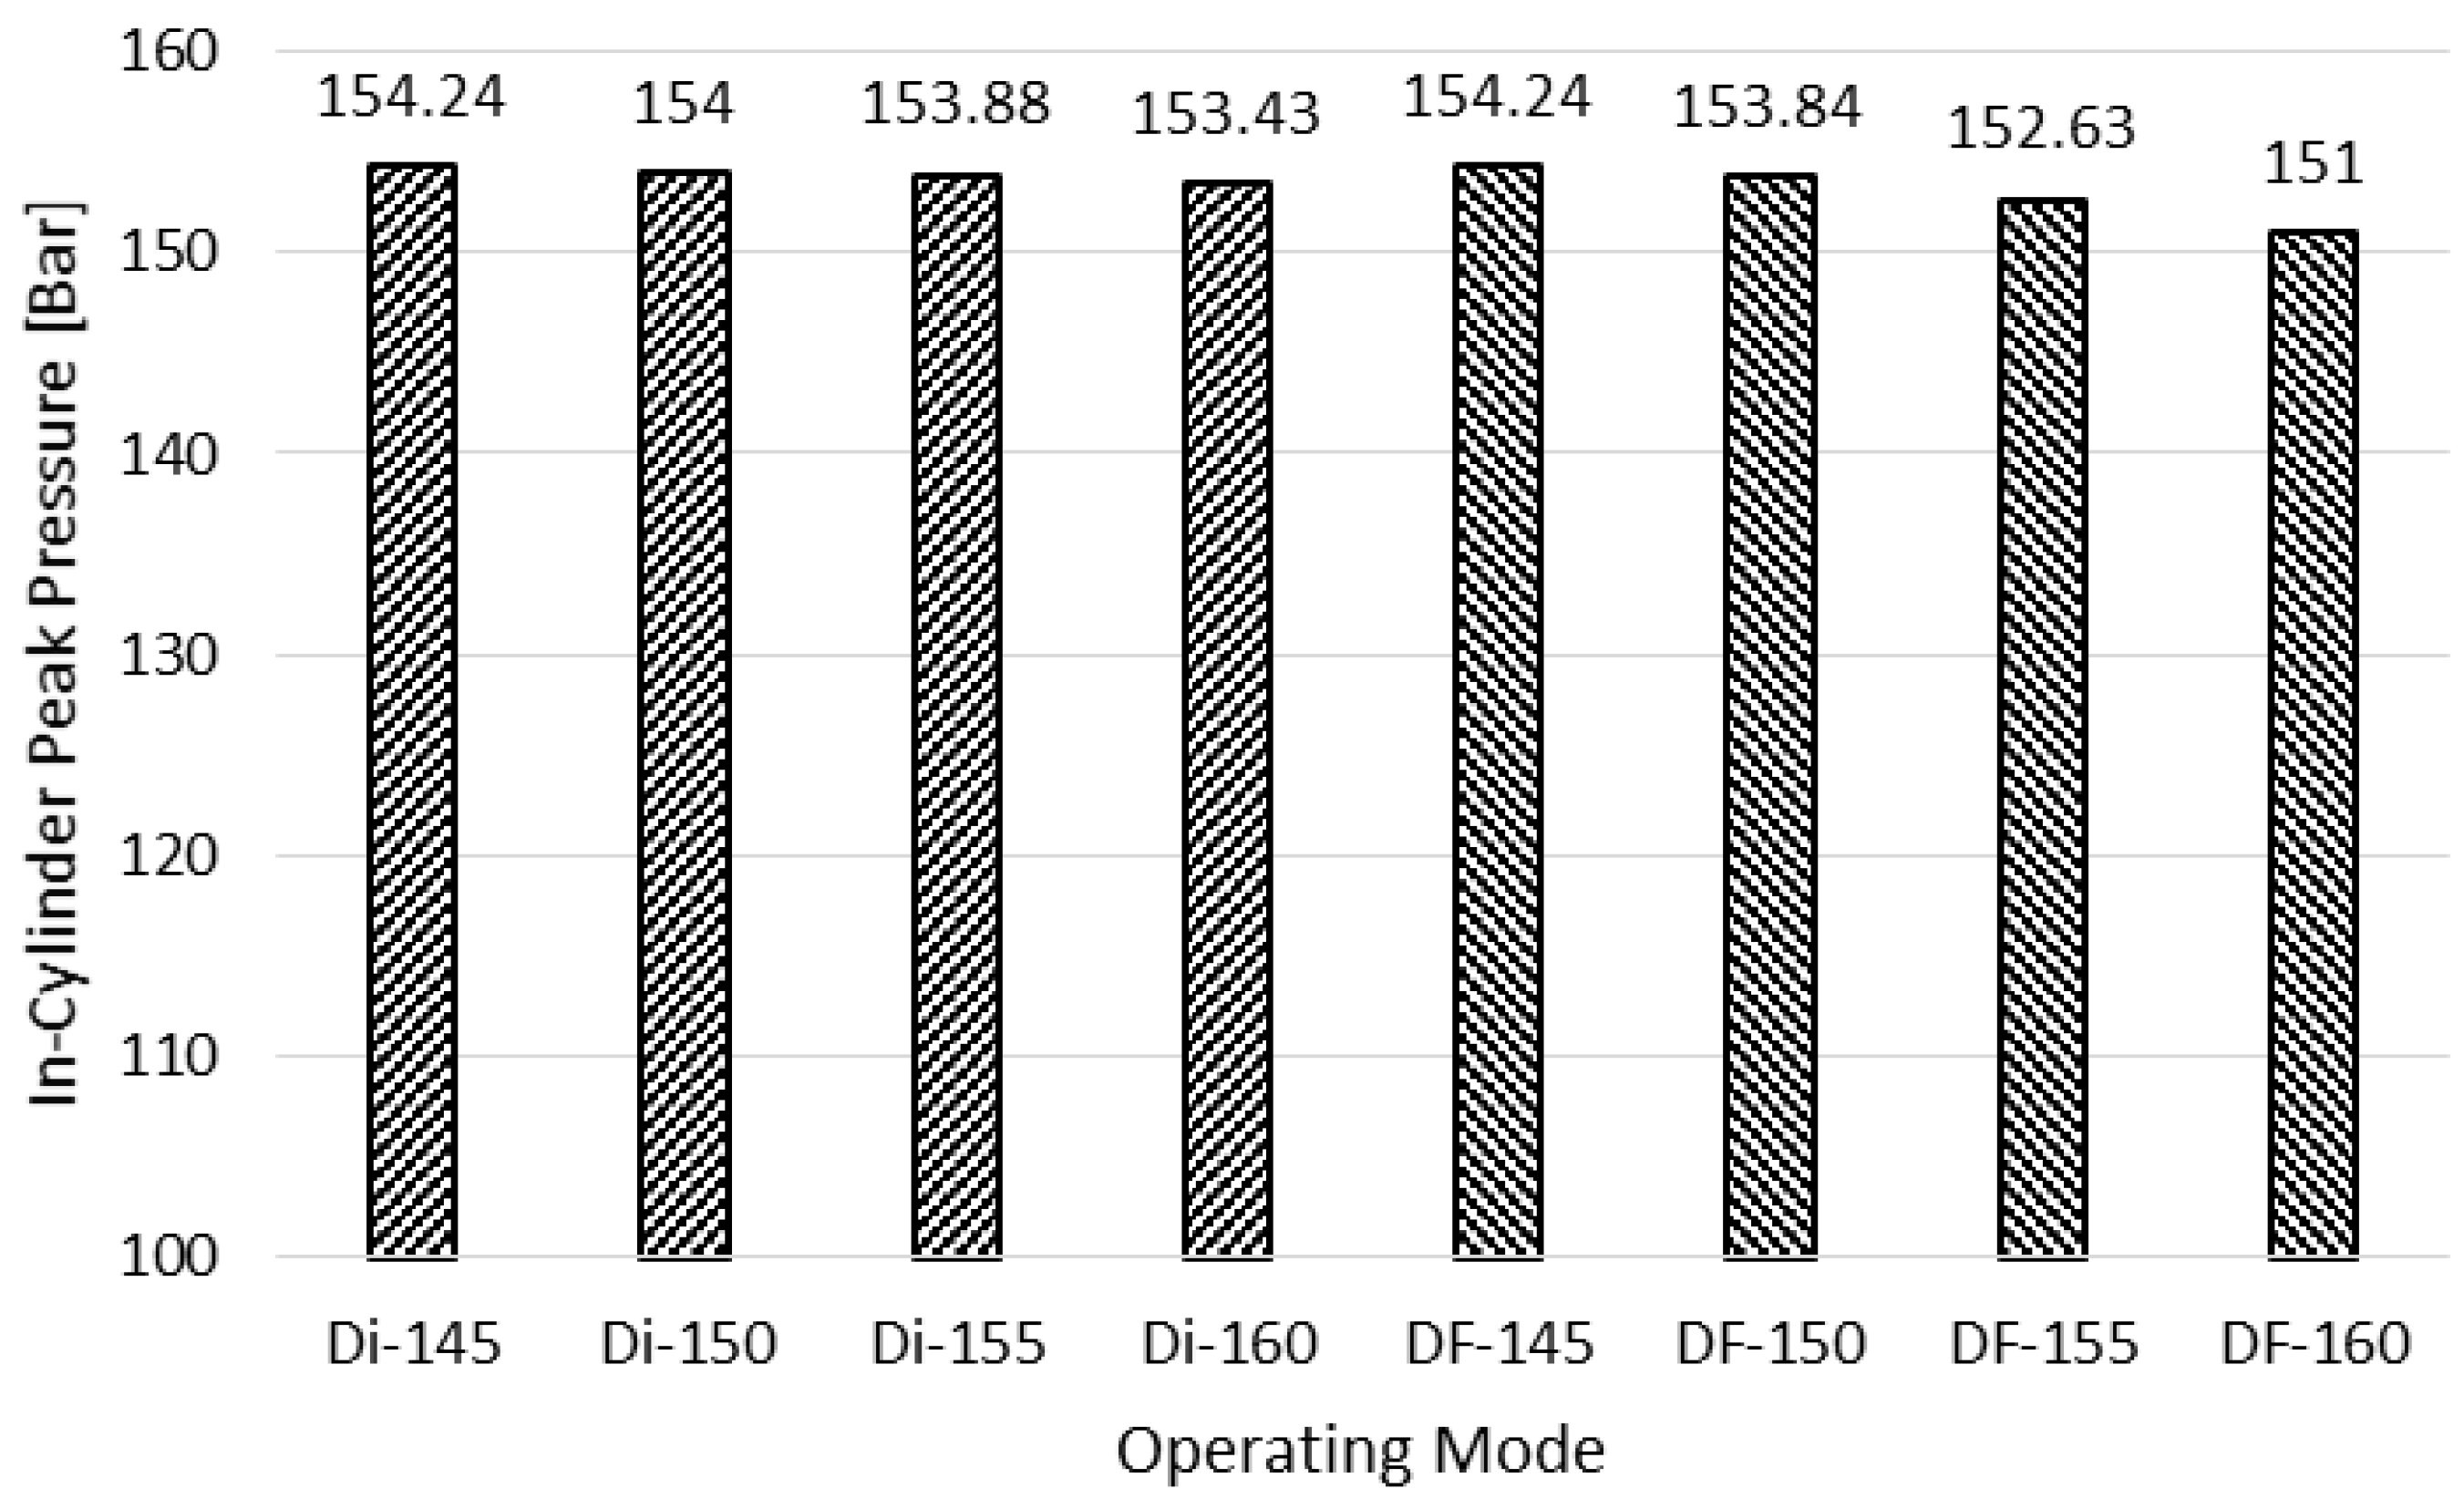
3.1. In-Cylinder Pressure
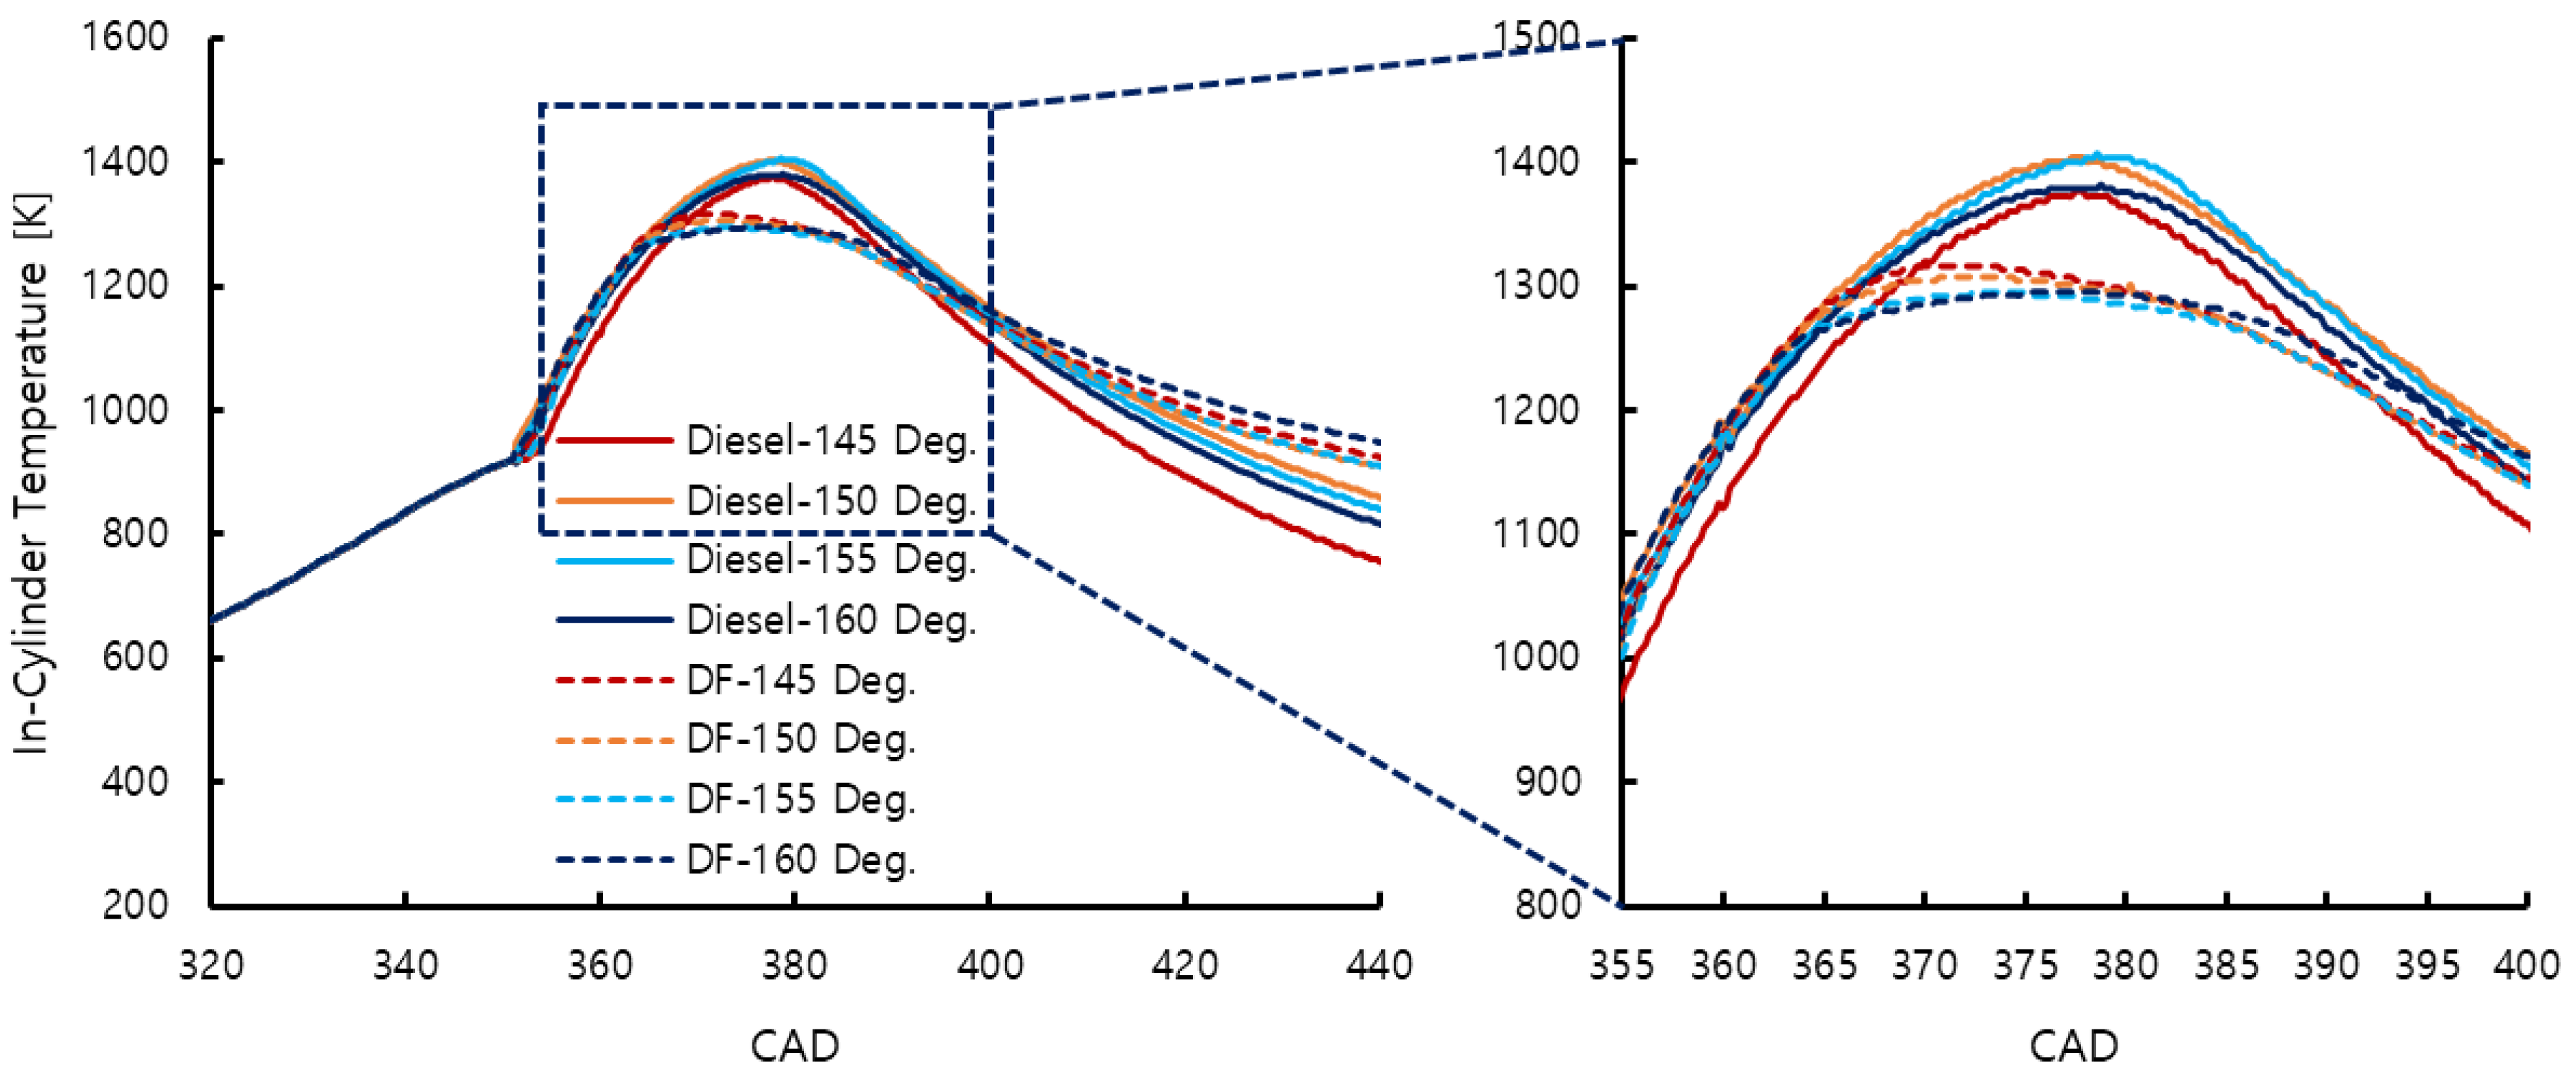
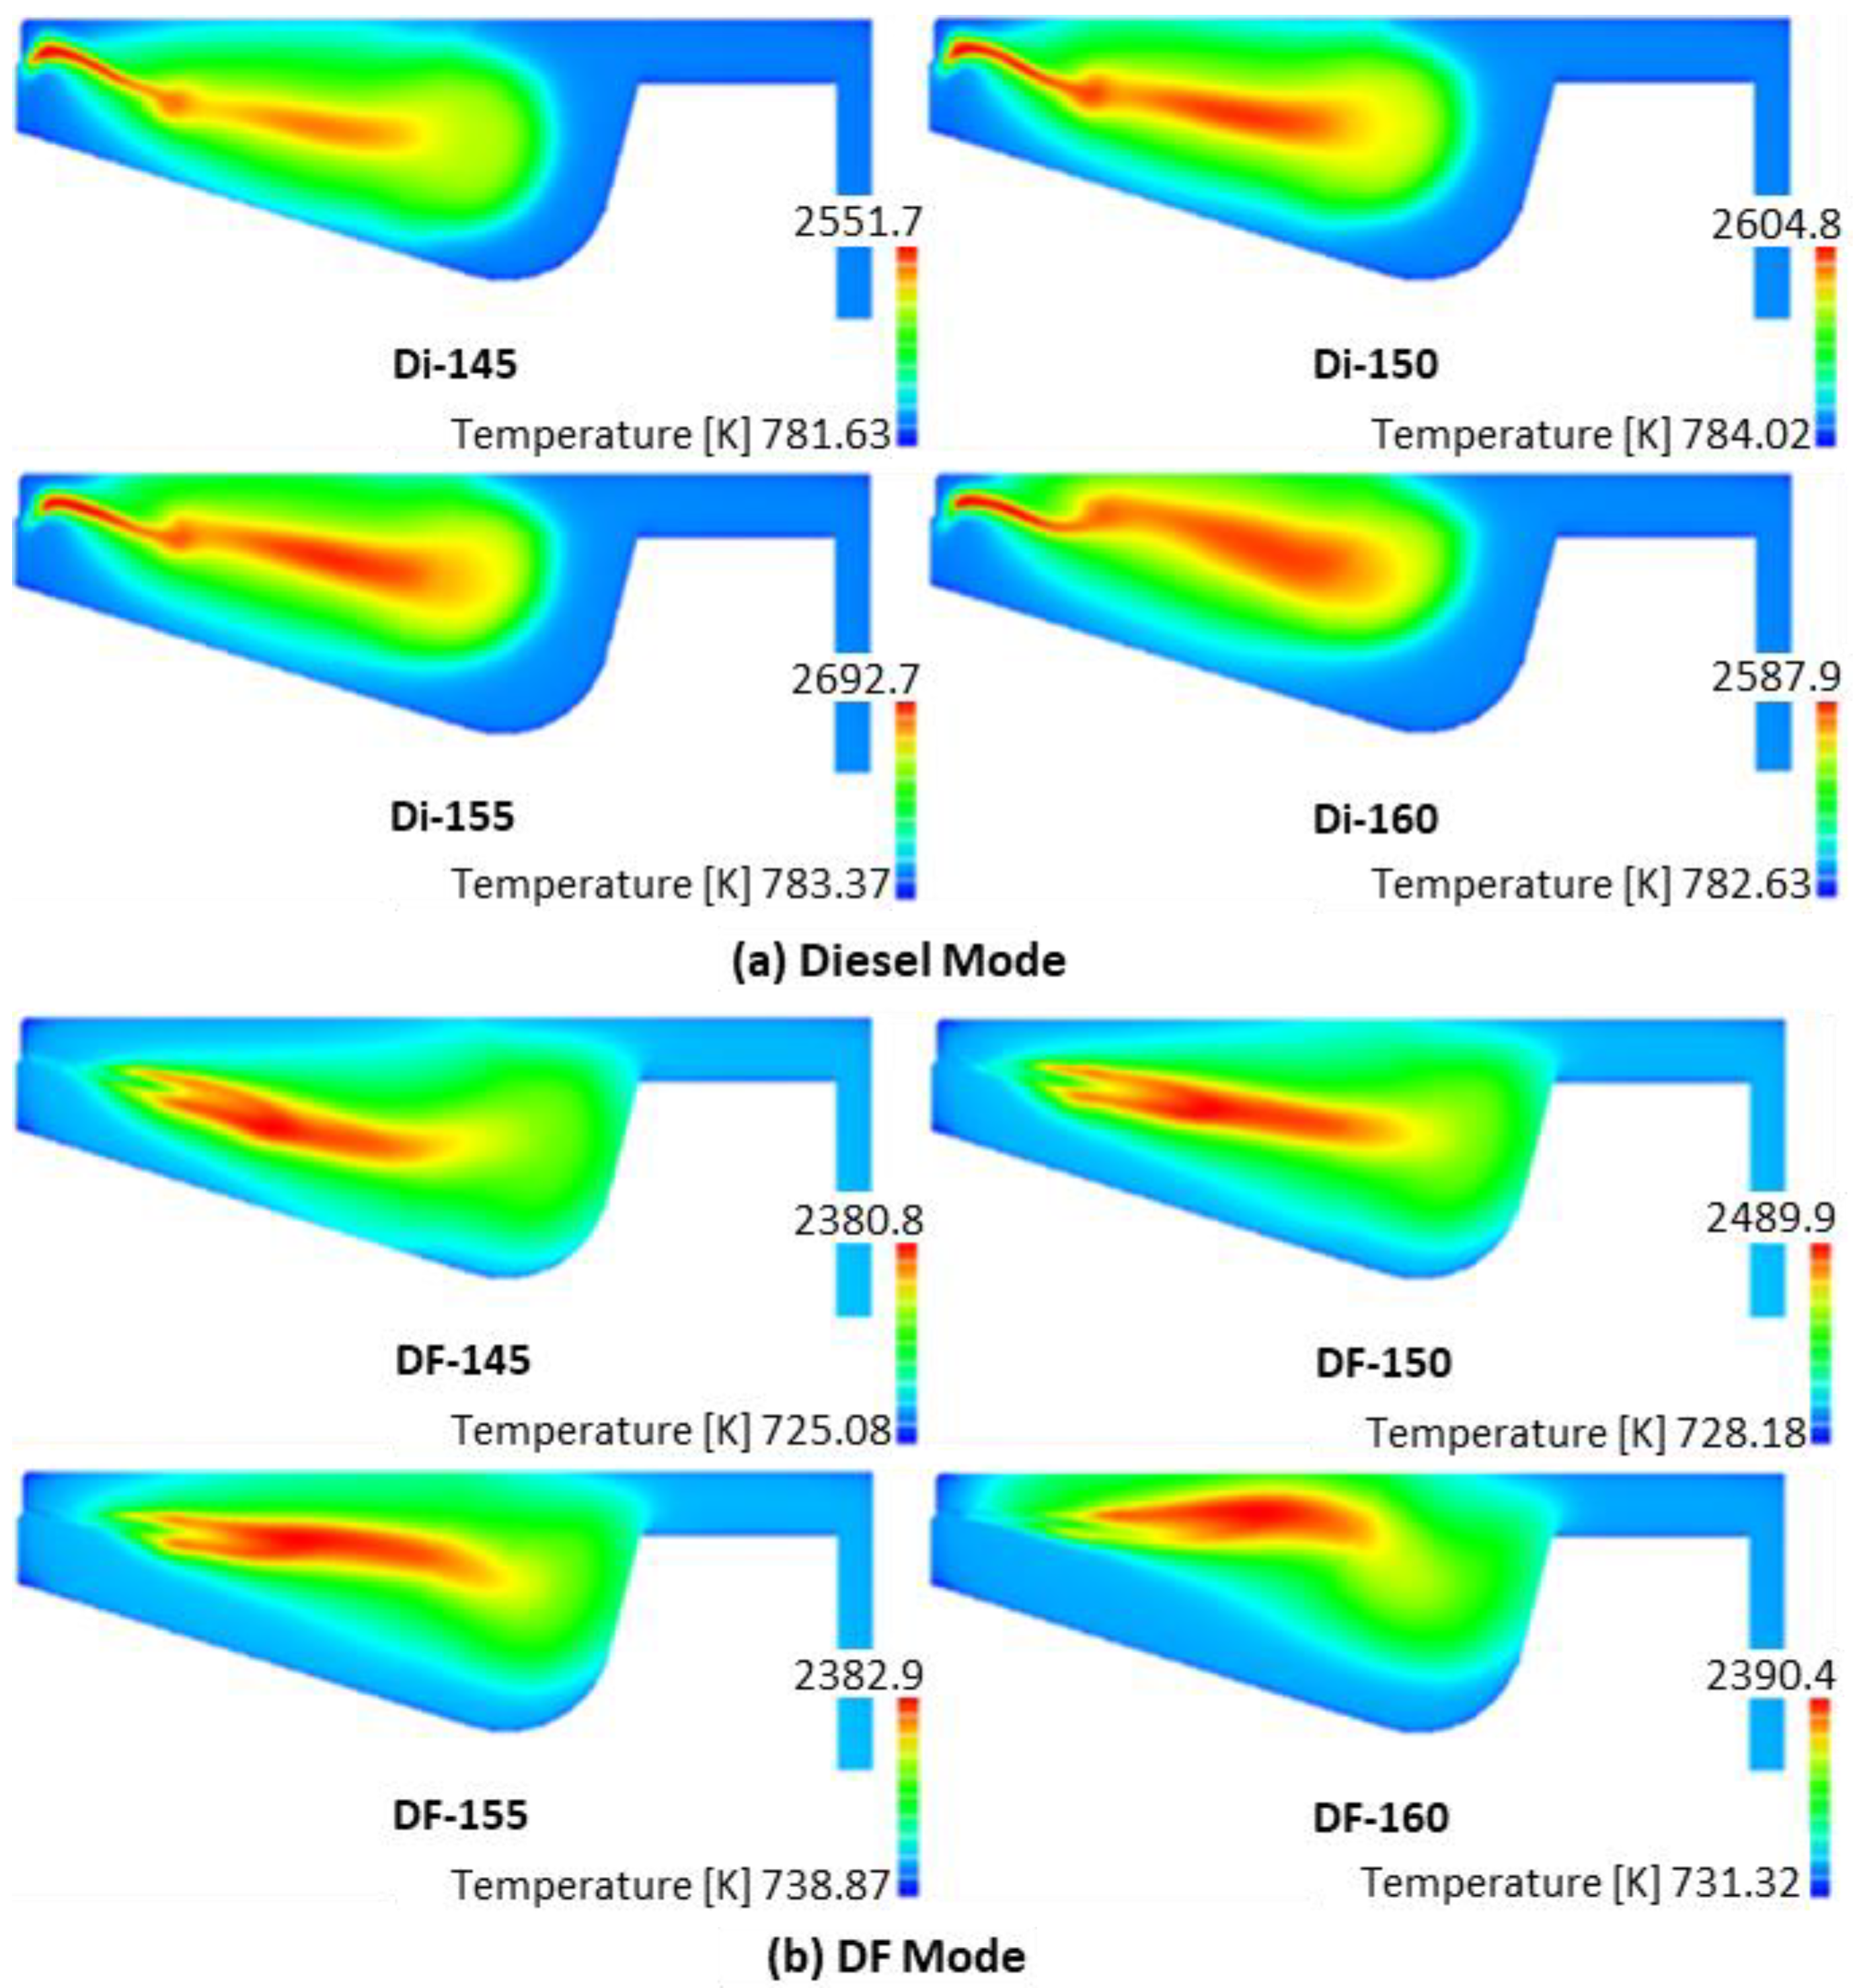
3.2. In-Cylinder Temperature
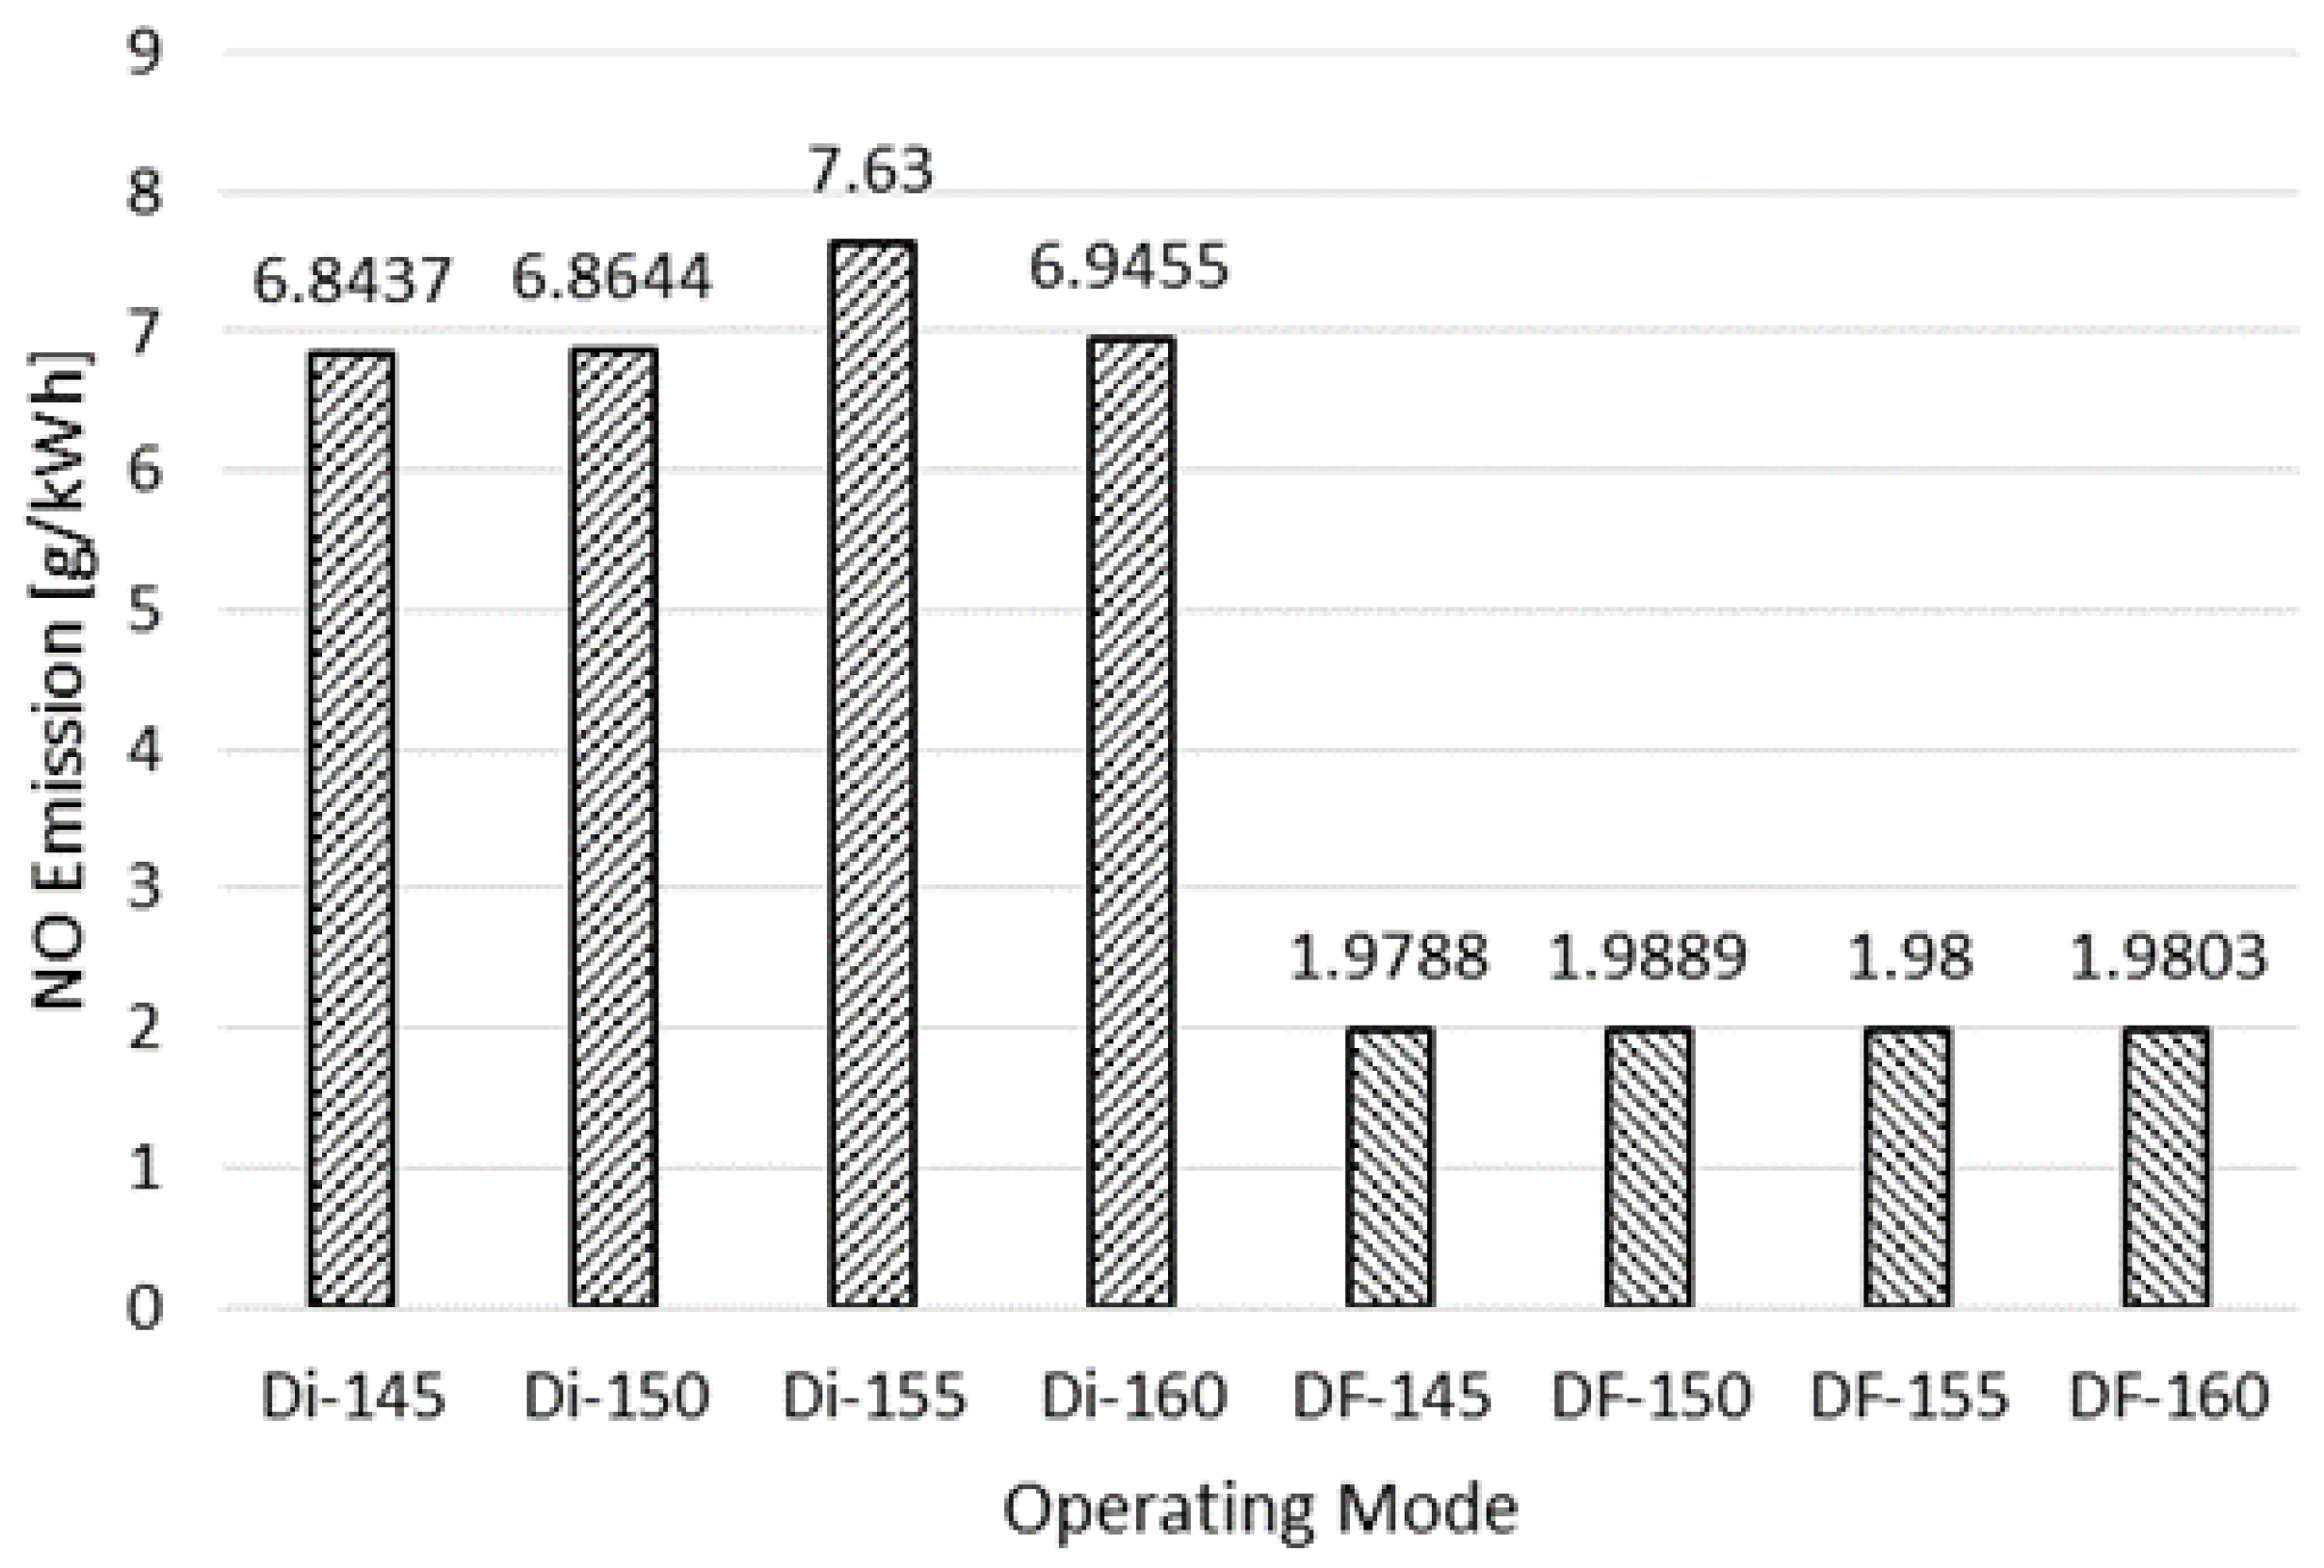
3.3. NO Emissions
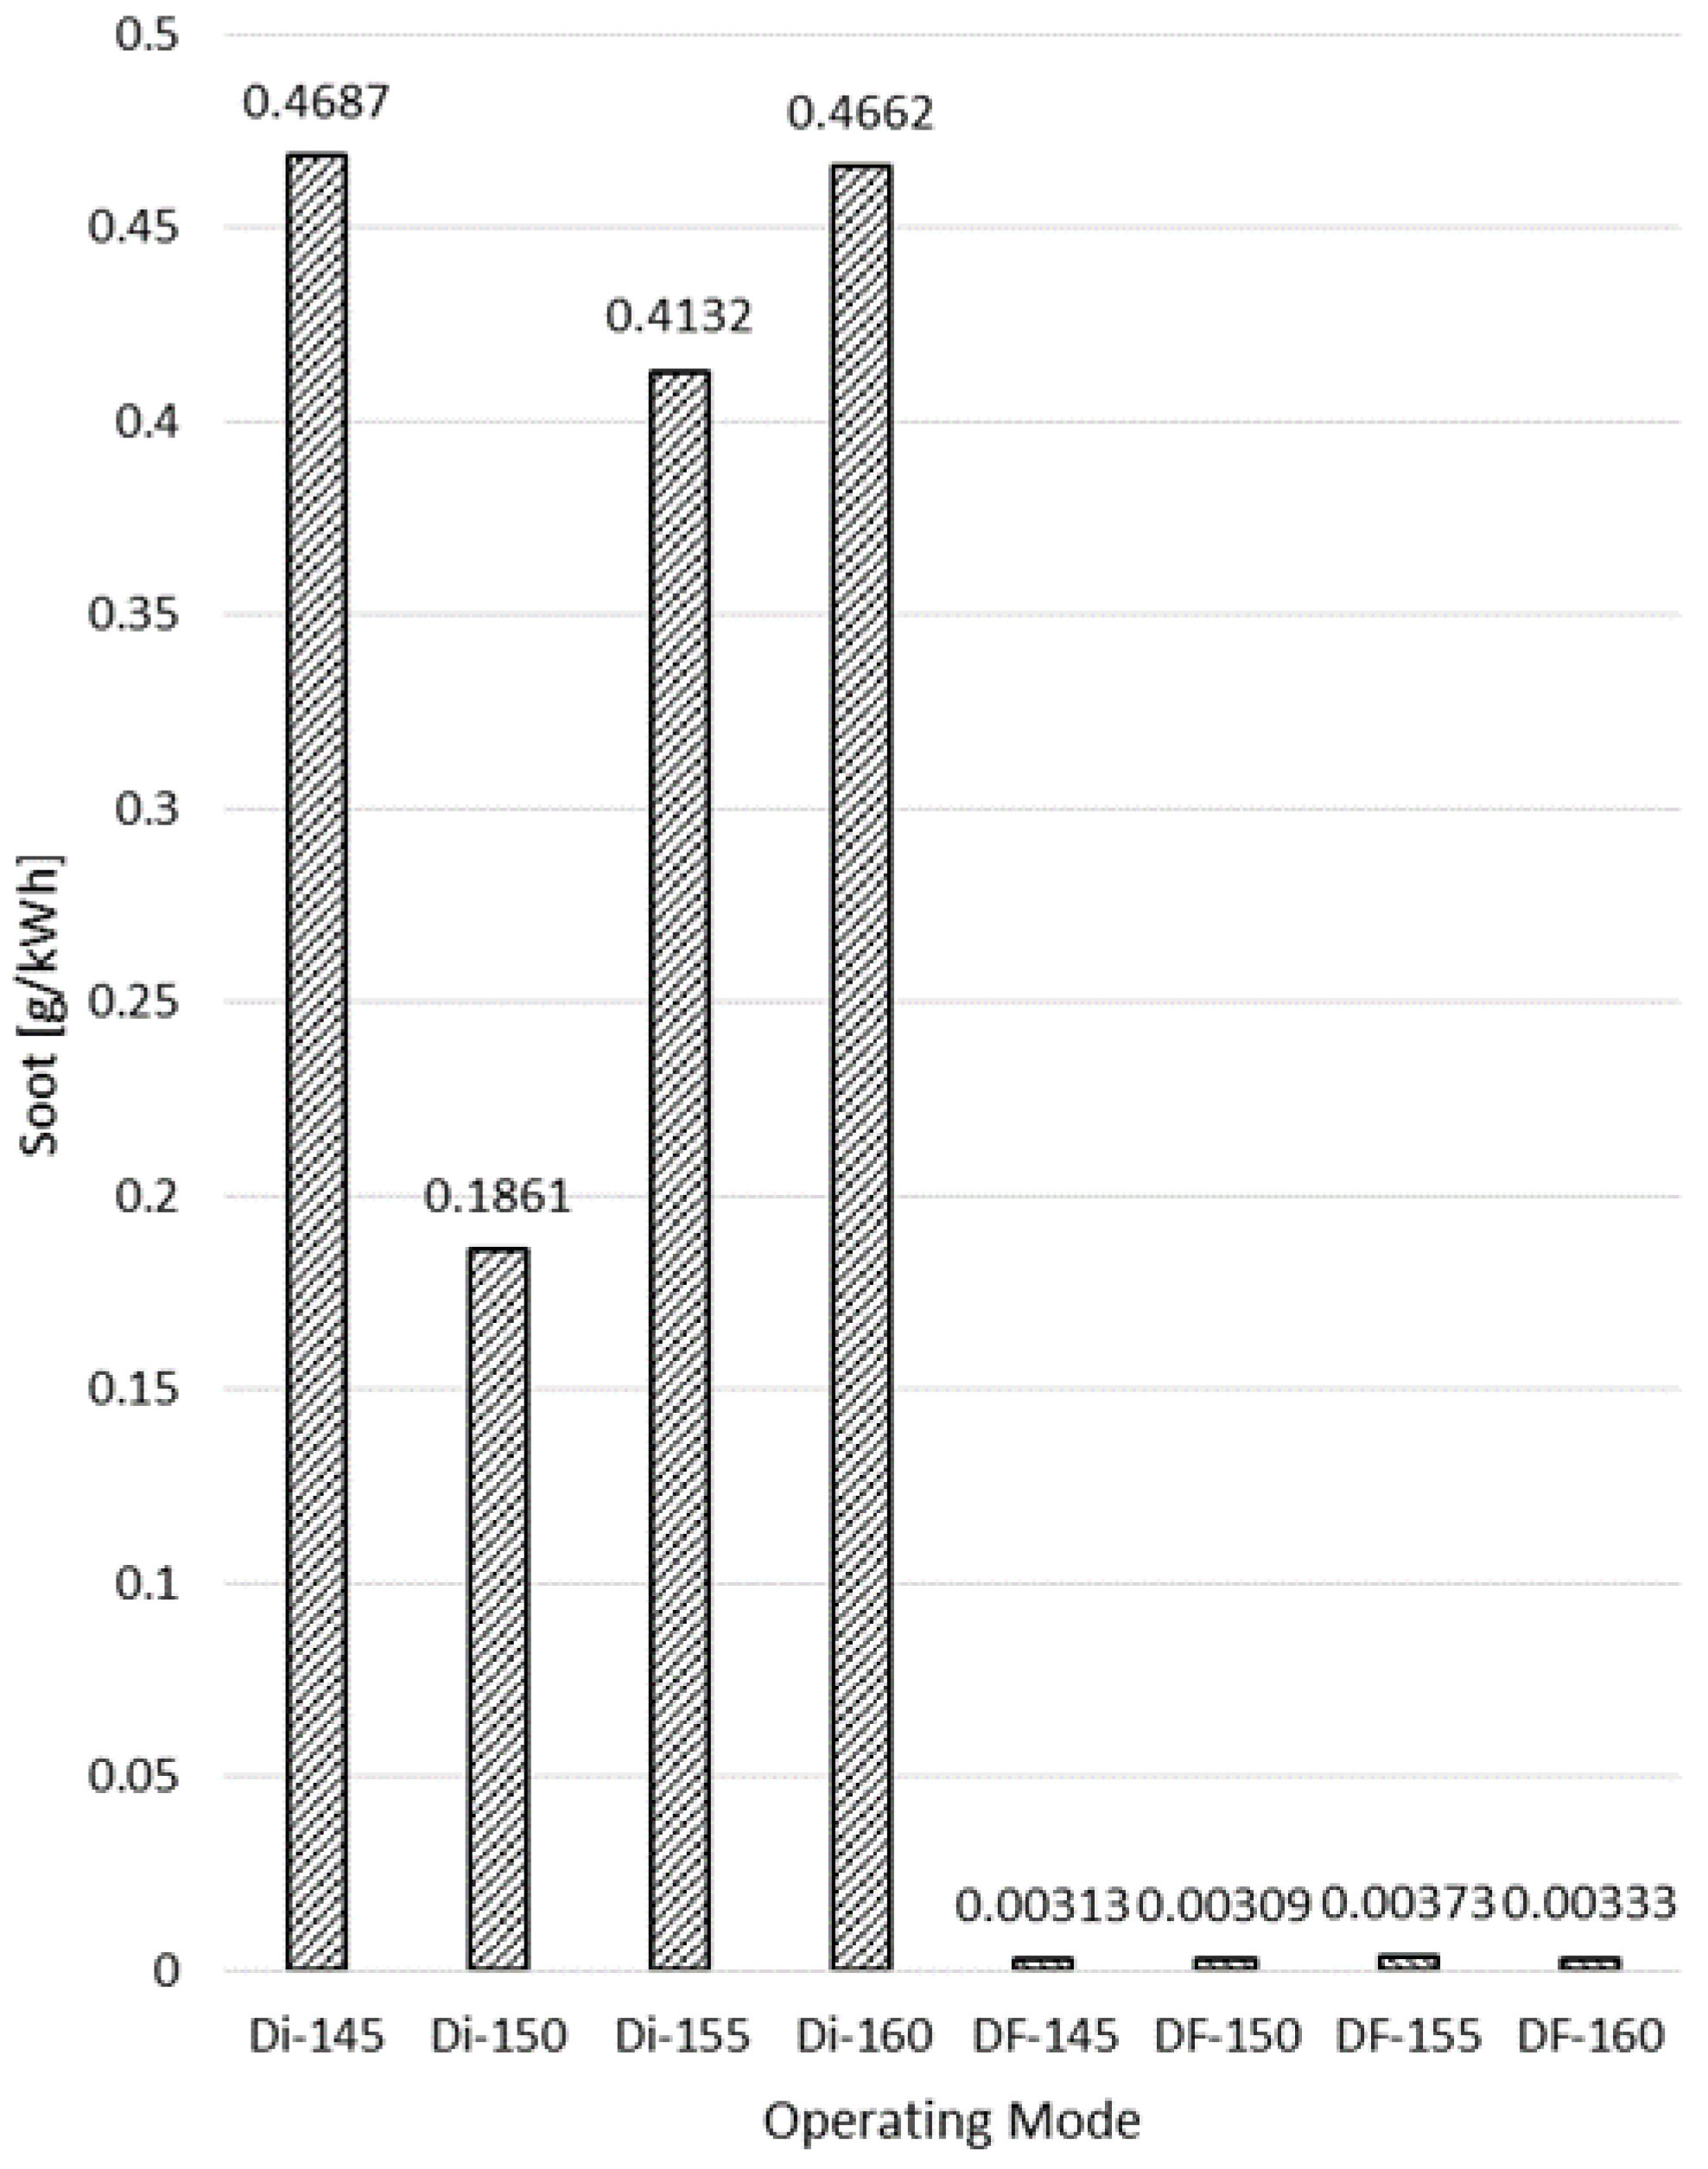
3.4. Soot
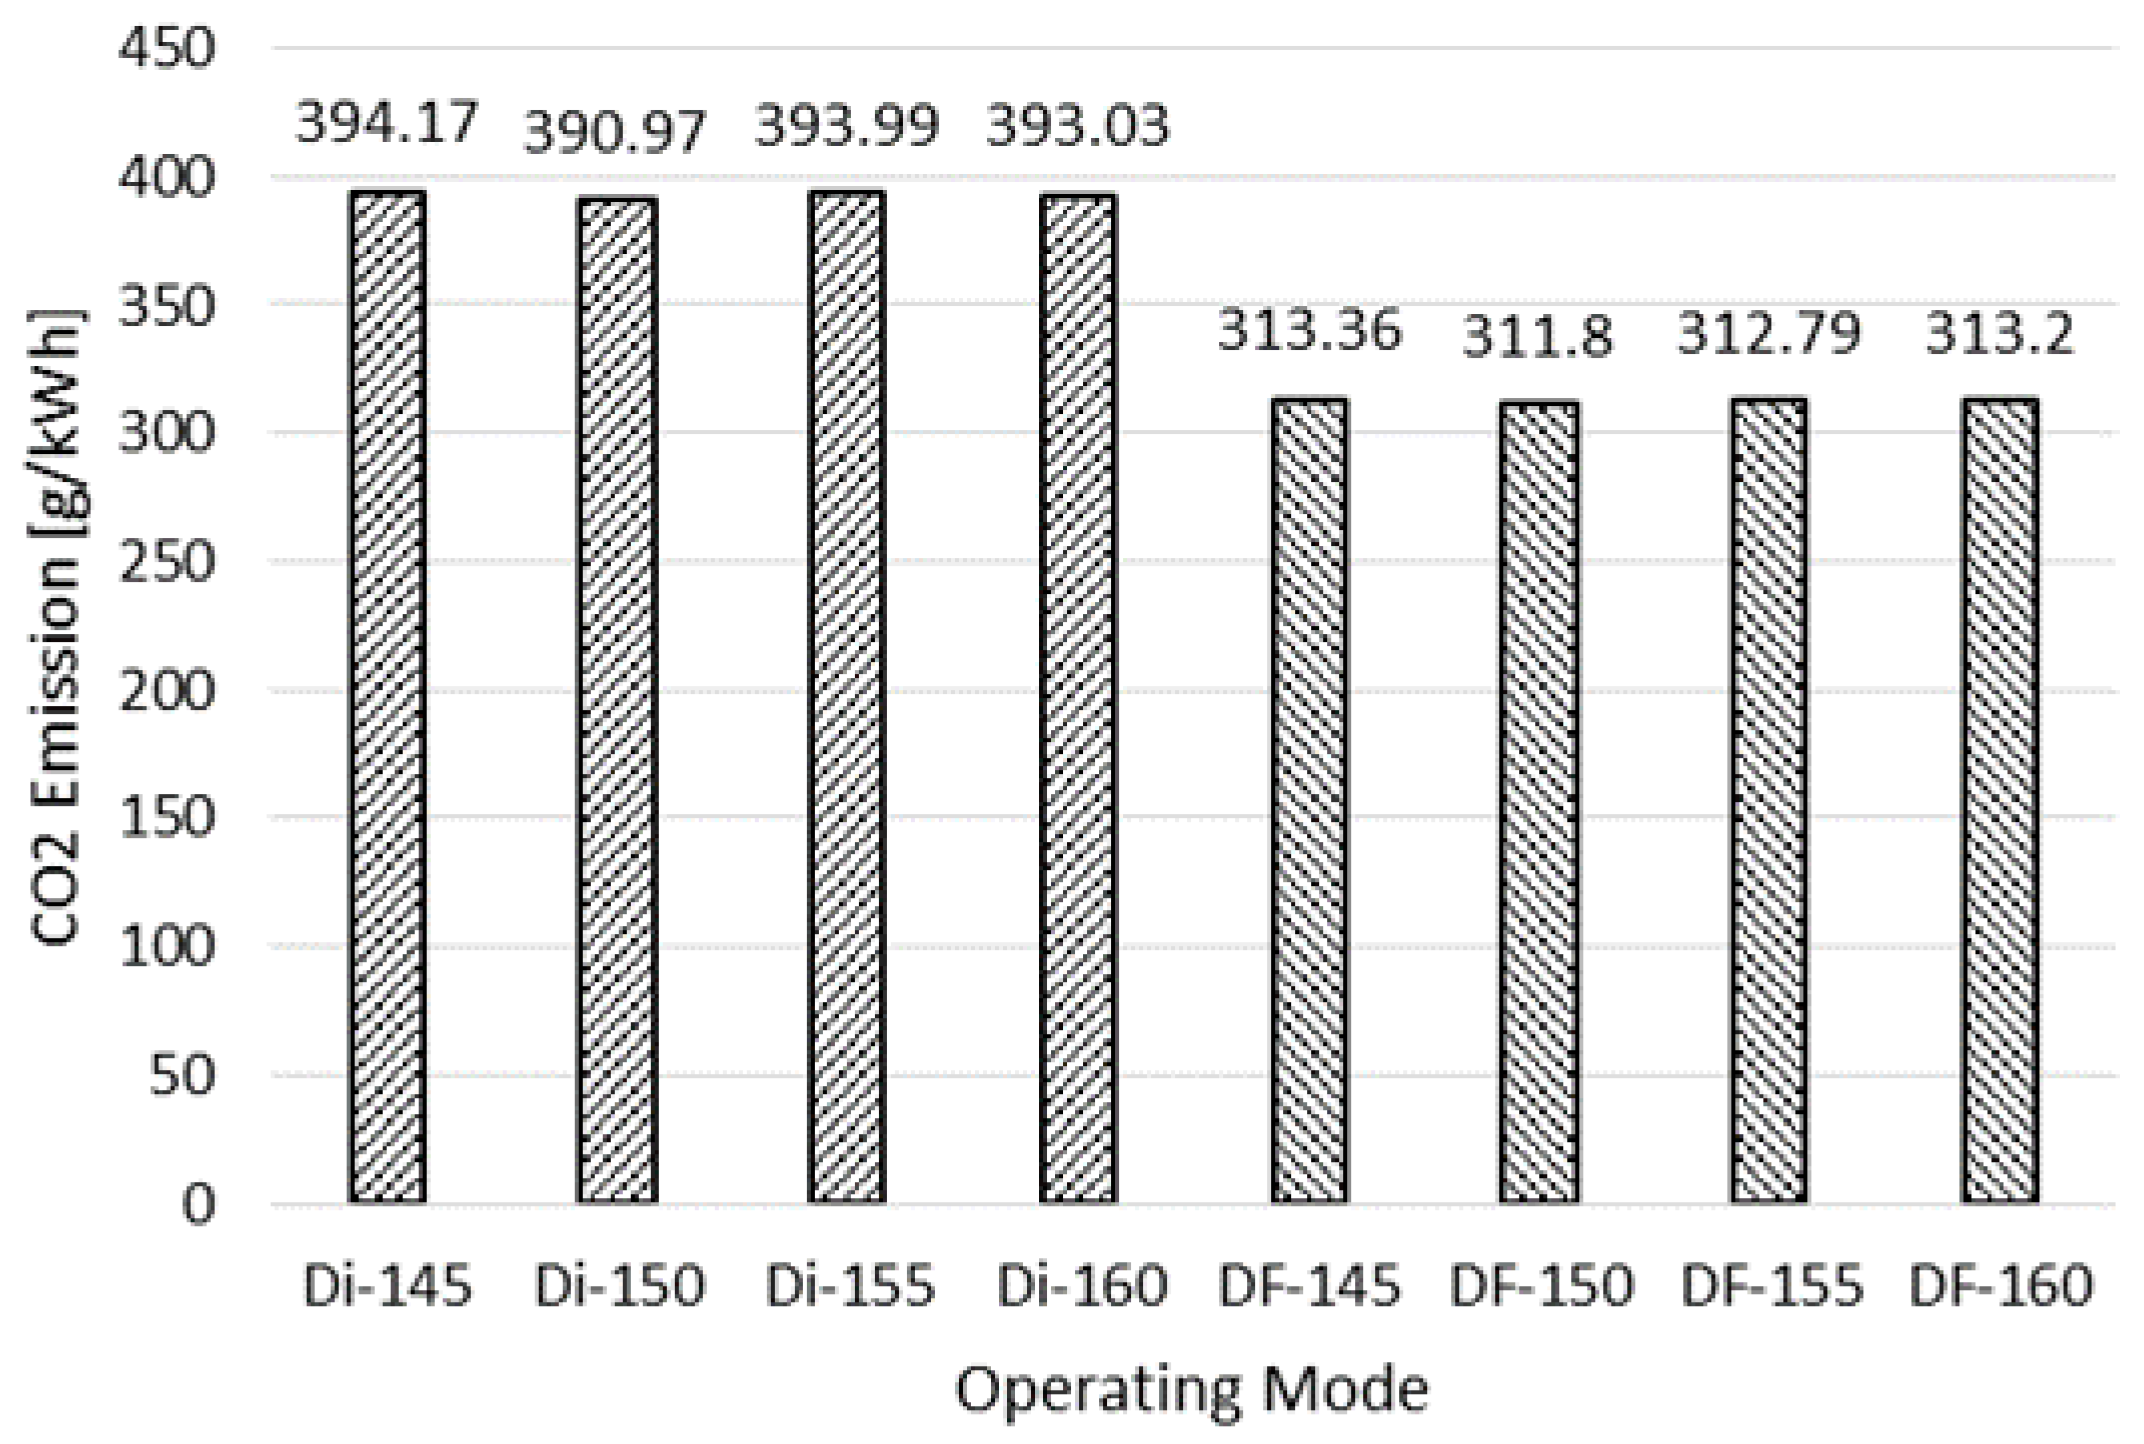
3.5. CO2 Emissions
4. Conclusions and Discussion
- (1)
- The in-cylinder peak temperature in the DF mode was lower than that in the diesel mode, due to the more uniform temperature distribution within the engine combustion chamber.
- (2)
- The DF mode reduced the NO emissions by up to 71%, compared to the diesel mode. The injector SA of 145° is the optimal value for reducing the NO emissions in both diesel and DF modes.
- (3)
- The DF mode significantly reduced the soot emissions, in comparison to the diesel mode. The soot emissions in the DF mode was almost zero. In both diesel and DF modes, the injector SA of 150° produced the lowest soot emissions. This is thus the recommended SA for the injector of this engine to reduce soot emissions. It helped to reduce 56% and 17% of soot in the diesel and DF modes, respectively.
- (4)
- A considerable reduction in the CO2 emissions in the DF mode, compared to the diesel mode was observed. The DF mode reduced the CO2 emissions by approximately 20%, compared to the diesel mode. In both diesel and DF modes, the injector SA of 150° produced the lowest CO2 emissions. This is thus the recommended SA for the injector of this engine to reduce CO2 emissions.
- (5)
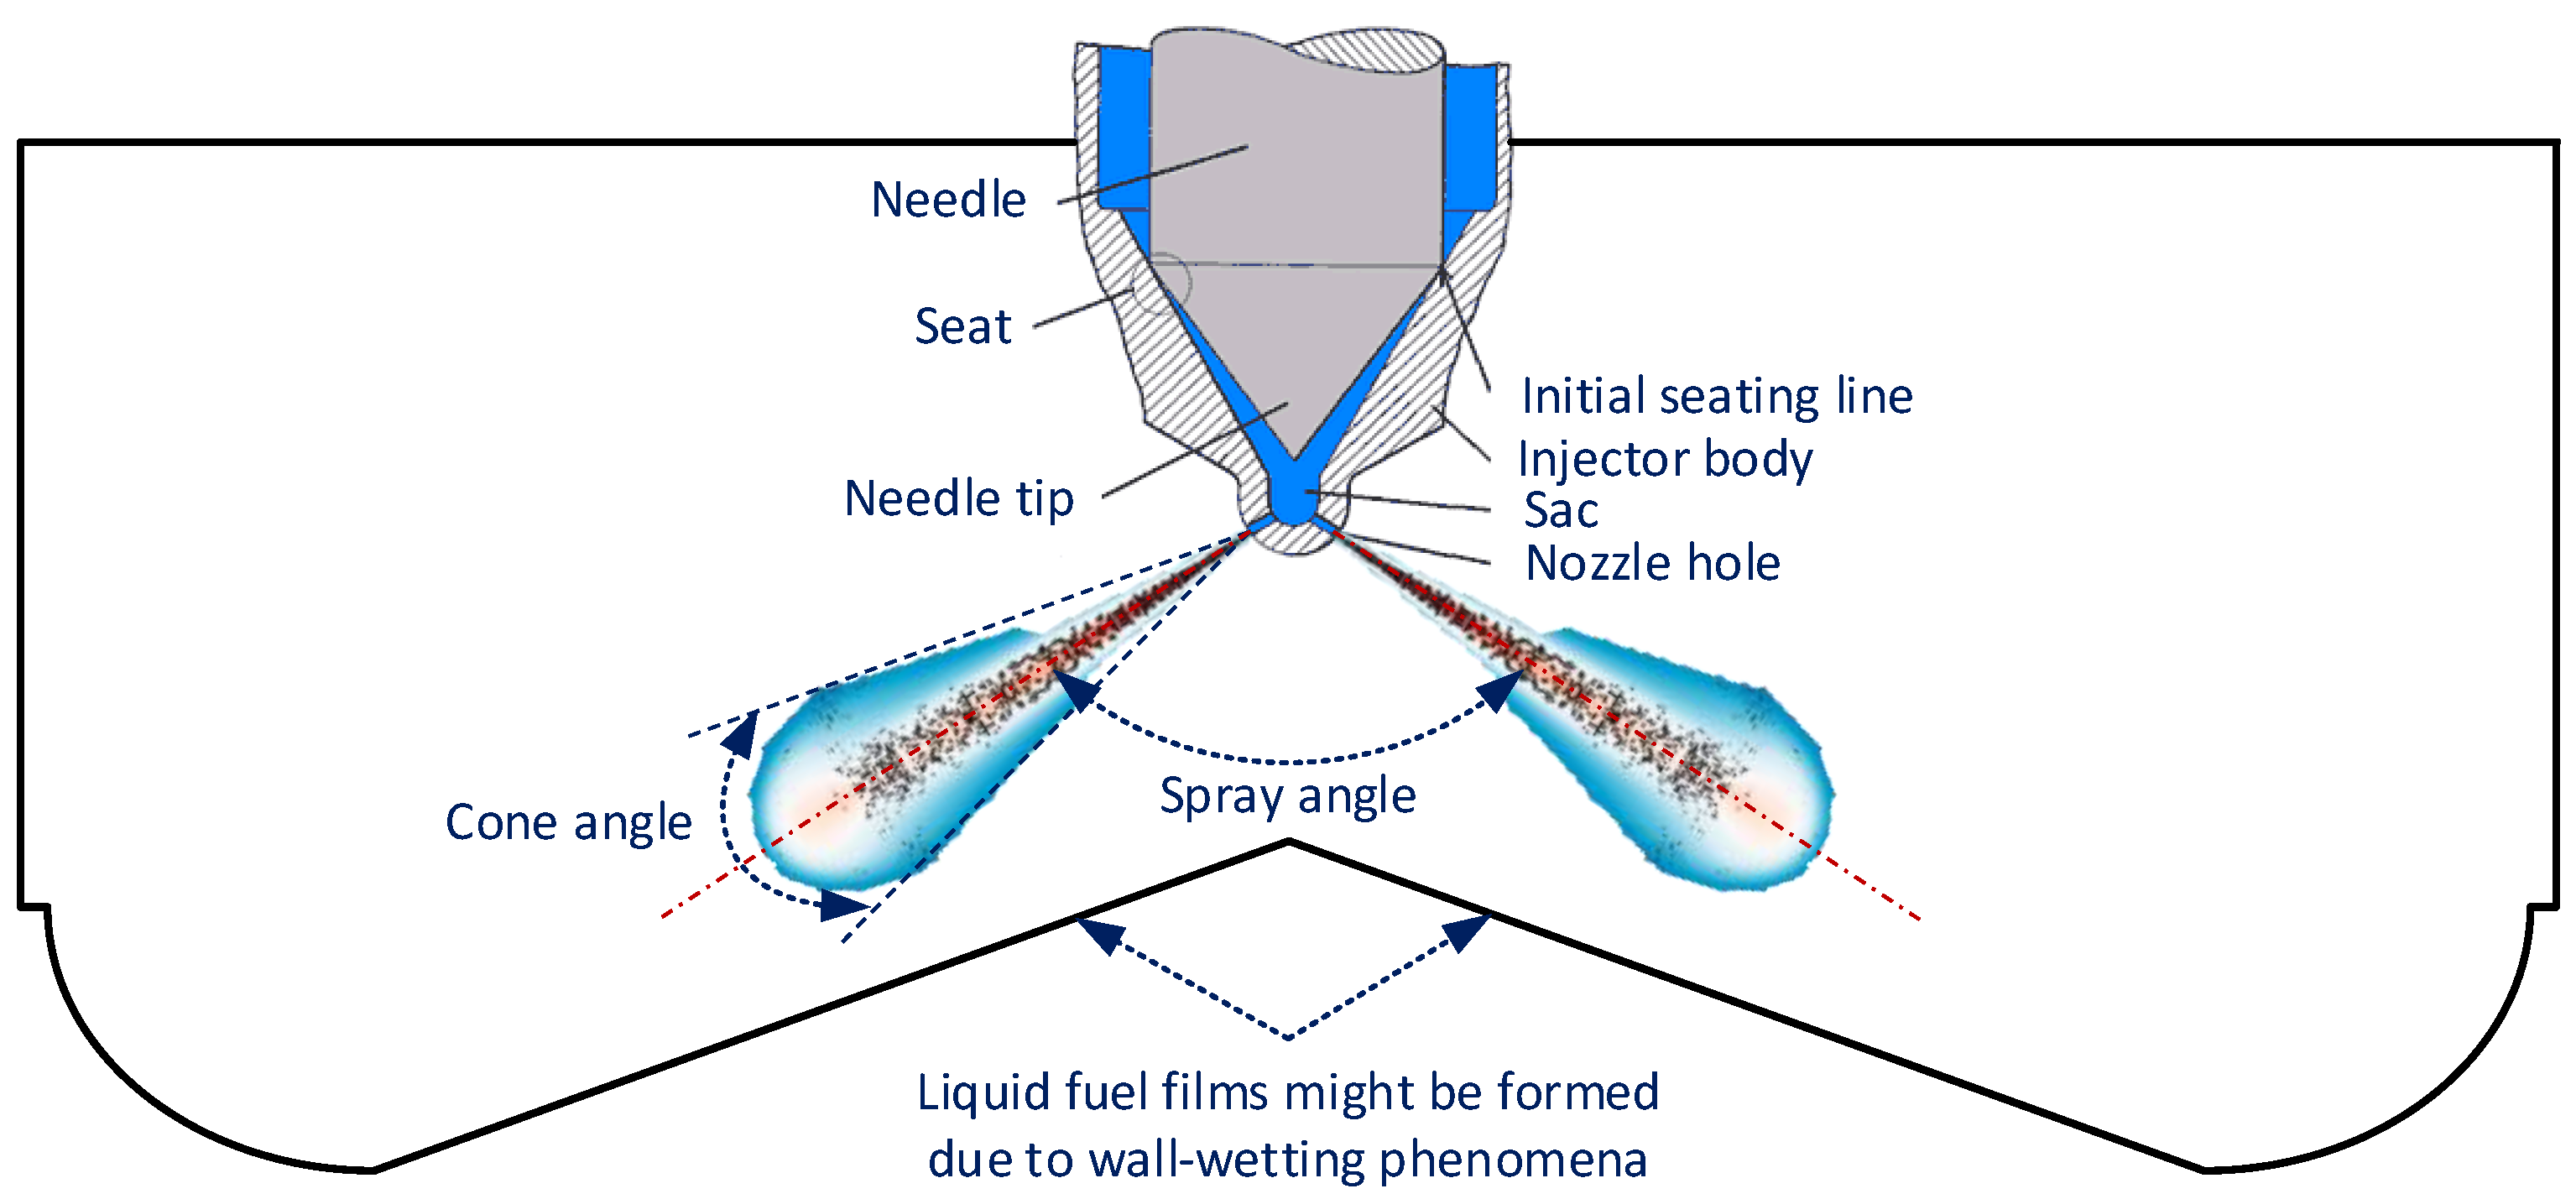
- It is important to note that this study investigated the effects of the injector SA on the combustion and emissions of the engine, without considering the effects of the piston bowl geometry. Actually, the mixing quality of the fuel-air mixture which strongly influences the combustion quality of the engine depends not only on the injector SA but also on the piston surface shape. Therefore, the optimal SA for the injector in this study is applicable to the engines with a ω-type piston surface shape only. For engines with other types of piston surface shapes, such as a U-type or re-entrant types, the optimal SA for the fuel injectors might be different.
Author Contributions
Funding
Institutional Review Board Statement
Informed Consent Statement
Data Availability Statement
Conflicts of Interest
Appendix A. Diesel Nozzle Flow Model

References
- Pallis, A.A. COVID-19 and maritime transport: Impact and responses. In Proceedings of the United Nations Conference on Trade and Development, Geneva, Switzerland, 3–7 October 2021. [Google Scholar]
- Thomson, H.; Corbett, J.J.; Winebrake, J.J. Natural gas as a marine fuel. Energy Policy 2015, 87, 153–167. [Google Scholar] [CrossRef]
- Wang, Z.; Zhou, S.; Feng, Y.; Zhu, Y. EGR modeling and fuzzy evaluation of Low-Speed Two-Stroke marine diesel engines. Sci. Total Environ. 2020, 706, 135444. [Google Scholar] [CrossRef]
- Bilgili, L. Life cycle comparison of marine fuels for IMO 2020 Sulphur Cap. Sci. Total Environ. 2021, 774, 145719. [Google Scholar] [CrossRef]
- Shu, J.; Fu, J.; Liu, J.; Ma, Y.; Wang, S.; Deng, B.; Zeng, D. Effects of injector spray angle on combustion and emissions characteristics of a natural gas (NG)-diesel dual fuel engine based on CFD coupled with reduced chemical kinetic model. Appl. Energy 2019, 233, 182–195. [Google Scholar] [CrossRef]
- Banapurmath, N.; Marikatti, M.K.; Hunashyal, A.; Tewari, P. Combustion characteristics of a four-stroke CI engine operated on Honge and Jatropha oil methyl ester–ethanol blends when directly injected and dual fuelled with CNG induction. Int. J. Sustain. Eng. 2011, 4, 145–152. [Google Scholar] [CrossRef]
- Decan, G.; Lucchini, T.; D’Errico, G.; Verhelst, S. A novel technique for detailed and time-efficient combustion modeling of fumigated dual-fuel internal combustion engines. Appl. Therm. Eng. 2020, 174, 115224. [Google Scholar] [CrossRef]
- Pham, V.C.; Choi, J.-H.; Rho, B.-S.; Kim, J.-S.; Park, K.; Park, S.-K.; Le, V.V.; Lee, W.-J. A numerical study on the combustion process and emission characteristics of a natural gas-diesel dual-fuel marine engine at full load. Energies 2021, 14, 1342. [Google Scholar] [CrossRef]
- Pham, V.C.; Rho, B.-S.; Kim, J.-S.; Lee, W.-J.; Choi, J.-H. Effects of various fuels on combustion and emission characteristics of a four-stroke dual-fuel marine engine. J. Mar. Sci. Eng. 2021, 9, 1072. [Google Scholar] [CrossRef]
- Faramawy, S.; Zaki, T.; Sakr, A.-E. Natural gas origin, composition, and processing: A review. J. Nat. Gas Sci. Eng. 2016, 34, 34–54. [Google Scholar] [CrossRef]
- Yang, B.; Wei, X.; Xi, C.; Liu, Y.; Zeng, K.; Lai, M.-C. Experimental study of the effects of natural gas injection timing on the combustion performance and emissions of a turbocharged common rail dual-fuel engine. Energy Convers. Manag. 2014, 87, 297–304. [Google Scholar] [CrossRef]
- Yousefi, A.; Birouk, M.; Guo, H. An experimental and numerical study of the effect of diesel injection timing on natural gas/diesel dual-fuel combustion at low load. Fuel 2017, 203, 642–657. [Google Scholar] [CrossRef]
- Yousefi, A.; Guo, H.; Birouk, M. An experimental and numerical study on diesel injection split of a natural gas/diesel dual-fuel engine at a low engine load. Fuel 2018, 212, 332–346. [Google Scholar] [CrossRef]
- Shu, J.; Fu, J.; Liu, J.; Zhang, L.; Zhao, Z. Experimental and computational study on the effects of injection timing on thermodynamics, combustion and emission characteristics of a natural gas (NG)-diesel dual fuel engine at low speed and low load. Energy Convers. Manag. 2018, 160, 426–438. [Google Scholar] [CrossRef]
- Ghomashi, H.; Olley, P.; Mason, B.A.; Ebrahimi, K.M. Simulating the influence of injection timing, premixed ratio, and inlet temperature on natural gas/diesel dual-fuel HCCI combustion in a diesel engine. Int. J. Powertrains 2015, 4, 36–52. [Google Scholar] [CrossRef]
- Ding, C.; Liu, W. Numerical simulation of emission characteristics for single-cylinder diesel engine. Energy Power Eng. 2016, 8, 92. [Google Scholar] [CrossRef]
- Wei, S.; Ji, K.; Leng, X.; Wang, F.; Liu, X. Numerical simulation on effects of spray angle in a swirl chamber combustion system of DI (direct injection) diesel engines. Energy 2014, 75, 289–294. [Google Scholar] [CrossRef]
- Heywood, J.B. Internal Combustion Engine Fundamentals; McGraw Hill Education: New York, NY, USA, 1998. [Google Scholar]
- Seol, J.-H.; Pham, V.C.; Lee, W.-J. Effects of the Multiple Injection Strategy on Combustion and Emission Characteristics of a Two-Stroke Marine Engine. Energies 2021, 14, 6821. [Google Scholar] [CrossRef]
- Kim, H.J.; Park, S.H.; Lee, C.S. Impact of fuel spray angles and injection timing on the combustion and emission characteristics of a high-speed diesel engine. Energy 2016, 107, 572–579. [Google Scholar] [CrossRef]
- Chin, S.T.; Lee, C.-F.F. Numerical investigation of the effect of wall wetting on hydrocarbon emissions in engines. Proc. Combust. Inst. 2002, 29, 767–773. [Google Scholar] [CrossRef]
- Sumanth, M.; Murugesan, S. Experimental Investigation of Wall Wetting Effect on Hydrocarbon Emission in Internal Combustion Engine. In Proceedings of the IOP Conference Series: Materials Science and Engineering, Bengaluru, India, 16–18 August 2018; IOP Publishing: Bristol, UK, 2022; p. 012029. [Google Scholar]
- Yoon, S.H.; Cha, J.P.; Lee, C.S. An investigation of the effects of spray angle and injection strategy on dimethyl ether (DME) combustion and exhaust emission characteristics in a common-rail diesel engine. Fuel Process. Technol. 2010, 91, 1364–1372. [Google Scholar] [CrossRef]
- Mobasheri, R.; Peng, Z. A Computational Investigation into the Effects of Included Spray Angle on Heavy-Duty Diesel Engine Operating Parameters; 0148-7191; SAE Technical Paper: Warrendale, PA, USA, 2012. [Google Scholar]
- Kim, J.-S.; Lee, W.-J.; Pham, V.C.; Choi, J.-H. A Numerical Study on Fuel Injection Optimization for a ME-GI Dual-Fuel Marine Engine Based on CFD Analysis. Appl. Sci. 2022, 12, 3614. [Google Scholar] [CrossRef]
- AVL FIRE R2018a; Combustion Module User Manual. AVL List GmbH: Graz, Austria, 2018.
- Park, S.W.; Reitz, R.D. Optimization of fuel/air mixture formation for stoichiometric diesel combustion using a 2-spray-angle group-hole nozzle. Fuel 2009, 88, 843–852. [Google Scholar] [CrossRef]
- Dolak, J.; Reitz, R. Optimization of the piston geometry of a diesel engine using a two-spray-angle nozzle. Proc. Inst. Mech. Eng. Part D J. Automob. Eng. 2011, 225, 406–421. [Google Scholar] [CrossRef]
- Taghavifar, H.; Taghavifar, H.; Mardani, A.; Mohebbi, A. Exhaust emissions prognostication for DI diesel group-hole injectors using a supervised artificial neural network approach. Fuel 2014, 125, 81–89. [Google Scholar] [CrossRef]
- Siewert, R.M. Spray Angle and Rail Pressure Study for Low NOx Diesel Combustion; 0148-7191; SAE Technical Paper: Warrendale, PA, USA, 2007. [Google Scholar]
- Kim, H.; Reitz, R.D.; Kong, S.-C. Modeling Combustion and Emissions of HSDI Diesel Engines Using Injectors with Different included Spray Angles; 0148-7191; SAE Technical Paper: Warrendale, PA, USA, 2006. [Google Scholar]
- Eder, L.; Ban, M.; Pirker, G.; Vujanovic, M.; Priesching, P.; Wimmer, A. development and validation of 3D-CFD injection and combustion models for dual fuel combustion in diesel ignited large gas engines. Energies 2018, 11, 643. [Google Scholar] [CrossRef]
- Candel, S.; Veynante, D.; Lacas, F.; Maistret, E.; Darabiha, N.; Poinsot, T. Coherent flamelet model: Applications and recent extensions. In Recent Advances in Combustion Modelling; World Scientific: Singapore, 1991; pp. 19–64. [Google Scholar]
- AVL FIRE R2018a; Spray Module User Manual. AVL List GmbH: Graz, Austria, 2018.
- AVL FIRE R2018a; Emission Module User Manual. AVL List GmbH: Graz, Austria, 2018.
- Monsalve-Serrano, J.; Belgiorno, G.; Di Blasio, G.; Guzmán-Mendoza, M. 1D simulation and experimental analysis on the effects of the injection parameters in methane–diesel dual-fuel combustion. Energies 2020, 13, 3734. [Google Scholar] [CrossRef]
- Polk, A.C.; Carpenter, C.D.; Srinivasan, K.K.; Krishnan, S.R. An investigation of diesel–ignited propane dual fuel combustion in a heavy-duty diesel engine. Fuel 2014, 132, 135–148. [Google Scholar] [CrossRef]
- Sahoo, B.; Sahoo, N.; Saha, U. Effect of engine parameters and type of gaseous fuel on the performance of dual-fuel gas diesel engines—A critical review. Renew. Sustain. Energy Rev. 2009, 13, 1151–1184. [Google Scholar] [CrossRef]
- Kuo, K.K. Principles of Combustion; Wiley: Hoboken, NJ, USA, 1986. [Google Scholar]
- Pang, K.M.; Jangi, M.; Bai, X.-S.; Schramm, J.; Walther, J.H. Modelling of diesel spray flames under engine-like conditions using an accelerated Eulerian Stochastic Field method. Combust. Flame 2018, 193, 363–383. [Google Scholar] [CrossRef]
- Wei, L.; Geng, P. A review on natural gas/diesel dual fuel combustion, emissions and performance. Fuel Process. Technol. 2016, 142, 264–278. [Google Scholar] [CrossRef]
- Pham, V.C.; Kim, H.; Choi, J.-H.; Nyongesa, A.J.; Kim, J.; Jeon, H.; Lee, W.-J. Effectiveness of the Speed Reduction Strategy on Exhaust Emissions and Fuel Oil Consumption of a Marine Generator Engine for DC Grid Ships. J. Mar. Sci. Eng. 2022, 10, 979. [Google Scholar] [CrossRef]
- Maricq, M.M.; Chase, R.E.; Xu, N.; Laing, P.M. The effects of the catalytic converter and fuel sulfur level on motor vehicle particulate matter emissions: Light duty diesel vehicles. Environ. Sci. Technol. 2002, 36, 283–289. [Google Scholar] [CrossRef] [PubMed]
- Burnett, R.T.; Cakmak, S.; Brook, J.R.; Krewski, D. The role of particulate size and chemistry in the association between summertime ambient air pollution and hospitalization for cardiorespiratory diseases. Environ. Health Perspect. 1997, 105, 614–620. [Google Scholar] [CrossRef] [PubMed]
- Mačković, M. Characterization of Soot Particles from Diesel Engines and Tin Dioxide Particles Milled in Stirred Media Mills; Friedrich-Alexander-Universitaet Erlangen-Nuernberg: Erlangen, Germany, 2012. [Google Scholar]
- Kittelson, D.; Watts, W.; Johnson, J. On-road and laboratory evaluation of combustion aerosols—Part1: Summary of diesel engine results. J. Aerosol Sci. 2006, 37, 913–930. [Google Scholar] [CrossRef]
- Nurick, W. Orifice cavitation and its effect on spray mixing. J. Fluids Eng. 1976, 98, 681–687. [Google Scholar] [CrossRef]
- von Kuensberg Sarre, C.; Kong, S.-C.; Reitz, R.D. Modeling the effects of injector nozzle geometry on diesel sprays. SAE Trans. 1999, 108, 1375–1388. [Google Scholar]


| Parameter | Value | Unit |
|---|---|---|
| Engine type | 4-Stroke DF Engine | |
| No. of cylinders | 6 | |
| Gas supplying method | Port-Injection | |
| Ignition | Diesel Direct Injection | |
| Compression ratio | 13.5:1 | |
| Cylinder bore Stroke | 350 400 | mm |
| Rated power | 2880 | kW |
| Rated speed | 720 | rpm |
| IMEP | 20 | Bar |
| Boundary Condition | Boundary Type/Specific Condition |
|---|---|
| Cylinder head | Fixed wall/Temp./297 °C |
| Cylinder liner | Layering wall/Temp./197 °C |
| Piston surface | Mesh movement/Temp./297 °C |
| Segment-cut surfaces | Periodic |
| Initial Conditions | Values |
| Temperature at IVC | 47 °C |
| Pressure at IVC | 3.5 bar |
| Swirl/Tumble | |
| IVC | 35 CADs ABDC |
| EVO | 62 CADs BBDC |
| PSOI | 12 CADs BTDC |
| Pilot injection duration | 7.5 milliseconds (Diesel mode) |
| 2.35 milliseconds (DF mode) |
| SA | 145° | 150° | 155° | 160° |
|---|---|---|---|---|
| Diesel Mode | Di-145 | Di-150 | Di-155 | Di-160 |
| DF Mode | DF-145 | DF-150 | DF-155 | DF-160 |
| Model | Description | |
|---|---|---|
| Turbulence | k-𝜁-f | |
| Combustion | Extended coherent flame models (ECFM) | |
| Emissions | Thermal NO | Extended Zeldovich mechanism |
| Soot | Kinetic soot mechanism | |
| Pilot ignition | Diesel mode | Auto-ignition |
| DF mode | Diesel-ignition-gas-engine | |
| Pilot fuel atomizations | Breakup | WAVE model |
| Evaporation | Dukowicz (Diesel mode) | |
| Multi-component (DF mode) | ||
| Droplets–Walls interactions | Walljet1 | |
| Mesh Resolution | Coarse | Medium | Fine |
|---|---|---|---|
| No. of faces of the 2D mesh at the TDC | 12,949 | 17,715 | 39,307 |
| No. of cells of the 3D mesh at the BDC | 586,796 | 882,620 | 1,593,732 |
| Calculation time | 24 h | 36 h | 92 h |
Publisher’s Note: MDPI stays neutral with regard to jurisdictional claims in published maps and institutional affiliations. |
© 2022 by the authors. Licensee MDPI, Basel, Switzerland. This article is an open access article distributed under the terms and conditions of the Creative Commons Attribution (CC BY) license (https://creativecommons.org/licenses/by/4.0/).
Share and Cite
Pham, V.C.; Le, V.V.; Yeo, S.; Choi, J.-H.; Lee, W.-J. Effects of the Injector Spray Angle on Combustion and Emissions of a 4-Stroke Natural Gas-Diesel DF Marine Engine. Appl. Sci. 2022, 12, 11886. https://doi.org/10.3390/app122311886
Pham VC, Le VV, Yeo S, Choi J-H, Lee W-J. Effects of the Injector Spray Angle on Combustion and Emissions of a 4-Stroke Natural Gas-Diesel DF Marine Engine. Applied Sciences. 2022; 12(23):11886. https://doi.org/10.3390/app122311886
Chicago/Turabian StylePham, Van Chien, Van Vang Le, Siljung Yeo, Jae-Hyuk Choi, and Won-Ju Lee. 2022. "Effects of the Injector Spray Angle on Combustion and Emissions of a 4-Stroke Natural Gas-Diesel DF Marine Engine" Applied Sciences 12, no. 23: 11886. https://doi.org/10.3390/app122311886
APA StylePham, V. C., Le, V. V., Yeo, S., Choi, J.-H., & Lee, W.-J. (2022). Effects of the Injector Spray Angle on Combustion and Emissions of a 4-Stroke Natural Gas-Diesel DF Marine Engine. Applied Sciences, 12(23), 11886. https://doi.org/10.3390/app122311886