Article

MRI Assessment of the Bi-Leaflet Mechanical Heart Valve: Investigating the EOA Using the Acoustic Source Term Method

1
Laboratoire de Biomécanique Appliquée-UMRT24, 13916 Marseille, France
2
Laboratoire DRIVE EA1859, Univ. Bourgogne Franche-Comté, 58000 Nevers, France
3
Siemens Healthineers, 91058 Erlangen, Germany
4
School of Chemical and Biomolecular Engineering, The University of Sydney, Sydney, NSW 2006, Australia
5
Imaging and Phenotyping Laboratory, Faculty of Medicine and Health, The University of Sydney, Sydney, NSW 2006, Australia
6
Laboratoire ImViA-Laboratoire de Biophysique, Faculté de Médecine, Université de Bourgogne, 21079 Dijon, France
7
Medical Imaging Department, University Hospital of Dijon, 21079 Dijon, France
*
Author to whom correspondence should be addressed.
Appl. Sci. 2022, 12(22), 11771; https://doi.org/10.3390/app122211771
Submission received: 27 September 2022 / Revised: 12 November 2022 / Accepted: 17 November 2022 / Published: 19 November 2022

Abstract

:

Featured Application

This work provides insight into how MRI patient data can be used to estimate how well an artificial heart valve is functioning in terms of the effective flow area.

Abstract

Background: This work aims at defining the Effective Orifice Area (EOA) derived from the acoustic source term (AST) method from 4D Phase-Contrast MRI data to provide a reference for the assessment of MRI valvular prostheses as part of a comprehensive cardiac exam. Methods: Three different Bileaflet Mechanical Heart Valves (BMHV) and a dysfunctional BMHV were tested in-vitro using 4D Phase-Contrast MRI and a numerical design of the experimental study was performed, including the influence of internal diameter, stroke volume, and heart rate. The EOA AST was computed based on the MRI 4D Phase-Contrast acquisition. Results: EOAAST values vary by 15 mm from the BMHV center and should be computed between 8 to 10 mm after the metallic “blurring” artefact (ranging from 18.9 to 23.4 mm from the BMHV). EOAAST values were found to be lower compared with numerical results in the appropriate plane. Detection of the BMHV dysfunction by continuity equation computed from 4D flow acquisition is limited based on EOAAST computations, while EOAc and velocities after the valves could more directly highlight a blocked leaflet. Conclusion: This multi-disciplinary study demonstrates the suitability of the EOA AST method to assess BMHV function using MRI. Translation to the clinic is feasible using an optimized 2D Phase-Contrast flow stack or a 4D Phase-Contrast minimal volume based on the recommendations provided.

1. Introduction

Despite the dramatic increase in the number of implantations of bioprostheses using the valve-in-valve method, aortic valve replacement using Bileaflet Mechanical Heart Valves (BMHV) still represents 20% of the aortic valve replacement procedures in the USA [1]. However, the durability of bioprostheses has been questioned, and patients with bioprosthesis aortic valve replacement have a higher risk of reoperation and endocarditis compared with patients receiving BMHV [2]. Noninvasive evaluation is, therefore, critical, and the gold standard in the heart valvular prosthesis assessment is echocardiography. However, in the past decade, assessment of heart valves has been increasingly performed using Magnetic Resonance Imaging as part of a routine cardiac examination [3].
Echocardiographic criteria for the assessment of valvular prosthesis are mostly based on effective orifice area (EOA) and transvalvular pressure gradient [4]. EOA computation is performed from stroke volume measurement and from Doppler continuous wave velocity measurements through the valve location. Using the continuity equation, the EOA should be computed at the vena contracta of the valve, which is the contracted area formed by the flow when going through an orifice [5].
MRI, in addition to providing the capacity to assess the cardiac function, also enables measurement of velocity fields during the cardiac cycle through a 4D Phase-Contrast flow sequence [6], while metallic blurring still limits the study of metallic structured prostheses. Limitations of the 4D Phase-Contrast flow measurements also arise from the temporal resolution and acquisition time. A model of the prosthesis will generate a different blur of the valve depending upon the composition of the alloy of the valve. As far as we know, no study addressed the distance from the prosthesis orifice at which the acquisition of the velocity time integral (VTI) is performed or the length of the blur due to the valve structure. Then, cardiac magnetic resonance is reported to have limited interest in the diagnostic evaluation of left-sided prosthetic heart dysfunction in comparison with other techniques, such as multidetector-row CT, fluoroscopy, or echocardiography [7].
A specific single-point ramped imaging with T1 enhancement (SPRITE) MRI sequence was used to investigate flow through a BMHV [8]. This technique used the axial velocity component through the BMHV to diagnose dysfunction of the valve and is reported to be immune to magnetic susceptibility. In the case of a BMHV, the orifice is divided into three parts, and the blood divides into three contracted jets after the orifice. BMHV manufacturers provide the diameter of the internal orifice and valve label. However, those labels cannot be used for comparison between models [4]. Geometric orifice area (GOA) has been computed from MRI before [9,10]. The main functional assessment for BMHV consists of computing the EOA and the transvalvular pressure gradient, as well as checking the motion of the leaflets. Echocardiographic guidelines [11] have been reported to show discrepancies between EOA computation given by echo guidelines and the real EOA. As a result, clinicians look at the changes in the measured EOA value more than at the value itself [11].
Dysfunction of the BMHV is due to pannus formation, which limits the opening and closing of the leaflets. Fluoroscopy of the valve could provide the necessary assessment of the leaflet motions but is not able to assess the hemodynamics. Additionally, multi-detector-row computed tomography would also be a good alternative for the detection of prosthesis obstruction [12]. Moreover, a drastic reduction of EOA would provide an indication of obstruction. Therefore, this study aims to provide an EOA measurement able to detect any blocked leaflet, which is meaningful to compare with the orifice shape and geometrical area.
This work uses 4D Phase-Contrast -flow and Computational Fluid Dynamics to define the location of the vena contracta compared with the center of the valve, to quantify the BMHV metallic blurring expected in 4D Phase-Contrast measurements and to assess the previously defined EOAAST method to enhance BMHV functional assessment by MRI. More specifically, it aims: (1) to compare the computation of BMHV EOA by MRI using a derived echocardiography continuity equation-based method and an AST method, (2) to quantify the MR signal alteration created by the valve, and (3) to evaluate its consequence on EOA measurements as related to the MRI capacity to detect the vena contracta.

2. Materials and Methods

2.1. Experimental Setup

Testing of two BHMV with different diameters (23 mm and 25 mm) for one model (St Jude Medical, St. Paul, MN, USA), for one BMHV for another model (ONX, CryoLife, GA, USA—29 mm diameter), and for BMHV dysfunction as a blocked leaflet was performed. A summary of the tested valves can be found in Table 1.
Details of the MRI-compatible in-vitro system used for this experiment can be found in the study of Wang et al. [13] (see Figure 1). Briefly, a pulsed pump is placed outside the MRI environment. The valve is fixed in two cylindrical parts by two plastic supports, enabling the suture annulus of the valve to be held and providing sufficient space after the valve for the blood to flow in a similar shape to that in the aorta (progressive reduction of the diameter as in vasalva sinus while not reproducing the anatomy of the sinus due to using a cylindrical reduction symmetrical in all directions).
The fluid used to mimic the blood is a water glycerol solution based on the work of Cheng [14]. The pump flow command was set to target a 5 L/min cardiac output, and the pulsed flow profile was fixed as a physiological aortic flow-shaped waveform with a 70 bpm frequency. The pressure was measured using a PR21SR/80444.3-1 pressure sensor (Keller AG, Winterthur, Switzerland) and National Instrument acquisition card (National Instrument, Austin, TX, USA) both before and after the prosthesis.
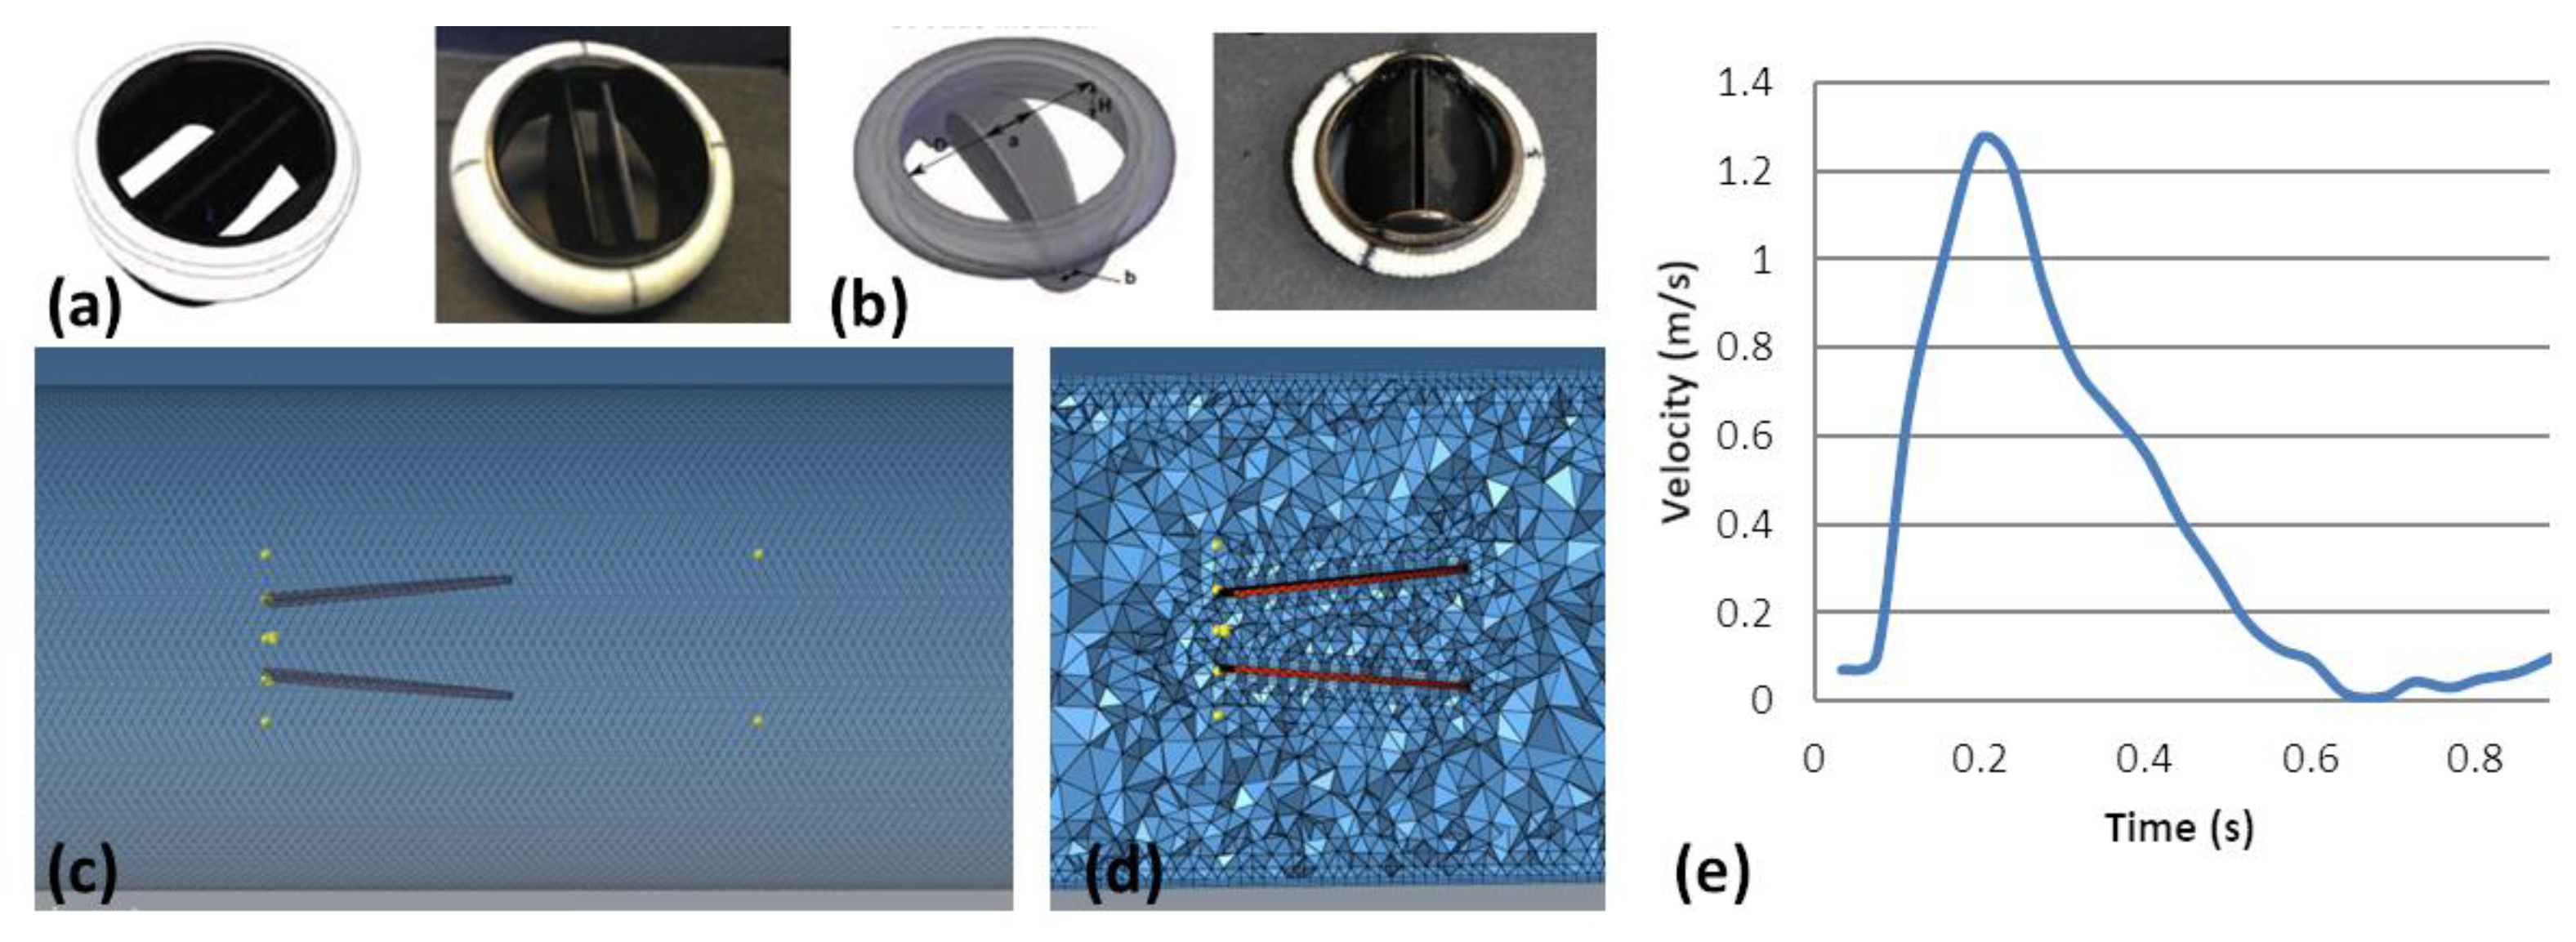
Tested BMHVs are summarized in Table 2. The OnX model has a 90° leaflet opening, a height of 14.7 mm (label 21) and 17.8 mm (label 29), and the shape of the hinge region is an ‘eight’ or infinity symbol shape. The St Jude Medical model has an 85° leaflet opening, a height of 12.5 mm to 13.9 mm, and a hinge region shaped like a round butterfly (Figure 2). A simulation of BMHV dysfunction was performed by blocking one of the leaflets of the bi-leaflet valve with a suture wire without preventing the closing of the other leaflet.

2.2. Numerical Simulation

Instead of modeling each BMHV model from the manufacturer’s provided data and including other BMHV not included in this study, a sensitivity analysis was performed to quantify the BMHV design parameters (the leaflet opening angle, leaflet distance, and diameter) and patient hemodynamics (stroke volume and heart rate). In order to compare the results from the simulation with the tested BMHV, measurements of the orifice size, height, leaflet spacing, and thickness are provided (Table 2). For display only, St Jude BMHV and OnX were designed for each diameter, with size modifications made using FreeCAD (open source license). The inflow boundary condition was defined at the entry of a tube located 5 diameters upstream of the leaflet entry to ensure a parabolic velocity profile. The outflow was also located after a similar downstream length.
Numerical simulations were performed using AcuSolve Software (Altair Engineering, Troy, MI, USA). The BMHV is considered stationary, being maintained in a fully opened state, and 10 cycles were simulated using the results of the 10th cycle for post-processing. A Newtonian fluid (viscosity of 0.0038 Pa.s and density of 1050 kg/m3 for a blood temperature of 37.0 °C) was used. The transient inflow boundary condition is provided in (Figure 2e) by applying a user function and a flat profile. The meshes comprised 408,000 to 4,210,000 elements (Figure 2c,d). Mesh size analysis was run on four mesh sizes (0.3, 0.5, 0.7, and 0.9 mm), and three fluid layers of 0.5 mm were defined at the wall and around the leaflet. The mesh size analysis aims at finding the mesh size for which the change in results between different mesh size simulations is below 3%. The influence of the blocked leaflet was tested with similar boundary conditions and settings. Simulation parameters are listed in Table 3 as the design of the experiment of 17 simulations.

2.3. MRI Acquisition and Post-Processing

MRI acquisition included a multi VENC 4D Phase-Contrast flow acquisition on 3T Siemens magnet (Trio TIM, Siemens Medical Solutions, Erlangen, Germany) with the following settings: TE: 2.83–3.65 ms, TR: 12.85–26.36 ms, encoding velocities: 260–310 cm/s, pixel spacing: 0.78–0.94 mm, slice thickness: 2.5–3 mm. 2D Phase-Contrast was also performed at the inlet and outlet of the BMHV.
Pre-processing includes: (1) aliasing correction and eddy current correction of the 4D Phase-Contrast flow acquisition using the dedicated 4D flow demonstrator Siemens software with background corrections and phase aliasing modification, (2) VTK format transformation using Matlab script (Mathworks, Natik, MA, USA), and (3) AST computation using python and Paraview software (Kitware, Clifton Park, NY, USA and Los Alamos National Laboratory, New Mexico, USA). Segmentation of the volume of interest was performed using the maximum intensity projection.
Assessment of the MRI signal alteration induced by the mechanical structure of the valve was performed at the center of the valve (symmetry plane) and at the distal location between the two volumes created by the blurring effect.
Comparison with numerical results was performed for analysis of the influence of BMHV design: OnX29 versus SJM25 (similar internal diameters: 23.4 versus 23 mm and opening angle 90° and 85°), of the influence of inner diameter: SJM25 and SJM23 (internal diameters 23 versus 21.4 mm) and of the influence of a blocked leaflet on SJM25.

2.4. EOA Computation

EOA was assessed using the continuity equation (stroke volume/velocity-time integral: EOAc = SV/VTIVmax) and acoustic source term (EOAAST) computation.

2.4.1. Continuity EOA Computation

The computation of the EOA by the continuity equation method is based on the hypothesis that the time-integrated velocity (VTI) is taken at the vena contracta (VC’) after the orifice, i.e., at the maximum velocity. To match the echocardiography methodology, the plane at which the velocity was maximal was computed from both numerical and MRI-derived velocity fields. Thus, EOA was computed as
E O A = A L V O T · V T I L V O T V T I V C = S V V T I V C ,
with the stroke volume ( S V ), taken at the left ventricle outflow track (LVOT) in echography, and taken here at the outflow. The coefficient of contraction between EOA and geometric orifice area is defined as the ratio between these two areas [15].

2.4.2. AST Computation and EOAAST Measurement

When translated to MRI on a native valve [16], EOA was computed from the flow computed on a plane placed using the cine MRI anatomical images. When computed from 2D Phase-Contrast MRI images, the location of the plane through the cardiac cycle is fixed. In echocardiography, the probe itself moves with the thorax, while the targeting measured area is fixed in the motion of the heart itself. In continuous wave Doppler, it is fine as the maximum velocity is taken from the beam. It will not miss the maximum velocity while not defining the exact plane where the maximum velocity occurs. In MRI and in accord with Gorlin`s EOA hypothesis [17], the location of this maximum velocity downstream of the BMHV should be targeted for the EOA computation. The acoustic source term (AST) method was previously used for aortic stenosis EOA computation by MRI [16,18]. Such computation from echocardiographic measurements is not possible as echography does not provide the three components of the velocity (at least not for basic echocardiography in the clinical context), which are necessary for such a computation.
From the vortex sound theory described by Powell [19] and Howe [20], the AST method has been used for the computation of the EOA of a valve in the context of aortic stenosis [16,18]. The assumptions for the computation are listed by Kadem et al. [16] as incompressible and homentropic fluid, high Reynolds number, neglect of viscous effects, and absence of a source of matter. Thus the computation of AST is performed as follows [20]:
AST = · ( ω   ^   V ) ,
with the vorticity
ω = ( V z y V y z V x z V z x V y x V x y ) = ( ω x ω y ω z ) ,
and
ω   ^   V = ( ω y V z ω z V y ω z V x ω x V z ω x V y ω y V x ) ,
Computation of the EOAAST was performed along planes perpendicular to the flow from the outflow of the BMHV to 28 mm away from the outflow every 2 mm. Automatic detection of the EOAAST was performed using thresholding (highest 50th percentile of the AST distribution—see Figure 3).

2.5. Statistical Analysis

Analysis of the numerical results included the influence of BMHV design parameters (leaflet opening angle, diameter, distance between leaflets), hemodynamic parameters (stroke volume, heart rate), and dysfunction. Differences were considered statistically significant for p < 0.05 . The correlation coefficient ( r ) was used for statistical analysis, including the Wilcoxon test.

3. Results

3.1. Numerical Simulations

Analysis of the mesh size shows for the mesh size of 0.9 mm and 0.7 mm, a reduction by 40% and 1.4% of the EOAAST value was observed, respectively, when compared with the 0.5 mm mesh size. The mesh size of 0.5 mm was therefore used.

3.1.1. Prosthesis Design and Patient Haemodynamic Parameters

The influence of the BMHV leaflet opening angle and hemodynamics on EOAAST computation is depicted in Figure 4. While HR shows a low influence on EOAAST results, the BMHV design (leaflets opening angle and internal diameter) interplay results in a variable change in EOAAST results ( p non-significant—see Figure 4). The influence of the opening angle is found to be significant for the internal diameter of 22 and 24 mm ( p < 0.01 ). Additionally, the difference in EOA AST between 70 and 120 mL and 90 and 120 mL was found to be significant ( p < 0.002 ).

3.1.2. EOA Computation—Distance to Center

Numerical results show that EOAAST is changing along the distance to outflow as the velocity changes due to recovery to fully-developed flow (see Figure 5). The plane on which the EOAAST reaches a constant value depends on both BMHV design parameters and the hemodynamics of the patient (see Table 3). EOAAST values vary by 15 mm from the BMHV center and should be computed between 8 to 10 mm after the metallic “blurring” artefact (ranging from 18.9 to 23.4 mm from the BMHV).

3.2. 4D Phase-Contrast Flow measurements

The computation of the BMHV blurring effect shows that this effect varies depending on the BMHV model and on the condition of the BMHV (dysfunction or not, see Table 3) along and around the whole volume occupied by the valve.
Pressure measurements resulted in a maximum 346.5 mmHg difference between inflow and outflow for OnX, 195 mmHg for SJM open, and 262.5 mmHg for blocked SJM25.
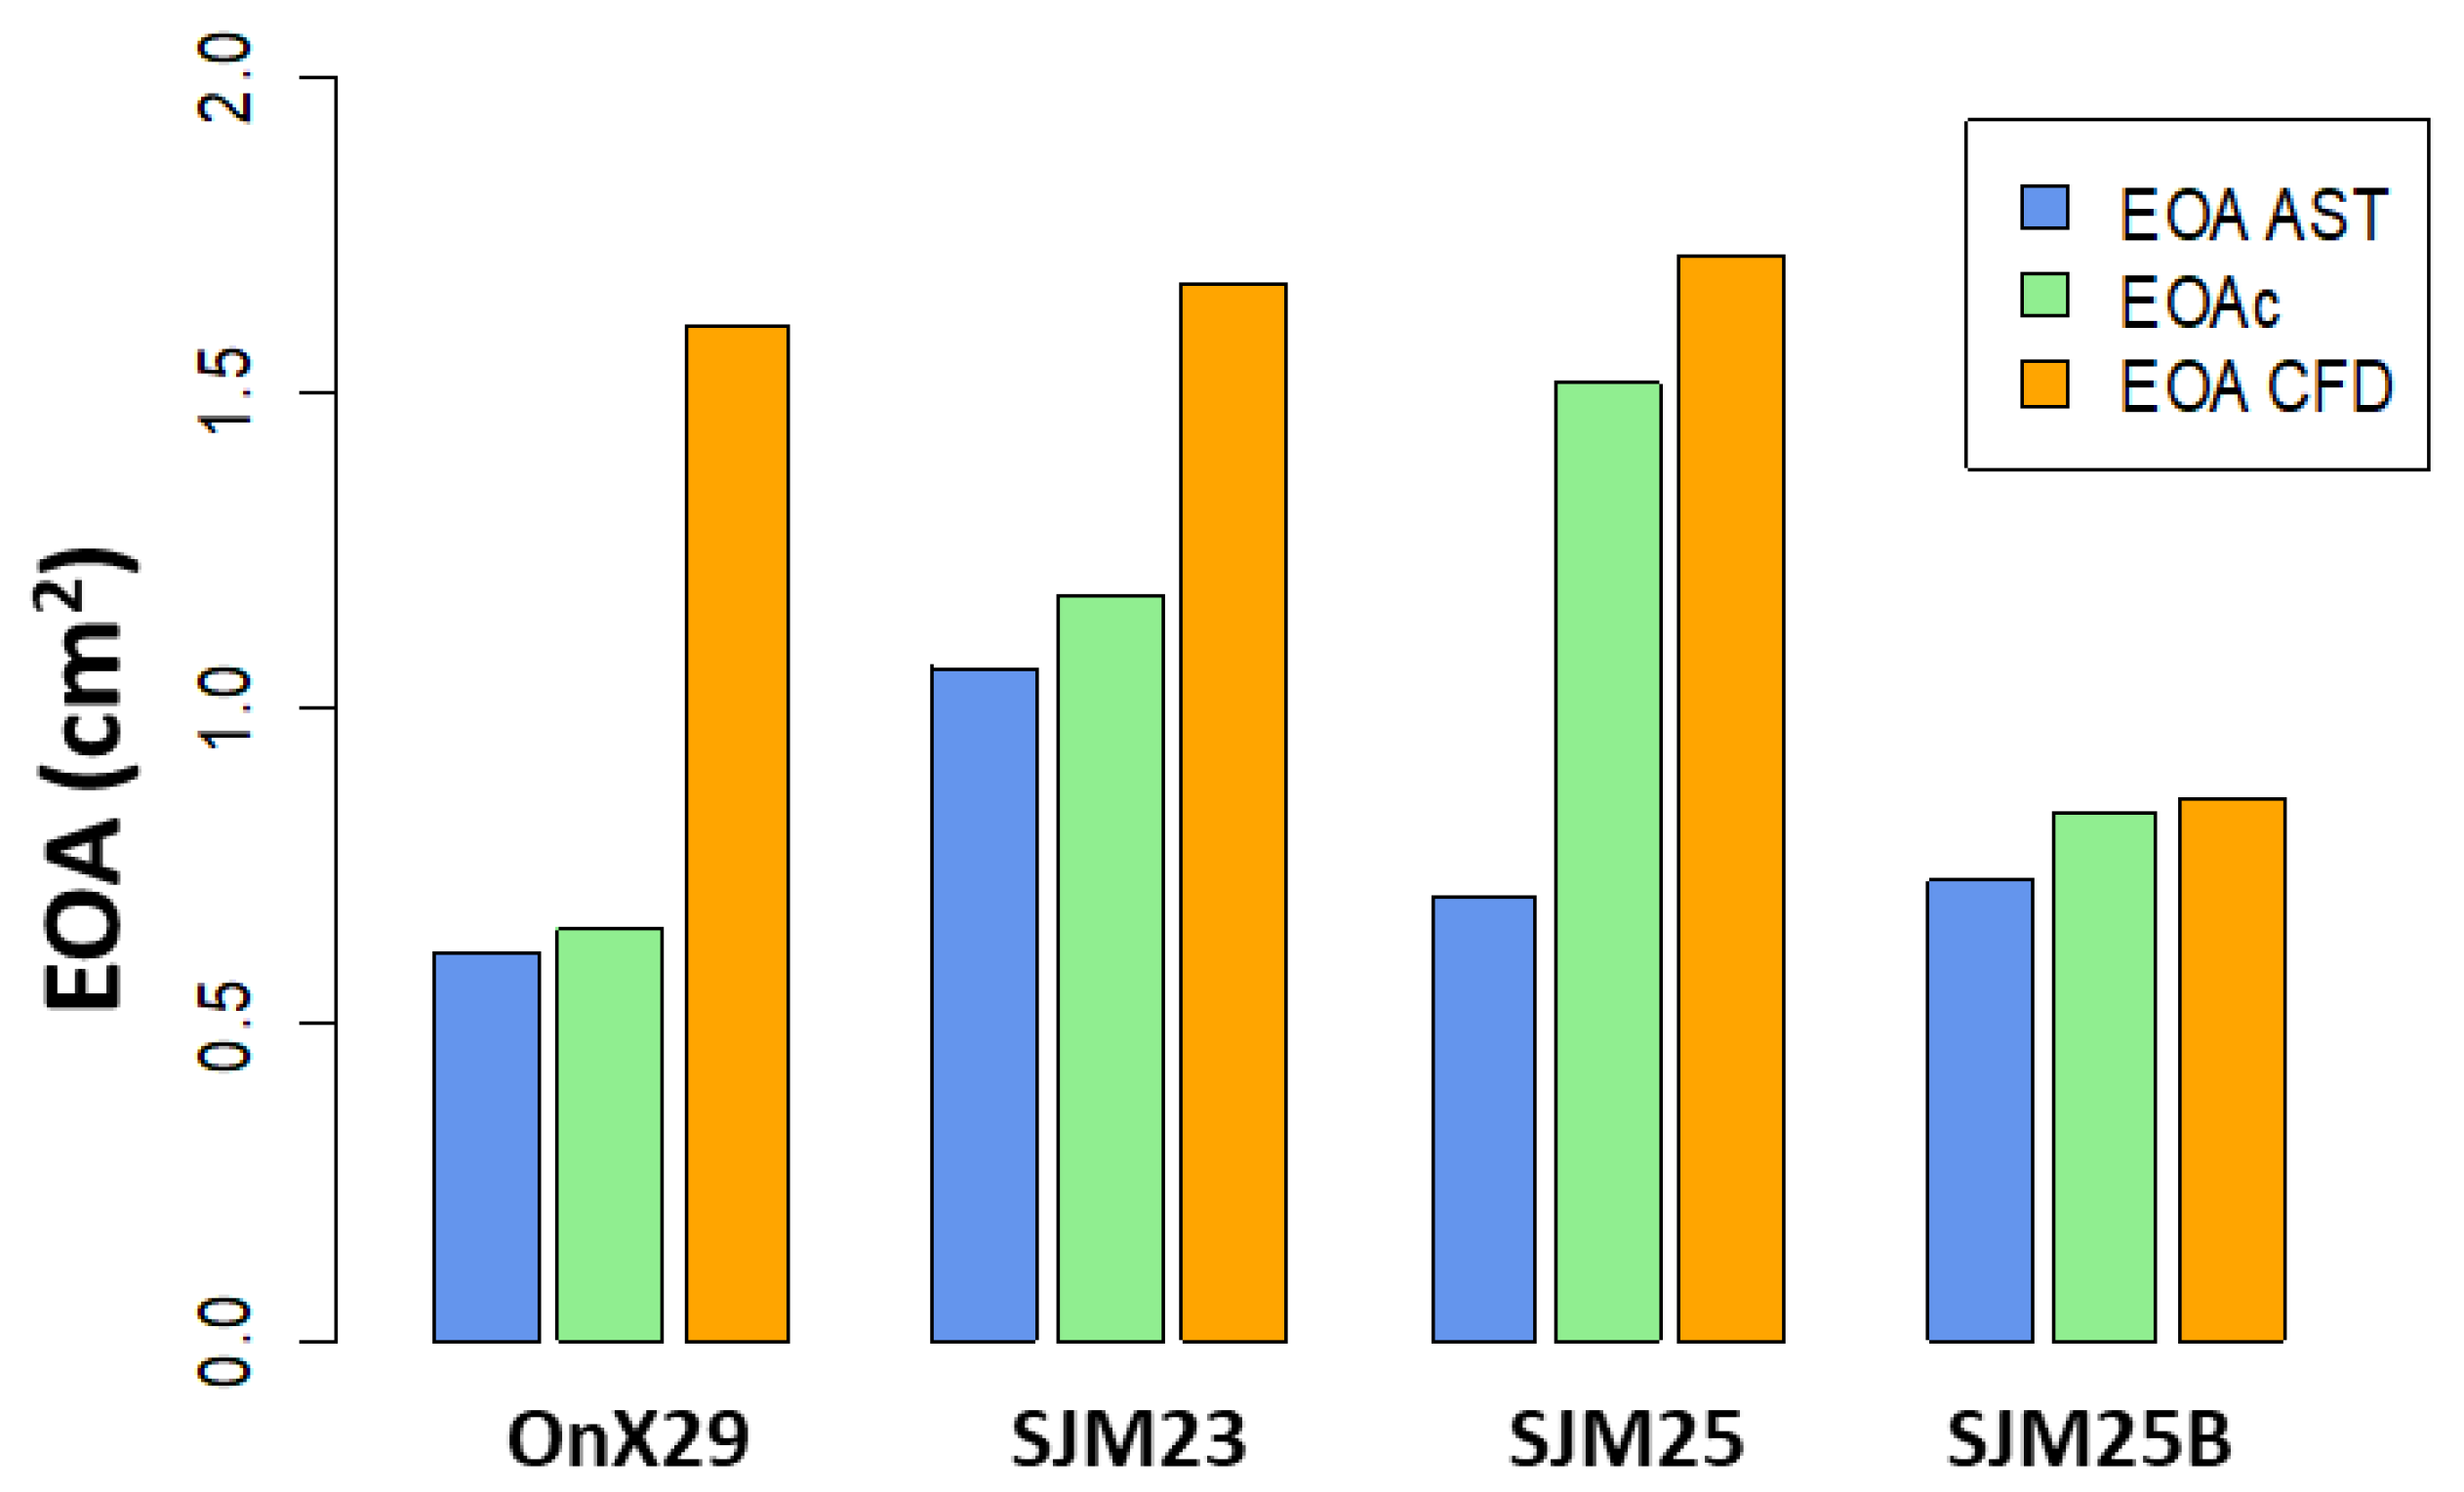
The variability of the EOAAST computation is limited along the planes perpendicular to the outflow and distance to the outflow after the blurring effect (see Figure 5). EOAAST values were found to be lower compared with the numerical result in the appropriate plane (see Figure 6).
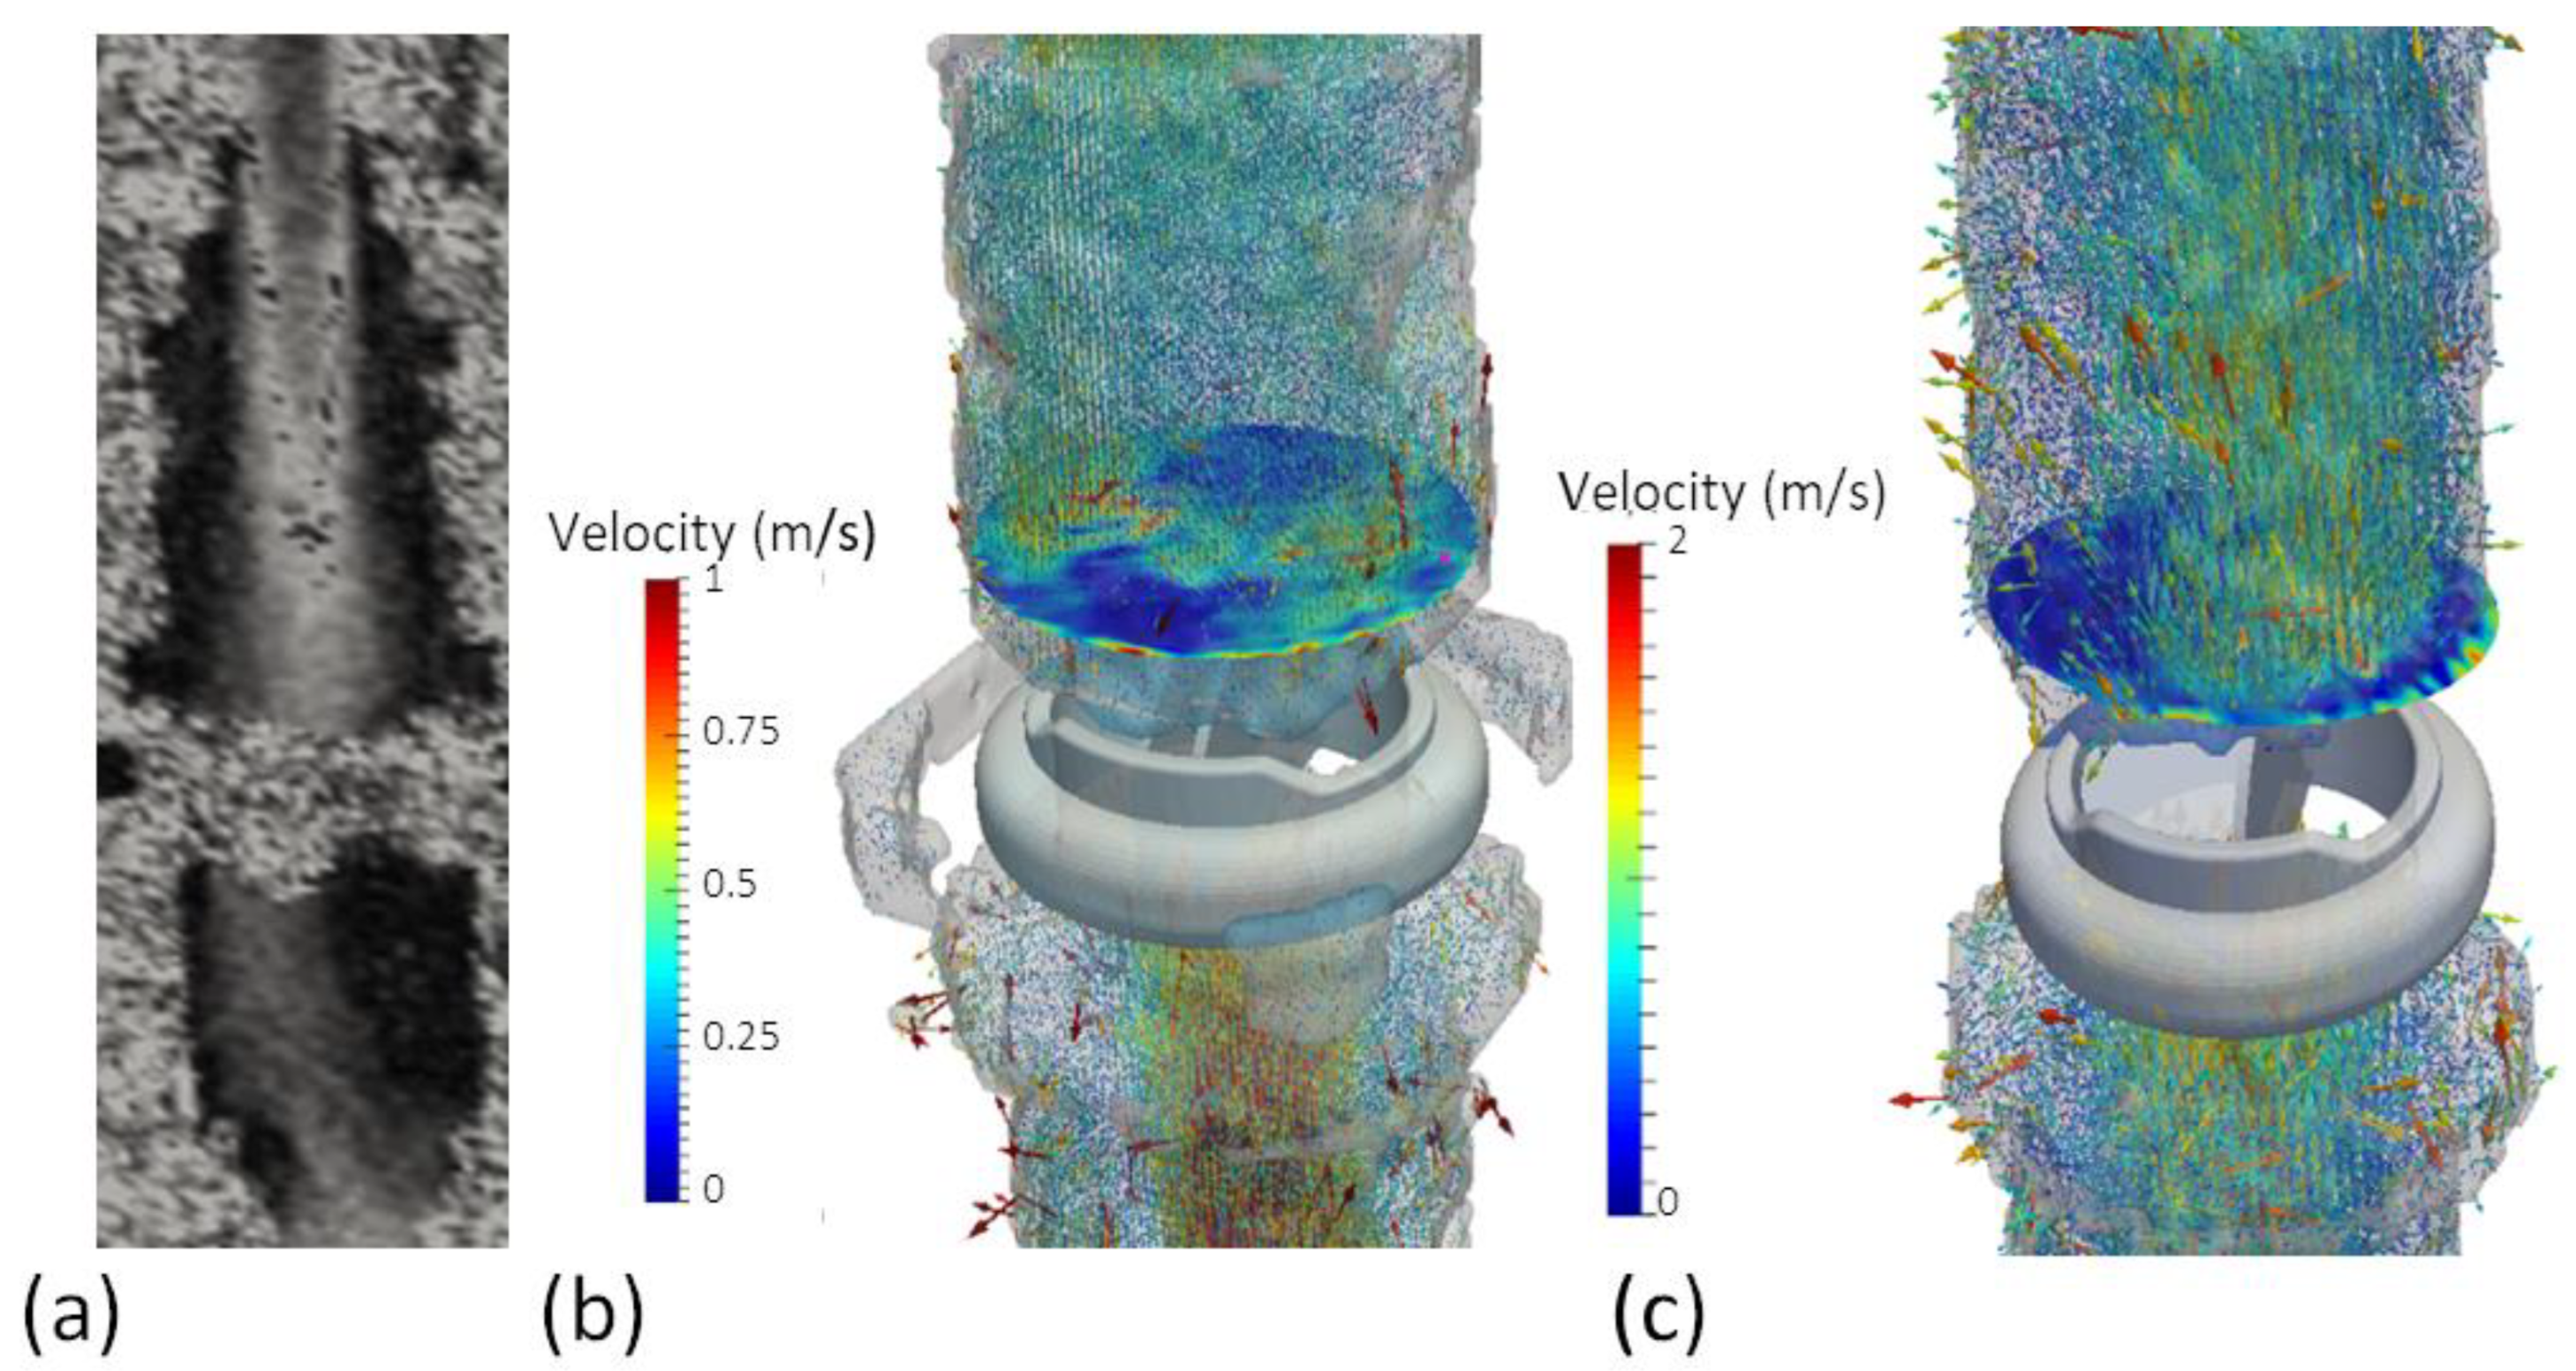
Detection of the BMHV dysfunction by continuity equation computed from 4D flow acquisition is limited based on EOAAST computations, while EOAc and velocities after the valves could more directly highlight a blocked leaflet (see Figure 3).

4. Discussion

4.1. EOA Computation with MRI

EOA computation of BMHV is largely performed clinically [11] using echocardiography, and investigation of the MRI as a complementary tool has been limited. However, MRI is considered the gold standard for heart function assessment [11], and if able to be accurately used for BMHV assessment, it may reduce the need for multiple exams using different imaging modalities. It is known that assessment of the BMHV by EOA continuity using echocardiography results in an overestimation of the EOA as this approach is not considering that the orifice of the valve is divided into three zones. Echocardiography is not inherently a 3D technique, and MRI provides a true 3D alternative for the computation of the EOA for BMHV. This work, through simplified Computational Fluid Dynamics modeling of BMHV, provides an important insight into the capacity of EOAAST as a means to provide a meaningful assessment of the valve, the influence of the plane, as well as design and patient specificity.
No specific shape of this blurring effect could be expected according to the positioning of the valve (see Table 2), which limits the possibility of providing reference values dedicated to MRI. Moreover, resolution of the available 4D flow sequences will be an issue for such generalization of EOAAST computation.

4.2. Toward Full 4D Flow Assessment by MRI

The considered 4D Phase-Contrast flow sequence in this work has been used as an available tool for BMHV flow investigation. However, such a sequence, when used with six-direction flow encoding (ICOSA, [21]), enables quantification of the turbulence production and has been investigated for different orifice shapes with a steady flow [22]. Multi-Velocity encoding acquisition sequences have been used with an algorithm based on the ratio of maximum turbulence kinetic energy and the associated noise level measured for the choice of velocity encoding. This process avoids underestimating the turbulence kinetic energy while ensuring high sensitivity with low encoding velocity. Such work states the benefits of turbulence-based pressure drop measurement as being complementary to the conventional use of Bernoulli’s equation. The authors highlight the possibility of using such methods for metal-based prosthetic heart valves, as the turbulence production is expected to occur behind the valve region, avoiding the metal artefacts. Thus, our work still provides insight in this direction even though it is based on Computational Fluid Dynamics and limited by the small number of prostheses and use of mono velocity encoding only. The investigation of the effect of pulsation of the flow, while limited in our present study, shows a diminution of the EOAAST value with higher and lower frequencies.
The simulated BMHV with the orifice fully open and closed by Ha et al. [22] in which they presented interesting results in the quantification of the pressure drop, with higher pressure drop when the leaflet was closed but similar correlation between real pressure measurements, both extended Bernoulli and turbulence production methods providing high values for the semi-closed BMHV and showing the capacity of such methods to detect BMHV dysfunction. The question of the volume of computation could then be of interest.

4.3. Clinical Perspectives

Transfer to clinics will require a full validation of the EOAAST method on orifices, as previously performed already for a native valve for which a specific jet shear layer detection method has been defined [18]. Such work provides vena contracta representations for aortic valves and underlines that the EOA computation depends highly on the adequate positioning of the acquisition slice and that the overestimation between transthoracic echocardiographic EOA and MRI EOA depends on the valve energy loss coefficient. Comparison of EOS computation in the initial work of AST definition [16] with particle image velocimetry showed similar results between EOA Doppler and EOAAST (1.54 cm2 and 1.58 cm2, respectively) for a 25 mm diameter bioprosthetic heart valve. In this study, the authors reported that the AST method amplifies the variations of the vorticity, enabling better detection of flow structure post orifice, which justified the closer AST method result than the particle-image-velocimetry-based result when compared with echocardiography.
Transfer of such a method to echocardiography could also be interesting but will require a hypothesis on the flow pattern at the inflow of the valve and reconstruction of three velocity components based on a symmetry hypothesis. The generalization of such an EOAAST computational method, as well as pressure drop measurement or any flow-based indices, depends highly on the available sequences and post-processing implementation by the MRI manufacturer.

4.4. Limitations

Numerical simulation appears to be a promising tool for investigating resolution and distance to the valve, although our models were limited by the assumption of Newtonian fluid dynamics. The influence of viscosity should also be tested particularly in the context of BMHV in which anti-coagulation medications are prescribed. More realistic simulations would also include the motion of the valve, but this would necessarily involve a much higher computational cost. Despite these limitations, the current study with fixed leaflets provided useful results for such investigation of EOAAST measurement. Further work should be performed to fully validate the AST method by MRI on BMHV, including comparison with particle image velocimetry measurements.
Further measurements specific to pulsatile flow based on numerical simulations or 4D Phase-Contrast flow acquisition could also be of interest, such as the computation of Lagrangian coherent and turbulence structures.

5. Conclusions

Investigation of the EOAAST computation method to be usable by MRI and verification by Computational Fluid Dynamics study showed that a 4D flow measurement is a promising tool for whole heart investigation, including BMHV investigation. However, optimized sequences, high resolution, and specific post-processing need to be used for optimal evaluation of the valves. While the study did not investigate all models and sizes of BMHV prosthesis, robust pulsatile flow in-vitro tests together with a Computational Fluid Dynamics study provided valuable insights on applying the EOAAST computation using MRI data, highlighting the need for a specific acquisition plane according to hemodynamic of the patient and prosthesis design.

Author Contributions

Conceptualization, A.L. and M.E.; methodology, D.J. and D.F.F.; software, M.E. and A.M.; validation, M.E., D.F.F., D.J., S.M.G., J.-F.F. and A.L.; formal analysis, S.M.G.; investigation, D.F.F.; resources, A.L.; data curation, D.F.F.; writing—original draft preparation, M.E.; writing—review and editing, All; visualization, M.E.; supervision, A.L. and S.M.G.; project administration, A.L.; funding acquisition, J.-F.F. All authors have read and agreed to the published version of the manuscript.

Funding

This work was supported by NHMRC Grant APP1130610.

Institutional Review Board Statement

Ethical review and approval were waived for this study as no clinical data nor patients were used.

Informed Consent Statement

Not applicable.

Data Availability Statement

The data can be made available on demand to the corresponding author.

Conflicts of Interest

The authors declare no conflict of interest. The funders had no role in the design of the study; in the collection, analyses, or interpretation of data; in the writing of the manuscript; or in the decision to publish the results.

References

  1. Brown, J.M.; O’Brien, S.M.; Wu, C.; Sikora, J.A.H.; Griffith, B.P.; Gammie, J.S. Isolated Aortic Valve Replacement in North America Comprising 108,687 Patients in 10 Years: Changes in Risks, Valve Types, and Outcomes in the Society of Thoracic Surgeons National Database. J. Thorac. Cardiovasc. Surg. 2009, 137, 82–90. [Google Scholar] [CrossRef] [PubMed] [Green Version]
  2. Brennan, J.M.; Edwards, F.H.; Zhao, Y.; O’Brien, S.; Booth, M.E.; Dokholyan, R.S.; Douglas, P.S.; Peterson, E.D.; DEcIDE AVR (Developing Evidence to Inform Decisions about Effectiveness–Aortic Valve Replacement) Research Team. Long-Term Safety and Effectiveness of Mechanical versus Biologic Aortic Valve Prostheses in Older Patients: Results from the Society of Thoracic Surgeons Adult Cardiac Surgery National Database. Circulation 2013, 127, 1647–1655. [Google Scholar] [CrossRef] [PubMed] [Green Version]
  3. Suchá, D.; Chamuleau, S.A.J.; Symersky, P.; Meijs, M.F.L.; van den Brink, R.B.A.; de Mol, B.A.J.M.; Mali, W.P.T.M.; Habets, J.; van Herwerden, L.A.; Budde, R.P.J. Baseline MDCT Findings after Prosthetic Heart Valve Implantation Provide Important Complementary Information to Echocardiography for Follow-up Purposes. Eur. Radiol. 2016, 26, 997–1006. [Google Scholar] [CrossRef] [PubMed] [Green Version]
  4. Lancellotti, P.; Pibarot, P.; Chambers, J.; Edvardsen, T.; Delgado, V.; Dulgheru, R.; Pepi, M.; Cosyns, B.; Dweck, M.R.; Garbi, M.; et al. Recommendations for the Imaging Assessment of Prosthetic Heart Valves: A Report from the European Association of Cardiovascular Imaging Endorsed by the Chinese Society of Echocardiography, the Inter-American Society of Echocardiography, and the Brazilian Department of Cardiovascular Imaging. Eur. Heart J. Cardiovasc. Imaging 2016, 17, 589–590. [Google Scholar] [CrossRef] [PubMed] [Green Version]
  5. Oh, J.K.; Seward, J.B.; Tajik, A.J. The Echo Manual; Lippincott Williams & Wilkins: Philadelphia, PA, USA, 2006; ISBN 978-0-7817-4853-7. [Google Scholar]
  6. Dyverfeldt, P.; Bissell, M.; Barker, A.J.; Bolger, A.F.; Carlhäll, C.-J.; Ebbers, T.; Francios, C.J.; Frydrychowicz, A.; Geiger, J.; Giese, D.; et al. 4D Flow Cardiovascular Magnetic Resonance Consensus Statement. J. Cardiovasc. Magn. Reson. 2015, 17, 72. [Google Scholar] [CrossRef] [PubMed] [Green Version]
  7. Habets, J.; Budde, R.P.; Symersky, P.; van den Brink, R.B.; de Mol, B.A.; Mali, W.P.; van Herwerden, L.A.; Chamuleau, S.A. Diagnostic Evaluation of Left-Sided Prosthetic Heart Valve Dysfunction. Nat. Rev. Cardiol. 2011, 8, 466–478. [Google Scholar] [CrossRef] [PubMed]
  8. Adegbite, O.; Kadem, L.; Newling, B. Purely Phase-Encoded MRI of Turbulent Flow through a Dysfunctional Bileaflet Mechanical Heart Valve. Magn. Reson. Mater. Phys. Biol. Med. 2014, 27, 227–235. [Google Scholar] [CrossRef] [PubMed]
  9. Von Knobelsdorff-Brenkenhoff, F.; Karunaharamoorthy, A.; Trauzeddel, R.F.; Barker, A.J.; Blaszczyk, E.; Markl, M.; Schulz-Menger, J. Evaluation of Aortic Blood Flow and Wall Shear Stress in Aortic Stenosis and Its Association with Left Ventricular Remodeling. Circ. Cardiovasc. Imaging 2016, 9, e004038. [Google Scholar] [CrossRef] [PubMed] [Green Version]
  10. Von Knobelsdorff-Brenkenhoff, F.; Dieringer, M.A.; Greiser, A.; Schulz-Menger, J. In Vitro Assessment of Heart Valve Bioprostheses by Cardiovascular Magnetic Resonance: Four-Dimensional Mapping of Flow Patterns and Orifice Area Planimetry. Eur. J. Cardiothorac. Surg. 2011, 40, 736–742. [Google Scholar] [CrossRef] [PubMed]
  11. Zoghbi, W.A.; Adams, D.; Bonow, R.O.; Enriquez-Sarano, M.; Foster, E.; Grayburn, P.A.; Hahn, R.T.; Han, Y.; Hung, J.; Lang, R.M.; et al. Recommendations for Noninvasive Evaluation of Native Valvular Regurgitation: A Report from the American Society of Echocardiography Developed in Collaboration with the Society for Cardiovascular Magnetic Resonance. J. Am. Soc. Echocardiogr. 2017, 30, 303–371. [Google Scholar] [CrossRef] [PubMed]
  12. Tanis, W.; Budde, R.P.J.; van der Bilt, I.A.C.; Delemarre, B.; Hoohenkerk, G.; van Rooden, J.-K.; Scholtens, A.M.; Habets, J.; Chamuleau, S. Novel Imaging Strategies for the Detection of Prosthetic Heart Valve Obstruction and Endocarditis. Neth. Heart J. 2016, 24, 96–107. [Google Scholar] [CrossRef] [PubMed] [Green Version]
  13. Wang, Y.; Joannic, D.; Delassus, P.; Lalande, A.; Juillion, P.; Fontaine, J.-F. Comparison of the Strain Field of Abdominal Aortic Aneurysm Measured by Magnetic Resonance Imaging and Stereovision: A Feasibility Study for Prediction of the Risk of Rupture of Aortic Abdominal Aneurysm. J. Biomech. 2015, 48, 1158–1164. [Google Scholar] [CrossRef] [PubMed]
  14. Cheng, N.-S. Formula for the Viscosity of a Glycerol−Water Mixture. Ind. Eng. Chem. Res. 2008, 47, 3285–3288. [Google Scholar] [CrossRef]
  15. Garcia, D.; Kadem, L. What Do You Mean by Aortic Valve Area: Geometric Orifice Area, Effective Orifice Area, or Gorlin Area? J. Heart Valve Dis. 2006, 15, 601–608. [Google Scholar] [PubMed]
  16. Kadem, L.; Knapp, Y.; Pibarot, P.; Bertrand, E.; Garcia, D.; Durand, L.-G.; Rieu, R. A New Experimental Method for the Determination of the Effective Orifice Area Based on the Acoustical Source Term. Exp. Fluids 2005, 39, 1051–1060. [Google Scholar] [CrossRef]
  17. Gorlin, R.; Gorlin, S.G. Hydraulic Formula for Calculation of the Area of the Stenotic Mitral Valve, Other Cardiac Valves, and Central Circulatory Shunts. I. Am. Heart J. 1951, 41, 1–29. [Google Scholar] [CrossRef]
  18. Garcia, J.; Marrufo, O.R.; Rodriguez, A.O.; Larose, E.; Pibarot, P.; Kadem, L. Cardiovascular Magnetic Resonance Evaluation of Aortic Stenosis Severity Using Single Plane Measurement of Effective Orifice Area. J. Cardiovasc. Magn. Reson. 2012, 14, 23. [Google Scholar] [CrossRef] [PubMed] [Green Version]
  19. Powell, A. Theory of Vortex Sound. J. Acoust. Soc. Am. 1964, 36, 177–195. [Google Scholar] [CrossRef]
  20. Howe, M.S. Theory of Vortex Sound; Cambridge University Press: Cambridge, UK, 2003; ISBN 978-0-521-01223-2. [Google Scholar]
  21. Ha, H.; Lantz, J.; Ziegler, M.; Casas, B.; Karlsson, M.; Dyverfeldt, P.; Ebbers, T. Estimating the Irreversible Pressure Drop across a Stenosis by Quantifying Turbulence Production Using 4D Flow MRI. Sci. Rep. 2017, 7, 46618. [Google Scholar] [CrossRef] [PubMed] [Green Version]
  22. Ha, H.; Kvitting, J.-P.; Dyverfeldt, P.; Ebbers, T. Validation of Pressure Drop Assessment Using 4D Flow MRI-Based Turbulence Production in Various Shapes of Aortic Stenoses. Magn. Reson. Med. 2019, 81, 893–906. [Google Scholar] [CrossRef] [PubMed]
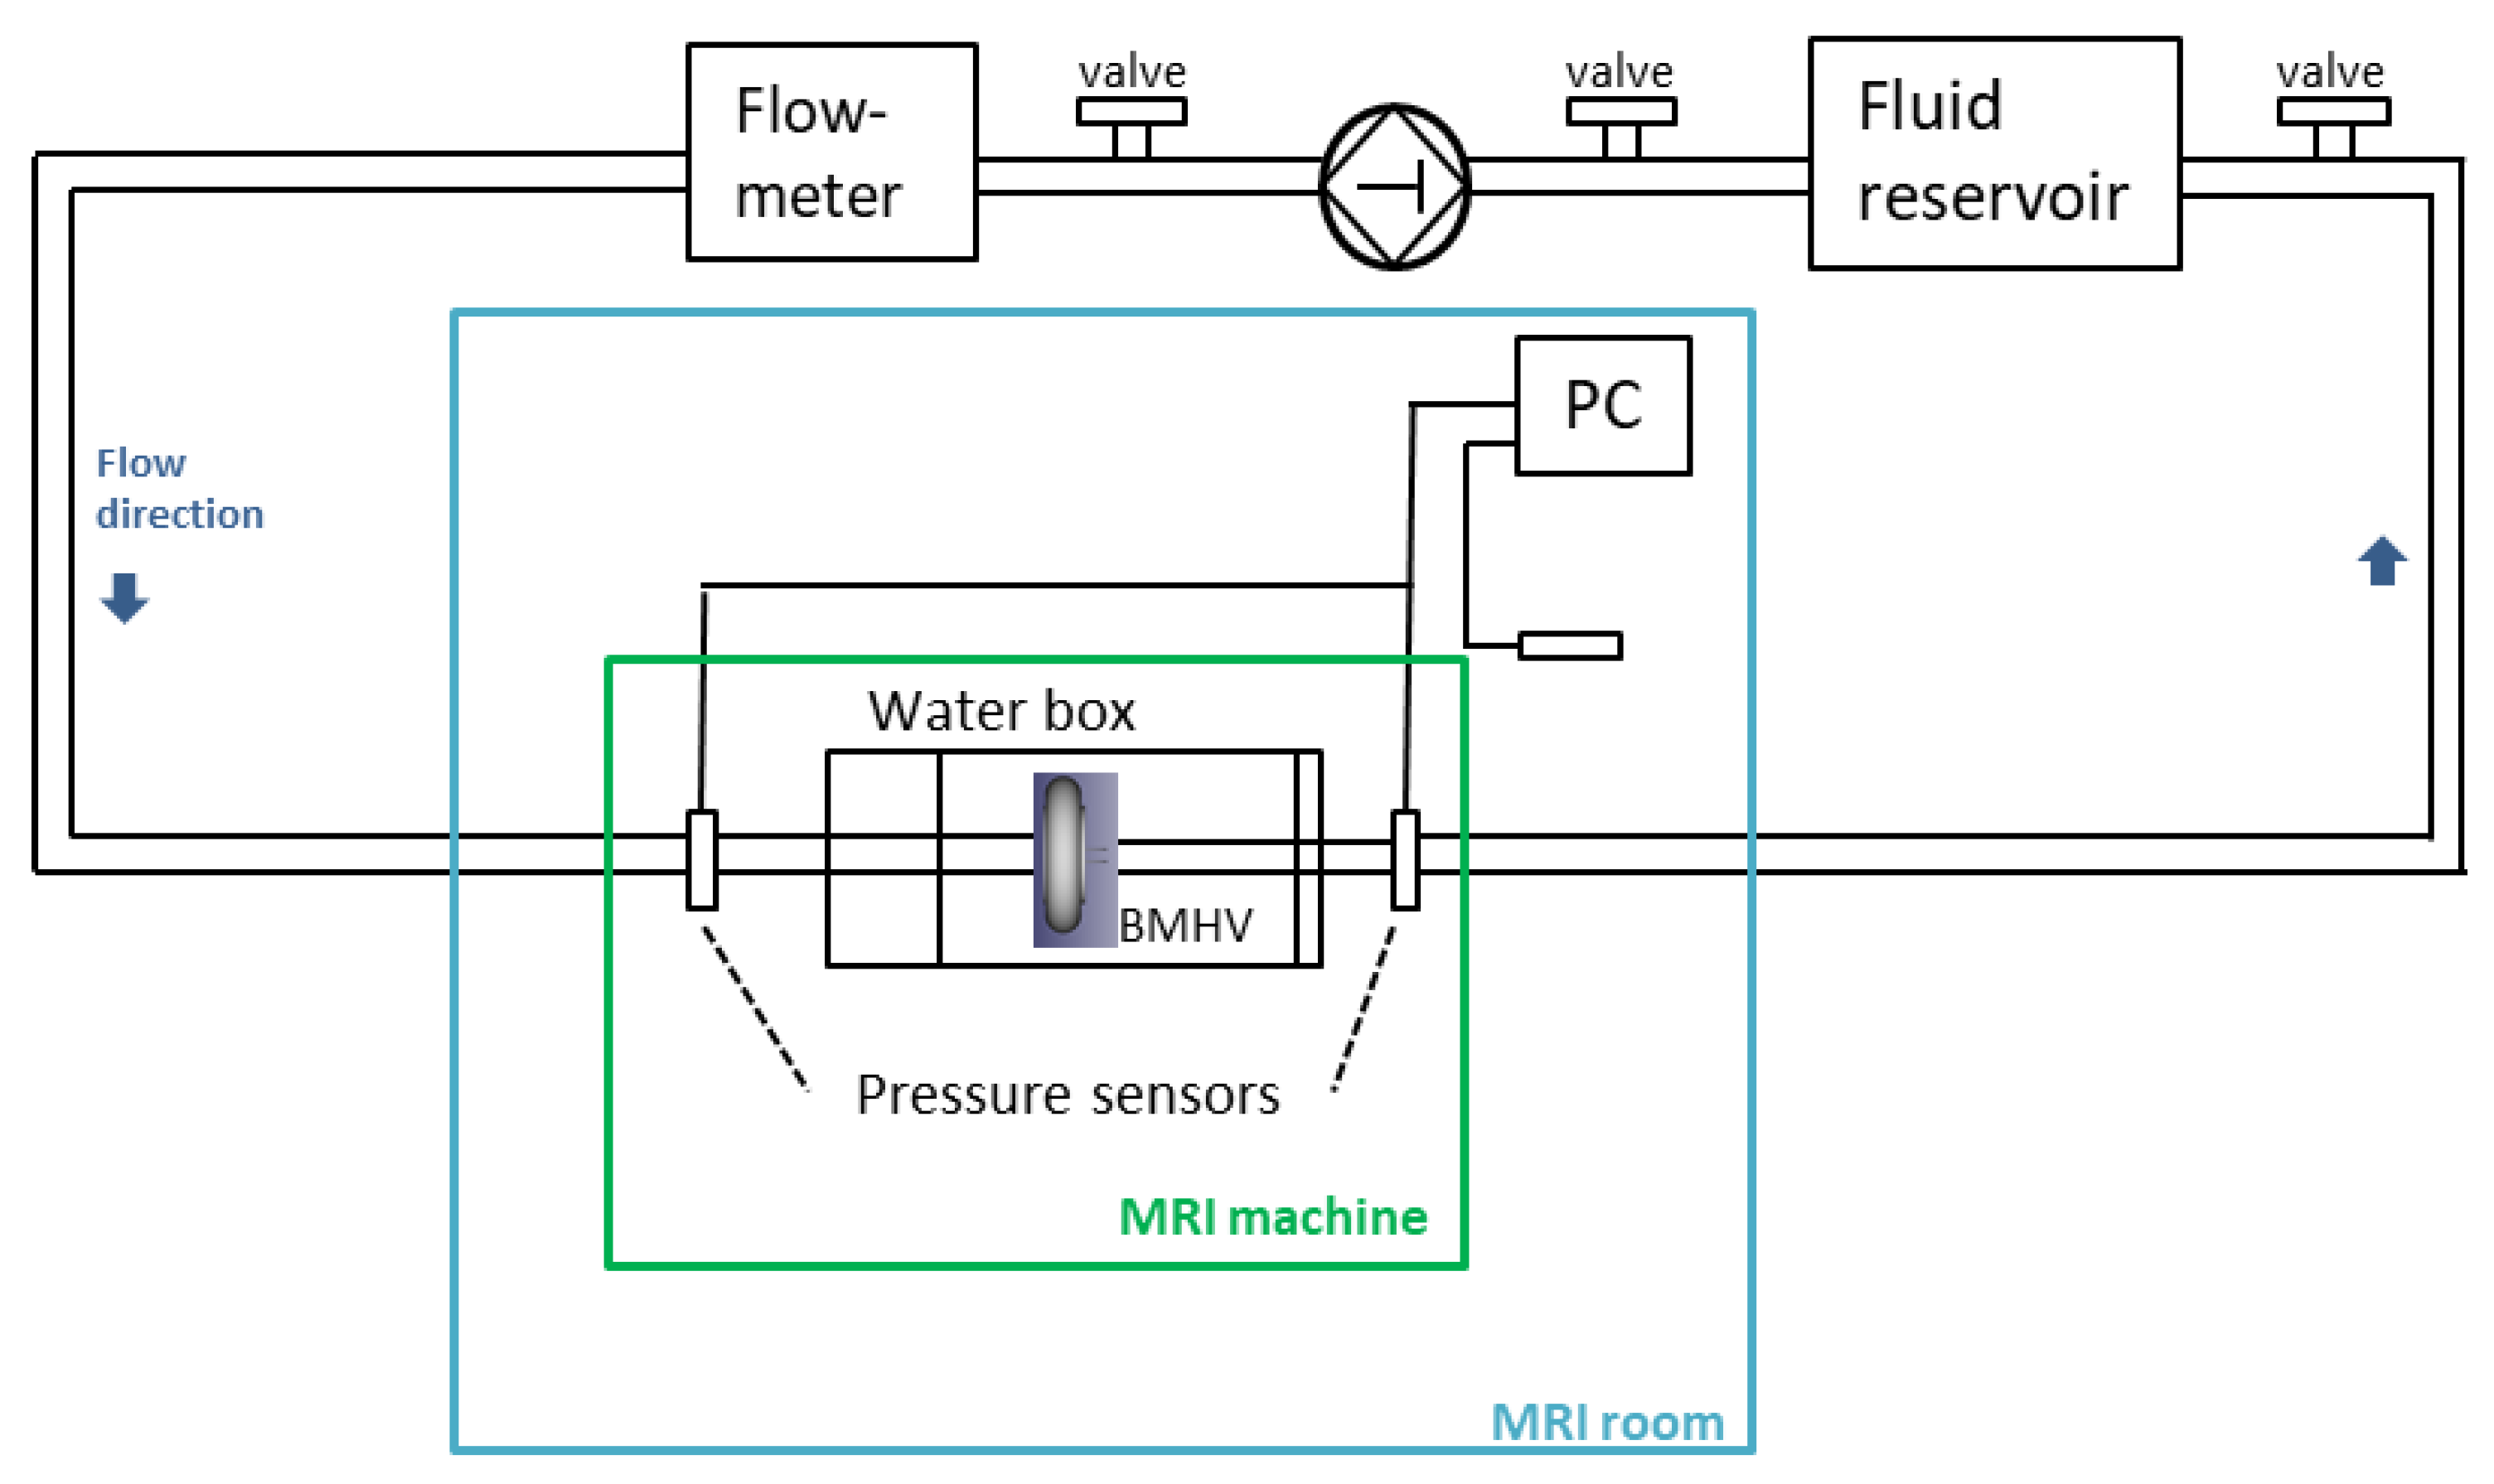
Figure 1. Schematic of the experiment, adapted from [13] with gear pump, pressure measurement, and set up outside of the MRI. PC: Personal computer.
Applsci 12 11771 g001
Figure 2. Parametric numerical simulation. BMHV designs: OnX (a) and St Jude Medical (b), Numerical simulation settings: BMHV in the tube (c) and details of computational mesh (d), and inflow velocity curve (e).
Applsci 12 11771 g002
Figure 3. BMHV malfunction with MRI blurring around the BMHV (a), MRI 4D Phase-Contrast Acquisition with a superposed representation of normal functioning BMHV (b), and leaflet blocked MBHV (c) with AST values on the surface plane.
Applsci 12 11771 g003
Figure 4. Numerical results—Boxplot representation of the influence of prosthesis design and hemodynamics on the EOA computation. Internal diameter influence 21 to 24 mm, stroke volume: SV of 70, 90, and 120 mL, and HR: Heart Rate: 60 to 120 bpm.
Applsci 12 11771 g004
Figure 5. Numerical and MRI results—EOA computation as function of the distance from BMHV outflow for numerical analysis (dashed lines) and MRI results (continuous lines). The representation of the BMHV profile (dotted dashed line) is for representation only. Narrow horizontal boxes represent the location of the leaflets for each BMHV profile (dark blue: OnX prosthesis, green: SJM23, and red: SJM25).
Applsci 12 11771 g005
Figure 6. Comparisons of EOA for the four models of BMHV using MRI data (EOAAST—blue and EOAC—green) and comparison with the numerical results EOA CFD (orange).
Applsci 12 11771 g006
Table 1. MRI acquisition settings and results on the 4 tested BMHV models: MRI 4D Phase-Contrast flow sequences characteristics, blurring distances and EOA computation. VENC: velocity encoding.
BMHV Model (Condition)Pixel Spacing (mm)Pix. Thickness (mm)LabelInner Diam. (mm)Height (mm)Op. Angle (°)VENC (cm/s)Blurring Distance (mm)Blurring Distance Distal (mm)Ratio Blurring Distal/CentreEOAc (cm2)Recovery Plane (nb(Dist. mm))EOAAST Mean (cm2)
ONX29OnX (normal)0.7812.52923.414.29030020.212.10.601.745 (12.5)0.61
SJM23St Jude Medical (normal)0.7812.52321.412.58528018.916.90.891.43 (7.5)0.70
SJM25St Jude Medical (normal)0.7812.5252313.98526023.432.71.401.552 (5)1.06
SJM25BSt Jude Medical (blocked)0.9383252313.98531021.425.41.191.014 (12)0.73
Table 2. Summary of the numerical simulation: Tested prosthesis and conditions with parameter values and increments—BMHV Dysfunction: Dysfunction with one leaflet blocked.
Design of Experiment ParametersRangeIncrementsNo. of Simulations
BMHV internal diameter (mm)20–2415
Distance between leaflet (mm)3–40.53
Leaflet opening angles (°)80–9053
BMHV Dysfunction (opening angle of one leaflet °)0–15152 × 2
Stroke volume (mL)70–12070; 90; 1203
Heart Rate (bpm)60–12060; 70; 1203
Mesh size 3
Table 3. Numerical simulation setting (geometrical parameters of the BMHV) and results: EOAAST computation (mean, max, and mean) and location of the recording plane.
NameOpening Angle (°)Diameter (mm)Leaflet SpaceHR (bpm)SV (mL)Mesh Size (mm)EOA AST Mean (cm2)EOA AST SD (cm2)EOA AST min (cm2)EOA AST Max (cm2)Rec. Plane No. (Dist. mm)EOAAST (cm2)
BMHV_Leaflet85-21-3085213.070900.51.620.200.991.758 (16)1.66
BMHV_Leaflet85-22-3585223.570900.51.650.210.991.773 (6)1.69
BMHV_Leaflets85-23-3585233.570900.51.340.380.761.743 (6)1.72
BMHV_Leaflet85-24-4085244.070900.51.760.061.581.832 (4)1.77
BMHV_Leaflet90-20-3090204.070900.51.490.230.911.644 (8)1.60
BMHV_Leaflet90-21-3090214.070900.51.620.171.071.733 (6)1.68
BMHV_leaflet90-22-3590223.570900.51.470.240.831.663 (6)1.66
BMHV_Leaflet90-23-3590233.570900.51.600.181.011.714 (8)1.61
BMHV_leaflet90-24-4090244.070900.51.540.200.891.675 (10)1.59
BMHV_Leaflet90-22-35_HR6090223.560900.51.450.230.831.695 (10)1.57
BMHV_Leaflet90-22-35_HR12090223.5120900.51.450.250.841.705 (10)1.58
BMHV_leaflet90-22-35_M0390223.570900.31.690.210.991.802 (4)1.74
BMHV_leaflet90-22-35_M0790223.570900.71.490.190.871.673 (6)1.56
BMHV_leaflet90-22-35_M0990223.570900.90.890.110.751.085 (10)0.94
BMHV_Leaflet90-22-35_SV7090223.570700.51.440.230.831.616 (12)1.57
BMHV_Leaflet90-22-35_SV12090223.5701200.51.600.181.011.713 (6)1.66
Publisher’s Note: MDPI stays neutral with regard to jurisdictional claims in published maps and institutional affiliations.