Abstract
A dynamic simulation was launched to research the influence of high-pressure turbine (HPT) rotor wake passing frequency on the flow mechanism in an integrated aggressive interturbine duct (AITD). Sweeping rods were adopted to replace the HPT rotors to decouple the influence of its wake from those of other secondary flows. The diameter of the rods (d/s, nondimensionalized by the pitch (s) of the integrated struts at midspan) was 0.10, and their reduced frequency (f) ranged from 0.49 to 1.61. The k–ω SST turbulence model and γ–θ transition model were adopted for the turbulence closure. A 6.3-million-node structured grid was used to meet the grid dependency. Along with increasing f, the intensified circumferential motion of the wake (1) enhances the wake vortex stretching and exhaustion near the hub; (2) promotes the radial inclination of wakes and elongates and narrows the wake vortex band, resulting in increased spacing between the adjacent wake vortices and the weakened vortex interaction. In the high-f cases, the enhanced turbulence intensity in the interval between the adjacent wakes could suppress the separation bubble on LPT-GV in advance, but the elongated and narrowed wake vortices resulted in a substantial reduction in the radial extent and duration of their suppression on the separation bubble. Therefore, the influence of f on the integrated AITD and its parts was bidirectional, and adjusting the sweeping frequency to balance its positive and negative effects could minimize the total loss in the integrated AITD.
1. Introduction
The interturbine transition duct (ITD), being designed to connect the low-pressure turbine (LPT) and high-pressure turbine (HPT) of aeroengines, is an important part that affects turbine performance. The aggressive interturbine duct (AITD), with larger rise angle, greater area ratio, and shorter non-dimensional length, is adopted in modern turbofan engines to further improve aeroengine performance due to its large bypass ratio and high thrust-to-weight ratio [1,2,3]. At the same time, the complexity of the axial, radial, and circumferential pressure gradients in the AITD affects the evolution of its internal secondary and loss mechanism [3,4,5].
Upstream wakes have great influence on the flow field in ITD. Dominy et al. [1,2] simulated the wakes of HPT blades by the plates and found a counter vortex pair near the casing and hub that was induced by the interaction between the HPT wakes and the boundary layer of the end wall, affecting the flow angle and the loss distribution at the ITD outlet. Zhang et al. [3] further revealed the evolution of the vortex pairs in more detail: the vortex pair around the hub was formed from the low-energy fluid driven by the radial pressure gradient, while the migration of low-energy fluid accumulated on the shroud induced the formation of the three-dimensional boundary layer, which further developed into a vortex pair around the shroud. Miller et al. [4] attributed the main loss sources in ITDs to the radial movement and flow mixing between the mid-passage and casing. Zhang et al. [5] found that the greater area ratio and mean rise angle aggravated the inverse streamwise pressure gradient and the separation bubble on the casing. Liu [6] and Liu [7] found that the negative effect of the large rising angle could be offset by modifying LPT vanes. Norris et al. [8] indicated that the change of curvature and expansion rate, resulting from the shortening non-dimensional length, was the primary factor influencing the secondary flow in ITDs. Along with the inlet swirl, the increased effective motion path of the fluid decreased the pressure gradient on the wall, resulting in inhibition of the flow separation on the casing [9,10,11]. Along with the increasing tip clearance of the HPT blades, the swirling flow around the casing was enhanced at the ITD inlet, which was conducive to the inhibition of the flow separation on the casing [12,13,14]. However, the greater tip clearance caused more total pressure loss in ITD. Schennach et al. [15] proposed that there is a circumferential location of the LPT-GV for optimizing the effect of its potential flow and maximizing aerodynamic performance for a particular ITD.
Miller [16] found that the divergence of the flow channel initiated by the struts deteriorated the flow separation and the nonsteady flow significantly, resulting in loss augmentation. The design concept of struts integrated in ITD, proposed by Marn et al. [17], could improve the flow quality at the integrated ITD outlet and also reduce the strut weight by 20–39%. The aggravated outlet flow uniformity of the integrated ITD [18] could be improved by adding two splitter blades with zero-loading between the adjacent struts, as the splitter blades divided the large passage vortices into small ones [19,20]. However, the flow homogeneity at the outlet was improved at the price of the total pressure loss augmentation. Liu [21] and Xu [22] indicated that the convergence channel of the wide-chord strut changed the pressure gradient in the radial and circumferential direction in the integrated AITD, which was conducive to suppressing the flow separation on the shroud and reducing the flow loss. Liu [23] studied the influence of the integration of strut and LPT-GV on the ITD and found that the integrated strut changed the loading distribution of LPT-GV, resulting in the aggravated radial migration of the low-energy fluid in the boundary layer near the shroud around its trailing edge.
Due to the shorter axial distance, the HPT rotors’ wakes can reach LPT-GV and be used to inhibit the flow separation on it. The underlying mechanism on how the wake inhibits the flow separation has been disclosed in cascade wind tunnels [24,25,26]. However, compared with the internal flow in cascade, the flow-field in the S-sharped AITD has a stronger pressure gradient in the counter-axial and radial direction, which unavoidably affects the propagation and exhaustion of the upstream wake in the AITD. Liu et al. [21,27,28] investigated the decoupled HPT rotors’ wake propagation in an AITD with different FSTI (free stream turbulence intensity) and Re and found that the wake could periodically inhibit the boundary layer separation on the integrated LPT-GV of the AITD. Lei et al. [29] studied the influences of the HPT rotors’ wakes with various trailing-edge radii on the flow mechanism in an integrated AITD. They found that the strong wake could decrease the pressure gradient in radial direction for the AITD and the circumferential pressure gradient from the LPT-GV pressure surface to its suction surface, which inhibited the radial secondary flow and the passage vortex in the integrated LPT-GV, respectively. Based on these studies, the effect of the decoupled wake’s sweeping frequency on the secondary flow in the AITD and LPT-GV channels is investigated in this paper.
2. Numerical Methods
The 3D Reynolds-averaged Navier–Stokes (RANS) equations were solved by the ANSYS CFX solver coupled with the SST (shear stress transport) k–ω model and the γ–θ transition model, which can precisely simulate the flow with intense turbulent dissipation in the high curvature model [3]. In the simulations, the time terms and the convective and diffusive terms were discretized by the second-order backward difference method and the high-resolution upwind discrete scheme, respectively.
2.1. Integrated AITD
We used the integrated AITD model shown in Figure 1a in [29] to study the effect of the wake sweeping frequency. Table 1 shows the typical parameters of this integrated AITD and the LPT-GV (Figure 1b). Detailed information about them can be found in [29].

Figure 1.
The integrated AITD [29].

Table 1.
Typical geometric information of the LPT-GV and the integrated AITD.
To isolate the influence of the HPT rotors’ wakes, they were replaced by sweeping rods with a diameter (d) of 4.6 mm, located 0.4 H (H is the inlet channel height of AITD) in front of the AITD inlet. For the reference condition, the rotating speed of the rods was 185 r/min, and the corresponding reduced frequency ( was 0.90. To study the effect of the wake sweeping frequency, we also studied cases for f of 0.49, 0.71, 0.90, 1.07, 1.34, and 1.61.
To study the flow mechanism in the integrated AITD, the data of 15 sections (B0-B9, C1-C5, as shown in Figure 1a) following the flow direction were extracted. Then, the computing domain inlet (Section B0) was set as the reference plane, the AITD inlet was defined as Section B1, Sections B2-B6 were approximately perpendicular to the hub and casing, Sections B7-B9 were located at 0.25Cx, 0.50Cx, and 1.00Cx (Cx, the LPT-GV axial chord at midspan) downstream of the LPT-GV respectively, and Sections C1-C5 were in the integrated LPT-GV passage.
2.2. Calculation Scheme
The calculation domain (Figure 2a) included the rotation domain of the sweeping rods and the static domain of the integrated AITD. The inlet was located 1.5 H in front of the rod and was set as FSTI = 3% and Re = 71,600 (based on the channel height and velocity at inlet). The exit plane was at 2.5Cx downstream of the integrated LPT-GV and was specified with the ambient pressure. All wall boundaries were prescribed with no-heat-transfer and no-slip conditions. The minimum physical time step was Δt = 0.000065 s [29], and the total duration of each unsteady simulation was 0.242 s–0.794 s.

Figure 2.
Calculation domain and grid of the integrated AITD.
Using the Numeca/AutoGrid, an HOH-type structured grid (Figure 2a) was adopted to mesh the calculation domain [30,31]. Figure 2b shows the change of the total pressure loss (Y) in the integrated AITD with the number of grid nodes in the case of f = 1.07. When the number of grid nodes was greater than 5.06 million, the value of Y basically remained constant. Considering the calculation accuracy and time, the grid with 6.3 million nodes was adopted for the following simulations. For this selected grid, the node numbers were 552, 133, and 73 in the streamwise, spanwise, and circumferential directions, respectively; the node numbers of the O-type grid encompassing the rod and LPT-GV were 369 and 81, respectively. The Y+ value was less than 1 for all boundary layers, with the first layer having a thickness of 0.02 mm and a growth rate of 1.15.
2.3. Validation
To verify the above numerical methods, the AITD model, which was experimentally studied in [22], was simulated in this study. As shown in Figure 3a, this ITD is a typical aggressive ITD, with a dimensionless length of 2.79, an outlet-to-inlet area ratio of 1.38, and a rise angle of 20.12°. The calculation domain was meshed by the HOH–type structural grid (Figure 3b) with 4 million nodes, and the Y+ value of all walls was less than 1. According to the test conditions in the low-speed wind tunnel, the boundary conditions were set as follows: the inlet velocity was 30 m/s, the inlet turbulence intensity was 4.65%, the outlet was prescribed by the ambient pressure, and all wall boundaries were set as non-slip insulation walls.
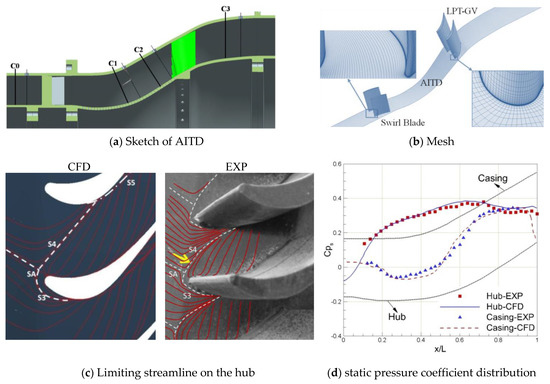
Figure 3.
AITD model and results for validation (SA: saddle point; S3 and S4: horseshoe vortices).
Figure 3c compares the predicted limiting streamline with the result of oil-flow visualization on the hub near the leading edge of LPT-GV. The numerical simulation results clearly capture the saddle point (SA) upstream of the LPT-GV leading edge, the horseshoe vortices (S3 and S4) formed by the end-wall boundary layer rolling up, and the lateral secondary flow moving from the pressure surface to the suction surface in the LPT-GV passage; the predicted inflow direction, saddle point position, horseshoe vortex shape, and lateral secondary flow direction are in good agreement with the result of the oil-flow visualization. Figure 3d compares the simulated wall static pressure coefficient (Cps) with the experimental ones along the hub and casing of AITD. Overall, the predicted Cps along the hub and casing agreed with the measured result. However, the predicted Cps on the hub was slightly higher than the experimental ones near the AITD outlet (close to the 2nd bend of AITD), and there also were some differences between the predicted Cps on the casing and the experimental ones in the region of 0.3 ≤ x/L ≤ 0.65 (at the 1st bend of AITD). This aggressive ITD has a large rise angle and high geometric curvature at the first and second bends, which correspondingly enhanced the unsteady flow characteristics (such as separation bubble and secondary flow) on the hub near the 2nd bend and the casing around the 1st bend. These unsteady flows increased the measurement error of the wall static pressure coefficients, resulting in the differences with the predicted ones. In general, this numerical method had high accuracy in predicting the internal flow of the AITD.
3. Results and Discussion
Dynamic numerical simulations were launched for cases of f ranging from 0.49 to 1.61. This section analyzes the effects of the HPT rotor passing frequency on the propagation and dissipation of the unsteady wakes in the integrated AITD through detailed analysis of typical cases of f = 0.71, 0.90, and 1.61.
3.1. Wake Propagation in the AITD
Figure 4 compares the turbulence intensity (Tu) distribution at the midspan of Section B1-B6. The initial shape of the wakes (as shown in Section B1 of Figure 4) is very similar under conditions with different reduced frequencies, and the peak value of the turbulence intensity is almost the same. When propagation is downstream, the wakes also move clockwise (as following the flow direction) due to the tangential velocity induced by the rotation of the rods. As shown in Figure 4, the approximate migration of the wakes is identified by the red and black arrows for the cases of f = 0.71 and 1.61, respectively. The tangential velocity of the wakes increases with f, and their travel distance in the AITD passage also increases. As shown in Figure 4, with the journey from Section B1 to B6, the sweeping wake (red arrow) travels one more pitch of the sweeping rods in the circumferential direction in the case of f = 1.61 than in the case of f = 0.71 (black arrow). The increasing travel distance of the wakes inevitably affects their shape and dissipation in the cases with high reduced frequencies: in Section B5, the adjacent wakes have already diffused to the contact position in the cases with high f (such as f = 1.61), while there is an obvious freestream region with low Tu in the case of f = 0.71; in Section B6, by comparison with the f = 0.71 case, the range of the high Tu region increases by 10% span, and its peak turbulence intensity decreases by 0.73% in the case of f = 1.61. These results indicate that the increasing reduced frequency of the sweeping wakes is beneficial to the acceleration of wake diffusion, interaction, and dissipation.
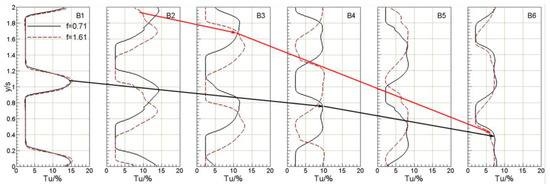
Figure 4.
The Tu distribution at the midspan of Sections B1–B6 (black arrow: the Tu peak (wake center) trace in the f = 0.71 case; red arrow: the Tu peak (wake center) trace in the f = 1.61 case).
Figure 5 compares the time mean streamwise vorticity (Cws) contours of Sections B1-B6 for the various f cases. In Section B1, the initial wake shape is radial, while in Section B3-B6, the wakes gradually become inclined and the inclination increases with the increasing f. This is because the tangential velocity induced by the sweeping rods decreases with the lifting of the AITD channel, but the reduction near the hub is less than that near the casing due to the conservation of angular momentum, resulting in the tangential velocity difference in the radial direction and the circumferential inclination of the wakes, as shown with the red dashed line. Under the coupling effect between the circumferential motion of the wakes and the radial movement of the low-energy fluid along the wakes from the hub to the casing [29], the wake vortices near the hub are stretched in Section B3 (as shown by “Str” in Figure 5). This stretching effect becomes more obvious in Section B4-B6, resulting in the enhanced dissipation of the wakes in the corresponding regions.
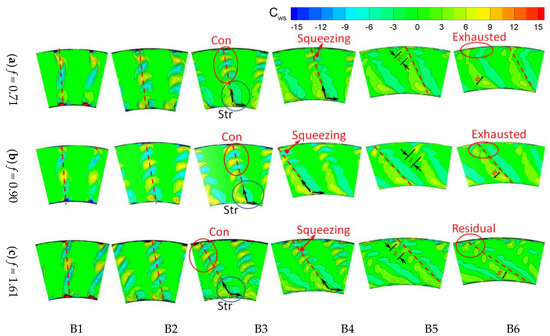
Figure 5.
Time mean streamwise vorticity contours of Sections B1-B6.
Comparing the cases with different f, the residual vortices near the hub in Sections B5 and B6 decrease with the increasing f: the wake vortices near the hub are almost dissipated in Section B5 for the f = 1.61 case, while there are still a certain number of residual wake vortices in Section B6 for the f = 0.71 and 0.90 cases. This means that the increasing f of the sweeping rod is conducive to accelerating the wake dissipation near the hub, because it enhances the circumferential motion and stretching effects of the wakes. Along with increasing f, the promoted circumferential inclination of the wakes increases the spacing between the adjacent wake vortices and the radial travel path of the low-energy fluid, thus delaying the wake vortex squeezing and exhaustion in the middle-upper AITD passage. In the case of f = 1.61, the spacing of wake vortices (marked by “s” in Figure 5) is increased in the middle and upper regions of Section B5 compared with the other two cases. In the cases with f ≤ 0.90, there are only a small number of residual wake vortices in the corresponding area of Section B5, which then almost dissipate in Section B6. However, in the case of f = 1.61, the clear structures of wake vortices in the middle-upper area of Section B5 can still be distinguished, and a certain number of residual wake vortices remain near the shroud in Section B6. On the other hand, with the increasing f, the enhanced circumferential inclination also elongates the wake vortices, which significantly reduces their width (marked by “w” in Figure 5). Taking the case of f = 1.61 as an example, the maximum width of the wake vortices is only 60% of that in the case of f = 0.71.
Figure 6 compares the radial distribution and contours of the Cp0 in Section B6 for the various f cases. Based on the above conclusion, the wake vortex dissipation is enhanced with the increase of f in the bottom of the passage, so the pitchwise mass-averaged Cp0 in the area with h/H < 0.3 in the high f cases (such as f = 1.61) is lower than that in the low f cases. Comparing the corresponding regions in Figure 6b, c, and d, the area of the high Cp0 contour decreases with the increasing f. In the case of f = 1.61, the wake has almost been dissipated, so the corresponding region with h/H < 0.3 becomes a uniform low Cp0 area. In the middle-upper area, due to the delayed interaction of wake vortices and their dissipation in the high f cases, the yellow block representing low total pressure coefficient decreases with increasing f, as shown in Figure 6b–d.
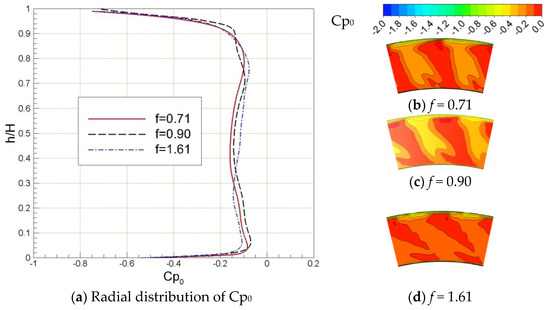
Figure 6.
Radial distribution and contour of the Cp0 in Section B6.
3.2. Influence on Flow Mechanism of Integrated LPT-GV
On the basis of the above conclusion on the wake propagation in various f cases, the influence of the residual wakes on the unsteady flow mechanism of the integrated LPT-GV such as flow separation, vortex dynamics, and loss mechanism is analyzed below.
Figure 7 compares the instantaneous limiting streamline on the integrated LPT-GVs’ suction surface in the cases with f = 0.71, 0.90, and 1.61. At t = 0.2 T and t = 0.4 T, before the wake center reaches the separation bubble, upon comparing the limiting streamline in the cases with different f, the size of the separation bubble (between the red separation Line S and orange reattach Line R in Figure 7) at the same moment decreases with the increasing f, which means that the separation bubble of the LPT-GV can be suppressed in advance by increasing the reduced frequency. This is because the turbulence intensity in the interval between the adjacent wakes (as shown in Section B6 of Figure 6) is promoted as the wake diffusion is accelerated with increasing f. As the wake center reaches the separation bubble of the LPT-GV (such as t = 0.6 T and t = 0.8 T in Figure 7), the wake can completely inhibit the separation bubble in all cases studied in this paper, but the radial range of the suppression (marked by “W” in Figure 7) decreases with increasing f. This is because the width of the wake vortex band is narrowed by its enhanced elongating effect in the high f cases. After the sweeping wakes pass (t = 1.0 T), the separation bubble size recovers to its original level. The separation bubble of the LPT-GV in the case of f = 1.61 is smaller than that in the other two cases, which is related to the enhanced turbulence intensity between adjacent wakes in the high f cases.
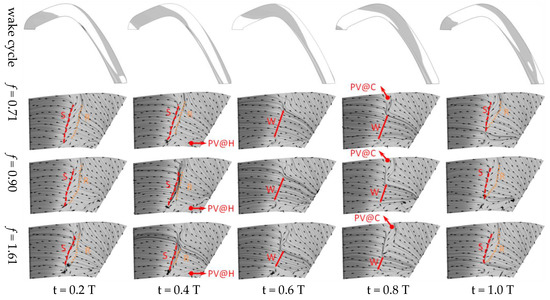
Figure 7.
The instantaneous limited streamline on the integrated LPT-GVs’ suction surfaces (red dashed line: leading edge of separation bubble; orange dotted line: reattachment line; PV@H: passage vortex near the hub; PV@C: passage vortex near the casing; W: the radial range of the wake suppression).
Figure 8 shows the space-time diagrams of the loss coefficient (ξ) and shape factor (H12) at the integrated LPT-GVs’ midspan in the cases of f = 0.71, 0.90, and 1.61. Based on the empirical criterion [24], the wakes’ leading edge (A)/trailing edge (B)/centerline (L), the transition location (T) and the calm zone bounds (C) are also marked in Figure 8. The H12 is defined as the ratio of the displacement thickness to the momentum thickness: a smaller H12 generally indicates the boundary layer velocity profile is fuller; on the contrary, a larger H12 tends to mean a concave velocity profile, which usually suggests that the boundary layer separation has occurred [29]. Based on the experimentally verified conclusions, the boundary layer of LPT has been separated when H12 > 3.5 [26]. Compared with the spatiotemporal range of the separation bubble identified by the isoline of H12 = 3.5 in the cases of f = 0.71, 0.90, and 1.61, the maximum axial dimensions of the separation bubble are 0.119Cx, 0.116Cx, and 0.101Cx, respectively, while the peak values of H12 characterizing the separation bubble thickness are 6.5, 6.45, and 5.75, respectively. This means that the separation bubble length and thickness decrease with the increasing f. This is because the separation bubble size recovered after the wake passes, though is suppressed to a certain extent by the enhanced turbulence intensity in the interval between adjacent wakes (as shown in Section B6 of Figure 6) in cases with high f. However, with increasing f, the duration of the recovered separation bubble increases: in the case of f = 0.71, 0.90, and 1.61, the maximum existence times of the recovered separation bubble were 0.48 T, 0.50 T, and 0.58 T, respectively. This is because the significantly narrowed wakes band shortens the time for the inhibition of separation bubbles in cases with high f. Reduction of the separation bubble length and thickness is beneficial to reduce the loss of the integrated LPT-GV, but the increased separation bubble duration will raise its loss. This indicates that adjusting the wakes’ reduced frequency to balance the above two effects is the key to reducing the profile loss of the integrated LPT-GV.
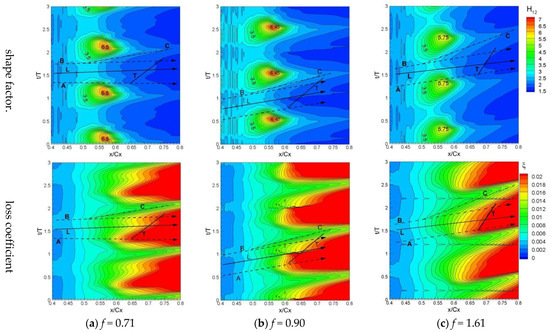
Figure 8.
Space-time diagrams of the H12 and ξ for various cases of f (Line A: right boundary of wake; Line B: left boundary of wake; Line C: bound of calm region; Line L: wake center trace; Line T: transition line).
The loss coefficient characterizes the magnitude of the viscous loss in the boundary layer. As the separation loss is non-viscous loss, the ξ in the region corresponding to the separation bubble is small in Figure 8. Along with increasing f, the separation bubble duration increases, resulting in the increasing width of the green color block (representing the low ξ) and the decreasing ξ. Within the sweeping interval of the wakes (Line A–B), ξ increases significantly with the wake-induced boundary layer transition. In the case of f = 1.61, the transition Line T is obviously behind that in the other two cases in Figure 8, and the yellow and red blocks representing the high ξ in the high f cases are located downstream of that in the low f cases, which indicates that ξ is obviously decreased in the high f cases. The leading edges of the isoline of ξ = 0.014 are located at 0.590Cx, 0.591Cx, and 0.604Cx for the three cases shown in Figure 8, respectively. Therefore, the above two aspects indicate that the total boundary layer loss coefficient (i.e., viscosity loss) decreases with increasing f.
Figure 9 shows the time-averaged Cp0 contour of Sections C1-C5 and the limiting streamlines on the LPT-GVs suction surfaces (marked by “SS”) in the cases of f = 0.71, 0.90, and 1.61. In the upper area of LPT-GV channel, the low-momentum fluid migrates faster radially in the lower f cases (such as f = 0.71) and accumulates on the shroud, which makes the boundary layer (the yellow blocks TBL in Section C1) on shroud significantly thicker than that in the higher f cases (such as f = 0.90). The thicker boundary layer on the shroud is conducive to promoting the pressure surface (PS) branch of the horseshoe vortex at the leading edge of the LPT-GV to develop into a large-scale passage vortex (PV). As shown in Section C2, the PV size in the case of f = 0.71 is significantly larger than that in the case of f = 0.90. However, in the case with higher f (i.e., f = 1.61), the PS branch of the horseshoe vortex entrains the residual wake vortices near the shroud (as shown by RWV in Section C1 for the case with f = 1.61) and then develops into a large-scale passage vortex, as shown in PV in Section C2. Under the radial downward pressure gradient, some of those passage vortices detach from the shroud and continue to move radially downward along the suction surface, as shown by PV2 in Section C3-C5. Compared with the lower f cases, the passage vortex (PV2) has a larger scale in the case of f = 1.61. The sweeping wake can completely eliminate the flow separation in the middle of the LPT-GV, as shown by the smooth time-averaged limiting streamline. However, as mentioned above, the separation bubble recovered after the wake passes has a smaller axial dimension and thickness in the high f cases (such as f = 1.61), so the time-averaged thickness of the boundary layer is thinner than that in the lower f cases. Near the hub, with increasing f, the initial boundary layer becomes thicker and the passage vortices (PV3) seem to become stronger, but there was not much difference among the passages vortices.
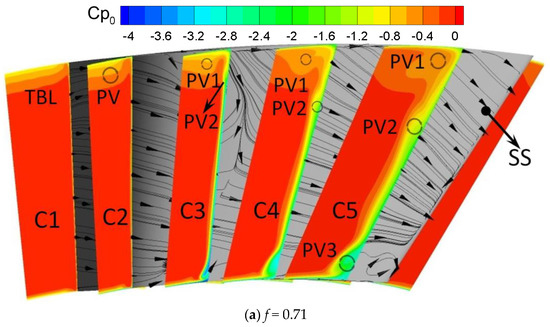
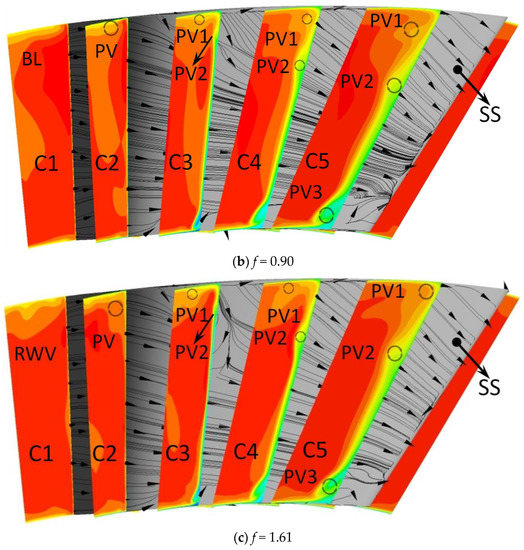
Figure 9.
The Cp0 contour of Sections C1-C5 and the limiting streamline on the LPT−GVs’ suction surfaces.
Figure 10 compares the pitchwise mass-averaged Cp0 in Section B9 for the three typical cases. In the upper area (h/H = 0.55–1.0), Cp0 is almost consistent when f > 0.90, while it decreases significantly in the lower f cases. This is because the enhanced passage vortices near the shroud (PV1 in Figure 9) increase the total pressure loss in the corresponding region for the low f cases (i.e., f = 0.71). As the region of h/H = 0.36–0.55 is dominated by the detached passage vortex (PV2 in Figure 9), the strongest PV2 in the case of f = 1.61 causes the Cp0 of the corresponding area to be the lowest among the three cases. In the lower region (h/H = 0–0.36), Cp0 in the case of f = 0.90 is smaller than that in the other two cases. Since this region is dominated by the PV3 (as shown in Figure 9) and the separated flow on the middle section of LPT-GV, the previous conclusion indicates that the intensity of PV3 is almost the same in all cases, so the change of the loss in this region is primarily affected by the flow separation. Compared with the case of f = 0.90, although the separation bubble size is larger in the case of f = 0.71, its duration is reduced, resulting in the decreased loss; in contrast, the separation bubble duration increases in the case of f = 1.61, but the sharp reduction of the separation bubble size also reduces the loss. In general, the most important influencing factor of sweeping wake on the LPT-GV loss is the passage vortices (PV1 and PV2) in the upper region, and both the thicker boundary layer on the shroud in the low f cases and the residual wake vortices around the casing in the high f cases can enhance PV1 and PV2, which means that there must be a suitable reduced frequency that can well suppress PV1 and PV2 to minimize the total loss of the LPT-GV.
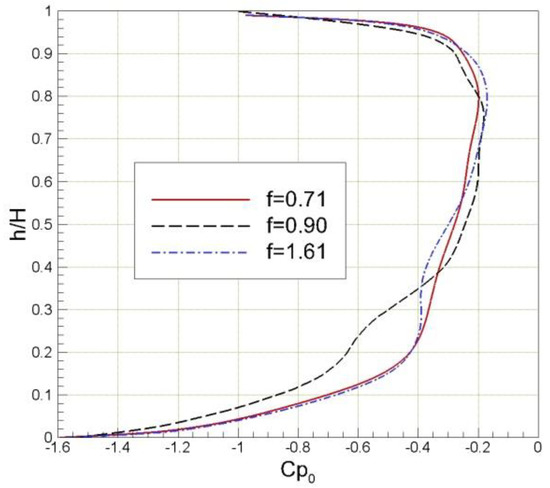
Figure 10.
Pitchwise-averaged Cp0 in Section B9.
Figure 11 compares the loss (Y) of the integrated AITD and its parts for the various f cases. The loss of the AITD, including the wake dissipation and the end-wall boundary layer loss, first decreases and then increases with increasing f, and its minimum value appears in the case of f = 1.34. This is because (1) when f < 1.34, the increasing distance between adjacent wakes weakens the wake interaction with increasing f, which is conducive to reducing the mixing loss of wakes; (2) when f > 1.34, the enhanced mixing of wake vortices near the hub is more significant, and causes a substantial increase in the loss of wake mixing. The loss of LPT-GV, including passage vortices loss, separation bubble loss, boundary layer viscosity loss, and wake dissipation, is almost the same in all cases, which means that the loss is less affected by the sweeping frequency of the upstream wake as it is almost dissipated before entering the LPT-GV due to the long propagation path. However, it still decreases first and then increases with increasing f, and its minimum value appears in the case of f = 0.90. This means that the sweeping wake can suppress the passage vortices in the top area of the LPT-GV channel well in this case, and f = 0.90 is the optimal reduced frequency to reduce the LPT-GV loss within the scope of this paper. Along with increasing f, the total loss first decreases and then increases in the integrated AITD and reaches its minimum value in the case of f = 1.34, which is 2.67% lower than that in the case with the maximum loss (f = 1.61). In comparison, the LPT-GV loss accounts for more than 80 of the integrated AID’s total loss, and is the largest loss source.
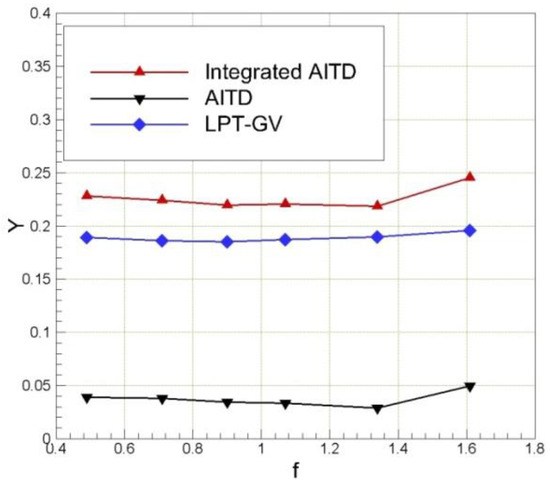
Figure 11.
Total pressure loss for the all cases.
4. Conclusions
A dynamic simulation was launched to study the influence of HPT rotor wake passing frequency on the flow mechanism in an integrated AITD. Sweeping rods were adopted to replace the HPT rotors to isolate the effect of its wake from those of other secondary flows. Along with increasing reduced frequency, the circumferential motion of the wake was also accelerated; its influence was multifaceted: (1) coupled with the radial secondary flow, it enhanced the wake vortex stretching and exhaustion near the hub; (2) it further increased the radial inclination of the wakes and the spacing between the adjacent wake vortices, resulting in the delay of wake vortex dissipation in the middle-upper area of the AITD channel; (3) it elongated and narrowed the wake vortex band (by as much as 40%). In the high f cases, the accelerated wake diffusion enhanced the turbulence intensity in the interval between the adjacent wakes, leading to an increase in the range of the high Tu region (up to 10%). The increasing Tu in the interval between the adjacent wakes could suppress the separation bubble size on the LPT-GV in advance before the wake center arrived, thereby reducing the separation loss. When the residual wake reached the LPT-GV, it could fully suppress the separation bubble within the scope of this paper. However, with increasing f, the narrower wake vortex band reduced the radial range and time of its suppression effect, which undoubtedly increased the separation loss. Therefore, balancing the above two effects by adjusting the wake sweeping frequency was the key to reducing the LPT-GV separation loss. In comparison, the suppression of the wake with different sweeping frequencies on the separation bubble had little effect on the loss of the LPT-GV, while the influence on the passage vortices in the top area of the LPT-GV passage was the decisive factor affecting the change of the loss. At low f, the enriched low-energy fluids around the casing thickened the boundary layer on the inlet end-wall of the LPT-GV and enhanced the passage vortices in the upper area; at high f, although there was no accumulation of low-energy fluid around the casing, a large number of residual wake vortices near the LPT-GV inlet end-wall could also strengthen the passage vortices in the upper area. Therefore, there was an optimal f to minimize the total pressure loss caused by passage vortices.
When f = 1.34, the influence of wake vortex interaction in the upper-middle regions of the AITD channel and wake vortex dissipation near the hub could be well balanced so that the loss of the AITD was minimized. For the LPT-GV, f = 0.90 is the optimal f within the scope of this paper, since the sweeping wakes with this f could minimize the total pressure loss caused by the passage vortices in the upper channel of the LPT-GV. For the integrated AITD, the LPT-GV was the largest loss source (accounting for >80%), but the trend of its total pressure loss was basically consistent with that of the AITD, which also reached a minimum when f = 1.34.
Author Contributions
Conceptualization, Z.L.; validation, S.S. and G.L.; formal analysis, H.L. and X.O.; writing—original draft preparation, Z.L.; writing—review and editing, S.S. and G.L.; supervision, Y.Z., X.L., G.X. and J.Z. All authors have read and agreed to the published version of the manuscript.
Funding
This research was funded by the National Natural Science Foundation of China (grant number 51906242) and the National Science and Technology Major Project (grant numbers J2019-II-0007-0027 and J2019-III-0020-0064).
Institutional Review Board Statement
Not applicable.
Informed Consent Statement
Not applicable.
Data Availability Statement
Not applicable.
Conflicts of Interest
The authors declare no conflict of interest.
Nomenclature
| AR: outlet-to-inlet area ratio | LP: low pressure |
| AITD: aggressive interturbine transition duct | LPT: low-pressure turbine |
| : resistance coefficient of the sweeping rod | LPT-GV: low-pressure turbine-guide vane |
| : total pressure coefficient | : radius of hub at the ITD inlet |
| : static pressure coefficient | : radius of casing at the ITD inlet |
| : streamwise vorticity coefficient | : reference plane (Plane B0) |
| : axial chord | : pitch of the LPT-GV at midspan |
| : diameter of the sweeping rod | : the sweeping rod spacing at midspan |
| : nondimensional diameter of the sweeping rod | T: the time of a full cycle sweeping wake |
| : reduced frequency | : turbulence intensity |
| : passing frequency of the HPT rotor | : mass-averaged exit velocity |
| FSTI: free stream turbulence intensity | : width of the wake |
| : height relative to hub | : nondimensional width of the wake |
| : annulus height of the ITD inlet | : total pressure loss |
| : shape factor | : nondimensional thickness of the first grid on wall |
| HP: high pressure | : cosecant of the relative flow angle at the HPT outlet |
| HPT: high-pressure turbine | : mean rise angle/momentum thickness |
| ITD: interturbine transition duct | : the exit flow angle |
| L: axial length of the ITD | : loss coefficient |
| L/H: nondimensional axial length of the ITD | : the minimum physical time step |
References
- Dominy, R.G.; Kirkham, D.A. The Influence of Blade Wakes on the Performance of Inter-turbine Diffusers. J. Turbomach. 1996, 118, 347–352. [Google Scholar] [CrossRef]
- Dominy, R.G.; Kirkham, D.A.; Smith, A.D. Flow Development through Inter-turbine Diffusers. J. Turbomach. 1998, 120, 298–304. [Google Scholar] [CrossRef]
- Zhang, X.; Hu, S.; Benner, M.; Gostelow, P.; Vlasic, E. Experimental and Numerical Study on an Inter-turbine Duct. In Proceedings of the ASME 2010 International Mechanical Engineering Congress and Exposition, Vancouverm, BC, Canada, 12–18 November 2010; Paper No.: IMECE2010-37322. pp. 679–690. [Google Scholar]
- Miller, R.J.; Moss, R.W.; Ainsworth, R.W.; Harvey, N.W. The Development of Turbine Exit Flow in a Swan-Necked Inter-stage Diffuser. In Proceedings of the ASME Turbo Expo 2003: Power for Land, Sea, and Air, Atlanta, GA, USA, 16–19 June 2003; Paper No.: GT2003-38174. pp. 863–875. [Google Scholar]
- Zhang, Y.; Hu, S.; Mahallati, A.; Zhang, X.; Vlasic, E. Effects of Area Ratio and Mean Rise Angle on the Aerodynamics of Inter-Turbine Ducts. J. Turbomach. 2018, 140, 091006. [Google Scholar] [CrossRef]
- Liu, J.; Wang, P.; Du, Q.; Liu, G.; Zhu, J. Effects of Rising Angle on Upstream Blades and Intermediate Turbine Duct. J. Therm. Sci. 2016, 25, 293–301. [Google Scholar] [CrossRef]
- Liu, H.; Ji, L.; Liu, J.; Du, Q.; Liu, G.; Wang, P.; Du, W. Numerical Investigation of the Effects of Rising Angle on Intermediate Turbine Duct and Nearby Turbines. J. Therm. Sci. 2017, 26, 421–430. [Google Scholar] [CrossRef]
- Norris, G.; Dominy, R.G. Diffusion Rate Influences on Inter-Turbine Diffusers. Proc. Inst. Mech. Eng. Part A J. Power Energy 1997, 211, 235–242. [Google Scholar] [CrossRef]
- Hu, S.; Zhang, Y.; Zhang, X.; Vlasic, E. Influences of Inlet Swirl Distributions on an Inter-Turbine Duct: Part I—Casing Swirl Variation. In Proceedings of the ASME Turbo Expo 2011: Power for Land, Sea, and Air, Vancouver, BC, Canada, 6–10 June 2010; Paper No.: GT2011-45554. pp. 619–630. [Google Scholar]
- Wang, Y. The Influence of Upstream Flow Angle Variation on Intermediate Turbine Duct. Appl. Mech. Mater. 2014, 670, 705–708. [Google Scholar] [CrossRef]
- Cuciumita, C.; Olaru, D.; Vilag, V.; Porumbel, I.; Riznyk, S.; Khomylyev, S. Experimental Measurements of Pressure Losses in the Inter-Turbine Duct of a Gas Turbine. Appl. Mech. Mater. 2015, 789, 540–548. [Google Scholar] [CrossRef]
- Marn, A.; Göttlich, E.; Malzacher, F.; Pirker, H. The Effect of Rotor Tip Clearance Size onto the Separated Flow through a Super-Aggressive S-Shaped Intermediate Turbine Duct Downstream of a Transonic Turbine Stage. J. Turbomach. 2012, 134, 051019. [Google Scholar] [CrossRef]
- Axelsson, L.U.; George, W.K. Spectral Analysis of the Flow in an Intermediate Turbine Duct. In Proceedings of the ASME Turbo Expo 2008: Power for Land, Sea, and Air, Berlin, Germany, 9–13 June 2008; Paper No.: GT2008-51340. pp. 1419–1426. [Google Scholar]
- Göttlich, E.; Marn, A.; Pecnik, R.; Malzacher, F.; Schennach, O.; Pirker, H. The Influence of Blade Tip Gap Variation on the Flow Through an Aggressive S-Shaped Intermediate Turbine Duct Downstream a Transonic Turbine Stage: Part II—Time-Resolved Results and Surface Flow. In Proceedings of the ASME Turbo Expo 2007: Power for Land, Sea, and Air, Montreal, QC, Canada, 14–17 May 2007; Paper No.: GT2007-28069. pp. 843–853. [Google Scholar]
- Schennach, O.; Pecnik, R.; Paradiso, B.; Göttlich, E.; Marn, A.; WoisetschläGer, J. The Effect of Vane Clocking on the Unsteady Flow Field in a One-and-a-Half Stage Transonic Turbine. J. Turbomach. 2008, 130, 031022. [Google Scholar] [CrossRef]
- Miller, R.J.; Moss, R.W.; Ainsworth, R.W.; Harvey, N.W. The Effect of an Upstream Turbine on a Low-Aspect Ratio Vane. In Proceedings of the ASME Turbo Expo 2004: Power for Land, Sea, and Air, Vienna, Austria, 14–17 June 2004; Paper No.: GT2004-54017. pp. 1417–1428. [Google Scholar]
- Marn, A.; Goöttlich, E.; Cadrecha, D.; Pirker, H.P. Shorten the Intermediate Turbine Duct Length by Applying an Integrated Concept. In Proceedings of the ASME Turbo Expo 2008: Power for Land, Sea, and Air, Berlin, Germany, 9–13 June 2008; Paper No.: GT2008-50269. pp. 1041–1051. [Google Scholar]
- Spataro, R.; Santner, C.; Lengani, D.; Göttlich, E. On the Flow Evolution through a LP Turbine with Wide-Chord Vanes in an S-Shaped Channel. In Proceedings of the ASME Turbo Expo 2012: Turbine Technical Conference and Exposition, Copenhagen, Denmark, 11–15 June 2012; Paper No.: GT2012-68178. pp. 1011–1020. [Google Scholar]
- Faustmann, C.; Zerobin, S.; Spataro, R.; Marn, A.; Heitmeir, F.; Göttlich, E. On the Acoustics of a Turning Mid Turbine Frame with Embedded Design in a Two-Stage Test-Turbine. Proc. Inst. Mech. Eng. Part A J. Power Energy 2015, 229, 529–538. [Google Scholar] [CrossRef]
- Bader, P.; Sanz, W.; Spataro, R.; Göttlich, E. Flow Evolution through a Turning Mid Turbine Frame with Embedded Design. In Proceedings of the ASME Turbo Expo 2014: Power for Land, Sea, and Air, Düsseldorf, Germany, 16–20 June 2014. Paper No.: GT2014-25009. [Google Scholar]
- Liu, H.; Liu, J.; Ji, L.; Du, Q.; Liu, G.; Wang, P. Influence of Reynolds Number on the Unsteady Aerodynamics of Integrated Aggressive Intermediate Turbine Duct. J. Therm. Sci. 2018, 27, 294–303. [Google Scholar] [CrossRef]
- Xu, Q.; Wang, P.; Du, Q.; Liu, J.; Liu, G. Effects of Axial Length and Integrated Design on the Aggressive Intermediate Turbine Duct. Proc. Inst. Mech. Eng. Part A J. Power Energy 2018, 233, 443–456. [Google Scholar] [CrossRef]
- Liu, J.; Du, Q.; Liu, G.; Wang, P.; Zhu, J. Effects of Nozzle-Strut Integrated Design Concepton on the Subsonic Turbine Stage Flowfield. J. Therm. Sci. 2014, 23, 494–504. [Google Scholar] [CrossRef]
- Mahallati, A. Aerodynamics of a Low Pressure Turbine Airfoil Under steady and Periodically Unsteady Conditions. Ph.D. Thesis, Carleton University, Ottawa, ON, Canada, 2004. [Google Scholar]
- Meyer, R.J. The Effect of Wakes on the Transient Pressure and Velocity Distributions in Turbomachines. ASME J. Basic Eng. 1958, 80, 1544–1552. [Google Scholar] [CrossRef]
- Stieger, R.D. The Effects of Wakes on Separating Boundary Layers in Low Pressure Turbines. Ph.D. Thesis, Cambridge University, Cambridge, UK, 2002. [Google Scholar]
- Liu, H.; Liu, J.; Du, Q.; Liu, G.; Wang, P. Unsteady Flow Mechanism of the integrated Aggressive Inter-turbine Duct in Low Reynolds number condition. Proc. Inst. Mech. Eng. Part G J. Aerosp. Eng. 2020, 234, 1507–1517. [Google Scholar] [CrossRef]
- Liu, H.; Liu, J.; Du, Q.; Liu, G.; Wang, P. Impact of Turbulence Intensity on the Unsteady Flow Characteristics of the integrated Aggressive Inter-turbine Duct. Proc. Inst. Mech. Eng. Part A J. Power Energy 2020, 234, 490–499. [Google Scholar] [CrossRef]
- Lei, Z.; Liu, H.; Li, G.; Gong, J.; Zhang, Y.; Lu, X.; Xu, G.; Zhu, J. Influence of Wake Intensity on the Unsteady Flow Characteristics of the Integrated Aggressive Interturbine Duct. Appl. Sci. 2022, 12, 6655. [Google Scholar] [CrossRef]
- Shah, I.; Aziz, S.; Soomro, A.M.; Kim, K.; Choi, K.H. Numerical and experimental investigation of Y-shaped micromixers with mixing units based on cantor fractal structure for biodiesel applications. Microsyst. Technol. 2021, 27, 2203–2216. [Google Scholar] [CrossRef]
- Irfan, M.; Shah, I.; Niazi, U.M.; Ali, M.; Ali, S.; Jalalah, M.S.; Khan, M.K.A.; Almawgani, A.H.M.; Rahan, S. Numerical analysis of non-aligned inputs M-type micromixers with different shaped obstacles for biomedical applications. Proc. Inst. Mech. Eng. Part E J. Process Mech. Eng. 2022, 236, 870–880. [Google Scholar] [CrossRef]
Publisher’s Note: MDPI stays neutral with regard to jurisdictional claims in published maps and institutional affiliations. |
© 2022 by the authors. Licensee MDPI, Basel, Switzerland. This article is an open access article distributed under the terms and conditions of the Creative Commons Attribution (CC BY) license (https://creativecommons.org/licenses/by/4.0/).