1. Introduction
Earthquakes directly manifest the latest activities of active faults, and strong earthquakes can produce tens to hundreds of kilometers of surface ruptures and various fault-displaced landforms [
1]. Coseismic surface rupture zones refer to the surface rupture and deformation of the epicenter fault, which is characterized by a narrow band along the seismogenic fault [
2]. The spatial distribution and deformation characteristics of coseismic rupture zones are the intuitive geomorphological manifestations of deep fault activity on the surface of the earth. They record earthquake ruptures and fault movements and reflect regional stress and crustal movement [
3]. Therefore, investigating post-earthquake surface rupture zones is important for understanding the tectonics of seismogenic faults.
Sub-meter optical remote-sensing images (Quickbird, WorldView-2/3, aerial remote-sensing images, and unmanned aerial vehicle (UAV) images) can be used to identify the linear traces of steep seismic sills, most surface rupture basic units, and the plane combination characteristics of strike-slip earthquakes, making them an ideal information source for the rapid identification of post-earthquake surface ruptures [
4]. In particular, UAV images with a centimeter-level spatial resolution can identify all types of surface ruptures at a centimeter scale. Furthermore, UAV photogrammetry technology applied in terrain surveys is low cost, highly safe, and easy to operate. The UAV data are easy to obtain and process. The structure from motion (SFM) algorithm of PhotoScan software can quickly process UAV photos into centimeter-level digital elevation models and orthophoto images. The results can meet the needs of the quantitative parameter extraction of coseismic surface ruptures and structure research in an earthquake emergency. Relevant scholars have used high-resolution UAV data to analyze giant coseismic surface rupture zones [
5,
6]. Their analysis results provide direct evidence for ascertaining the geometric, kinematic, and dynamic characteristics of the seismogenic fault. However, artificial visual interpretation and traditional image processing are the primary methods for finely interpreting high-precision UAV photos of earthquake surface ruptures. Manual visual interpretation is time-consuming and labor-intensive, and its recognition accuracy is highly dependent on the ability of experts. Ideally, traditional image processing methods, such as edge detection [
7] and Gabor filtering [
8], only have high detection accuracy if the crack has good continuity and high contrast. However, external disturbances can easily affect the results of traditional methods [
9]. Unfortunately, the distribution of cracks and noise interference are complex and diverse, which leads to poor results in traditional crack detection algorithms.
The crack identification method based on deep learning does not require the pre-definition of crack features or image preprocessing but learns and automatically extracts features through samples to identify and extract cracks. Recently, deep learning has achieved great success in image processing and other fields, and several results have been achieved in combination with deep learning for crack identification (such as road crack detection [
10], bridge inspection [
11], house crack detection [
12], and fault identification [
13]). Hsieh and Tsai [
14] divided the current crack identification and extraction algorithms into three categories based on deep learning: (1) image classification [
15,
16], (2) target detection [
17], and (3) image segmentation [
18]. However, neither the image classification algorithm nor the target detection algorithm can directly extract cracks from the image at the pixel level. The two methods must combine traditional image segmentation techniques, such as edge detection, to complete the pixel-level extraction of cracks. However, compared with traditional digital image processing technologies, these algorithms can remove most background noise in the image for better crack identification results. The image segmentation algorithm can directly extract cracks from the original image. In addition, this algorithm can generate pixel-level predictions of cracks in the image. In other words, each pixel in the image is classified as cracked or non-cracked.
This study applies the image segmentation algorithm based on deep learning to extract cracks from post-earthquake remote-sensing images. The fully convolutional network (FCN) model [
19] is the most commonly used model for crack segmentation. FCN converts the fully connected layer into a convolutional layer on the basis of the VGG network, and an upsampling operation is performed on the feature map by transposed convolution. Then, the feature map is restored to the original size so that each pixel of the image is predicted and the crack image segmentation is realized. Liu et al. [
20] applied the U-Net network to concrete crack detection; compared with the FCN network, the U-Net network can achieve higher accuracy through a smaller training set. U-net is an improved image segmentation network based on FCN. The network adopts a symmetric structure of encoding–decoding and uses skip connections to fuse low-level semantic features and high-level semantic features. U-Net greatly improves the segmentation accuracy of the model and is widely used in medical image segmentation [
21]. DeepCrack [
22] is a new model that utilizes a deep hierarchical neural network for crack segmentation at the pixel level. The DeepCrack model uses the first 13 layers, which correspond to the first 13 layers in VGG-16, but the fully connected layers and fifth pooling layer are removed to achieve meaningful side-output with different scales and decreased memory requirements and computation time.
Earthquake surface rupture identification based on deep learning is a challenging issue.
- (1)
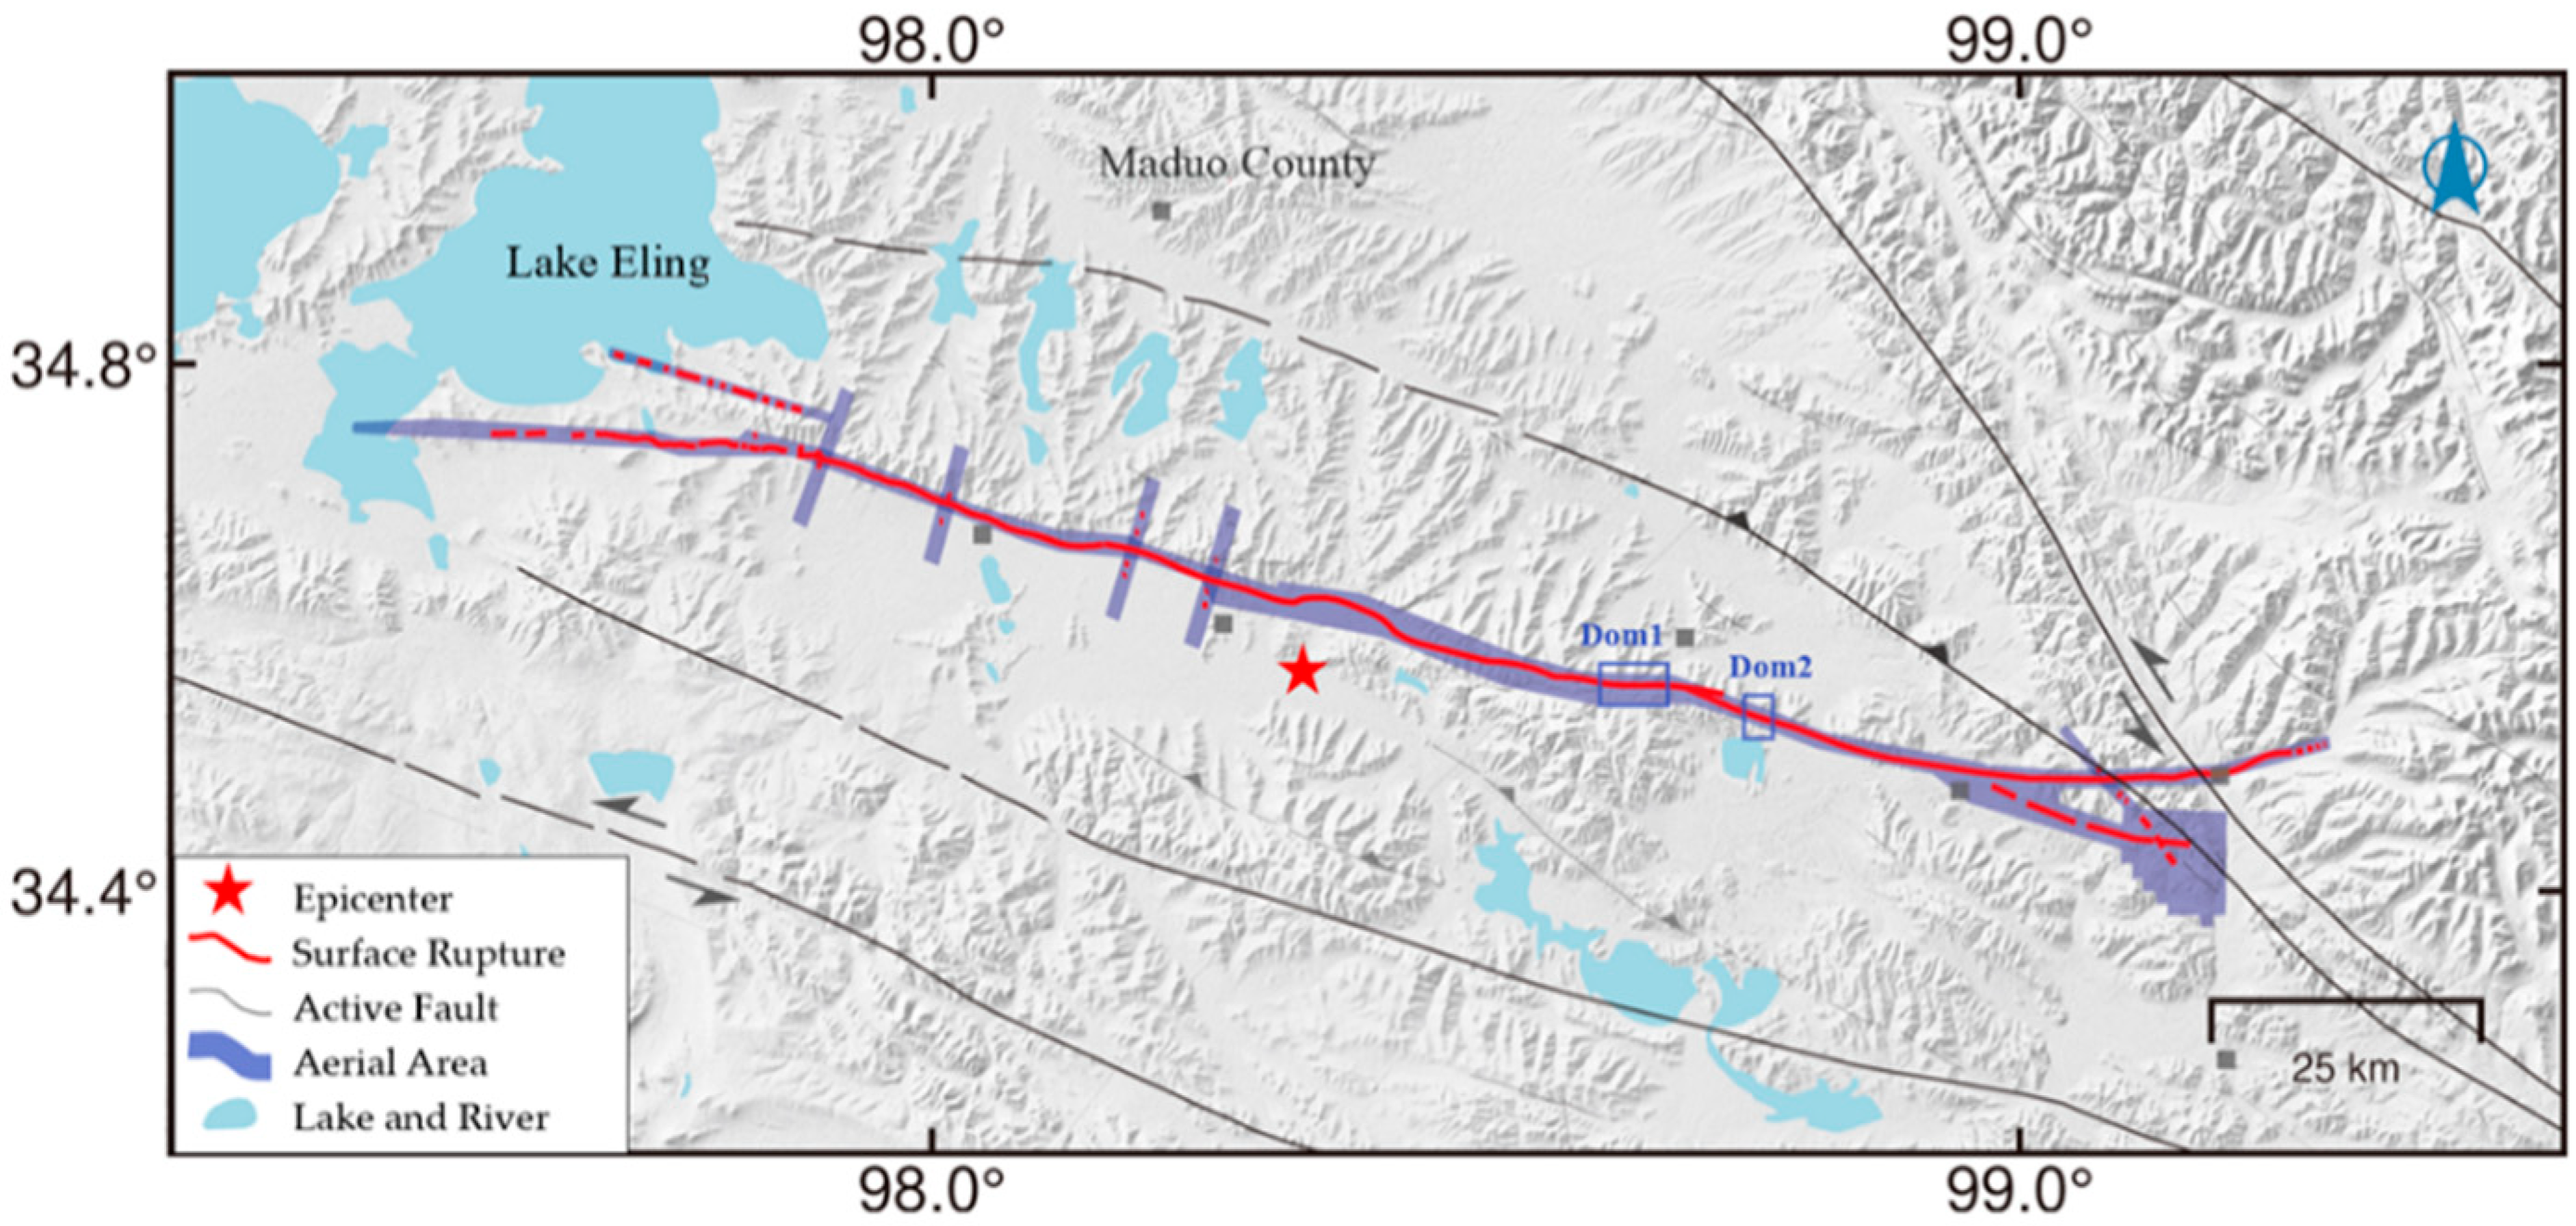
Compared with crack identification in roads, houses, and concrete buildings, the background of post-surface earthquake surface rupture images is more complex. The surface ruptures of the Maduo MS 7.4 earthquake are distributed in different geographic regions, such as mountains, grasslands, swamps, alluvial fans, and dunes.
- (2)
The characteristics of post-earthquake surface ruptures have complex shapes and changeable directions, which commonly have oblique, arc-shaped, and cluster-shaped distributions. In addition, post-earthquake surface ruptures can appear in any position and direction, making them difficult to distinguish.
This study applies the deep learning semantic segmentation method to segment the remote-sensing images of earthquake surface ruptures. In addition, we create a series of improvements to the VGG16 model [
23] based on the characteristics of post-earthquake surface rupture images to improve the extraction accuracy of surface ruptures in the remote-sensing images. Based on the proposed deep learning method, we could automatically identify and draw small and irregular surface ruptures from high-resolution UAV images to achieve the high-efficiency, high-precision, and intelligent detection of post-earthquake surface rupture damage.
3. Methods
3.1. Deep Learning Network Model
After preparing the sample data, a suitable deep learning network must be built for identifying surface cracks in high-resolution UAV images. The purpose is to identify tiny linear targets, indicating surface cracks, using the trained deep learning model in the UAV image.
Therefore, the receptive field should be increased to obtain more image features and combine multi-scale information to achieve better segmentation results when designing the network. A good network structure can achieve qualified results with a small number of samples if we balance the cost of manual interpretation of the samples and the timeliness of the post-earthquake disaster assessment.
This study selected the 16-layer visual geometry group (VGG16) network as the primary network architecture. Then, we improved and optimized the network, constructing a deep learning semantic segmentation network that can directly realize the end-to-end recognition of surface cracks in high-resolution UAV images. The VGG network series is a very mature network structure that has shown outstanding results in image classification and object detection tasks [
27].
We improved the VGG16 network and deleted several convolutional layers to reduce computation and memory consumption. Moreover, we added dilated convolution and spatial pyramid pooling (ASPP) to make the network perform well in surface crack identification. The network architecture is shown in
Figure 4. The comparison of the number of parameters and Giga Floating Point Operations (GFLOPs) is shown in
Table 1. After the improvement, our network only contained about 2.54 million parameters and performed 6.4 GFLOPs.
The following improvements were made based on the VGG16 network architecture. First, the network was transformed into an FCN to achieve end-to-end semantic segmentation. Then, the step of the 3 × 3 convolution kernel was set as 1 in the front part of the entire network. The next convolutional layer consisted of convolution kernels with a size of 1 × 1 and a step of 1.
The filter size of the pooling layer was 2 × 2, and the step of the Pool1 layer was 2. However, to achieve dilated convolution, we set layers Pool2 and Pool3 (step of 1) and adopt the rectified linear activation function (ReLU). The first and second layers of the entire network still used standard convolution.
For a larger receptive field in the extracted feature map, the third convolutional layer used dilated convolution. In addition, to alleviate the grid effect caused by dilated convolution, the network adopted a hybrid dilated convolution (HDC) design [
28].
To identify small and large objects in the crack identification process, we designed the dilation rate to increase from low to high and follow the rules proposed by Wang et al. [
28]. Therefore, we set dilation rates of [
1,
3,
5] for each layer. Then, to implement an FCN, we applied the convolution kernels with a size of 1 × 1 and convolutions with a step size of 1 for the fourth, fifth, and sixth layers of the original fully connected layer.
We used an atrous spatial pyramid pooling (ASPP) module to achieve multi-scale fusion and obtain more information [
29] (
Figure 5). In the FC4 layer, four sets of different dilated convolutions with dilation rates of 6, 12, 18, and 24 were used, respectively, the FC5 layers and FC6 layers were connected, and the fusion of pixel addition was performed.
Finally, the SoftMax function was applied to obtain the predicted probability label map. Good results can be obtained by direct bilinear upsampling on the probability map. The label class determines the segmentation results of cracks in high-resolution drone images with the highest SoftMax probability at each pixel.
3.2. Training Methods of Models
After building the model architecture, we set the model initialization method, activation function, loss function, and parameter update method. During the training process, the Xavier method was applied to initialize all the training values; downsampling was performed by max pooling for the pooling layer, and the ReLU activation function was used.
In addition, the dropout method was used to reduce overfitting in the neural network. Each class of the SoftMax loss function can output a normalized probability in the last layer of the network. Therefore, we classified the classes by their probabilities and restored the classification results to the original image size through bilinear upsampling. We used the adaptive moment estimation (Adam) optimizer to train our network.
For each pixel in the input image of the high-resolution UAV image, the output of the corresponding training model is expressed as the posterior probability that the pixel belongs to the crack. Our crack identification was a pixel binary classification task performed on high-resolution UAV images. Typically, the binary segmentation task for common images is to use a binary cross-entropy loss function, as shown in Equation (1), where
N denotes the number of pixels in the input image. The term
represents the true binary labels and
represents the prediction probabilities computed from the SoftMax function.
For most classification problems, the deep learning samples have a balanced distribution and apply regular cross-entropy loss functions. However, crack identification in high-resolution UAV images is a binary classification issue, and the number of cracks and non-cracks is highly unbalanced, i.e., there are significantly more non-crack samples than crack samples. Zero prediction is a good solution for loss function convergence in crack segmentation problems. Therefore, by applying the regular cross-entropy loss function, the network would quickly converge in the wrong direction and make many zero predictions. To solve the problem of unbalanced samples, we weighted the loss function and used the weighted cross-entropy loss [
30] function, which can be expressed as:
where α is the ratio of non-cracks to the samples in the training data; the network model can converge accurately by adjusting the weights in the loss function.
4. Results and Analysis
After determining the deep learning network and training method, we used the data from the study area to train and test the network. The experimental test platform was a Dell Precision T3610 motherboard with Intel(R) Xeon(R) CPU E5-1660 v2@3.70 GHz (12 CPUs), ~3.7 GHz, and an NVIDIA Quadro K600 graphics card. The environment for deep learning was built using the Google deep learning framework TensorFlow with a primary programming language, Python. In addition, GPU acceleration was used to perform high-performance computing.
The experimental data of two regions, maduoDom1 and maduoDom2, were used for testing. As shown in
Figure 6, the red lines are artificially marked surface cracks. In the maduoDom1 data, we cropped 1155 high-resolution UAV images and removed the data without cracks. Finally, we extracted 507 images with cracks, randomly selected 480 UAV images with crack labels for training, and used the remaining 27 UAV images for testing. Similarly, for the maduoDom2 data, we extracted 176 images with cracks from the cropped 348 high-resolution UAV images and randomly selected 150 and 26 UAV images and their crack labels to train and test the model. While training the crack recognition model with two datasets, we set the learning rate to 0.001. For the maduoDom1 array, 12 blocks were selected as a batch, and the entire training data set was trained for 26 epochs. For the maduoDom2 data, ten blocks were selected as a batch, and 18 training epochs were performed. The entire model training process randomly selected training images to test the results after several epochs.
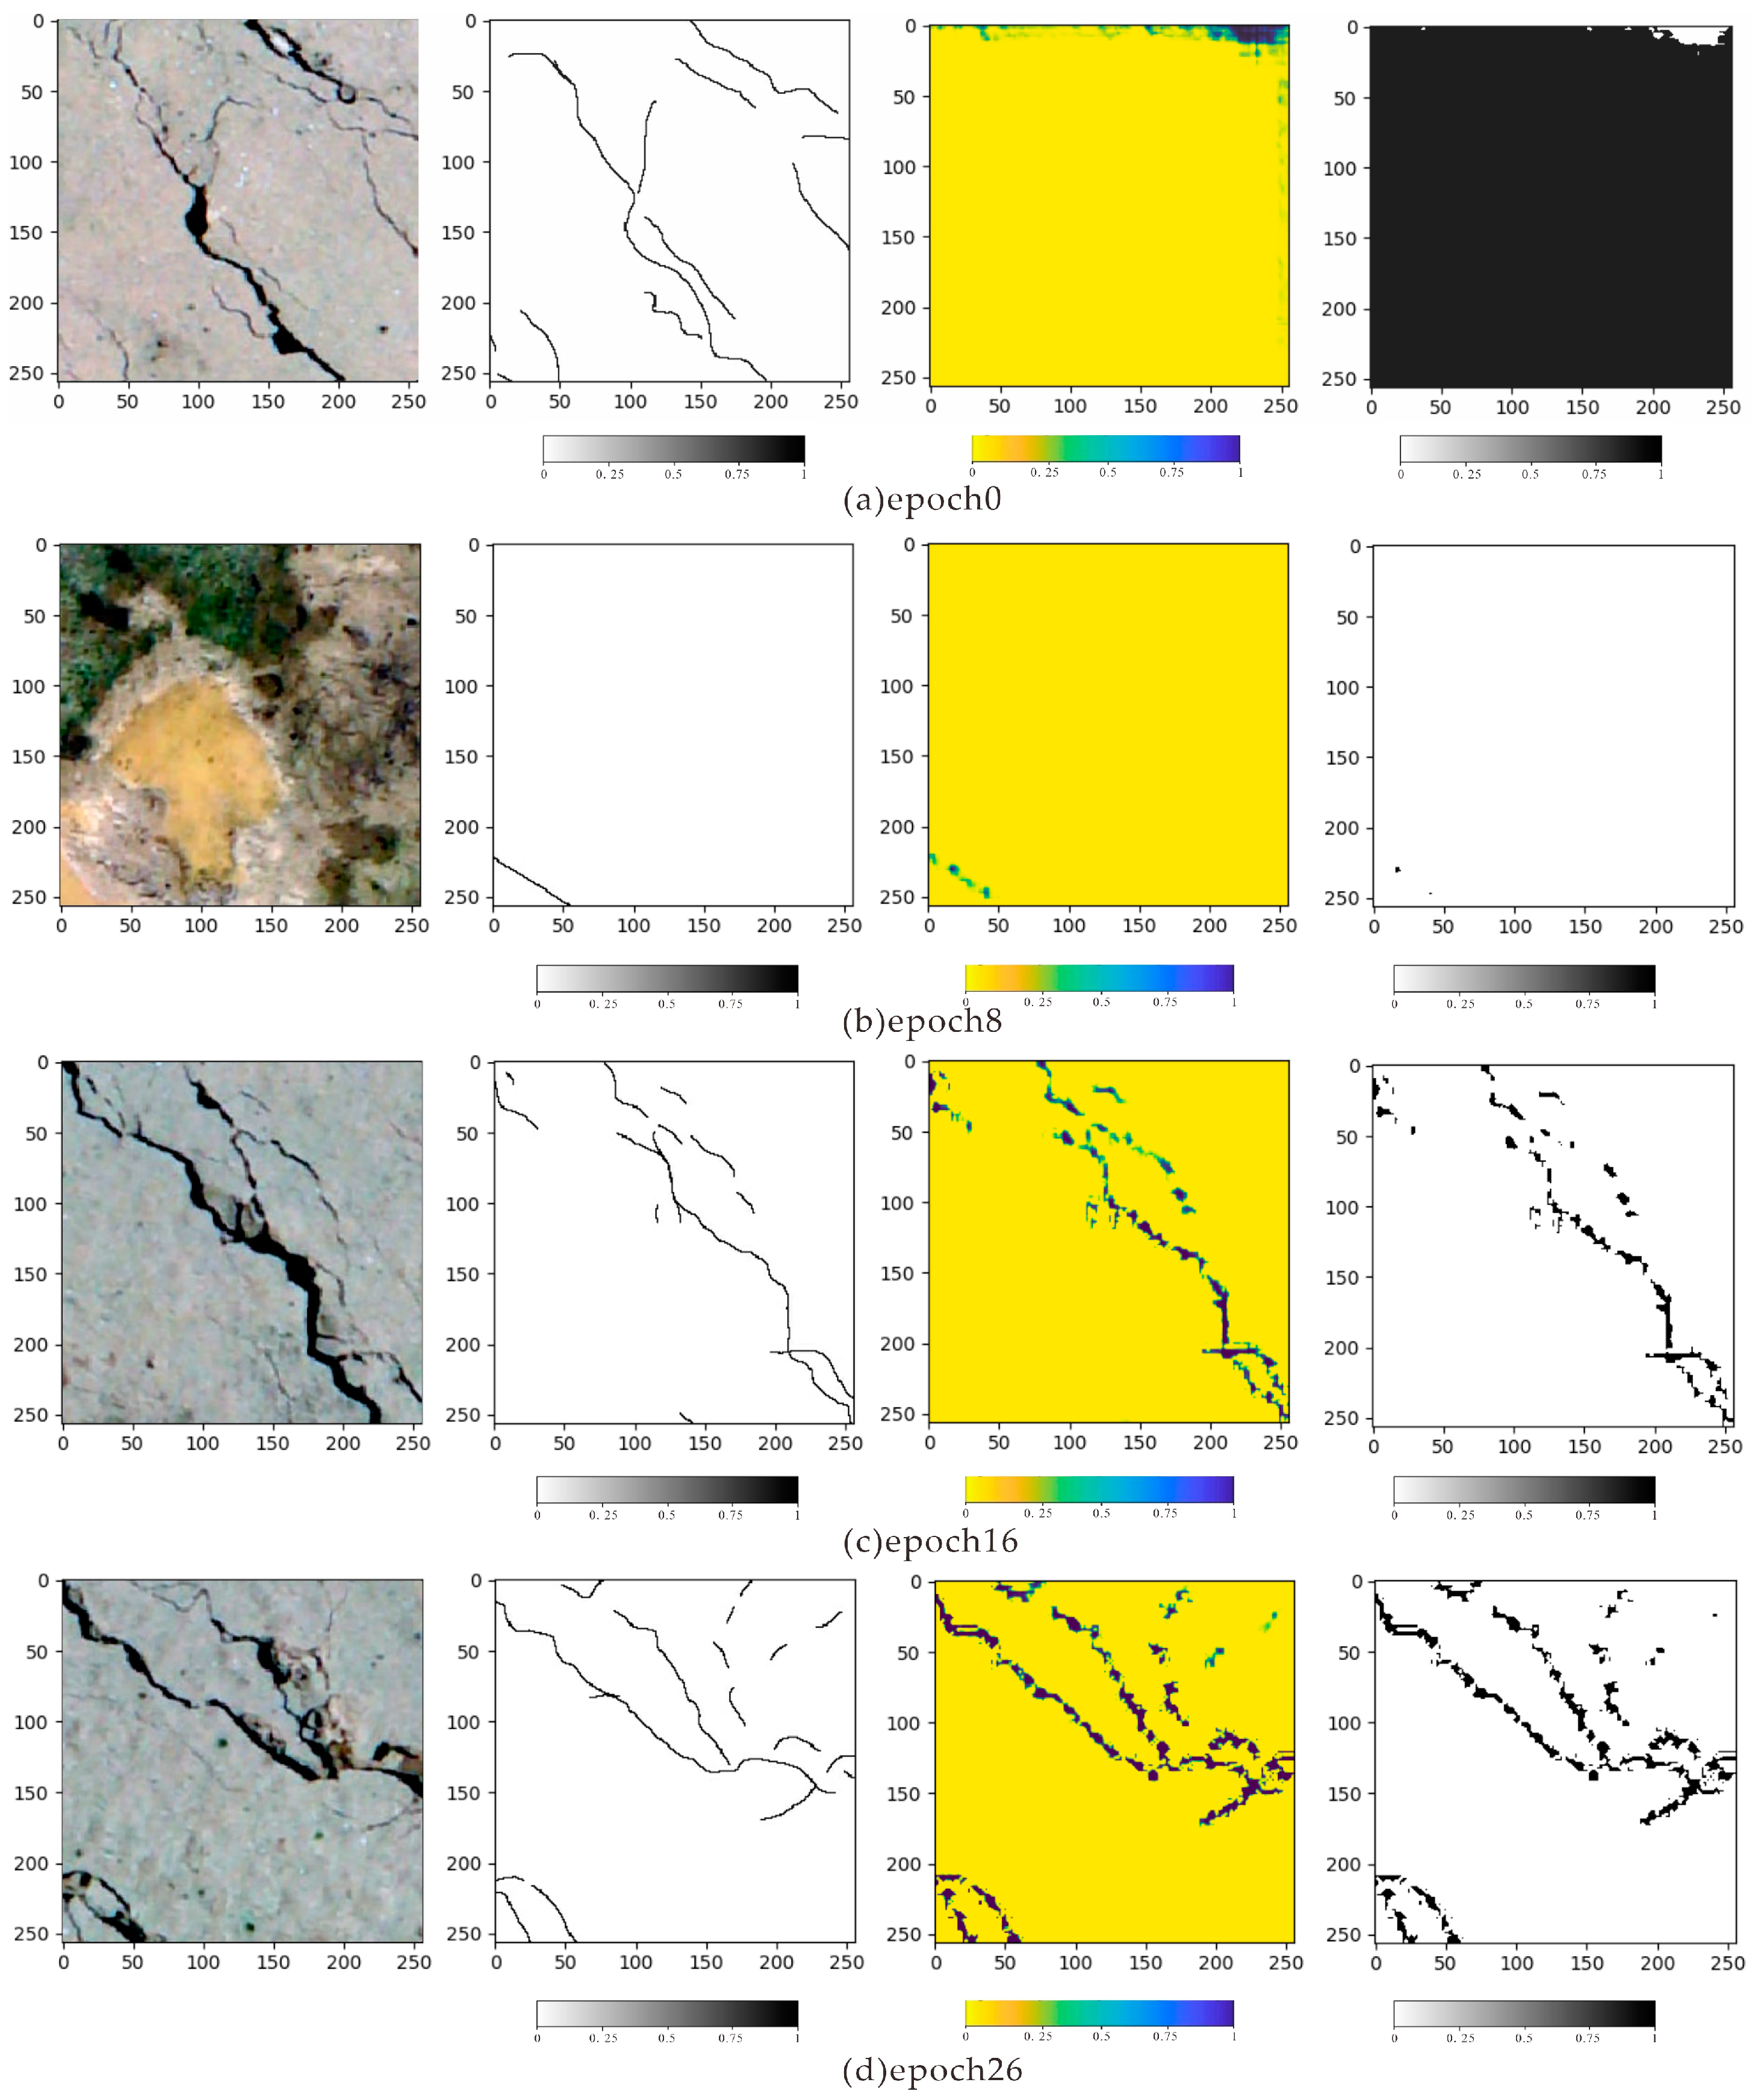
The training process of the maduoDom1 data is shown in
Figure 7. Each row depicts a high-resolution UAV image, a label, the current prediction crack probability, and the prediction results.
Figure 7a is a comparison of the predicted results after all learning parameters are initialized by Xavier.
Figure 7b shows the crack identification result after the eighth epoch training. Here, the crack location has been identified, but many parts are still missing in the result.
Figure 7c shows the crack identification results after 16 epochs. Most cracks could be identified, and the missing parts gradually became smaller.
Figure 7d shows the crack identification result after the 26 epochs, which could accurately identify the crack location and is similar to the actual situation.
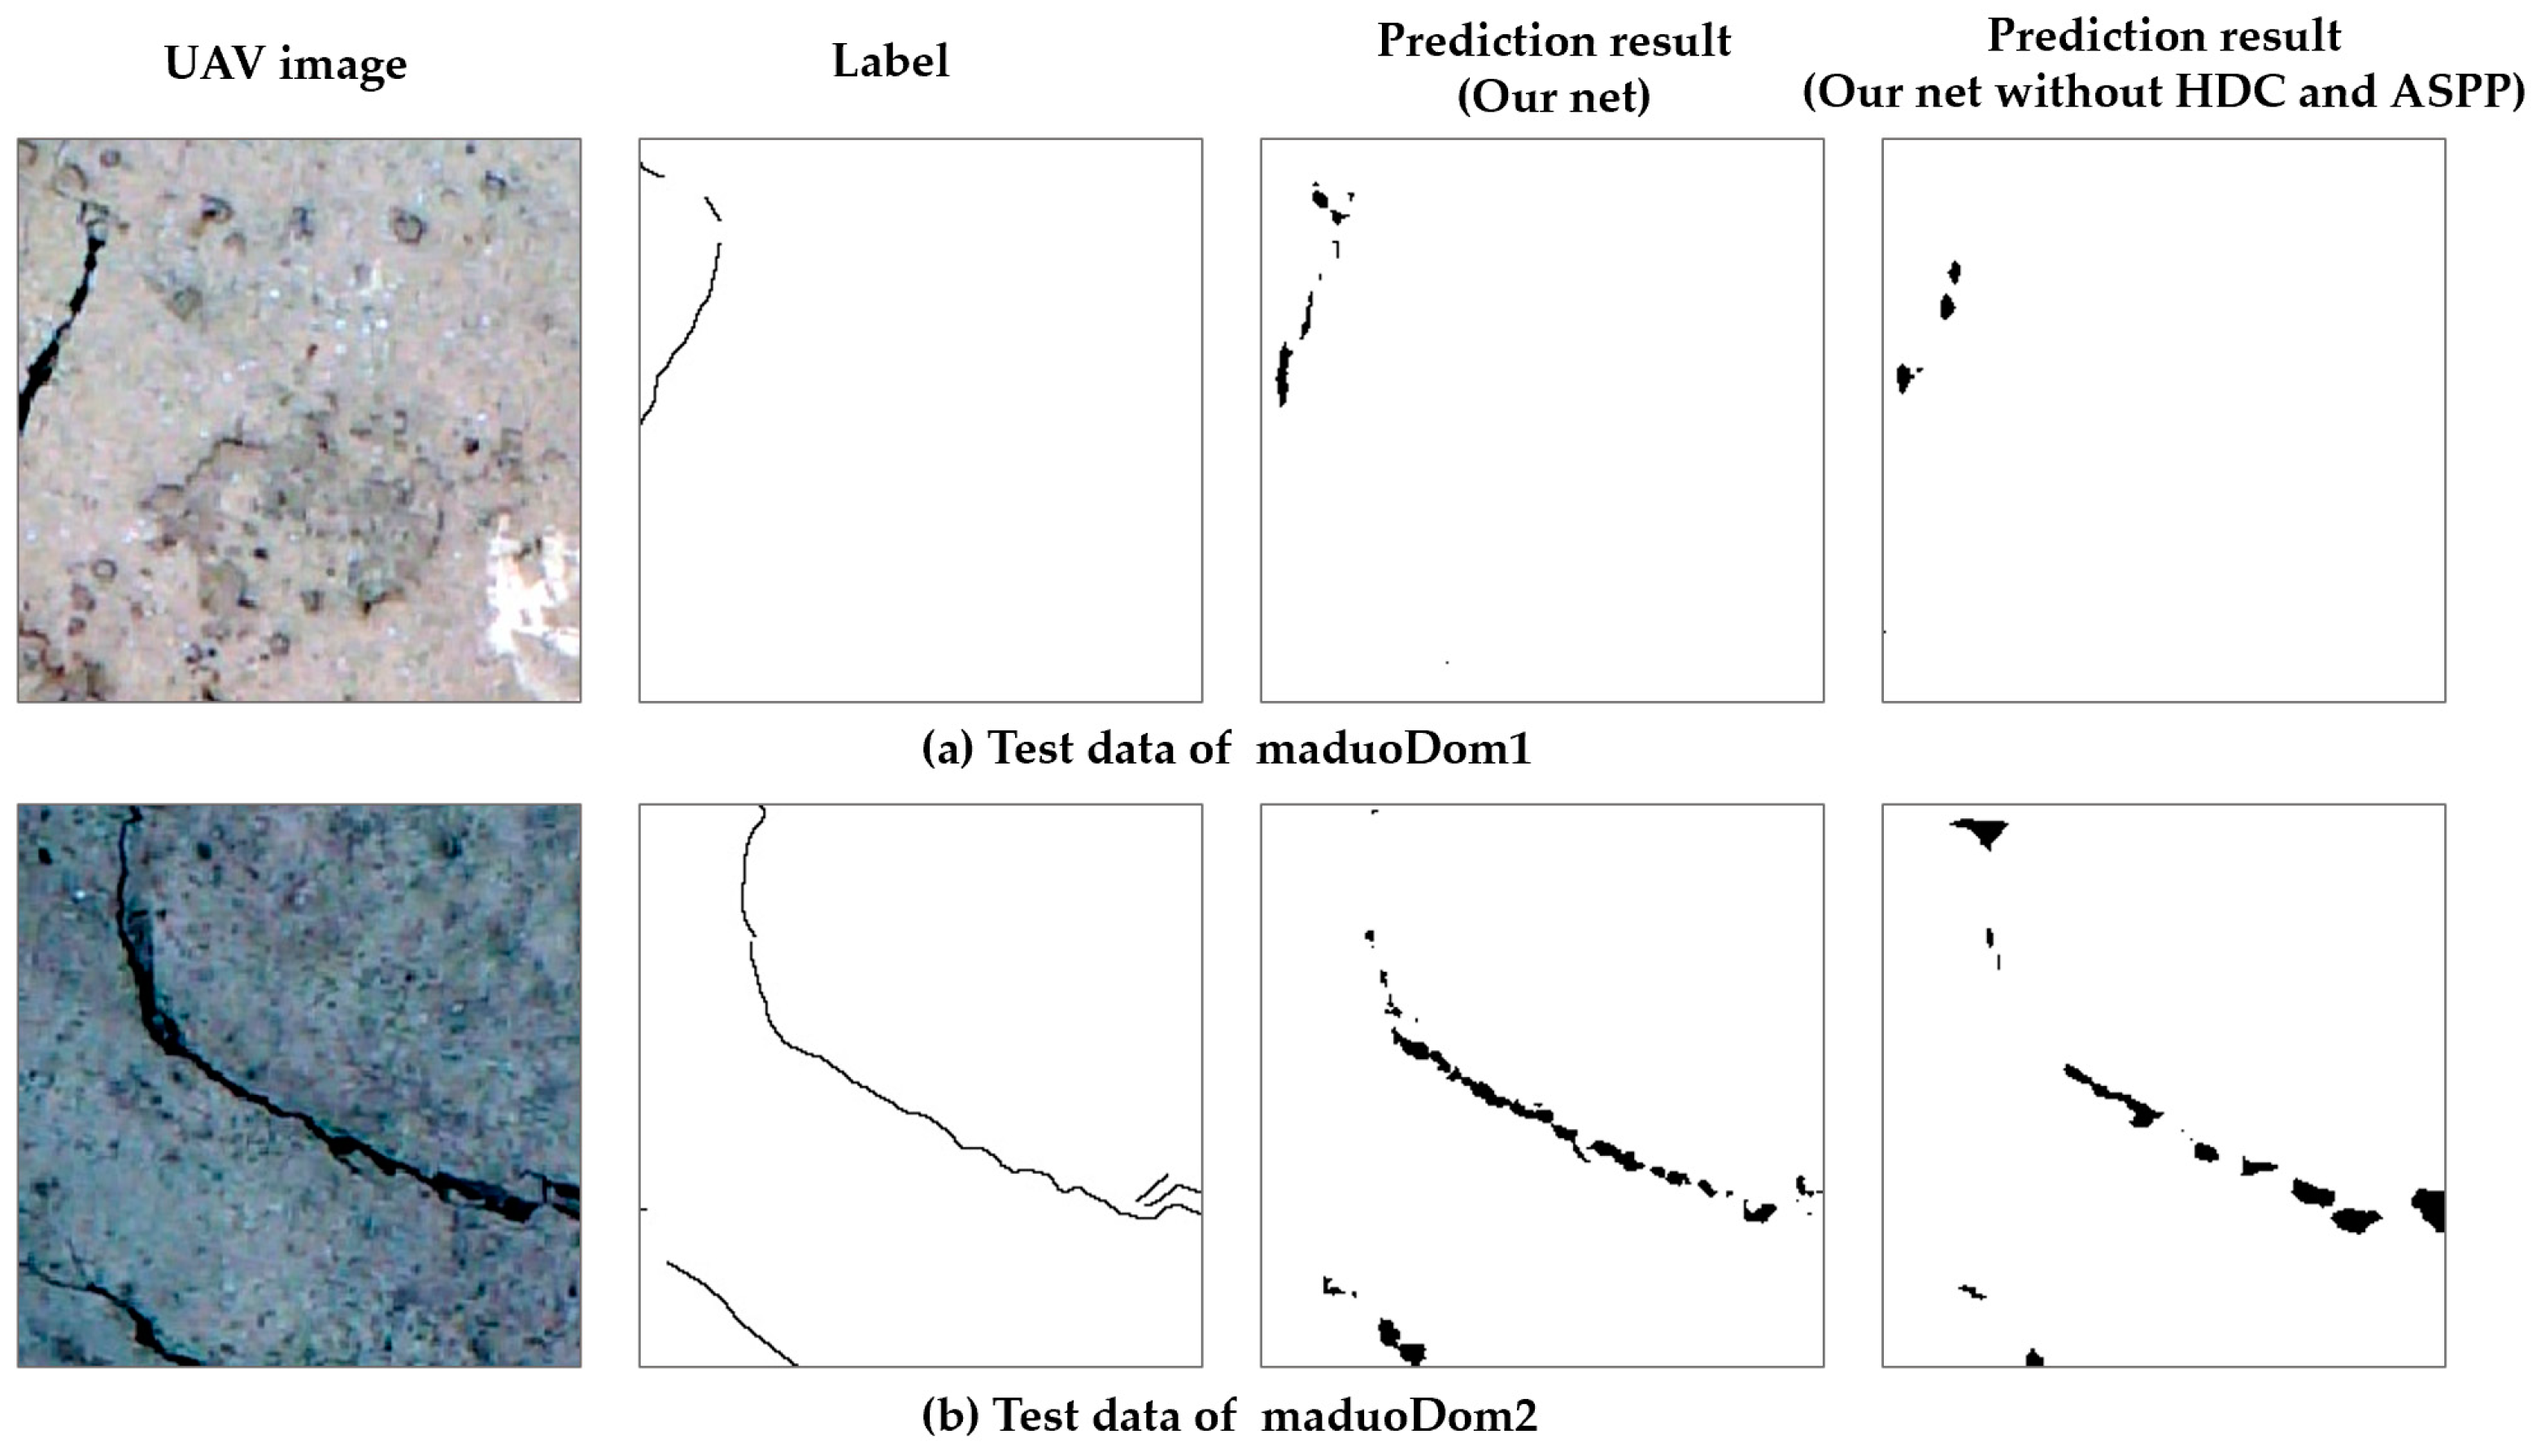
After training, we used the trained models to predict cracks in the two datasets and test the crack identification effect of the model. In addition, we randomly selected two image identification results from the prediction results for comparison (
Figure 8). Unfortunately, the crack details were still lacking, and the results were not entirely consistent with the original labels. The trained model can, however, accurately determine the location of the cracks, and the required computational time is very short (a high-resolution crack prediction could be made within 1 s). In addition, we quantitatively evaluated the recognition results of the two datasets (
Table 2). The commonly used evaluation indicators for deep learning semantic segmentation, such as evaluation index accuracy rate, F1 value, and average intersection ratio, were calculated. Compared with the original labels in the test data, the trained model had a reasonable accuracy rate of more than 97%. Furthermore, the F1 value exceeded 0.51, and the mIoU value exceeded 0.50. These evaluation results showed that the deep learning model obtained by training could perform well in the crack identification problem. In order to compare the differences in the recognition results of different network structures, we constructed a model where the HDC and ASPP structures were removed, the Conv3 layer and FC4 layer were replaced by ordinary convolution, and other structures remained unchanged. The model was trained to identify cracks under the same conditions. The comparison results are shown in
Figure 8, where it can be seen that our network can predict more effective crack information than the network without HDC and ASPP. We also drew the ROC curves of the two models in the maduoDom1 and maduoDom2 training sets and test sets, respectively, as shown in
Figure 9. We can see that our network performance is better.
Deep learning can accurately identify the crack areas in high-resolution UAV data. Nevertheless, small cracks remain difficult to identify. Therefore, we attempted to study whether the size of the crack area impacts the identification ability of the model. We marked the cracks with bold lines to increase the crack area and trained the deep learning model with new samples. For maduoDom1 and maduoDom2, the processing results using the bold-marked cracks are shown in
Figure 10.
First, we obtained 533 and 187 UAV high-resolution aerial images with bold labels in the maduoDom1 and maduoDom2 data, respectively. Then, we randomly selected 500 samples from the bold-labeled maduoDom1 data for training and 33 images for testing. We also randomly selected 160 samples for training and 27 images for testing in the bold-labeled maduoDom2 data.
After the labels were changed to bold labels, the constructed semantic segmentation network was trained with the two processed datasets, and the optimal prediction model was obtained based on the loss value. The model converged faster during training with bold crack labels than without. After obtaining the optimal model, we performed crack identification and prediction for the two models in the two datasets. One of the identification results is shown in
Figure 11. The recognition effect was significantly improved: both the crack position and the fitness were extremely accurate. Furthermore, the cracks predicted by the model were similar to the labels, indicating that the bold labeling of crack samples is conducive to improving the crack identification ability of the model. Similarly, we quantitatively evaluated the prediction effect of the two datasets (
Table 2). The accuracy of the evaluation results in the test set exceeded 0.86. Compared with the original model trained with non-bold labels, the model trained with the bold crack labels displayed lower accuracy but better fitness of the cracks. In addition, the F1 and mIoU values in the test set were greatly improved because the crack area increases with the bold labels and the model can identify more cracks. Similarly, for the bold-labeled data, we also trained the model that removed HDC and ASPP structures from the network we improved. The prediction results of the different networks are shown in
Figure 11. Our network structure trained on bold-labeled data still has good crack recognition results.


