
Effects of Varroa destructor on Hemolymph Sugars and Secondary Infections in Honeybees (Apis mellifera)

 , and
, and 
Abstract
Featured Application
Abstract
1. Introduction
2. Materials and Methods
2.1. Cohort Study
2.2. Parasitic Load
2.3. Honeybee Sampling
2.4. Hemolymph Sample
2.5. Sugar Concentrations
2.6. Bacteriology
2.7. Virology
2.8. Statistical Analysis
3. Results
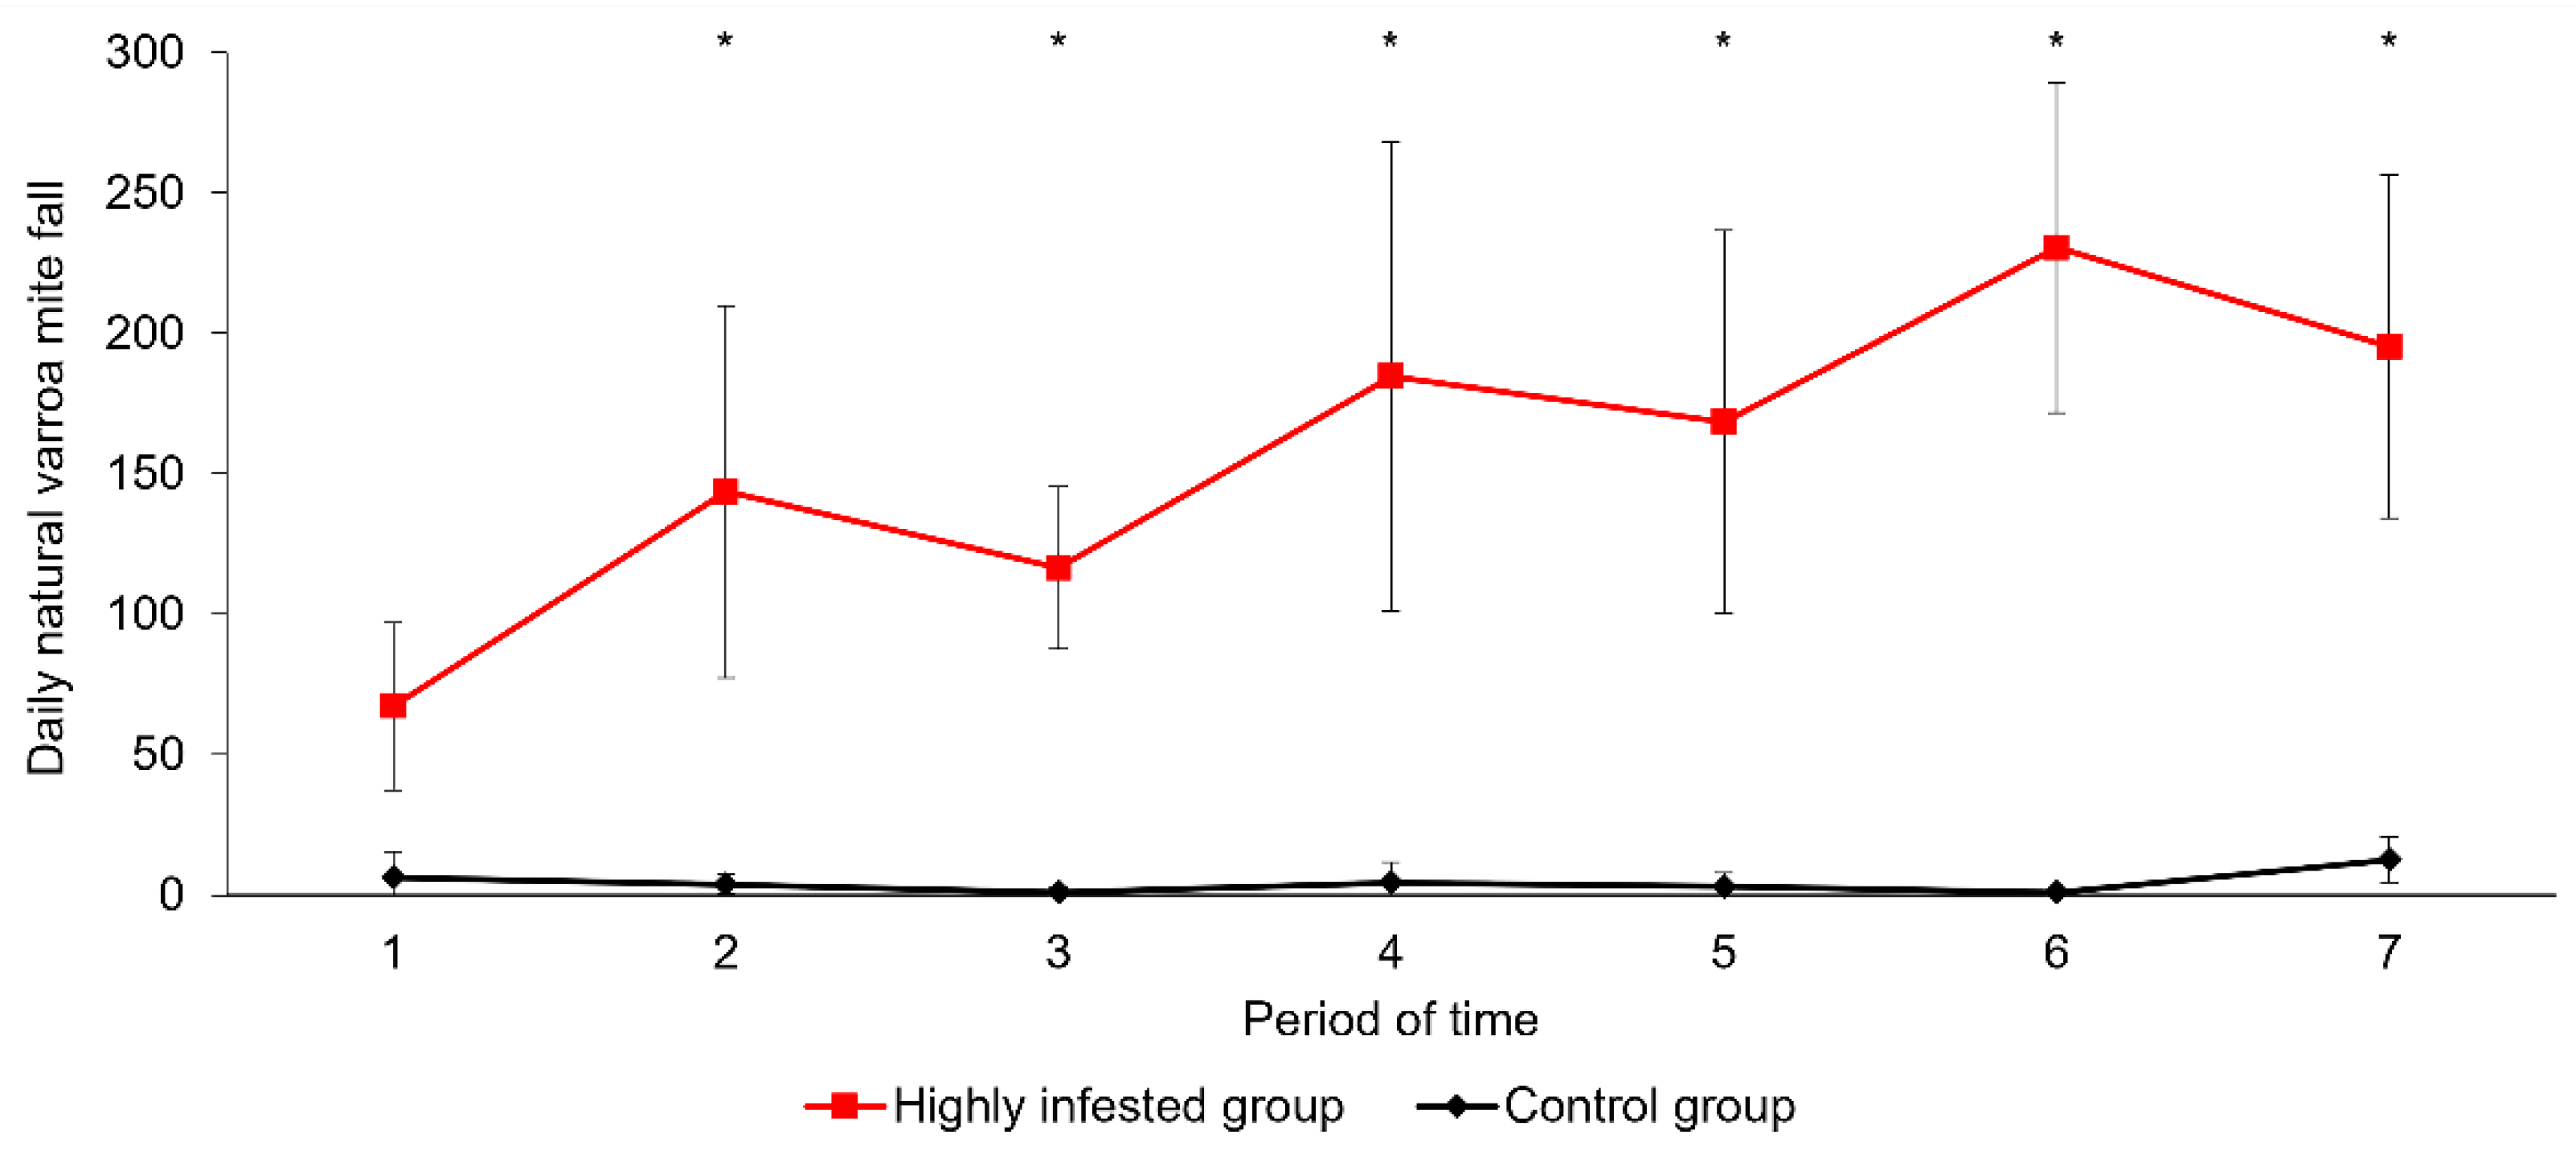
3.1. Parasitic Load
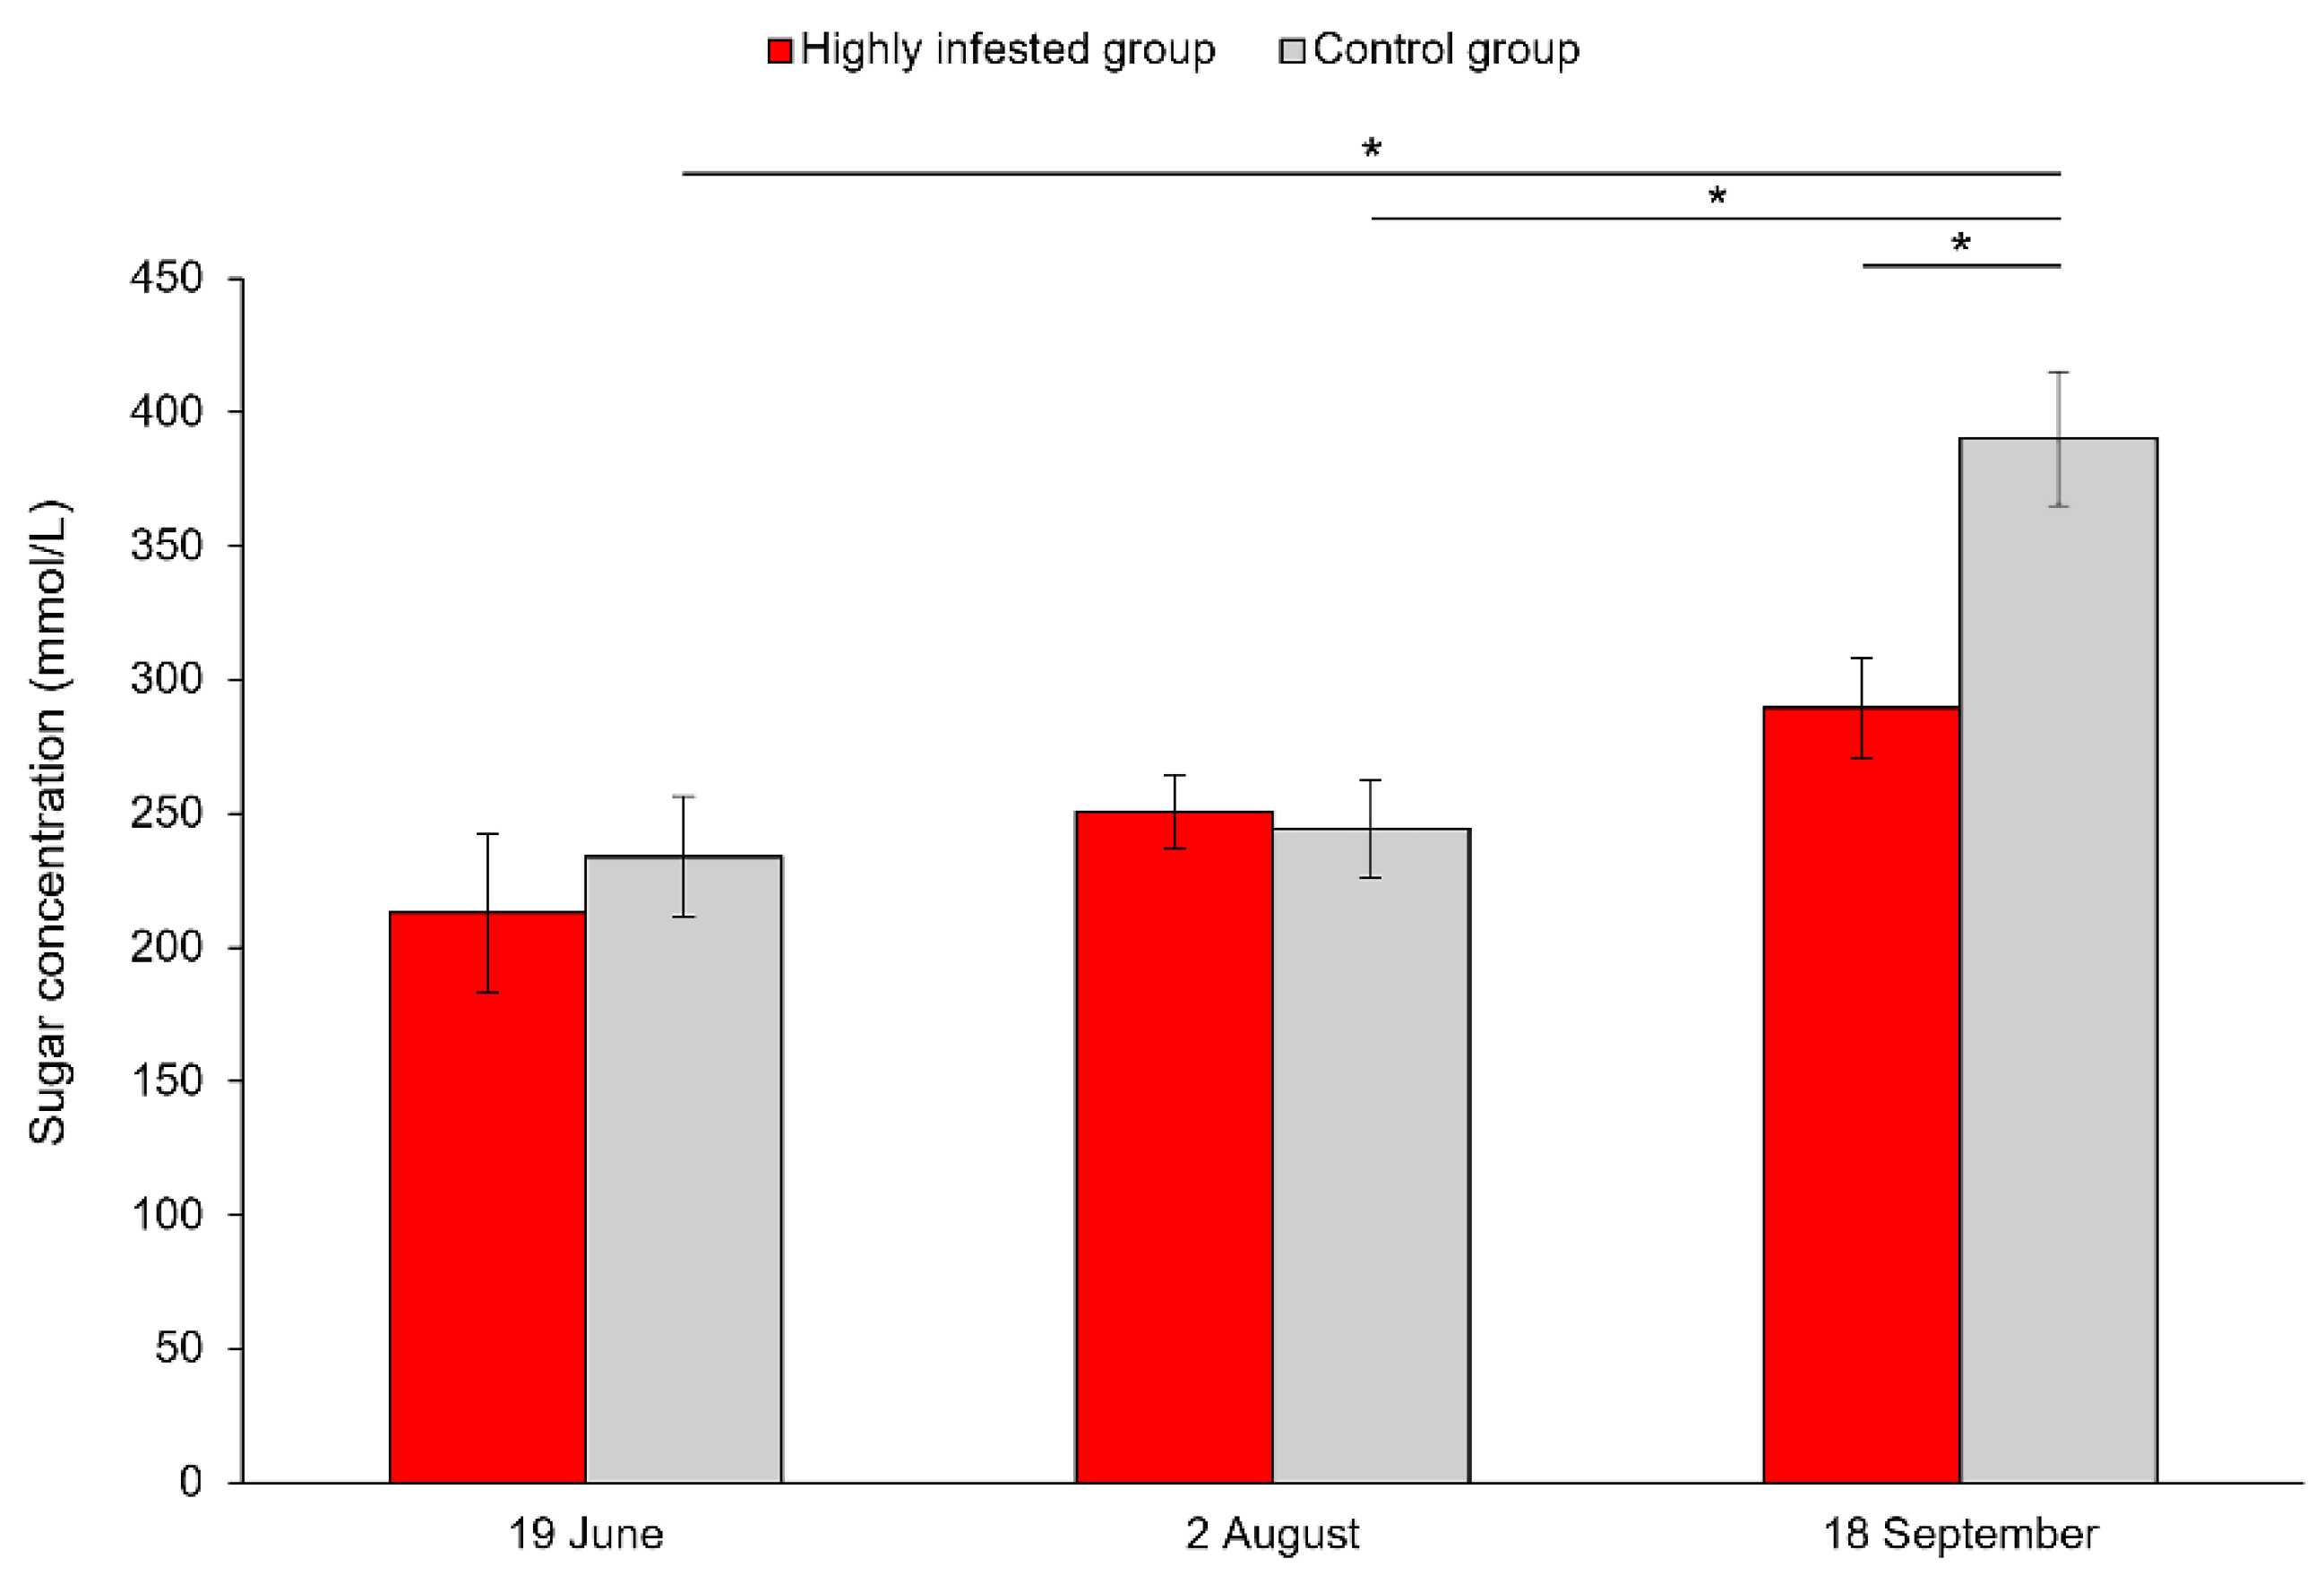
3.2. Sugar Concentrations in Honeybee Hemolymph
3.3. Bacteriology
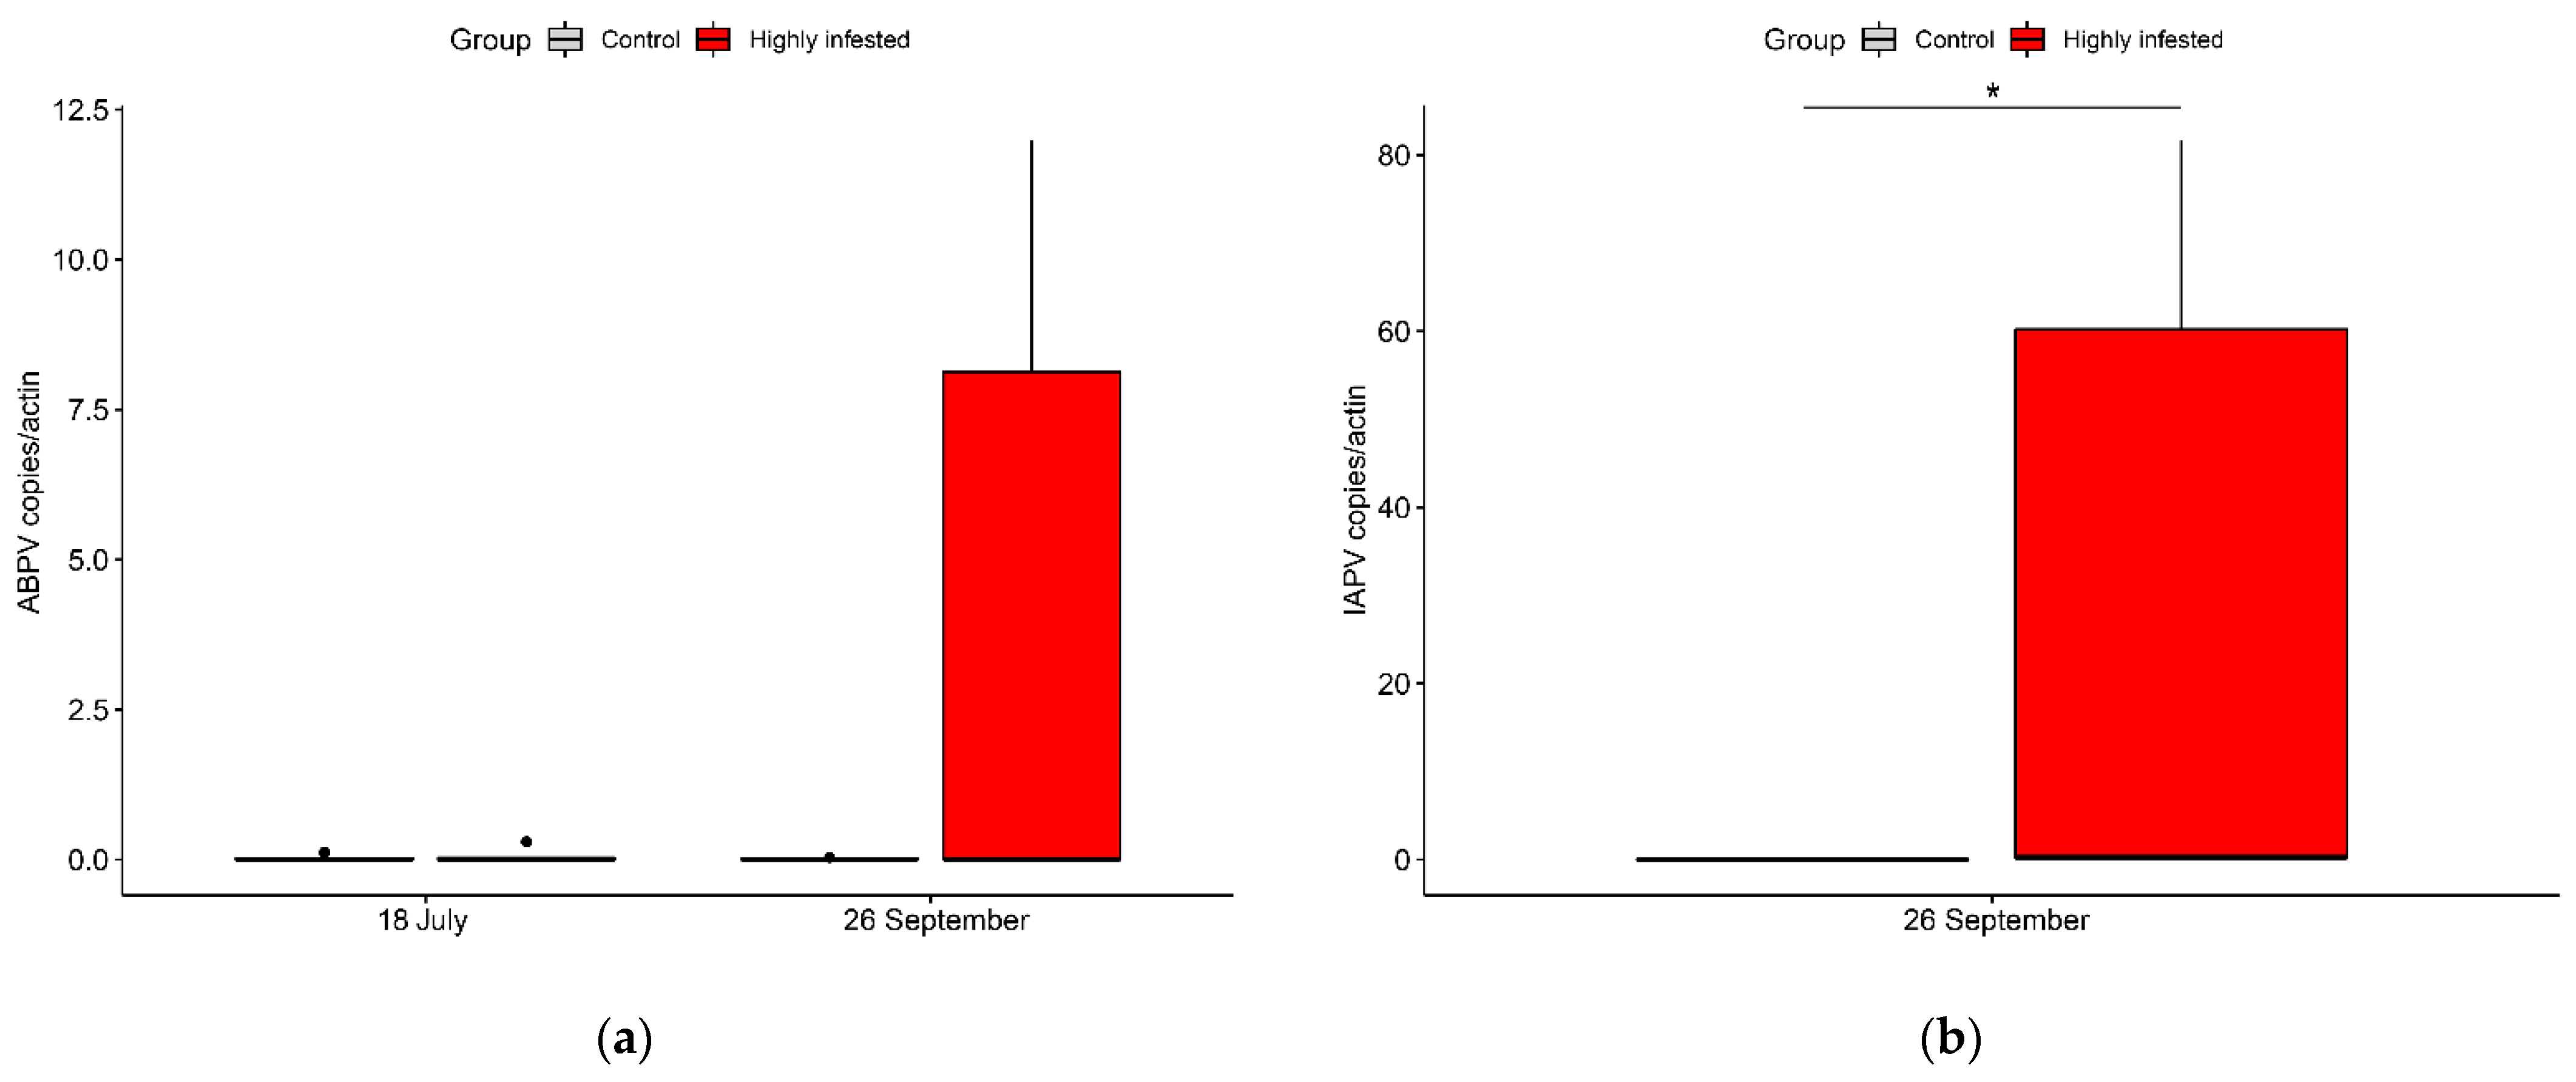
3.4. Virology
4. Discussion
4.1. General Discussion
4.2. Parasitic Load Monitoring
4.3. Sugar Concentrations in Hemolymph
4.4. Bacteriology
4.5. Virology
5. Conclusions
References
Supplementary Materials
Author Contributions
Funding
Institutional Review Board Statement
Informed Consent Statement
Data Availability Statement
Acknowledgments
Conflicts of Interest
Appendix A

| Analyzed Virus | Vectorial Role of Varroa * | |
|---|---|---|
| Mechanical | Multiplicative | |
| Deformed wing virus (DWV) | Yes a–g | Demonstrated for
|
| Acute bee paralysis virus (ABPV) | Yes d, l–n | No d |
| Cashmere bee virus (KBV) | Yes d, p, q | Suggested o |
| Israeli acute paralysis virus (IAPV) | Yes r, s | Suggested r |
| Bee queen cell virus (BQCV) | No t, u Possible o | Uncertain o |
| Timepoint | Highly Infested Group | Control Group |
|---|---|---|
| June | 18–28 June | 18–28 June |
| Mid-July | 11–17 July | 11–17 July |
| Late July | 24–29 July | July 29–8 August |
| Late August | 21–26 August | 23–26 August |
| Early September | 26 August–5 September | 28 August–5 September |
| Mid-September | 5–17 September | 5–20 September |
| Late September | 17–26 September | 20–30 September |
References
- Knoll, S.; Pinna, W.; Varcasia, A.; Scala, A.; Cappai, M.G. The honey bee (Apis mellifera L., 1758) and the seasonal adaptation of productions. Highlights on summer to winter transition and back to summer metabolic activity. A review. Livest. Sci. 2020, 235, 104011. [Google Scholar] [CrossRef]
- Radcliffe, R.M. Physiology of the Honey Bee—Principles for the Beekeeper and Veterinarian. In Honey Bee Medicine for the Veterinary Practitioner; Kane, T., Faux, C., Eds.; John Wiley & Sons Inc.: Hoboken, NJ, USA, 2021; pp. 41–53. [Google Scholar]
- Mattila, H.R.; Harris, J.L.; Otis, G.W. Timing of production of winter bees in honey bee (Apis mellifera) colonies. Insectes Sociaux 2001, 48, 88–93. [Google Scholar] [CrossRef]
- Winston, M.L. The Biology of the Honey Bee; Harvard University Press: Cambridge, MA, USA, 1987; p. 281. [Google Scholar]
- Radcliffe, R.W. The Superorganism and Herd Health for the Honey Bee. In Honey Bee Medicine for the Veterinary Practitioner; Kane, T., Faux, C., Eds.; John Wiley & Sons Inc.: Hoboken, NJ, USA, 2021; pp. 21–31. [Google Scholar]
- Fluri, P.; Lüscher, M.; Wille, H.; Gerig, L. Changes in weight of the pharyngeal gland and haemolymph titres of juvenile hormone, protein and vitellogenin in worker honey bees. J. Insect Physiol. 1982, 28, 61–68. [Google Scholar] [CrossRef]
- Döke, M.A.; Frazier, M.; Grozinger, C.M. Overwintering honey bees: Biology and management. Curr. Opin. Insect Sci. 2015, 10, 185–193. [Google Scholar] [CrossRef]
- Fluri, P.; Bogdanov, S. Age dependence of fat body protein in summer and winter bees. In Proceedings of the 10th International Congress of IUSSI, München, Germany, 18–22 August 1986. [Google Scholar]
- Hrassnigg, N.; Crailsheim, K. Differences in drone and worker physiology in honeybees (Apis mellifera). Apidologie 2005, 36, 255–277. [Google Scholar] [CrossRef]
- Heinrich, B.; Esch, H. Thermoregulation in Bees. Am. Sci. 1994, 82, 164–170. [Google Scholar]
- Gray, A.; Adjlane, N.; Arab, A.; Ballis, A.; Brusbardis, V.; Charriere, J.D.; Chlebo, R.; Coffey, M.F.; Cornelissen, B.; da Costa, C.A.; et al. Honey bee colony winter loss rates for 35 countries participating in the COLOSS survey for winter 2018–2019, and the effects of a new queen on the risk of colony winter loss. J. Apic. Res. 2020, 59, 744–751. [Google Scholar] [CrossRef]
- Ferland, J.; Kempers, M.; Kozak, P.; Lafrenière, R.; Maund, C.; Menzies, C.; Mesher, C.; Muirhead, S.; Pernal, S.; Sproule, J.; et al. Canadian Association of Professional Apiculturists Statement on Honey Bee Wintering Losses in Canada (2022); Canadian Association of Professional Apiculturists National Survey Committee and Provincial Apiarists: Ottawa, ON, Canada, 2022; p. 24. [Google Scholar]
- Ferland, J.; Kempers, M.; Kennedy, K.; Kozak, P.; Lafrenière, R.; Maund, C.; Menzies, C.; Muirhead, S.; Nasr, M.; Pernal, S.; et al. Canadian Association of Professional Apiculturists Statement on Honey Bee Wintering Losses in Canada (2019); Canadian Association of Professional Apiculturists National Survey Committee and Provincial Apiarists: Ottawa, ON, Canada, 2019; p. 19. [Google Scholar]
- Amdam, G.V.; Hartfelder, K.; Norberg, K.; Hagen, A.; Omholt, S.W. Altered physiology in worker honey bees (Hymenoptera: Apidae) infested with the mite Varroa destructor (Acari: Varroidae): A factor in colony loss during overwintering? J. Econ. Entomol. 2004, 97, 741–747. [Google Scholar] [CrossRef]
- Peck, D.T. The Parasitic Mite Varroa destructor. In Honey Bee Medicine for the Veterinary Practitioner; Kane, T., Faux, C., Eds.; John Wiley & Sons Inc.: Hoboken, NJ, USA, 2021; pp. 235–251. [Google Scholar]
- Noel, A.; Le Conte, Y.; Mondet, F. Varroa destructor: How does it harm Apis mellifera honey bees and what can be done about it? Emerg. Top. Life Sci. 2020, 4, 45–57. [Google Scholar] [CrossRef]
- Mondet, F.; de Miranda, J.R.; Kretzschmar, A.; Le Conte, Y.; Mercer, A.R. On the front line: Quantitative virus dynamics in honeybee (Apis mellifera L.) colonies along a new expansion front of the parasite Varroa destructor. PLoS Pathog. 2014, 10, e1004323. [Google Scholar] [CrossRef]
- Vidal-Naquet, N.; Lewbart, G.; Vallat, B. Honeybee Veterinary Medicine: Apis Mellifera, 1st ed.; 5M Publishing: Sheffield, UK, 2015; p. 260. [Google Scholar]
- Ramsey, S.D.; Ochoa, R.; Bauchan, G.; Gulbronson, C.; Mowery, J.D.; Cohen, A.; Lim, D.; Joklik, J.; Cicero, J.M.; Ellis, J.D.; et al. Varroa destructor feeds primarily on honey bee fat body tissue and not hemolymph. Proc. Natl. Acad. Sci. USA 2019, 116, 1792–1801. [Google Scholar] [CrossRef] [PubMed]
- Arrese, E.L.; Soulages, J.L. Insect fat body: Energy, metabolism, and regulation. Annu. Rev. Entomol. 2010, 55, 207–225. [Google Scholar] [CrossRef] [PubMed]
- Li, S.; Yu, X.; Feng, Q. Fat Body Biology in the Last Decade. Annu. Rev. Entomol. 2019, 64, 315–333. [Google Scholar] [CrossRef] [PubMed]
- Mayack, C.; Naug, D. Parasitic infection leads to decline in hemolymph sugar levels in honeybee foragers. J. Insect Physiol. 2010, 56, 1572–1575. [Google Scholar] [CrossRef] [PubMed]
- Even, N.; Devaud, J.M.; Barron, A.B. General stress responses in the honey bee. Insects 2012, 3, 1271–1298. [Google Scholar] [CrossRef]
- Marche, M.G.; Satta, A.; Floris, I.; Pusceddu, M.; Buffa, F.; Ruiu, L. Quantitative variation in the core bacterial community associated with honey bees from Varroa-infested colonies. J. Apic. Res. 2019, 58, 444–454. [Google Scholar] [CrossRef]
- Zaobidna, E.A.; Żółtowska, K.; Łopieńska-Biernat, E. Varroa destructor induces changes in the expression of immunity-related genes during the development of Apis mellifera worker and drone broods. Acta Parasitol. 2017, 62, 779–789. [Google Scholar] [CrossRef]
- Koleoglu, G.; Goodwin, P.H.; Reyes-Quintana, M.; Hamiduzzaman, M.M.; Guzman-Novoa, E. Varroa destructor parasitism reduces hemocyte concentrations and prophenol oxidase gene expression in bees from two populations. Parasitol. Res. 2018, 117, 1175–1183. [Google Scholar] [CrossRef]
- Raymann, K.; Coon, K.L.; Shaffer, Z.; Salisbury, S.; Moran, N.A. Pathogenicity of Serratia marcescens Strains in Honey Bees. mBio 2018, 9, e01649-18. [Google Scholar] [CrossRef]
- Burritt, N.L.; Foss, N.J.; Neeno-Eckwall, E.C.; Church, J.O.; Hilger, A.M.; Hildebrand, J.A.; Warshauer, D.M.; Perna, N.T.; Burritt, J.B. Sepsis and Hemocyte Loss in Honey Bees (Apis mellifera) Infected with Serratia marcescens Strain Sicaria. PLoS ONE 2016, 11, e0167752. [Google Scholar] [CrossRef]
- Borsuk, G.; Ptaszynska, A.A.; Olszewski, K.; Domaciuk, M.; Krutmuang, P.; Paleolog, J. A New Method for Quick and Easy Hemolymph Collection from Apidae Adults. PLoS ONE 2017, 12, e0170487. [Google Scholar] [CrossRef]
- Ryazanova, A.D.; Alekseev, A.A.; Slepneva, I.A. The phenylthiourea is a competitive inhibitor of the enzymatic oxidation of DOPA by phenoloxidase. J. Enzym. Inhib. Med. Chem. 2012, 27, 78–83. [Google Scholar] [CrossRef] [PubMed]
- Cournoyer, A.; Deschamps, A.; Bau-Gaudreault, L.; Dubreuil, P.; Benoit-Biancamano, M.O. Analytical validation of a portable human Accu-Chek glucometer in honeybee hemolymph. J. Vet. Diagn. Investig. 2022, 34, 789–795. [Google Scholar] [CrossRef] [PubMed]
- Currie, R.W.; Gatien, P. Timing acaricide treatments to prevent Varroa destructor (Acari: Varroidae) from causing economic damage to honey bee colonies. Can. Entomol. 2006, 138, 238–252. [Google Scholar] [CrossRef]
- Božič, J.; Woodring, J. Effect of activity on the haemolymph sugar titres in honey bees. J. Apic. Res. 1997, 36, 33–39. [Google Scholar] [CrossRef]
- Bowen-Walker, P.L.; Gunn, A. The effect of the ectoparasitic mite, Varroa destructor on adult worker honeybee (Apis mellifera) emergence weights, water, protein, carbohydrate, and lipid levels. Entomol. Exp. Appl. 2001, 101, 207–217. [Google Scholar] [CrossRef]
- Zachariah, T.T. Terrestrial Invertebrates. In Exotic Animal Laboratory Diagnosis; Heatley, J.J., Russell, K.E., Eds.; John Wiley & Sons, Inc.: Hoboken, NJ, USA, 2020; pp. 409–428. [Google Scholar]
- Mayack, C.; Carmichael, K.; Phalen, N.; Khan, Z.; Hirche, F.; Stangl, G.I.; White, H.K. Gas chromatography—Mass spectrometry as a preferred method for quantification of insect hemolymph sugars. J. Insect Physiol. 2020, 127, 104115. [Google Scholar] [CrossRef] [PubMed]
- Corby-Harris, V.; Maes, P.; Anderson, K.E. The Bacterial Communities Associated with Honey Bee (Apis mellifera) Foragers. PLoS ONE 2014, 9, e95056. [Google Scholar] [CrossRef]
- Kešnerová, L.; Emery, O.; Troilo, M.; Liberti, J.; Erkosar, B.; Engel, P. Gut microbiota structure differs between honeybees in winter and summer. ISME J. 2020, 14, 801–814. [Google Scholar] [CrossRef]
- Kwong, W.K.; Moran, N.A. Gut microbial communities of social bees. Nat. Rev. Microbiol. 2016, 14, 374–384. [Google Scholar] [CrossRef]
- Posada-Florez, F.; Childers, A.K.; Heerman, M.C.; Egekwu, N.I.; Cook, S.C.; Chen, Y.; Evans, J.D.; Ryabov, E.V. Deformed wing virus type A, a major honey bee pathogen, is vectored by the mite Varroa destructor in a non-propagative manner. Sci. Rep. 2019, 9, 12445. [Google Scholar] [CrossRef] [PubMed]
- Obbink, K.K.; Roth, J.A. Epidemiology and Biosecurity. In Honey Bee Medicine for the Veterinary Practitioner; Kane, T., Faux, C., Eds.; John Wiley & Sons Inc.: Hoboken, NJ, USA, 2021; pp. 209–218. [Google Scholar]
- Grozinger, C.M.; Flenniken, M.L. Bee Viruses: Ecology, Pathogenicity, and Impacts. Annu. Rev. Entomol. 2019, 64, 205–226. [Google Scholar] [CrossRef] [PubMed]
- Francis, R.M.; Nielsen, S.L.; Kryger, P. Varroa-virus interaction in collapsing honey bee colonies. PLoS ONE 2013, 8, e57540. [Google Scholar] [CrossRef] [PubMed]
- de Miranda, J.R.; Cordoni, G.; Budge, G. The Acute bee paralysis virus-Kashmir bee virus-Israeli acute paralysis virus complex. J. Invertebr. Pathol. 2010, 103 (Suppl. S1), S30–S47. [Google Scholar] [CrossRef]
- Todd, J.H.; De Miranda, J.R.; Ball, B.V. Incidence and molecular characterization of viruses found in dying New Zealand honey bee (Apis mellifera) colonies infested with Varroa destructor. Apidologie 2007, 38, 354–367. [Google Scholar] [CrossRef]
- Gauthier, L.; Tentcheva, D.; Tournaire, M.; Dainat, B.; Cousserans, F.; Colin, M.E.; Bergoin, M. Viral load estimation in asymptomatic honey bee colonies using the quantitative RT-PCR technique. Apidologie 2007, 38, 426–435. [Google Scholar] [CrossRef]
- Tentcheva, D.; Gauthier, L.; Zappulla, N.; Dainat, B.; Cousserans, F.; Colin, M.E.; Bergoin, M. Prevalence and seasonal variations of six bee viruses in Apis mellifera L. and Varroa destructor mite populations in France. Appl. Environ. Microbiol. 2004, 70, 7185–7191. [Google Scholar] [CrossRef]
- Ribière, M.; Ball, B.; Aubert, M. Natural history and geographical distribution of honey bee viruses. In Virology and the Honey Bee; European Communities: Luxembourg, 2008; pp. 15–84. [Google Scholar]
- Yang, X.; Cox-Foster, D. Effects of parasitization by Varroa destructor on survivorship and physiological traits of Apis mellifera in correlation with viral incidence and microbial challenge. Parasitology 2007, 134, 405–412. [Google Scholar] [CrossRef]
- Dainat, B.; Evans, J.D.; Chen, Y.P.; Gauthier, L.; Neumann, P. Dead or alive: Deformed wing virus and Varroa destructor reduce the life span of winter honeybees. Appl. Environ. Microbiol. 2012, 78, 981–987. [Google Scholar] [CrossRef]
- Genersch, E.; Ohe, W.v.d.; Kaatz, H.; Schroeder, A.; Otten, C.; Büchler, R.; Berg, S.; Ritter, W.; Mühlen, W.; Gisder, S.; et al. The German bee monitoring project: A long term study to understand periodically high winter losses of honey bee colonies. Apidologie 2010, 41, 332–352. [Google Scholar] [CrossRef]
- Amiri, E.; Rueppell, O.; Tarpy, D.R. Honey Bee Viral Diseases. In Honey Bee Medicine for the Veterinary Practitioner; Kane, T., Faux, C., Eds.; John Wiley & Sons Inc.: Hoboken, NJ, USA, 2021; pp. 253–275. [Google Scholar]
- Di Prisco, G.; Pennacchio, F.; Caprio, E.; Boncristiani, H.F.; Evans, J.D.; Chen, Y. Varroa destructor is an effective vector of Israeli acute paralysis virus in the honeybee, Apis mellifera. J. Gen. Virol. 2011, 92, 151–155. [Google Scholar] [CrossRef] [PubMed]
- Shen, M.; Cui, L.; Ostiguy, N.; Cox-Foster, D. Intricate transmission routes and interactions between picorna-like viruses (Kashmir bee virus and sacbrood virus) with the honeybee host and the parasitic varroa mite. J. Gen. Virol. 2005, 86, 2281–2289. [Google Scholar] [CrossRef] [PubMed]
- Shen, M.; Yang, X.; Cox-Foster, D.; Cui, L. The role of varroa mites in infections of Kashmir bee virus (KBV) and deformed wing virus (DWV) in honey bees. Virology 2005, 342, 141–149. [Google Scholar] [CrossRef] [PubMed]
- Wiegers, F. Transmission of honeybee viruses by Varroa jacobsoni Oud. In European Research on Varroatosis Control; CRC Press: Boca Raton, FL, USA, 1988; pp. 99–104. [Google Scholar]
- Chen, Y.P.; Pettis, J.S.; Collins, A.; Feldlaufer, M.F. Prevalence and transmission of honeybee viruses. Appl. Environ. Microbiol. 2006, 72, 606–611. [Google Scholar] [CrossRef]
- Santillán-Galicia, M.T.; Carzaniga, R.; Ball, B.V.; Alderson, P.G. Immunolocalization of deformed wing virus particles within the mite Varroa destructor. J. Gen. Virol. 2008, 89, 1685–1689. [Google Scholar] [CrossRef]
- Tehel, A.; Quynh, V.; Bigot, D.; Gogol-Döring, A.; Koch, P.; Jenkins, C.; Doublet, V.; Theodorou, P.; Paxton, R. The two prevalent genotypes of an emerging infectious disease, Deformed wing virus, cause equally low pupal mortality and equally high wing deformities in host honey bees. Viruses 2019, 11, 114. [Google Scholar] [CrossRef]
- McMahon, D.P.; Natsopoulou, M.E.; Doublet, V.; Fürst, M.; Weging, S.; Brown, M.J.; Gogol-Döring, A.; Paxton, R.J. Elevated virulence of an emerging viral genotype as a driver of honeybee loss. Proc. R. Soc. B Biol. Sci. 2016, 283, 20160811. [Google Scholar] [CrossRef]
- Bailey, L.; Ball, B.V.; Perry, J.N. Association of viruses with two protozoal pathogens of the honey bee. Ann. Appl. Biol. 1983, 103, 13–20. [Google Scholar] [CrossRef]
- Bailey, L.; Gibbs, A.J.; Woods, R.D. Two viruses from adult honey bees (Apis mellifera Linnaeus). Virology 1963, 21, 390–395. [Google Scholar] [CrossRef]
- Maori, E.; Lavi, S.; Mozes-Koch, R.; Gantman, Y.; Peretz, Y.; Edelbaum, O.; Tanne, E.; Sela, I. Isolation and characterization of Israeli acute paralysis virus, a dicistrovirus affecting honeybees in Israel: Evidence for diversity due to intra- and inter-species recombination. J. Gen. Virol. 2007, 88, 3428–3438. [Google Scholar] [CrossRef]
- López-Uribe, M.M. Wild Bees: Diversity, Ecology, and Stressors of Non-Apis Bees. In Honey Bee Medicine for the Veterinary Practitioner; Kane, T., Faux, C., Eds.; John Wiley & Sons Inc.: Hoboken, NJ, USA, 2021; pp. 81–91. [Google Scholar]
- Bowen-Walker, P.L.; Martin, S.J.; Gunn, A. The transmission of deformed wing virus between honeybees (Apis mellifera L.) by the ectoparasitic mite Varroa jacobsoni Oud. J. Invertebr. Pathol. 1999, 73, 101–106. [Google Scholar] [CrossRef] [PubMed]
- Lester, P.J.; Felden, A.; Baty, J.W.; Bulgarella, M.; Haywood, J.; Mortensen, A.N.; Remnant, E.J.; Smeele, Z.E. Viral communities in the parasite Varroa destructor and in colonies of their honey bee host (Apis mellifera) in New Zealand. Sci. Rep. 2022, 12, 8809. [Google Scholar] [CrossRef] [PubMed]
- Nazzi, F.; Pennacchio, F. Honey Bee Antiviral Immune Barriers as Affected by Multiple Stress Factors: A Novel Paradigm to Interpret Colony Health Decline and Collapse. Viruses 2018, 10, 159. [Google Scholar] [CrossRef] [PubMed]
- Barroso-Arévalo, S.; Vicente-Rubiano, M.; Ruiz, J.A.; Bentabol, A.; Sánchez-Vizcaíno, J.M. Does pollen diversity influence honey bee colony health? Span. J. Agric. Res. 2019, 17, e0504. [Google Scholar] [CrossRef]
- Ryabov, E.V.; Wood, G.R.; Fannon, J.M.; Moore, J.D.; Bull, J.C.; Chandler, D.; Mead, A.; Burroughs, N.; Evans, D.J. A virulent strain of deformed wing virus (DWV) of honeybees (Apis mellifera) prevails after Varroa destructor-mediated, or in vitro, transmission. PLoS Pathog. 2014, 10, e1004230. [Google Scholar] [CrossRef]
- Martin, S.J.; Highfield, A.C.; Brettell, L.; Villalobos, E.M.; Budge, G.E.; Powell, M.; Nikaido, S.; Schroeder, D.C. Global honey bee viral landscape altered by a parasitic mite. Science 2012, 336, 1304–1306. [Google Scholar] [CrossRef]
- Yue, C.; Genersch, E. RT-PCR analysis of Deformed wing virus in honeybees (Apis mellifera) and mites (Varroa destructor). J. Gen. Virol. 2005, 86, 3419–3424. [Google Scholar] [CrossRef]
- Gisder, S.; Aumeier, P.; Genersch, E. Deformed wing virus: Replication and viral load in mites (Varroa destructor). J. Gen. Virol. 2009, 90, 463–467. [Google Scholar] [CrossRef]
- Paxton, R.J.; Schäfer, M.O.; Nazzi, F.; Zanni, V.; Annoscia, D.; Marroni, F.; Bigot, D.; Laws-Quinn, E.R.; Panziera, D.; Jenkins, C.; et al. Epidemiology of a major honey bee pathogen, deformed wing virus: Potential worldwide replacement of genotype A by genotype B. Int. J. Parasitol. Parasites Wildl. 2022, 18, 157–171. [Google Scholar] [CrossRef]
- Barroso-Arévalo, S.; Fernández-Carrión, E.; Goyache, J.; Molero, F.; Puerta, F.; Sánchez-Vizcaíno, J.M. High Load of Deformed Wing Virus and Varroa destructor Infestation Are Related to Weakness of Honey Bee Colonies in Southern Spain. Front. Microbiol. 2019, 10, 1331. [Google Scholar] [CrossRef] [PubMed]
- Jamnikar Ciglenečki, U.; Toplak, I. Development of a real-time RT-PCR assay with TaqMan probe for specific detection of acute bee paralysis virus. J. Virol. Methods 2012, 184, 63–68. [Google Scholar] [CrossRef] [PubMed]
- Locke, B.; Forsgren, E.; Fries, I.; de Miranda, J.R. Acaricide treatment affects viral dynamics in Varroa destructor-infested honey bee colonies via both host physiology and mite control. Appl. Environ. Microbiol. 2012, 78, 227–235. [Google Scholar] [CrossRef] [PubMed]
- McMahon, D.P.; Fürst, M.A.; Caspar, J.; Theodorou, P.; Brown, M.J.F.; Paxton, R.J. A sting in the spit: Widespread cross-infection of multiple RNA viruses across wild and managed bees. J. Anim. Ecol. 2015, 84, 615–624. [Google Scholar] [CrossRef]
- Chantawannakul, P.; Ward, L.; Boonham, N.; Brown, M. A scientific note on the detection of honeybee viruses using real-time PCR (TaqMan) in Varroa mites collected from a Thai honeybee (Apis mellifera) apiary. J. Invertebr. Pathol. 2006, 91, 69–73. [Google Scholar] [CrossRef] [PubMed]
- Ward, L.; Waite, R.; Boonham, N.; Fisher, T.; Pescod, K.; Thompson, H.; Chantawannakul, P.; Brown, M. First detection of Kashmir bee virus in the UK using real-time PCR. Apidologie 2007, 38, 181–190. [Google Scholar] [CrossRef][Green Version]
- Chen, Y.P.; Higgins, J.A.; Feldlaufer, M.F. Quantitative real-time reverse transcription-PCR analysis of deformed wing virus infection in the honeybee (Apis mellifera L.). Appl. Environ. Microbiol. 2005, 71, 436–441. [Google Scholar] [CrossRef]
- Erban, T.; Harant, K.; Hubalek, M.; Vitamvas, P.; Kamler, M.; Poltronieri, P.; Tyl, J.; Markovic, M.; Titera, D. In-depth proteomic analysis of Varroa destructor: Detection of DWV-complex, ABPV, VdMLV and honeybee proteins in the mite. Sci. Rep. 2015, 5, 13907. [Google Scholar] [CrossRef]
- Nordström, S. Distribution of deformed wing virus within honey bee (Apis mellifera) brood cells infested with the ectoparasitic mite Varroa destructor. Exp. Appl. Acarol. 2003, 29, 293–302. [Google Scholar] [CrossRef]
- Annoscia, D.; Brown, S.P.; Di Prisco, G.; De Paoli, E.; Del Fabbro, S.; Frizzera, D.; Zanni, V.; Galbraith, D.A.; Caprio, E.; Grozinger, C.M. Haemolymph removal by Varroa mite destabilizes the dynamical interaction between immune effectors and virus in bees, as predicted by Volterra’s model. Proc. R. Soc. B Biol. Sci. 2019, 286, 20190331. [Google Scholar] [CrossRef]
- Gisder, S.; Genersch, E. Direct Evidence for Infection of Varroa destructor Mites with the Bee-Pathogenic Deformed Wing Virus Variant B—But Not Variant A—Via Fluorescence-in situ-Hybridization Analysis. J. Virol. 2020, 95, e01786-20. [Google Scholar] [CrossRef]
- Ongus, J.R.; Peters, D.; Bonmatin, J.-M.; Bengsch, E.; Vlak, J.M.; van Oers, M.M. Complete sequence of a picorna-like virus of the genus Iflavirus replicating in the mite Varroa destructor. J. Gen. Virol. 2004, 85, 3747–3755. [Google Scholar] [CrossRef] [PubMed]
- Ball, B. Association of Varroa jacobsoni with virus diseases of honey bees. Exp. Appl. Acarol. 1983, 19, 607–613. [Google Scholar]
- McMenamin, A.J.; Genersch, E. Honey bee colony losses and associated viruses. Curr. Opin. Insect Sci. 2015, 8, 121–129. [Google Scholar] [CrossRef] [PubMed]


Publisher’s Note: MDPI stays neutral with regard to jurisdictional claims in published maps and institutional affiliations. |
© 2022 by the authors. Licensee MDPI, Basel, Switzerland. This article is an open access article distributed under the terms and conditions of the Creative Commons Attribution (CC BY) license (https://creativecommons.org/licenses/by/4.0/).
Share and Cite
Cournoyer, A.; Plamondon, L.; Bau-Gaudreault, L.; Deschamps, A.; Dubreuil, P.; Benoit-Biancamano, M.-O. Effects of Varroa destructor on Hemolymph Sugars and Secondary Infections in Honeybees (Apis mellifera). Appl. Sci. 2022, 12, 11630. https://doi.org/10.3390/app122211630
Cournoyer A, Plamondon L, Bau-Gaudreault L, Deschamps A, Dubreuil P, Benoit-Biancamano M-O. Effects of Varroa destructor on Hemolymph Sugars and Secondary Infections in Honeybees (Apis mellifera). Applied Sciences. 2022; 12(22):11630. https://doi.org/10.3390/app122211630
Chicago/Turabian StyleCournoyer, Antoine, Laurence Plamondon, Liza Bau-Gaudreault, Annie Deschamps, Pascal Dubreuil, and Marie-Odile Benoit-Biancamano. 2022. "Effects of Varroa destructor on Hemolymph Sugars and Secondary Infections in Honeybees (Apis mellifera)" Applied Sciences 12, no. 22: 11630. https://doi.org/10.3390/app122211630
APA StyleCournoyer, A., Plamondon, L., Bau-Gaudreault, L., Deschamps, A., Dubreuil, P., & Benoit-Biancamano, M.-O. (2022). Effects of Varroa destructor on Hemolymph Sugars and Secondary Infections in Honeybees (Apis mellifera). Applied Sciences, 12(22), 11630. https://doi.org/10.3390/app122211630