Article

A Hybrid U-Lossian Deep Learning Network for Screening and Evaluating Parkinson’s Disease

by
Rytis Maskeliūnas
1,*,
Robertas Damaševičius
1,
Audrius Kulikajevas
1,
Evaldas Padervinskis
2,
Kipras Pribuišis
2 and
Virgilijus Uloza
2
1
Faculty of Informatics, Kaunas University of Technology, 51368 Kaunas, Lithuania
2
Department of Otorhinolaryngology, Lithuanian University of Health Sciences, 50061 Kaunas, Lithuania
*
Author to whom correspondence should be addressed.
Appl. Sci. 2022, 12(22), 11601; https://doi.org/10.3390/app122211601
Submission received: 10 October 2022 / Revised: 8 November 2022 / Accepted: 14 November 2022 / Published: 15 November 2022

Abstract

:
Speech impairment analysis and processing technologies have evolved substantially in recent years, and the use of voice as a biomarker has gained popularity. We have developed an approach for clinical speech signal processing to demonstrate the promise of deep learning-driven voice analysis as a screening tool for Parkinson’s Disease (PD), the world’s second most prevalent neurodegenerative disease. Detecting Parkinson’s disease symptoms typically involves an evaluation by a movement disorder expert, which can be difficult to get and yield varied findings. A vocal digital biomarker might supplement the time-consuming traditional manual examination by recognizing and evaluating symptoms that characterize voice quality and level of deterioration. We present a deep learning based, custom U-lossian model for PD assessment and recognition. The study’s goal was to discover anomalies in the PD-affected voice and develop an automated screening method that can discriminate between the voices of PD patients and healthy volunteers while also providing a voice quality score. The classification accuracy was evaluated on two speech corpora (Italian PVS and own Lithuanian PD voice dataset) and we have found the result to be medically appropriate, with values of 0.8964 and 0.7949, confirming the proposed model’s high generalizability.

1. Introduction

Parkinson’s disease (PD) is the second most prevalent neurodegenerative disease [1]. PD mostly affects people over 50 years of age, although the number continues to decline, and the number of affected subjects only increases as the population increases. With more than 10 million people diagnosed each year in the world, 1 million in the USA and comparable rates of occurrence have been observed in Europe [2]. The pathogenetic mechanisms of the disease are variable and not yet fully understood [3]. The disease presents itself with a wide spectrum of motor and non-motor symptoms, including those that directly affect a person’s capability to operate. Clinically manifested PD is preceded by a prodromal period, lasting for decades, when there are no clinical signs or unspecific symptoms, such as constipation, apathy, daytime sleepiness, inattention, depression, anxiety, smell impairment, pain, motor slowing, etc., may be present [4,5,6,7]. Motor symptoms appear relatively late in the course of neurodegeneration, only when compensatory mechanisms of smooth motor control are exhausted and do not manifest until more than half of the dopaminergic neurons in the substantia nigra region in the midbrain are dead [8]. Nevertheless, they are the signs that make the disease recognizable. The cardinal symptoms of PD are bradykinesia, which represents impairment of voluntary motor control and is characterized by slowness and gradually decreasing range of movement, muscle rigidity, and tremor [9]. To date, the diagnosis of PD is exceptionally clinical and faces many challenges. Firstly, it comes late in the context of the neurodegenerative process. Secondly, the diagnosis requires experience in recognizing clinical signs, especially when motor symptoms are mild, as mild motor symptoms as well as non-motor symptoms are prevalent in the healthy elderly population [10]. The symptoms of PD overlap with other neurodegenerative, toxic, or vascular diseases that might have a different prognosis and require different approaches to treatment, and even with aging, as mentioned above.
Early identification of PD is important, as disabling motor symptoms, which otherwise may be attributed to aging or other causes, could be treated highly effectively when recognized. Earlier disease intervention may result in longer uncompromised working capacity, as well as the prolonged quality time of the patient’s life. The prospect of neuroprotective treatment that is expected to emerge in the near future demands identification of those who need it even earlier, before the symptoms appear. Many studies in the area of neurodegeneration have recently been directed toward finding the disease biomarkers [11]. Speech is very vulnerable to degeneration of neural structures [12] and quality decline has been extensively reported in the PD research literature [13,14]. It is therefore not surprising that speech acoustic analysis in PD has been receiving an exponentially growing scientific interest in recent years as it has the potential to reveal a lot of information about fine motor control. The ease and broad availability of the recording technique makes it an excellent candidate for becoming a diagnostic biomarker as well as a progression marker for PD.
Fundamental frequency variability has been discovered as early as 5 years before diagnosable symptoms [15]. Rush et al. have repeatedly shown that subjects with early PD [16,17] and even with rapid eye movement behavior disorder (RBD) [18] (which is recognized as the strongest predictor of neurodegeneration, including Parkinson’s disease) manifest various articulatory, phonatory, and prosodic speech deficits, a combination of which can discriminate between the people with PD and the control group. Early detection and diagnosis can help with therapy, but diagnosis usually necessitates an interview with a healthcare professional or the completion of a formal diagnostic questionnaire. As a result, inconspicuous techniques to monitor depression symptoms in daily life could be quite useful in diagnosing and screening PD and determining whether or not it requires professional treatment [19].
Speech therefore must be constantly reevaluated to improve the patients’ quality of life; therefore, PD-impacted speech must be monitored and screened on a regular basis. Deterioration is linked to swallowing problems in PD [20], which in turns raises the possibility of choking, aspiration pneumonia, and untimely death. Swallowing problems are often underreported by patients with PD, not least related to the lack of suitable screening methods. Monitoring for speech deterioration with a simple and even remotely available acoustic analysis method could serve as a tool to schedule a visit to the doctor. Speech disorders impair patients’ capacity to communicate, as they may talk slowly and cannot convey themselves effectively. Their speech is sometimes breathy and mumbled towards the end of a phrase. As a result, individuals are unable to express emotions when speaking. It also has an impact on their socialization capacity, a case that has been especially pronounced during and after the COVID-19 pandemic [21]. Healthy persons may alter their voices to produce a variety of sounds that require delicate coordination and control of the articulatory and respiratory muscles. Patients with PD, on the other hand, have impaired neuromotor control, which affects the vocal mechanism and, as a result, the sounds generated. Speech analysis by machines might help in early identification of PD, however there are large inter- and intra-individual differences, making this difficult. Recent development of speech-based PD screening tools based on speech analysis show the acceptable classification rates in distinguishing between healthy participants and PD patients. However, in these investigations, the data used to build the classification model included voice recordings from both early and late-stage PD patients with varying degrees of speech impairment, resulting in unrealistic results for real-life application cases. In a more realistic scenario, healthy participants or early PD patients with moderate speech impairment will employ an early screening method in questionable situations [22]. The study [23] showed that vocal tract length acquired from phoneme recording using a smartphone may reliably identify persons with Parkinson’s disease.
Our study’s goal was to discover anomalies in the PD-affected voice and develop an automated screening method capable of distinguishing between the voices of PD patients and healthy individuals while also providing a voice quality score. We look at whether speech recordings might be utilized as a simple, low-cost method of PD assessment and screening, using deep learning for expert score prediction and evaluation. Acoustic investigations enable high-throughput screening that, if the screening results are aberrant, can be followed by a comprehensive medical evaluation. We developed an automated screening method that can discriminate between the voices of patients with Parkinson’s disease and healthy participants, as well as provide a voice quality score, to detect anomalies in the voice impacted by Parkinson’s disease. The main challenge was getting the algorithm to work with different forms of voice input. The Italian PD speech samples (training material) used sustained vowel phonation, while the Lithuanian samples used phonetically balanced phrase analysis. However, because sustained vowel phonation is a type of phonation that is manufactured, that feature establishes the same limitation in the meaning of the sustained vowel signal analysis. Connected speech, on the other hand, is more common in ordinary conversation and may be considered more “ecologically legitimate”. As a result, we have raised a hypothesis to design a dedicated deep learning based PD voice screening system, that is, if an objective voice evaluation is to be considered robust and ecologically valid for screening purposes, acoustic measurements should ideally be performed using both speaking patterns—sustained phonation and running speech.
The manuscript is further organized as follows: initially, we offer a state-of-the-art review of Parkinson disease voice signal processing, then the dataset and the methodology of our U-lossian deep neural network approach, followed by the experimental evaluation, discussion, and conclusions.

2. State of the Art Review of Signal Analysis Based Approaches for Analyzing Parkinson’s Disease

Given the technological nature of the paper, this section aims to provide a technological review of numerous computer-driven methodologies utilized for technological Parkinson disease analysis and investigation, categorization, and screening.
The great majority of patients diagnosed with PD have vocal performance impairment [22], which may often be one of the first signs of the onset of the diseases and there is a clear demand for objective symptom assessment and screening [24]. Speech faults caused by Parkinson’s disease include, among other things, decreased voice loudness [25], mono pitch [26], and improper consonant articulation as was defined by Tukalova’s team [27]. Recent research have created tools to distinguish PD from controls and track speech rehabilitation in PD using high-quality voice recordings [28,29]. Recent research have also looked at the practicality and usefulness of employing smartphone technology [30] to help with the clinical diagnosis of Parkinson’s disease, which expanded the use of speech data to include four more tests for dexterity, postural sway, gait, and response times [31]. Modern AI-powered screening was shown to be hardware-independent, yielding accurate findings. According to a research conducted by Rusz et al. [32], smartphones can identify speech problems in those who are at high risk of acquiring PD.
Acoustic measurements such as fundamental frequency variability, pause interval duration, and speech timing rate extracted from spontaneous speech were sensitive enough to distinguish between groups and demonstrated a strong correlation and reliability between the professional microphone and the smartphone. Ehsan et al. [33] found a similar reliable results when using the k-nearest neighbor (KNN) algorithm. Bot et al. [34] also introduced an iPhone app to assess the PD patient’s memory, tapping, speech, and walking. Zhan et al. [35] created an app to assess the feasibility of remotely monitoring PD symptoms, and to use an AI-based approach to distinguish between measures before and after medication. Lipsmeier et al. [36] compared smartphone outcome metrics to traditional clinical practice with trials that substantially distinguished PD from healthy persons with p < 0.005 .
Regarding the applications of artificial intelligence (AI), recent research has shown that the use of machine learning techniques to identify PD from non-PD using extracted speech data is successful [37,38]. Behroozi et al. [39] developed a multi-classifier framework to distinguish Parkinson’s disease patients from healthy controls. Tsanas et al. in Refs. [30,40] studied the link between the characteristics of speech signals and the motor impairment score in Parkinson’s disease patients. Perez et al. [41] created an autonomous feature extraction system to diagnose Parkinson’s disease and follow its development. Khan et al. [42] evaluated the severity of PD using audio recordings of the vocal function. Ensemble learning was also important in boosting PD classification accuracy. As demonstrated by Mohammadi et al. [43], stacking results of conventional classifiers are time-efficient, low-cost, and more accurate, with an achieved accuracy of 95–97%. While these and related studies show great classification accuracy, they have numerous limits as they progress upward. Small cohort sizes are a more well-known issue, as they limit the generalizability of conclusions to a wider and more diversified population. Some researches also disregarded the fact that a person with PD may have greater trouble pronouncing some words than others. As a result, summarizing the voice examination may result in the loss of vital information [44]. To overcome this issue, the categorization setting must take into consideration what has been communicated. Identity confounding is a less well-known issue in which several voice samples are obtained from each subject and these samples appear in both training and testing data, therefore because the model has trained to identify features of certain subjects and is utilizing that knowledge to identify the label in the test set, the model’s performance is too optimistic. Furthermore, adopting a simple classifier does not lead to high prediction accuracy, thus deep learning based techniques for improving model performance include data normalization [45], feature selection, and feature extraction [46]. This is a sort of data leakage in which information is transferred between the training and test sets accidentally, resulting in exaggerated performance measures [47].
More fundamentally, studies that merely categorize patients as having Parkinson’s disease or not having it have limited value in terms of enhancing their quality of life. Although techniques to improve diagnostic accuracy are needed, diagnosis is usually achieved only after the disease has advanced to a more severe stage, i.e., when symptoms appear. Ali et al. [48] proposed to address the above-mentioned issues, with the aim of creating a hybrid system capable of automatically performing acoustic analysis of voice signals to identify PD. The suggested smart system employs linear discriminant analysis to reduce dimensionality and a genetic algorithm to optimize the hyperparameters of a neural network utilized as a predictive model. Furthermore, to eliminate subject overlap, they excluded one participant from validation and attained a 95% accuracy. Arora et al. [31] attempted to investigate the scalability of voice as a population screening tool for PD, and performed the Parkinson’s Speech Initiative (PVI) research, a PD characterization study using telephone-quality voice. PVI was the first large-scale study of its sort to gather speech data from PwP and control participants in free-living acoustic circumstances, with the goal of distinguishing PD individuals from controls using phonations acquired in non-acoustically controlled situations. Viswanathan et al. [49] used two complexity measures: fractal dimension (FD) and normalized mutual information (NMI) to compare the voices of Parkinson’s disease (PD) and age-matched control (CO) subjects when uttering three phonemes. They found that the voices of PD patients have lower FD and NMI between voice recordings of PD–CO and PD–PD is higher than CO–CO. This shows that using NMI from the sample voice in combination with the known CO and PD groups can be utilized to detect PD sounds. Hirens et al. [50] proposed an ensemble of convolutional neural networks for detecting PD from speech samples. For the dataset, the solution obtained 99% accuracy. To tackle the problem of imbalanced data samples, Polat et al. [51] employed a Synthetic Minority Over-Sampling Technique, followed by a Random Forest model to categorize the samples. Gabriel et al. [52] achieved an accuracy of roughly 94% for a Wrappers feature subset selection preceding an SVM. Tuncer et al. [53] acquired a greater efficiency by using a KNN technique followed by minimal average maximum tree and singular value decomposition as feature extractors. According to the findings of Pah et al. [54], automated analysis of various phonemes should be used. An approach for categorizing PD that is sensitive to privacy has been presented by Laganas et al. [55]. Voice characteristics collected from running speech signals were recovered from passively recorded voice calls. To fuse and predict speech characteristics, language-aware training of multiple- and single-instance learning classifiers was used, yielding an AUC of 0.84.

Overview of Deep Learning Based Approaches to PD Speech Analysis

Deep learning (DL) architectures and algorithms are rapidly being employed in research to handle complex PD voice signal processing issues [56]. The initial step is to convert the input speech stream into voice feature vectors or tensors that DL models can assess. As previously indicated in the main body of the state-of-the-art review, numerous aspects of voice are included in the voice characteristics of Parkinson’s disease patients, further varying in relation to the native tongue of the speaker. The second step in DL-based approaches is to apply a classification or analysis to the retrieved voice characteristics, as vocal biomarkers are a potentially useful technique of monitoring symptoms and severity [57]. This section thus examines DL-related models and the effectiveness of strategies used for PD identification from voice.
Krishna et al., tested multiple architectures of the 1D CNN model to accurately detect the illness using extracted speech data and obtained about 87% accuracy [58]. Sparse kernel transfer learning was proposed by Zhang et al. [59] to extract the effective structural information of PD speech characteristics from public datasets as source domain data. They also used a quick alternating direction multiplier iteration strategy to improve information extraction performance, attaining an overall accuracy of 86.7%. Similarly, Ma et al. proposed a deep dual-side learning ensemble model with a weighted fusion mechanism to fuse the classification models into a classification ensemble model, attaining 98.4% accuracy [60]. On the Max Little dataset, Ouhmida et al. [61] used traditional CNN with an accuracy of 93.10%. An ensemble of convolutional neural networks with Gaussian blurring allowed a further increase in accuracy [62]. Similarly, the spectrum of the audio recordings was computed and utilized as an image input to the pre-trained ResNet18 architecture using the ImageNet and SVD databases with an accuracy of 97.1% in Ref. [63]. Alexnet adapted by Ref. [64] showed a very similar performance, while Densnet had lower accuracy, albeit on a different dataset [65]. Combining the CNN classifier with additional iterative adaptive inverse filtering (IAIF) and quasi-closed phase (QCP) glottal inverse filtering algorithms can assist in utilizing the baseline and glottal information generated from each spoken utterance and the related healthy/PD classifications [66]. Anisha et al. [67] proposed adopting a method in which weak learners are bagged and boosted before making predictions, which will certainly provide better outcomes than basic ensemble voting and stacking. The suggested technique achieved an accuracy of 94.12% by enhancing ensemble classifiers. Grover et al. [68] using UCI’s Parkinson’s Telemonitoring Voice Data Set of patients, suggested an approach for predicting Parkinson’s disease severity using deep neural networks with 82% accuracy in controlled conditions, while a very similar approach with mRMR feature selection improved the accuracy levels on the same dataset [69]. Danish et al. [70] evaluated the potential of a deep neural network (DNN) and long short-term memory (LSTM) network-based model for predicting Parkinson’s illness using speech samples from a person with 97.1% accuracy. Quan et al., proposed an improvement, using a Bidirectional long-short term memory (LSTM) model to identify PD by capturing time-series dynamic aspects of a speech stream [71]. The authors of Ref. [72] developed an SSWA-based attention-based LSTM that provided improved performance with 92.5% accuracy on an Indian language dataset. The experiments by Zhangs et al. [73] showed that DF-EMD can be utilized to identify PD efficiently since the high-frequency section of the speech signal carries more information concerning PD. Nagasubramanian and Sankayya investigated the capability of acoustic-based DL approaches, discovering that combining these techniques results in around a 3% improvement in performance [74].

3. Materials and Methods

3.1. Dataset

This study was approved by the Kaunas Regional Ethics Committee for Biomedical Research (No. BE-2-49). Voice samples were obtained from 104 PD subjects examined in the Lithuanian University of Health Sciences (Lithuania). Serial numbers were assigned to each participant at the time of inclusion to protect their identity.
Speech recordings of the phonetically balanced Lithuanian sentence “Turėjo senelė žilą oželį” (‘The grandmother had a little grey goat’) were obtained using a T-series silent room for hearing testing (T-room, CA Tegner AB, Bromma, Sweden) via a D60S Dynamic Vocal (AKG Acoustics, Vienna, Austria) microphone placed 10.0 cm from the mouth with an about 90 microphone-to-mouth angle. Speech recordings were made at a rate of 44,100 samples per second and were exported as uncompressed 16-bit deep WAV audio files.
The phonetically balanced Lithuanian sentence “Turėjo senelė žilą oželį” (‘The grandmother had a little grey goat’) was recorded using a T-series silent room for hearing testing and a D60S Dynamic Vocal (AKG Acoustics, Vienna, Austria) microphone placed 10.0 cm from the mouth with an approximately 90 microphone-to-mouth angle. Speech was recorded at 44,100 samples per second and produced as uncompressed 16-bit deep WAV audio files. Speech samples were obtained from patients diagnosed with Parkinson’s disease at the Lithuanian University of Health Sciences Hospital, Kaunas Clinics by an experienced neurologist according to the UK Parkinson’s Disease Society Brain Bank criteria [75]. Only physically independent patients up to stage 3 on modified Hoehn and Yahr scale (H-Y), without any concomitant neurological or hearing disorders, respiratory tract infection, or any voice problems unrelated to PD at the time of the recording, were invited to participate in the study. The time of the recording was adjusted to best suit the schedule of the patient as well as the availability of the examiner, therefore, not all the recordings were made in best “on” state of the patients, who took medication for PD. The sample consisted of 61 patients (28 males and 33 females), aged 39–84 (mean age 64.9 (SD 9.7)), with a duration of the disease of up to 14 years (mean 3.6 (SD 3.6)), based on the time of diagnosis. Most participants were in H-Y stage 2 (29.5%), followed by H-Y stage 3 (26.2%), and H-Y stage 2.5 (19.5%). The normal speech subgroup was composed of 43 healthy volunteers who had no present or pre-existing speech, hearing, neurological, or laryngeal disorders and considered their speech as normal. Volunteers were free of upper respiratory infection at the time of the recording. Laryngeal endoscopy was done using the XION EndoSTROB DX device (XION GmbH, Berlin, Germany) with a 70-degree rigid endoscope without topical anesthesia for both the patient and control groups. Subjects with any pathological alterations of the laryngeal fold, such as polyps, granulomas, paralysis etc., were not included in the study. This dataset was used only for the validation of our U-lossian network.
For the training of the algorithm we have used the publicly accessible ItalianPVS corpora [76], where each speaker recorded five sustained vowel sounds with two iterations each. These samples were contributed by 22 (10 men and 12 women) healthy volunteers (HC) aged 66–77 years and 28 (19 men and 9 women) patients with PD, aged 40–80 years. The healthy subgroup did not report particular speech or language disorders. The patients reported no speech or language disorders that were not related to their Parkinson’s disease. All patients received antiparkinsonian treatment. The disease severity was classified by the specialists as <4 on the modified Hoehn and Yahr scale for 25 patients, stage 4 for 2 patients, and stage 5 for 1 patient. All of the speakers in this corpus were recorded in Bari, Puglia, Italy. Each recording session was conducted in a controlled atmosphere in a quiet, echo-free room, and speech samples were recorded after a short explanation by the specialist. Elements such as room temperature, microphone distance (15 to 25 cm), time of day, and a discussion with the subject to warm up their vocal muscles were taken into account. The sample frequency was set to 16 kHz. The paper [77] has further details.

3.2. U-Lossian Deep Learning Network

We sought a customized strategy since one of the limitations of traditional loss function implementation is that it equally weights false positive (FP) and false negative (FN) identification. In practice, this leads to voice segmentation maps with great accuracy but low recall. FN detections must be weighted higher than FPs to improve the recall rate for extremely imbalanced data and smaller ROIs, such as the small Lithuanian Parkinson dataset. Another problem with typical loss functions is that they have difficulties segmenting small ROIs since they do not contribute much to the loss. To address this, we propose using a custom loss function that is parametrized to control the difference between easy background and tough ROI training samples. To focus on speech samples recognized with lesser probability, we propose applying a parameter that exponentiates the cross-entropy loss. We perform fast Fourier transformation (FFT) to the vocalized audio sample with 201 bins to build the spectrogram. Mel-frequency cepstral coefficients (MFCCs) are then calculated using 40 mel scale coefficients from the FFTs, as recommended by Ref. [78]. As a consequence, an MFCC picture with a height of 40 pixels and a length equal to the audio duration is produced.
The implementation flow is represented in Figure 1 and the process sequence diagram is given in Figure 2. A doctor has two possibilities when using the PD screening application: (1) utilize a previously recorded audio file, or (2) record live. The signal is then converted to a waveform (any system compatible codec is permitted as it has no discernible effect on classification effectiveness). The signal is then preprocessed for 16 kHz, which speeds up the computation, and is then transformed to mono. The unique characteristics indicating the logarithmic perception of a PD patient’s unique intensity and tone were extracted using MFCC. The actions for assessing MFCC features must be conducted in the sequence of each speech signal, and then these characteristics were used to train the CNN algorithm, which also extracts features. Within each vocal outline, a feature vector was saved to hold the features related to the specific spectrogram “frame”. This also aided in reducing the complexity of the model and achieving improved recognition accuracy. The doctor receives a result along with numerous calculated voice parameters.
To achieve a better balance of accuracy and recall in the processed voice, we presented a modified Hybrid Mask U-Net architecture with an adaptive custom loss function (further named U-lossian). Our approach was inspired by the popular architectures Mask U-Net (often used for “segmentation” of sounds, e.g., [79]) and Resnet18 (often used for “classification” of sounds, e.g., [80]). We have aimed for an architecture design to operate well with a modest number of training samples, making it appropriate for less popular language datasets such as Lithuanian. The network is made up of two paths: one that contracts to extract locality characteristics and one that expands to resample the image maps with contextual information. Skip connections are used to integrate high-resolution local characteristics with low-resolution global features in order to get more relevant results. During our research, we noticed that while training a negative gradient over-suppression, for example, each positive sample of one class in softmax or sigmoid cross-entropy might be interpreted as a negative sample for other classes, resulting in more suppressed gradients for tail classes. To prevent gradient over-suppression, we developed a custom loss function with better regularization. It may also be used to compare the expected and actual sampling frequencies of each class, and then use the division of these frequencies to re-weight loss values for different classes. The custom loss function prioritizes less accurate misclassified predictions. When we detect over-suppression of this custom loss, it typically means that the model is near convergence. We tested with high learning rates and found that the learning rate of 1 × 10 7 produced the best results; therefore we trained all experiments with it. To prevent loss function over-suppression, we trained intermediate layers with the usual U-net strategy but supervised the final layer with the loss function to reduce sub-optimal convergence. The input of our U-lossian model is an image representing the voice spectrogram, which is denoted as X. The network learns to map the input to the prediction Y according to a convolutional feature given by Equation (1):
Y = F n ( X n | Θ n ) = h ( W X n + b ) , Θ n = [ W , b ]
here X n is a one-dimensional input matrix of N feature maps, W is a set of N one-dimensional kernels that is used to extract a set of features from the input values, h is an activation function, and b is a bias vector.
Two maximum pooling layers are included in the U-lossian model. The maximum pooling approach is used by the pooling layer in the contraction route to extract prominent characteristics in a region. The pooling size is 2 × 2 and the step size is 2, which is the same as downsampling twice. Two-layer fusion layers are also included in the model. Combining the features retrieved by the contraction path’s convolutional layer with the output results of the expansion path’s upsampling layer, and merging the information lost in feature extraction into the expansion path, can improve the output result.
One-layer Dropout layers are included in the model. We improve the model’s prediction performance on the test set, and employ the Dropout layer in the U-lossian model to speed up the convergence. Two layers of upsampling are also included in the model. In the expansion path, the features of the same size retrieved by the respective contraction layer are combined, and up-sampling is performed twice to generate an output of the same size as the original input.
A loss function, denoted by : H × Z R + : = [ 0 , + ) , measures the difference between a predicted label and a true label, e.g., L 2 loss: ( f θ , z ) = 1 2 ( f θ ( x ) y ) 2 , where z = ( x , y ) .
Training loss for a set S = ( x i , y i ) i = 1 n is denoted by L S ( θ ) or L n ( θ ) or R n ( θ ) or R S ( θ ) ,
L S ( θ ) = 1 n i = 1 n ( f θ ( x i ) , y i ) + λ W .
here λ W is a regularization term that penalizes the complexity of the model.
The loss function used in the study is the cross-entropy loss function, which is defined as follows:
L ( Y , P ( Y / X ) ) = l o g P ( Y / X ) = 1 N i = 1 N j = 1 M y i j l o g ( p i j ) .
The loss function is L, the output variable is Y, and the input variable is X. y i j is a binary index showing whether category j is the real category of input instance x i . N is the input sample size, M is the number of potential categories, and y i j is a binary index indicating whether category j is the real category of input instance x i . The probability that the model prediction input instance x i corresponds to category j is represented by p i j . The optimal model weights and bias settings are determined by minimizing the loss function, allowing the model to better correctly forecast the PD.
A good optimization strategy may speed up model convergence, improve data feature learning, fine-tune the neural network’s weight and bias parameters, and reduce the loss function to the maximum degree possible. The strategy of applying an adaptive learning rate will be more favorable to model training and prediction accuracy; also, the model network will be deeper and converge faster. Therefore, the Adaptive Moment Estimation (Adam) [81] algorithm is used to minimize the loss function of the U-lossian model. The classification model is presented in Figure 3 and the hyper-parameters are given in Table 1.

4. Experimental Validation

4.1. Performance Evaluation

We use the following metrics for the evaluation of the performance, which were calculated according to Ref. [82]:
Sensitivity or true positive rate (TPR) is the probability that a predicted result will be positive when the disease is present.
S e n s i t i v i t y = a / ( a + b )
Specificity or true negative rate (TNR) is the probability that a predicted result will be negative when the disease is not present.
S p e c i f i c i t y = d / ( c + d )
where a represents true positives (TP), participants who have the disease and positive test findings; d represents subjects who do not have the disease and the test agrees (TN); b represents individuals who do not have the disease but the test shows ‘disease’ (FP); and c represents false negatives (FN).
The positive likelihood ratio (PLR) is the ratio of the likelihood of a positive test result given the existence of the illness to the likelihood of a positive test result given the absence of the disease, i.e.,
P L R = T P R / F P R = S e n s i t i v i t y / ( 1 S p e c i f i c i t y )
The negative likelihood ratio (NLR) is the ratio of the likelihood of a negative test result in the presence of disease to the likelihood of a negative test result in the absence of disease, i.e.,
N L R = F N R / T N R = ( 1 S e n s i t i v i t y ) / S p e c i f i c i t y
When screening people, predictive values are more important than sensitivity and specificity. The positive predictive value (PPV) is the probability that the disease is present when the prediction is positive.
P P V = a / ( a + b )
The negative predictive value (NPV) is the probability that the disease is not present when the prediction is negative.
N P V = d / ( c + d )
Accuracy is the overall probability that a voice sample is correctly classified.
A c c u r a c y = S e n s i t i v i t y × P r e v a l e n c e + S p e c i f i c i t y × ( 1 P r e v a l e n c e )
The misclassification rate (MCR) is a measure that indicates the ratio of outcomes predicted incorrectly by a classification model.
M C R = ( b + c ) / ( a + b + c + d )
Youden presented an index to assess the quality of a screening test. The index is defined using the false positive and false negative values as
Y o u d e n = s e n s i t i v i t y + s p e c i f i c i t y 1
The false discovery rate (FDR) is the predicted proportion of incorrect positive classifications to total positive classifications (rejections of the negative class).
F D R = ( F P ) / ( F P + T P )
The false omission rate (FOR) measures the ratio of false negatives that are incorrectly rejected.
F O R = ( F N ) / ( F N + T N )
Balanced accuracy (BA) is the average of the recall scores acquired for each class, that is, the general average of the recall scores per class.
B A = ( s e n s i t i v i t y + s p e c i f i c i t y ) / 2
The F1-Measure is the harmonic mean of the precision and recall.
F 1 = 2 × p r e c i s i o n × r e c a l l / ( p r e c i s i o n + r e c a l l )
The G-measure (or Fowlkes–Mallows index) is a metric for measuring the confusion matrices that is used to quantify the similarity between two clusterings (clusters formed following a clustering technique), where each cluster represents a different class.
G = P P V × T P R
Matthews index is a balanced measure that yields a number between 1 and +1 as a correlation coefficient between predicted and true binary classifications. A coefficient of +1 implies a flawless forecast, a coefficient of 0 shows no better than random prediction, and a coefficient of 1 indicates absolute disagreement between prediction and observation.
M a t t h e w s = P P V × T P R × T N R × N P V F D R × F N R × F P R × F O R
The critical success index (CSI) is a categorical prediction performance verification metric equal to the total number of correct predictions divided by the total number of predictions plus the number of misses.
C S I = a / ( a + b + c )
Cohen’s kappa κ is used to evaluate binary classifications,
κ = 2 × ( T P × T N F N × F P ) / [ ( T P + F P ) × ( F P + T N ) + ( T P + F N ) × ( F N + T N ) ]
The Yule coefficient Y is a measure of association between two binary variables.
Y = ( a × d b × c ) / ( a × d + b × c )
Diagnostic odds ratio (DOR) is a measure of the efficacy of a diagnostic test. It is defined as the ratio of the probabilities of a positive test if the subject has a disease to the odds of a positive test if the subject does not have the condition.
D O R = [ s e n s i t i v i t y × s p e c i f i c i t y ] / [ ( 1 s e n s i t i v i t y ) × ( 1 s p e c i f i c i t y ) ]
Discriminant Power is the degree of precision with which a set of predictor factors categorizes the outcomes.
The confidence ranges for accuracy, sensitivity, and specificity are “exact” Clopper–Pearson confidence ranges [83]. The “Log technique”, as described in Ref. [84], is used to compute confidence ranges for likelihood ratios. The standard logit confidence intervals offered by Mercaldo et al. [85] are used to calculate the confidence intervals for the prediction values.
To visualize the results, the precision-recall (PR) curve, receiver operating characteristic (ROC) curve, sensitivity-specificity plot, and alluvial plot of confusion matrix are used.
When different probability thresholds are utilized, ROC curves describe the trade-off between a predictive model’s true positive rate and false positive rate. When different probability thresholds are utilized, precision-recall (PR) curves describe the trade-off between a predictive model’s actual positive rate and positive predictive value.
When the observations in each class are balanced, ROC curves are acceptable, but precision-recall curves are appropriate for unbalanced datasets. An alluvial diagram is used to show associations between categorical variables making the confusion matrix.

4.2. Results

The classification results using the ItalianPVS dataset are presented in Figure 4 and Figure 5 (confusion matrix). The results show that the network model achieved good results with an F1-score of 0.8974, and Area Under Curve (AUC) of 0.9433.
The classification results using the Lithuanian voice dataset are presented in Figure 6 and Figure 7 (confusion matrix).
Figure 8a display the alluvial plot for the Italian dataset, while Figure 8b display the aluavian plot for the Lithuanian dataset. The classifier has achieved worse results on the Lithuanian voice dataset as it is a smaller dataset, achieving F1-score of 0.7778, and Area Under Curve (AUC) of 0.8179. Perhaps, better results could have been achieved if more voice data would be available for network, training, which is supported by the shape of PR and ROC curves, which are not perfect.
The sensitivity-specificity plots for both datasets are presented in Figure 9a,b, respectively. They show that the best performance of the classifier model is achieved, when the cutoff value is equal to 0.1 for the ItalianPVS dataset, and 0.8 for the Lithuanian voice dataset.
The time performance of the proposed deep learning model on both datasets is compared in Figure 10. An excellent time performance of processing one voice record in just 4 ms was demonstrated, which experimentally validated the characteristics presented in Table 2. The results show that the proposed model can be used for real-time PD screening.
The performance results of both datasets are presented in Table 3 and summarized visually in Figure 11. These results show lower performance for the Lithuanian voice dataset with a higher variability (i.e., wider confidence range), which can be explained by the smaller size of the Lithuanian voice dataset.

4.3. Statistical Evaluation

We evaluated the results statistically using Bayesian credibility assessment by Ref. [86] to assess the credibility of our results considering the existing evidence. The odds ratio had to be smaller than 0.96 so that our results could be considered credible. It specifically indicates if the new finding, when integrated with existing information, may be considered to have genuinely proved efficacy at the 95% confidence level. At the 95% confidence threshold, such a finding is deemed to be credible.
For the ItalianPVS dataset, the Critical Error Odds Ratio (EOR) is 1.6841 . Error Odds Ratio (EOR) is 3.8599 . As E O R > C O R , the test is credible at the 95%. Critical Diagnostic Odds Ratio (DOR) is 1.1326 . Diagnostic Odds Ratio (DOR) is 113.0458 . As D O R > C O R , the test is credible at the 95%.
For the Lithuanian voice dataset, Critical Diagnostic Odds Ratio (DOR) is 1.2643 . Diagnostic Odds Ratio (DOR) is 14.9333 —the classifier discriminates between diseased and not diseased. As D O R > C O R , the test is credible at the 95%.

4.4. Summary of the Results

It is worth noting that the current work employed two quite distinct datasets of PD voices (Italian and Lithuanian) for analysis and algorithm building. The Italian PD voice samples were based on sustained vowel phonation, whereas the Lithuanian samples were based on phonetically balanced phrase analysis. However, because sustained vowel phonation is an artificial sort of phonation, that feature defines the same constraint in the meaning of the sustained vowel signal analysis. Connected speech, on the other hand, is more typical of everyday speaking and might be deemed more “ecologically valid” (i.e., more representative of daily speech and voice use patterns). As a result, if an objective voice evaluation is to be deemed robust and physiologically valid for screening purposes, the acoustic measurements should preferably be done utilizing both speaking patterns–sustained phonation and running speech (used in our approach).
As a result, the PD classification findings shown on speech samples from two independent datasets must be regarded with caution. The Italian dataset represented Parkinson’s disease patients with a minor incidence of advanced PD stages according to the H-Y scale, and hence more pronounced voice abnormalities. This characteristic may have improved classification accuracy, resulting in the somewhat superior PD classification results presented on the Italian dataset.
The current study, on the other hand, shows that the suggested Hybrid U-lossian deep learning network technique is successful in analyzing and classifying PD voice samples of various sorts, hence expanding PD screening options. It is vital to note that the recommended algorithm is not currently regarded a medical device or diagnostic tool. Nonetheless, the suggested technique has the potential to be applied in clinical settings as a sensitive tool for the screening of Parkinson’s disease-related voice and speech abnormalities.

5. Discussion

Despite extensive research of the potential for acoustic analysis in the classification of PD voices, the methods used, as well as parameters considered, vary immensely among studies. The standardization of study protocols as well as reproducibility studies are lacking. The acoustic speech signal carries a massive amount of information. Nevertheless, the direct link between voice production and acoustics has not been explicitly studied [87]. Moreover, the patophysiology of speech production itself is not yet fully understood in PD [88]. Speech function is well known to deteriorate with disease progression up to unintelligible levels in the latest stages. However, only a fraction of studies analyze speech in the early phase of PD. The phonetics of spoken languages differ in some aspects and are shared in others. Therefore, some acoustic parameters may have similar values and meanings in different populations [89], while others are not to be universalized directly. Acoustic studies in different languages may shed some light on the topic and the achieved results. Moro-Velasquez [90] declared his group the first to successfully implement the cross-corpora trials for AI PD detection. They used databases of Czech and two dialects of Spanish speakers and only used diadochokinetic speech task for training with one and testing with another database, as these utterances were supposed to not differ across the databases. Our approach of a cross-corpus trial was driven by the fact that Lithuanian is a language, spoken by as little as 3 million native speakers, and is largely underinvestigated. Considering the sample size, losing part of the subjects to testing was chosen not an option. The bold approach to test on other language speech samples, was encouraged by the work of Rush et al. [89] who had implemented a composite dysarthria score for testing early PD and RBD speakers of 7 different languages with comparable results and an overall AUC of 0.8. Therefore, It can be considered that PD differently affects certain phonetic groups, with those requiring the narrowest contact between the articulators (such as fricatives), being influenced the most, correlating with results shown by Ref. [90]. Still, naturally, a substantial effect on other phonetic groups cannot be overlooked as the disease has been shown to impair the articulatory sequence as a whole [90]. A comparison of the effectiveness of different deep learning approaches is offered in Table 4.
With the above-mentioned studies, to date there is no established universal approach to study speech impairment in PD. Speech acoustic analysis has not been included in the latest Movement disorder society (MDS) criteria for PD [95,96], nor MDS Research Criteria for Prodromal Parkinson’s Disease [97]. As was stated by Godino-Llorente in his editorial for [98], automatic systems to assess PD will benefit from new knowledge generated in the research area to develop more accurate and robust systems, as was also shown in our experimental overview.
Finally, the fact that hypokinetic dysarthria is not the integral symptom of PD, with an estimated prevalence of up to 90% of cases with rising expression in the latest stages [99], the accuracy of classification obtained on both the Italian and Lithuanian corpora is satisfactory from a medical perspective. Furthermore, our proposed approach reaches an accuracy not markedly lower in the cross corpora–cross linguistic trial, indicating the generalizability of the method to different populations and recording conditions.

6. Conclusions

In this paper, we introduced a method for speech signal processing to illustrate the utility of deep learning-driven voice analysis as a screening tool for Parkinson’s disease (PD). We investigated whether voice recordings might be used to provide a simple, low-cost approach to the assessment and screening of Parkinson’s disease, using deep learning to predict and evaluate expert scores. As a consequence, we created a Deep U-lossian model, a modified Hybrid Mask U-Net architecture with an adaptive custom loss function, for PD evaluation and detection in order to achieve a better balance of accuracy and recall in processed speech. The classification accuracy on two speech corpora (ItalianPVS and Lithuanian voice dataset), 0.8964 and 0.7949, respectively, is satisfactory from a medical aspect, confirming the proposed model’s excellent generalizability. Furthermore, the proposed model has demonstrated exceptional performance in terms of speed, ensuring real-time performance.
The method has a strong potential to be employed in clinical settings as a sensitivity test for the screening of Parkinson’s disease-related voice and speech alterations and as a result, the future work of the study will be a proper clinical validation in the hospital environment, with the idea being in line to create a system that could analyze a large number of telephone voice calls (patients calling the Department of Otorhinolaryngology for remote consultation, allowing doctors to acquire live data on a patient while he is still speaking).

Author Contributions

Conceptualization, R.M. and V.U.; Data curation, R.D., A.K. and K.P.; Formal analysis, R.M., R.D., A.K., E.P. and K.P.; Funding acquisition, V.U.; Investigation, R.M. and K.P.; Methodology, R.M., E.P., K.P. and V.U.; Project administration, R.M. and V.U.; Resources, V.U.; Software, A.K.; Supervision, R.D. and V.U.; Validation, R.M., R.D., E.P. and V.U.; Visualization, R.D. and A.K.; Writing—original draft, R.M., K.P. and V.U.; Writing—review and editing, R.M. All authors have read and agreed to the published version of the manuscript.

Funding

This research has received funding from European Regional Development Fund (project No 13.1.1-LMT-K-718-05-0027) under grant agreement with the Research Council of Lithuania (LMTLT). Funded as European Union’s measure in response to Covid-19 pandemic.

Institutional Review Board Statement

The study was conducted in accordance with the Declaration of Helsinki, and approved by the Institutional Review Board.

Informed Consent Statement

Informed consent was obtained from all subjects involved in the study.

Data Availability Statement

The ItalianPVS dataset is available at https://ieee-dataport.org/open-access/italian-parkinsons-voice-and-speech (accessed on 19 June 2022). The Lithuanian voice dataset is not available due to privacy reasons.

Acknowledgments

The data of PD patients was kindly provided by Jolita Ciceliene, Department of Neurology, Lithuanian University of Health Sciences, Kaunas, Lithuania.

Conflicts of Interest

The authors declare no conflict of interest.

Abbreviations

The following abbreviations are used in this manuscript:
PDParkinson Disease
DLDeep learning
HCHealthy Control
TPTrue Positive
FPFalse positive
AIArtificial Intelligence
PVIParkinson Speech Initiative
NMINormalized Mutual Information
COControl
KNNK-Nearest Neighbor
AUCArea Under The Curve
ROCReceiver Operating Characteristics
ADAMAdaptive Moment Estimation
EORError Odds Ratio
DORDiagnostic Odds Ratio
MCRMis-classification Rate
FORFalse omission rate
BABalanced Accuracy
NPVNegative Predictive Value
FDRFalse discovery rate
NLRNegative Likelihood Ratio
PLRPositive Likelihood Ratio
FPRFalse Positive rate
FNRFalse Negative rate
CSICritical success index

References

  1. Harrison, P.J.; Luciano, S. Incidence of Parkinson’s disease, dementia, cerebrovascular disease and stroke in bipolar disorder compared to other psychiatric disorders: An electronic health records network study of 66 million people. Bipolar Disord. 2021, 23, 454–462. [Google Scholar] [CrossRef] [PubMed]
  2. Ou, Z.; Pan, J.; Tang, S.; Duan, D.; Yu, D.; Nong, H.; Wang, Z. Global Trends in the Incidence, Prevalence, and Years Lived With Disability of Parkinson’s Disease in 204 Countries/Territories From 1990 to 2019. Front. Public Health 2021, 9, 776847. [Google Scholar] [CrossRef] [PubMed]
  3. Bloem, B.R.; Okun, M.S.; Klein, C. Parkinson’s disease. Lancet 2021, 397, 2284–2303. [Google Scholar] [CrossRef]
  4. Gaenslen, A.; Swid, I.; Liepelt-Scarfone, I.; Godau, J.; Berg, D. The patients’ perception of prodromal symptoms before the initial diagnosis of Parkinson’s disease. Mov. Disord. 2021, 26, 653–658. [Google Scholar] [CrossRef] [PubMed] [Green Version]
  5. Walter, U.; Kleinschmidt, S.; Rimmele, F.; Wunderlich, C.; Gemende, I.; Benecke, R.; Busse, K. Potential impact of self-perceived prodromal symptoms on the early diagnosis of Parkinson’s disease. J. Neurol. 2012, 260, 3077–3085. [Google Scholar] [CrossRef] [PubMed]
  6. Schrag, A.; Horsfall, L.; Walters, K.; Noyce, A.; Petersen, I. Prediagnostic presentations of Parkinson’s disease in primary care: A case-control study. Lancet Neurol. 2015, 14, 57–64. [Google Scholar] [CrossRef] [Green Version]
  7. Pont-Sunyer, C.; Hotter, A.; Gaig, C.; Seppi, K.; Compta, Y.; Katzenschlager, R.; Mas, N.; Hofeneder, D.; Brücke, T.; Bayés, A.; et al. The Onset of Nonmotor Symptoms in Parkinson’s disease (The ONSET PDStudy). Mov. Disord. 2015, 30, 229–237. [Google Scholar] [CrossRef]
  8. Bezard, E.; Gross, C.E.; Brotchie, J.M. Presymptomatic compensation in Parkinson’s disease is not dopamine-mediated. Trends Neurosci. 2003, 26, 215–221. [Google Scholar] [CrossRef]
  9. Postuma, R.B.; Berg, D.; Stern, M.; Poewe, W.; Olanow, C.W.; Oertel, W.; Obeso, J.; Marek, K.; Litvan, I.; Lang, A.E.; et al. MDS clinical diagnostic criteria for Parkinson’s disease. Mov. Disord. 2015, 30, 1591–1601. [Google Scholar] [CrossRef]
  10. Mahlknecht, P.; Stockner, H.; Marini, K.; Gasperi, A.; Djamshidian, A.; Willeit, P.; Kiechl, S.; Willeit, J.; Rungger, G.; Poewe, W.; et al. Midbrain hyperechogenicity, hyposmia, mild parkinsonian signs and risk for incident Parkinson’s disease over 10 years: A prospective population-based study. Parkinsonism Relat. Disord. 2020, 70, 51–54. [Google Scholar] [CrossRef]
  11. Kouba, T.; Illner, V.; Rusz, J. Study protocol for using a smartphone application to investigate speech biomarkers of Parkinson’s disease and other synucleinopathies: SMARTSPEECH. BMJ Open 2022, 12, e059871. [Google Scholar] [CrossRef] [PubMed]
  12. Duffy, J.R. Motor Speech Disorders. 2019. Available online: https://www.elsevier.com/books/motor-speech-disorders/duffy/978-0-323-53054-5 (accessed on 1 October 2022).
  13. Mostafa, S.A.; Mustapha, A.; Mohammed, M.A.; Hamed, R.I.; Arunkumar, N.; Abd Ghani, M.K.; Jaber, M.M.; Khaleefah, S.H. Examining multiple feature evaluation and classification methods for improving the diagnosis of Parkinson’s disease. Cogn. Syst. Res. 2019, 54, 90–99. [Google Scholar] [CrossRef]
  14. Mohammed, M.A.; Elhoseny, M.; Abdulkareem, K.H.; Mostafa, S.A.; Maashi, M.S. A Multi-agent Feature Selection and Hybrid Classification Model for Parkinson’s Disease Diagnosis. ACM Trans. Multimed. Comput. Commun. Appl. 2021, 17, 1–22. [Google Scholar] [CrossRef]
  15. Harel, B.; Cannizzaro, M.; Snyder, P.J. Variability in fundamental frequency during speech in prodromal and incipient Parkinson’s disease: A longitudinal case study. Brain Cogn. 2004, 56, 24–29. [Google Scholar] [CrossRef]
  16. Rusz, J.; Cmejla, R.; Ruzickova, H.; Ruzicka, E. Quantitative acoustic measurements for characterization of speech and voice disorders in early untreated Parkinson’s disease. J. Acoust. Soc. Am. 2011, 129, 350–367. [Google Scholar] [CrossRef] [Green Version]
  17. Rusz, J.; Hlavnička, J.; Novotný, M.; Tykalová, T.; Pelletier, A.; Montplaisir, J.; Gagnon, J.; Dušek, P.; Galbiati, A.; Marelli, S.; et al. Speech Biomarkers in Rapid Eye Movement Sleep Behavior Disorder and Parkinson Disease. Ann. Neurol. 2021, 90, 62–75. [Google Scholar] [CrossRef]
  18. Rusz, J.; Hlavnička, J.; Tykalová, T.; Bušková, J.; Ulmanová, O.; Růžička, E.; Šonka, K. Quantitative assessment of motor speech abnormalities in idiopathic rapid eye movement sleep behaviour disorder. Sleep Med. 2016, 19, 141–147. [Google Scholar] [CrossRef]
  19. Atzori, A.; Carullo, A.; Vallan, A.; Cennamo, V.; Astolfi, A. Parkinson disease voice features for rehabilitation therapy and screening purposes. In Proceedings of the 2019 IEEE International Symposium on Medical Measurements and Applications (MeMeA), Istanbul, Turkey, 26–28 June 2019; pp. 1–6. [Google Scholar] [CrossRef]
  20. Dumican, M.; Watts, C. Self-perceptions of speech, voice, and swallowing in motor phenotypes of Parkinson’s disease. Clin. Parkinsonism Relat. Disord. 2020, 3, 100074. [Google Scholar] [CrossRef]
  21. Brooks, S.; Weston, D.; Greenberg, N. Social and psychological impact of the COVID-19 pandemic on people with Parkinson’s disease: A scoping review. Public Health 2021, 199, 77–86. [Google Scholar] [CrossRef]
  22. Erdogdu Sakar, B.; Serbes, G.; Sakar, C.O. Analyzing the effectiveness of vocal features in early telediagnosis of Parkinson’s disease. PLoS ONE 2017, 12, e0182428. [Google Scholar] [CrossRef] [Green Version]
  23. Pah, N.D.; Motin, M.A.; Kumar, D.K. Phonemes based detection of parkinson’s disease for telehealth applications. Sci. Rep. 2022, 12, 9687. [Google Scholar] [CrossRef] [PubMed]
  24. Rusz, J.; Cmejla, R.; Tykalova, T.; Ruzickova, H.; Klempir, J.; Majerova, V.; Picmausova, J.; Roth, J.; Ruzicka, E. Imprecise vowel articulation as a potential early marker of Parkinson’s disease: Effect of speaking task. J. Acoust. Soc. Am. 2013, 134, 2171–2181. [Google Scholar] [CrossRef] [PubMed] [Green Version]
  25. Kandl, J.; Moore, J. Parkinson Disease. J. Sing. 2022, 78, 609–612. [Google Scholar] [CrossRef]
  26. Illner, V.; Sovka, P.; Rusz, J. Validation of freely-available pitch detection algorithms across various noise levels in assessing speech captured by smartphone in Parkinson’s disease. Biomed. Signal Process. Control 2020, 58, 101831. [Google Scholar] [CrossRef]
  27. Tykalova, T.; Novotny, M.; Ruzicka, E.; Dusek, P.; Rusz, J. Short-term effect of dopaminergic medication on speech in early-stage Parkinson’s disease. NPJ Parkinson’s Dis. 2022, 8, 22. [Google Scholar] [CrossRef] [PubMed]
  28. Cordella, F.; Paffi, A.; Pallotti, A. Classification-based screening of Parkinson’s disease patients through voice signal. In Proceedings of the 2021 IEEE International Symposium on Medical Measurements and Applications (MeMeA), Lausanne, Switzerland, 23–25 June 2021; pp. 1–6. [Google Scholar] [CrossRef]
  29. Almeida, J.S.; Rebouças Filho, P.P.; Carneiro, T.; Wei, W.; Damaševičius, R.; Maskeliūnas, R.; de Albuquerque, V.H.C. Detecting Parkinson’s disease with sustained phonation and speech signals using machine learning techniques. Pattern Recognit. Lett. 2019, 125, 55–62. [Google Scholar] [CrossRef] [Green Version]
  30. Arora, S.; Tsanas, A. Assessing Parkinson’s Disease at Scale Using Telephone-Recorded Speech: Insights from the Parkinson’s Voice Initiative. Diagnostics 2021, 11, 1892. [Google Scholar] [CrossRef]
  31. Arora, S.; Baghai-Ravary, L.; Tsanas, A. Developing a large scale population screening tool for the assessment of Parkinson’s disease using telephone-quality voice. J. Acoust. Soc. Am. 2019, 145, 2871–2884. [Google Scholar] [CrossRef]
  32. Rusz, J.; Hlavnička, J.; Tykalová, T.; Novotný, M.; Dušek, P.; Šonka, K.; Růžička, E. Smartphone Allows Capture of Speech Abnormalities Associated With High Risk of Developing Parkinson’s Disease. IEEE Trans. Neural Syst. Rehabil. Eng. 2018, 26, 1495–1507. [Google Scholar] [CrossRef]
  33. Ehsan, M.T.; Pranto, S.I.; Mamun, K.A. Real-Time Screening of Parkinson’s Disease based on Speech Analysis using Smartphone. In Proceedings of the 2021 10th International IEEE/EMBS Conference on Neural Engineering (NER), Virtual, 4–6 May 2021; pp. 573–576. [Google Scholar] [CrossRef]
  34. Bot, B.M.; Suver, C.; Neto, E.C.; Kellen, M.; Klein, A.; Bare, C.; Doerr, M.; Pratap, A.; Wilbanks, J.; Dorsey, E.R.; et al. The mPower study, Parkinson disease mobile data collected using ResearchKit. Sci. Data 2016, 3, 160011. [Google Scholar] [CrossRef] [Green Version]
  35. Zhan, A.; Mohan, S.; Tarolli, C.; Schneider, R.B.; Adams, J.L.; Sharma, S.; Elson, M.J.; Spear, K.L.; Glidden, A.M.; Little, M.A.; et al. Using Smartphones and Machine Learning to Quantify Parkinson Disease Severity. JAMA Neurol. 2018, 75, 876–880. [Google Scholar] [CrossRef] [PubMed]
  36. Lipsmeier, F.; Taylor, K.I.; Kilchenmann, T.; Wolf, D.; Scotland, A.; Schjodt-Eriksen, J.; Cheng, W.Y.; Fernandez-Garcia, I.; Siebourg-Polster, J.; Jin, L.; et al. Evaluation of smartphone-based testing to generate exploratory outcome measures in a phase 1 Parkinson’s disease clinical trial. Mov. Dis. 2018, 33, 1287–1297. [Google Scholar] [CrossRef] [PubMed] [Green Version]
  37. Aharonov, O. Toward voice detection for screening rheumatology patients. Indian J. Rheumatol. 2021, 16, 371. [Google Scholar] [CrossRef]
  38. Pereira, C.R.; Pereira, D.R.; Weber, S.A.T.; Hook, C.; de Albuquerque, V.H.C.; Papa, J.P. A survey on computer-assisted Parkinson’s Disease diagnosis. Artif. Intell. Med. 2019, 95, 48–63. [Google Scholar] [CrossRef]
  39. Behroozi, M.; Sami, A. A Multiple-Classifier Framework for Parkinson’s Disease Detection Based on Various Vocal Tests. Int. J. Telemed. Appl. 2016, 2016, 6837498. [Google Scholar] [CrossRef] [Green Version]
  40. Tsanas, A.; Little, M.A.; McSharry, P.E.; Ramig, L.O. Nonlinear speech analysis algorithms mapped to a standard metric achieve clinically useful quantification of average Parkinson’s disease symptom severity. J. R. Soc. Interface 2011, 8, 842–855. [Google Scholar] [CrossRef] [Green Version]
  41. Perez, C.; Roca, Y.C.; Naranjo, L.; Martin, J. Diagnosis and Tracking of Parkinson’s Disease by using Automatically Extracted Acoustic Features. J. Alzheimers Dis. Park. 2016, 6, 260. [Google Scholar] [CrossRef]
  42. Pah, N.D.; Motin, M.A.; Kumar, D.K. Voice Analysis for Diagnosis and Monitoring Parkinson’s Disease; Springer: Singapore, 2021. [Google Scholar] [CrossRef]
  43. Mohammadi, A.G.; Mehralian, P.; Naseri, A.; Sajedi, H. Parkinson’s disease diagnosis: The effect of autoencoders on extracting features from vocal characteristics. Array 2021, 11, 100079. [Google Scholar] [CrossRef]
  44. Gillivan-Murphy, P.; Miller, N.; Carding, P. Voice Tremor in Parkinson’s Disease: An Acoustic Study. J. Voice 2019, 33, 526–535. [Google Scholar] [CrossRef] [Green Version]
  45. Akyol, K. Growing and Pruning Based Deep Neural Networks Modeling for Effective Parkinson’s Disease Diagnosis. Comp. Model. Eng. Sci. 2020, 122, 619–632. [Google Scholar] [CrossRef]
  46. Maskeliūnas, R.; Kulikajevas, A.; Damaševičius, R.; Pribuišis, K.; Ulozaitė-Stanienė, N.; Uloza, V. Lightweight Deep Learning Model for Assessment of Substitution Voicing and Speech after Laryngeal Carcinoma Surgery. Cancers 2022, 14, 2366. [Google Scholar] [CrossRef] [PubMed]
  47. Tracy, J.M.; Özkanca, Y.; Atkins, D.C.; Hosseini Ghomi, R. Investigating voice as a biomarker: Deep phenotyping methods for early detection of Parkinson’s disease. J. Biomed. Inf. 2020, 104, 103362. [Google Scholar] [CrossRef] [PubMed]
  48. Ali, L.; Zhu, C.; Zhang, Z.; Liu, Y. Automated Detection of Parkinson’s Disease Based on Multiple Types of Sustained Phonations Using Linear Discriminant Analysis and Genetically Optimized Neural Network. IEEE J. Transl. Eng. Health Med. 2019, 7, 1–10. [Google Scholar] [CrossRef] [PubMed]
  49. Viswanathan, R.; Arjunan, S.P.; Bingham, A.; Jelfs, B.; Kempster, P.; Raghav, S.; Kumar, D.K. Complexity Measures of Voice Recordings as a Discriminative Tool for Parkinson’s Disease. Biosensors 2019, 10, 1. [Google Scholar] [CrossRef] [Green Version]
  50. Hireš, M.; Gazda, M.; Drotár, P.; Pah, N.D.; Motin, M.A.; Kumar, D.K. Convolutional neural network ensemble for Parkinson’s disease detection from voice recordings. Comp. Biol. Med. 2022, 141, 105021. [Google Scholar] [CrossRef] [PubMed]
  51. Polat, K. A Hybrid Approach to Parkinson Disease Classification Using Speech Signal: The Combination of SMOTE and Random Forests. In Proceedings of the 2019 Scientific Meeting on Electrical-Electronics & Biomedical Engineering and Computer Science (EBBT), Istanbul, Turkey, 24–26 April 2019. [Google Scholar] [CrossRef]
  52. Solana-Lavalle, G.; Galán-Hernández, J.C.; Rosas-Romero, R. Automatic Parkinson disease detection at early stages as a pre-diagnosis tool by using classifiers and a small set of vocal features. Biocybern. Biomed. Eng. 2020, 40, 505–516. [Google Scholar] [CrossRef]
  53. Tuncer, T.; Dogan, S.; Acharya, U.R. Automated detection of Parkinson’s disease using minimum average maximum tree and singular value decomposition method with vowels. Biocybern. Biomed. Eng. 2020, 40, 211–220. [Google Scholar] [CrossRef]
  54. Pah, N.D.; Motin, M.A.; Kempster, P.; Kumar, D.K. Detecting Effect of Levodopa in Parkinson’s Disease Patients Using Sustained Phonemes. IEEE J. Transl. Eng. Health Med. 2021, 9, 1–9. [Google Scholar] [CrossRef]
  55. Laganas, C.; Iakovakis, D.; Hadjidimitriou, S.; Charisis, V.; Dias, S.B.; Bostantzopoulou, S.; Katsarou, Z.; Klingelhoefer, L.; Reichmann, H.; Trivedi, D.; et al. Parkinson’s Disease Detection Based on Running Speech Data From Phone Calls. IEEE Trans. Biomed. Eng. 2022, 69, 1573–1584. [Google Scholar] [CrossRef]
  56. Loh, H.W.; Hong, W.; Ooi, C.P.; Chakraborty, S.; Barua, P.D.; Deo, R.C.; Soar, J.; Palmer, E.E.; Acharya, U.R. Application of Deep Learning Models for Automated Identification of Parkinson’s Disease: A Review (2011–2021). Sensors 2021, 21, 7034. [Google Scholar] [CrossRef]
  57. Xu, Z.; Shen, B.; Tang, Y.; Wu, J.; Wang, J. Deep Clinical Phenotyping of Parkinson’s Disease: Towards a New Era of Research and Clinical Care. Phenomics 2022, 104, 349–361. [Google Scholar] [CrossRef]
  58. Krishna, A.; prakash Sahu, S.; Janghel, R.R.; Singh, B.K. Speech Parameter and Deep Learning Based Approach for the Detection of Parkinson’s Disease. In Computer Networks, Big Data and IoT; Springer: Singapore, 2021; pp. 507–517. [Google Scholar] [CrossRef]
  59. Zhang, X.; Ma, J.; Li, Y.; Wang, P.; Liu, Y. Few-shot learning of Parkinson’s disease speech data with optimal convolution sparse kernel transfer learning. Biomed. Signal Process. Control. 2021, 69, 102850. [Google Scholar] [CrossRef]
  60. Ma, J.; Zhang, Y.; Li, Y.; Zhou, L.; Qin, L.; Zeng, Y.; Wang, P.; Lei, Y. Deep dual-side learning ensemble model for Parkinson speech recognition. Biomed. Signal Process. Control. 2021, 69, 102849. [Google Scholar] [CrossRef]
  61. Ouhmida, A.; Terrada, O.; Raihani, A.; Cherradi, B.; Hamida, S. Voice-Based Deep Learning Medical Diagnosis System for Parkinson’s Disease Prediction. In Proceedings of the 2021 International Congress of Advanced Technology and Engineering (ICOTEN), Virtual, 4–5 July 2021; pp. 1–5. [Google Scholar] [CrossRef]
  62. Hireš, M.; Gazda, M.; Vavrek, L.; Drotár, P. Voice-Specific Augmentations for Parkinson’s Disease Detection Using Deep Convolutional Neural Network. In Proceedings of the 2022 IEEE 20th Jubilee World Symposium on Applied Machine Intelligence and Informatics (SAMI), Poprad, Slovakia, 2–5 March 2022; pp. 213–218. [Google Scholar] [CrossRef]
  63. Wodzinski, M.; Skalski, A.; Hemmerling, D.; Orozco-Arroyave, J.R.; Nöth, E. Deep Learning Approach to Parkinson’s Disease Detection Using Voice Recordings and Convolutional Neural Network Dedicated to Image Classification. In Proceedings of the 2019 41st Annual International Conference of the IEEE Engineering in Medicine and Biology Society (EMBC), Berlin, Germany, 23–27 July 2019; pp. 717–720. [Google Scholar] [CrossRef]
  64. Majda-Zdancewicz, E.; Potulska-Chromik, A.; Jakubowski, J.; Nojszewska, M.; Kostera-Pruszczyk, A. Bull. Pol. Acad. Sci. Tech. Sci. 2021, 69, e137347. [Google Scholar] [CrossRef]
  65. Karaman, O.; Çakın, H.; Alhudhaif, A.; Polat, K. Robust automated Parkinson disease detection based on voice signals with transfer learning. Exp. Syst. Appl. 2021, 178, 115013. [Google Scholar] [CrossRef]
  66. Narendra, N.; Schuller, B.; Alku, P. The Detection of Parkinson’s Disease From Speech Using Voice Source Information. IEEE/ACM Trans. Audio Speech Lang. Process. 2021, 29, 1925–1936. [Google Scholar] [CrossRef]
  67. Anisha, C.; Arulanand, N. Early Prediction of Parkinson’s Disease (PD) Using Ensemble Classifiers. In Proceedings of the 2020 International Conference on Innovative Trends in Information Technology (ICITIIT), Kottayam, India, 13–14 February 2020; pp. 1–6. [Google Scholar] [CrossRef]
  68. Grover, S.; Bhartia, S.; Akshama; Yadav, A.; Seeja, K.R. Predicting Severity Of Parkinson’s Disease Using Deep Learning. Proc. Comp. Sci. 2018, 132, 1788–1794. [Google Scholar] [CrossRef]
  69. Mir, W.A.; Nissar, I.; Izharuddin; Rizvi, D.R.; Masood, S.; Hussain, A. Deep Learning-based model for the detection of Parkinson’s disease using voice data. In Proceedings of the 2022 First International Conference on Artificial Intelligence Trends and Pattern Recognition (ICAITPR), Paris, France, 1–3 June 2022; pp. 1–6. [Google Scholar] [CrossRef]
  70. Rizvi, D.R.; Nissar, I.; Masood, S.; Ahmed, M.; Ahmed, F. An LSTM based Deep learning model for voice-based detection of Parkinsons disease. Int. J. Adv. Sci. Technol. 2020, 29, 337–343. [Google Scholar]
  71. Quan, C.; Ren, K.; Luo, Z. A Deep Learning Based Method for Parkinson’s Disease Detection Using Dynamic Features of Speech. IEEE Access 2021, 9, 10239–10252. [Google Scholar] [CrossRef]
  72. Sharanyaa, S.; Renjith, P.N.; Ramesh, K. Exponential delta-AMS features and optimized deep learning for the classification of Parkinsons disease. Crit. Rev. Biomed. Eng. 2022, 50, 1–28. [Google Scholar] [CrossRef]
  73. Zhang, T.; Zhang, Y.; Sun, H.; Shan, H. Parkinson disease detection using energy direction features based on EMD from voice signal. Biocybern. Biomed. Eng. 2021, 41, 127–141. [Google Scholar] [CrossRef]
  74. Nagasubramanian, G.; Sankayya, M. Multi-Variate vocal data analysis for Detection of Parkinson disease using Deep Learning. Neural Comput. Appl. 2020, 33, 4849–4864. [Google Scholar] [CrossRef]
  75. Marsili, L.; Rizzo, G.; Colosimo, C. Diagnostic Criteria for Parkinson’s Disease: From James Parkinson to the Concept of Prodromal Disease. Front. Neurol. 2018, 9, 156. [Google Scholar] [CrossRef]
  76. Dimauro, G.; Girardi, F. Italian Parkinson’s Voice and Speech. 2019. Available online: https://doi.org/10.21227/AW6B-TG17 (accessed on 1 October 2022).
  77. Dimauro, G.; Di Nicola, V.; Bevilacqua, V.; Caivano, D.; Girardi, F. Assessment of Speech Intelligibility in Parkinson’s Disease Using a Speech-To-Text System. IEEE Access 2017, 5, 22199–22208. [Google Scholar] [CrossRef]
  78. Tougui, I.; Jilbab, A.; Mhamdi, J.E. Machine Learning Smart System for Parkinson Disease Classification Using the Voice as a Biomarker. Healthc. Inform. Res. 2022, 28, 210–221. [Google Scholar] [CrossRef] [PubMed]
  79. Sudo, Y.; Itoyama, K.; Nishida, K.; Nakadai, K. Sound event aware environmental sound segmentation with Mask U-Net. Adv. Robot. 2020, 34, 1280–1290. [Google Scholar] [CrossRef]
  80. Esmaeilpour, M.; Cardinal, P.; Koerich, A.L. From environmental sound representation to robustness of 2D CNN models against adversarial attacks. Appl. Acoust. 2022, 195, 108817. [Google Scholar] [CrossRef]
  81. Kingma, D.P.; Ba, J.L. Adam: A method for stochastic optimization. In Proceedings of the 3rd International Conference on Learning Representations, ICLR 2015—Conference Track Proceedings, San Diego, CA, USA, 7–9 May 2015. [Google Scholar]
  82. Cardillo, G. Clinical Test Performance: The Performance of a Clinical Test Based on the Bayes Theorem. 2016. Available online: http://www.mathworks.com/matlabcentral/fileexchange/12705 (accessed on 1 October 2022).
  83. Clopper, C.J.; Pearson, E.S. The use of confidence or fiducial limits illustrated in the case of the Binomial. Biometrika 1934, 26, 404–413. [Google Scholar] [CrossRef]
  84. Altman, D.; Machin, D.; Bryant, T.; Gardner, M. (Eds.) Statistics with Confidence, 2nd ed.; BMJ Books: London, UK, 2000. [Google Scholar]
  85. Mercaldo, N.D.; Lau, K.F.; Zhou, X.H. Confidence intervals for predictive values with an emphasis to case–control studies. Stat. Med. 2007, 26, 2170–2183. [Google Scholar] [CrossRef]
  86. Matthews, R.A.J. Methods for Assessing the Credibility of Clinical Trial Outcomes. Drug. Inf. J. 2001, 35, 1469–1478. [Google Scholar] [CrossRef]
  87. Kreiman, J.; Gerratt, B.R. Acoustic Analysis and Voice Quality in Parkinson Disease; Springer: Berlin/Heidelberg, Germany, 2020. [Google Scholar] [CrossRef]
  88. Yang, S.; Wang, F.; Yang, L.; Xu, F.; Luo, M.; Chen, X.; Feng, X.; Zou, X. The physical significance of acoustic parameters and its clinical significance of dysarthria in Parkinson’s disease. Sci. Rep. 2020, 10, 11776. [Google Scholar] [CrossRef] [PubMed]
  89. Skrabal, D.; Rusz, J.; Novotny, M.; Sonka, K.; Ruzicka, E.; Dusek, P.; Tykalova, T. Articulatory undershoot of vowels in isolated REM sleep behavior disorder and early Parkinson’s disease. npj Parkinson’s Dis. 2022, 8, 137. [Google Scholar] [CrossRef] [PubMed]
  90. Moro-Velazquez, L.; Gomez-Garcia, J.; Dehak, N.; Godino-Llorente, J.I. New Tools for the Differential Evaluation of Parkinson’s Disease Using Voice and Speech Processing. In Proceedings of the IberSPEECH 2021, Valladolid, Spain, 24–25 March 2021. [Google Scholar] [CrossRef]
  91. Sakar, B.E.; Isenkul, M.E.; Sakar, C.O.; Sertbas, A.; Gurgen, F.; Delil, S.; Apaydin, H.; Kursun, O. Collection and Analysis of a Parkinson Speech Dataset With Multiple Types of Sound Recordings. IEEE J. Biomed. Health Inform. 2013, 17, 828–834. [Google Scholar] [CrossRef]
  92. Sakar, C.O.; Serbes, G.; Gunduz, A.; Tunc, H.C.; Nizam, H.; Sakar, B.E.; Tutuncu, M.; Aydin, T.; Isenkul, M.E.; Apaydin, H. A comparative analysis of speech signal processing algorithms for Parkinson’s disease classification and the use of the tunable Q-factor wavelet transform. Appl. Soft Comput. 2019, 74, 255–263. [Google Scholar] [CrossRef]
  93. Tsanas, A.; Little, M.A.; Fox, C.; Ramig, L.O. Objective Automatic Assessment of Rehabilitative Speech Treatment in Parkinson’s Disease. IEEE Trans. Neural Syst. Rehabil. Eng. 2014, 22, 181–190. [Google Scholar] [CrossRef] [PubMed] [Green Version]
  94. Orozco-Arroyave, J.R.; Arias-Londoño, J.D.; Vargas-Bonilla, J.F.; González-Rátiva, M.C.; Nöth, E. New Spanish speech corpus database for the analysis of people suffering from Parkinson’s disease. In Proceedings of the Ninth International Conference on Language Resources and Evaluation (LREC’14), European Language Resources Association (ELRA). Reykjavik, Iceland, 26–31 May 2014; pp. 342–347. [Google Scholar]
  95. Li, J.; Jin, M.; Wang, L.; Qin, B.; Wang, K. MDS clinical diagnostic criteria for Parkinson’s disease in China. J. Neurol. 2016, 264, 476–481. [Google Scholar] [CrossRef]
  96. Berg, D.; Adler, C.H.; Bloem, B.R.; Chan, P.; Gasser, T.; Goetz, C.G.; Halliday, G.; Lang, A.E.; Lewis, S.; Li, Y.; et al. Movement disorder society criteria for clinically established early Parkinson’s disease. Mov. Disord. 2018, 33, 1643–1646. [Google Scholar] [CrossRef]
  97. Heinzel, S.; Berg, D.; Gasser, T.; Chen, H.; Yao, C.; Postuma, R.B. Update of the MDS research criteria for prodromal Parkinson’s disease. Mov. Disord. 2019, 34, 1464–1470. [Google Scholar] [CrossRef]
  98. Godino-Llorente, J.I. (Ed.) Automatic Assessment of Parkinsonian Speech; Springer International Publishing: Berlin/Heidelberg, Germany, 2020. [Google Scholar] [CrossRef]
  99. Logemann, J.A.; Fisher, H.B.; Boshes, B.; Blonsky, E.R. Frequency and Cooccurrence of Vocal Tract Dysfunctions in the Speech of a Large Sample of Parkinson Patients. J. Speech Heari. Disord. 1978, 43, 47–57. [Google Scholar] [CrossRef]
Figure 1. Implementation flow.
Applsci 12 11601 g001
Figure 2. Process sequence diagram (Symbol ’X’ depicts the end of the sequence).
Applsci 12 11601 g002
Figure 3. Architecture of the U-lossian network classifier.
Applsci 12 11601 g003
Figure 4. Precision-recall curve and receiver operating curve (ItalianPVS dataset).
Applsci 12 11601 g004
Figure 5. Confusion matrix (ItalianPVS dataset).
Applsci 12 11601 g005
Figure 6. Precision-recall curve and receiver operating curve (Lithuanian voice dataset).
Applsci 12 11601 g006
Figure 7. Confusion matrix (Lithuanian voice dataset).
Applsci 12 11601 g007
Figure 8. Alluvial plot of the classification results: (a) ItalianPVS dataset, and (b) Lithuanian voice dataset.
Applsci 12 11601 g008
Figure 9. Sensitivity-specificity plot of (a) the ItalianPVS dataset and (b) the Lithuanian voice dataset.
Applsci 12 11601 g009
Figure 10. Time performance of the proposed network model on the ItalianPVS and Lithuanian voice datasets.
Applsci 12 11601 g010
Figure 11. Summary of the performance measures.
Applsci 12 11601 g011
Table 1. Hyper-parameters of the U-lossian network.
ParameterValue
initial learning rate 1 × 10 3
min learning rate 1 × 10 7
schedulercosine annealing with warm restarts—200 epochs
batch size8
optimizerAdamW
Table 2. Size of the U-lossian model.
ParameterValue
Total params:11,692,525
Trainable params:11,692,525
Non-trainable params:0
Model size (params + buffers):44.65 Mb
Framework and CUDA overhead:1942.21 Mb
Total RAM usage:1986.86 Mb
Floating Point Operations on forward:1.70 GFLOPs
Multiply-Accumulations on forward:850.23 MMACs
Direct memory accesses on forward:863.85 MDMAs
Table 3. Summary of the performance results.
ParameterValue (Confidence Range) Italian DatasetValue (Confidence Range) Lithuanian Dataset
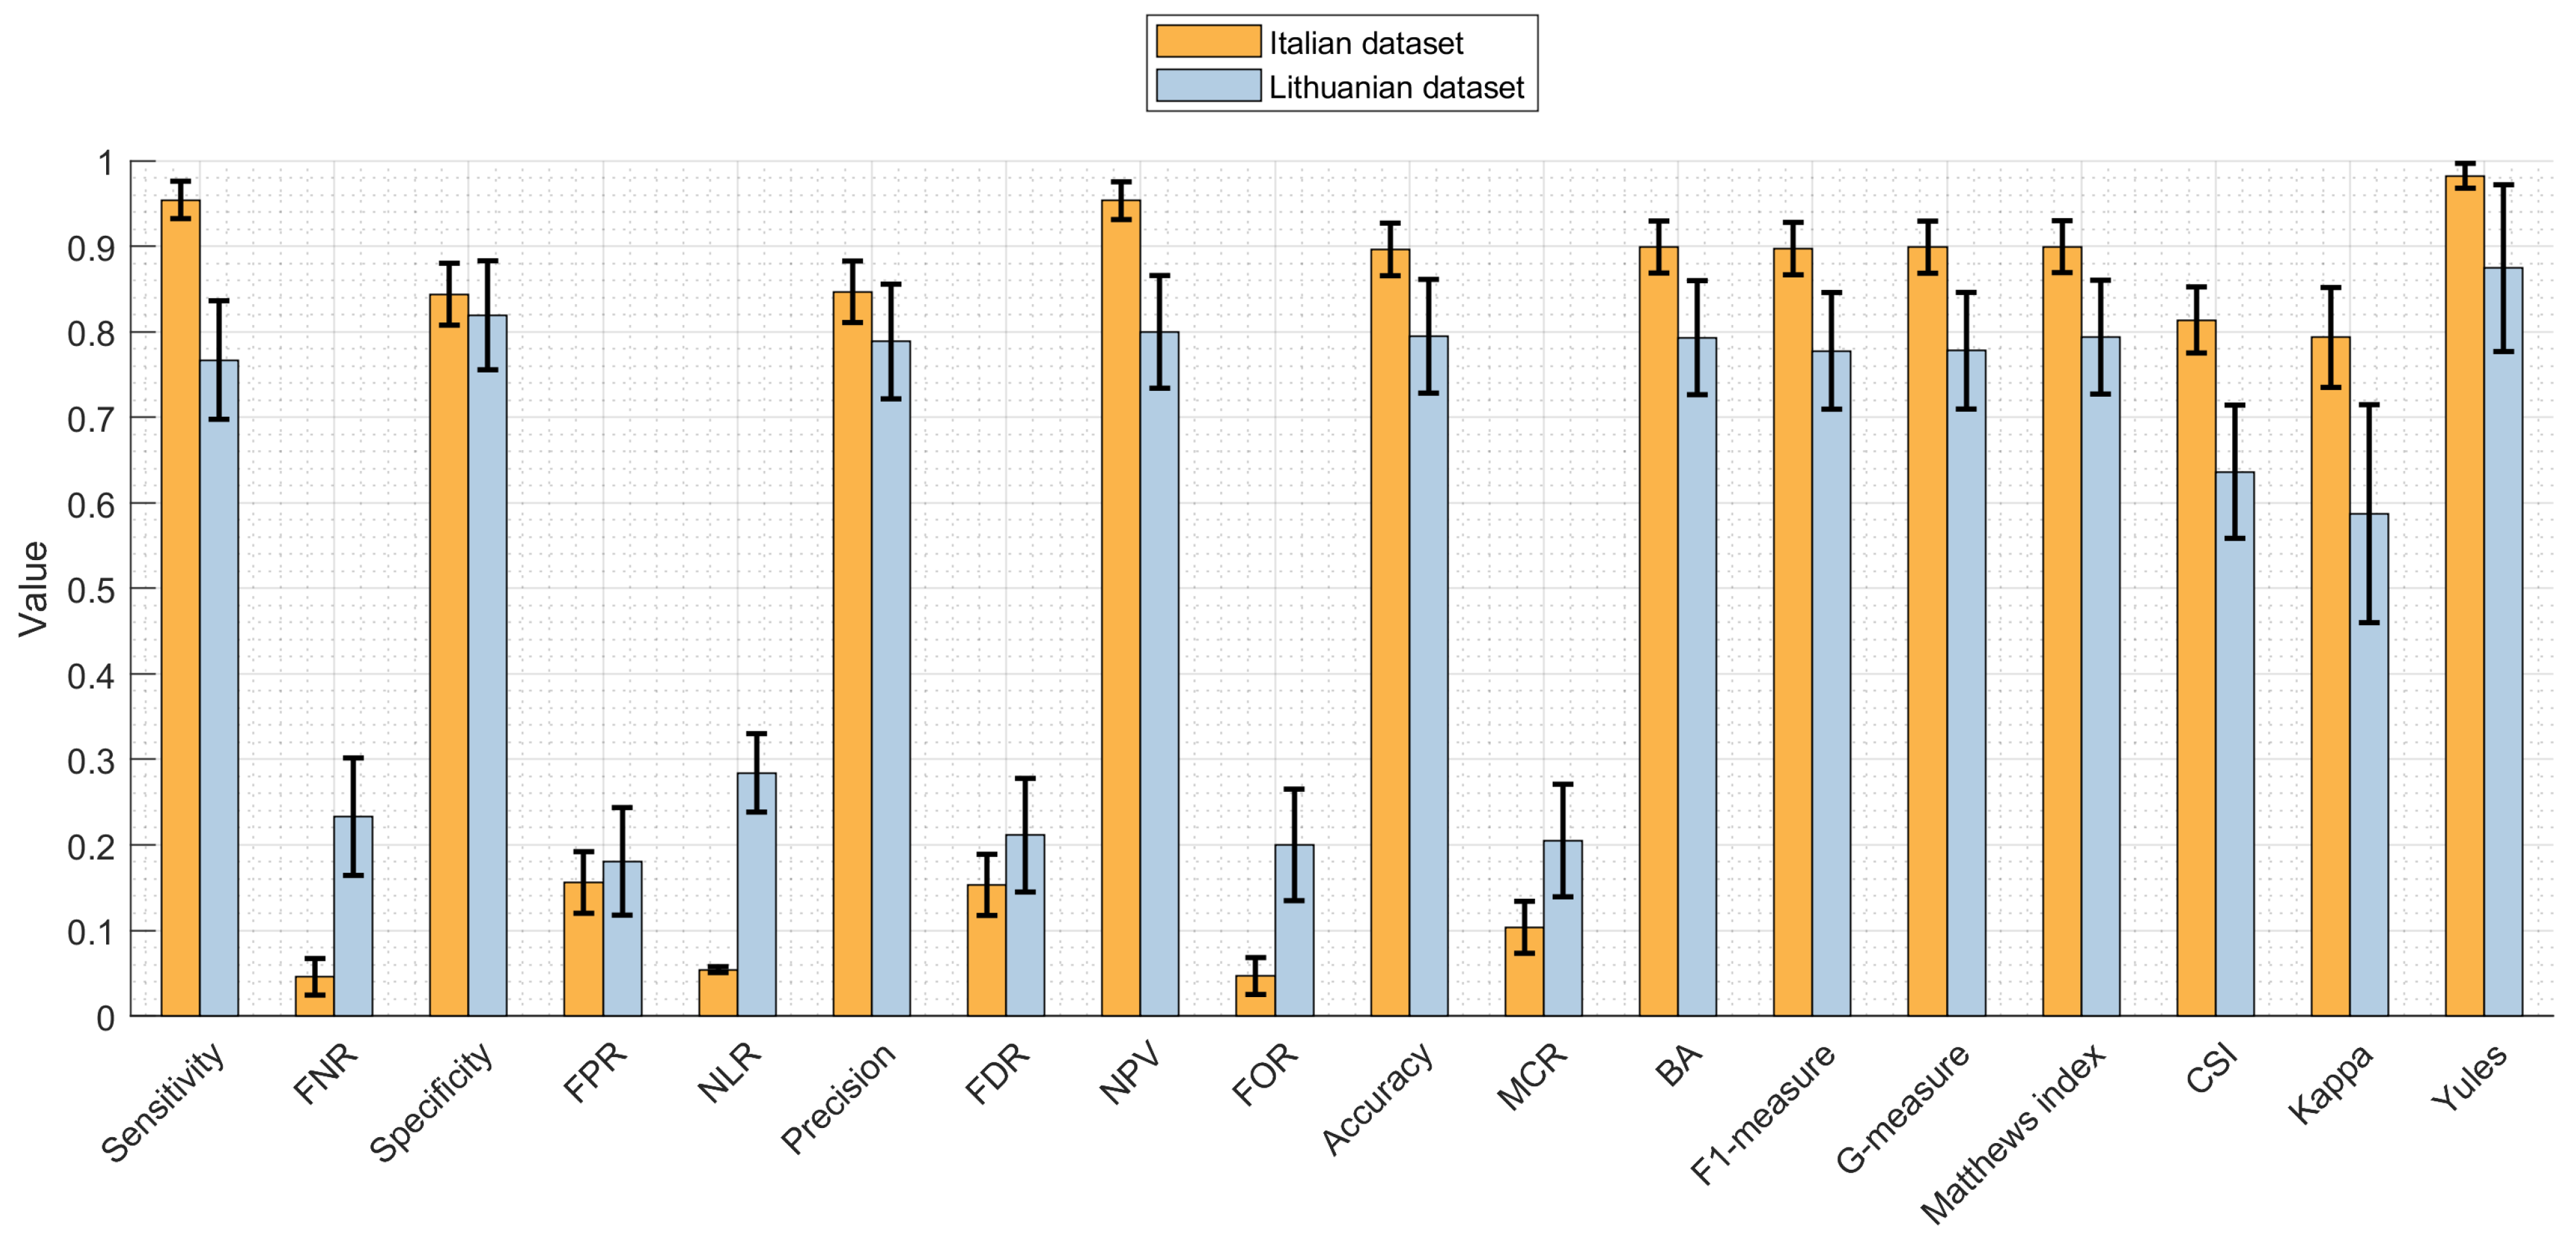
Sensitivity0.9543 (0.9283–0.9720)0.7671 (0.6914–0.8300)
False Negative rate (FNR)0.0457 (0.0285–0.0712)0.2329 (0.1706–0.3080)
Specificity0.8440 (0.8047–0.8771)0.8193 (0.7479–0.8753)
False Positive rate (FPR)0.1560 (0.1231–0.1951)0.1807 (0.1255–0.2513)
Positive Likelihood Ratio (PLR)6.1188 (5.7392–6.5236)4.2447 (3.6150–4.9842)
Negative Likelihood Ratio (NLR)0.0541 (0.0508–0.0577)0.2842 (0.2421–0.3338)
Precision0.8468 (0.8077–0.8796)0.7887 (0.7147–0.8489)
False discovery rate (FDR)0.1532 (0.1206–0.1921)0.2113 (0.1518–0.2847)
Negative Predictive Value (NPV)0.9534 (0.9272–0.9713)0.8000 (0.7269–0.8587)
False omission rate (FOR)0.0466 (0.0292–0.0724)0.2000 (0.1420–0.2724)
Accuracy0.8964 (0.8620–0.9235)0.7949 (0.7213–0.8543)
Mis-classification Rate (MCR)0.1036 (0.0768–0.1377)0.2051 (0.1464–0.2780)
Balanced Accuracy (BA)0.8992 (0.8651–0.9259)0.7932 (0.7195–0.8528)
F1-measure0.8974 (0.8631–0.9244)0.7778 (0.7029–0.8393)
G-measure (Fowlkes–Mallows index)0.8990 (0.8649–0.9258)0.7779 (0.7029–0.8394)
Matthews index:0.8996 (0.8656–0.9263)0.7938 (0.7201–0.8533)
Critical success index (CSI)0.8139 (0.7723–0.8496)0.6364 (0.5552–0.7110)
Cohen’s Kappa0.7935 (0.7351–0.8519)0.5874 (0.4599–0.7148)
Yule’s coefficient0.9825 (0.9628–0.9918)0.8745 (0.7453–0.9404)
Critical Diagnostic Odds Ratio (DOR)1.13261.2643
Discriminant Power2.60661.4906
Table 4. Comparison of different methods of PD voice analysis.
MethodAccuracyDataset (Language, Availability)
Sparse kernel transfer learning [59]86.72%UCI repository v.2013 (English, open on request) [91]
Linear DL network [68]81.67%Telemonitoring voice dataset (Unspecified, closed)
Linear DL network + mRMR feature selection [69]99.1%UCI repository v.2019 (English, open on request) [92]
Ensemble classifier [67]94.12%UCI repository v.2019 (English, open on request) [92]
Dual-side learning ensemble [60]98.41%LSVT voice rehabilitation dataset [93]
LSTM [70]97.12%UCI repository v.2013 (English, open on request) [91]
1D CNN [58]87.76%UCI repository v.2013 (English, open on request) [91]
ADCNN [74]98.11%UCI repository v.2013 (English, open on request) [91]
Bidirectional LSTM [71]75.56%GYENNO SCIENCE Parkinson Disease Research Center dataset (Chinese, closed)
LSTM with SSWA-based attention [72]92.5%Proprietary (Indian, closed)
ResNet18 [63]91.7%PC-GITA database (Spanish, open) [94]
Alexnet [64]91.7%Dataset of Department of Neurology at the Medical University of Warsaw (Polish, closed)
DenseNet161 [65]89.75%mPower PD dataset (English, open) [34]
CNN-ANN [61]93.10%Max Little dataset (English, open)
Ensemble CNN [62]97.3%PC-GITA database (Spanish, open) [94]
CNN with IAIF and QCP [66]97.3%PC-GITA database (Spanish, open) [94]
EDF-EMD [73]92.59%Dataset-CPPDD (Chinese, closed)
Hybrid U-lossian network (our approach)89.64%LSMU Lithuanian dataset (Lithuanian, open on request)
Publisher’s Note: MDPI stays neutral with regard to jurisdictional claims in published maps and institutional affiliations.

