Featured Application
Few studies have examined the efficacy of masks in preventing the effects of ionic components of air pollution on health. The results of this study should serve as a base for future research.
Abstract
Mask wearing can protect health care workers. However, its efficacy in avoiding the health effects of air pollution is not well studied. Recently, we evaluated the relationship between air pollution and health status or peak expiratory flow rate (PEFR). At the beginning of that study, about 20% of people were wearing masks. However, in the same period one year later, most people were wearing masks because of the COVID-19 pandemic. Therefore, in this study, we examined the relationship between mask wearing, concentration of ionic components of PM2.5, respiratory symptoms, and PEFR. Seventy-two patients in Fukuoka City with asthma and allergic diseases measured PEFR daily and recorded respiratory symptoms and mask wearing in a diary. We measured the ionic components of PM2.5 in Fukuoka City and examined the relationships between patient measurements, mask wearing, and air pollution. Univariate analysis showed that, in 2020, but not in 2021, some ionic components of PM2.5, i.e., Cl−, NO3−, Na+, and Mg2+, were significantly correlated with the frequency of cough and nasal symptoms and a decrease in PEFR. Some ionic components of PM2.5 may increase the frequency of respiratory symptoms and decrease PEFR in patients with allergic diseases; however, this tendency is not seen when masks are used. The use of masks may be one of the factors that attenuate the effects of PM2.5 ionic components.
1. Introduction
In the past, we conducted a questionnaire to ask the families of allergic patients what measures they would take when air pollution was severe. At that time, the most common response was to wear a mask (data not shown). Masks are easily used, but not often. Wearing a mask can help to prevent transmission of airborne diseases in clinical settings. As in the following report, there are reports that masks are effective, but, there are also reports that there is a lot of controversy about them [1]. Airborne simulation experiments showed that cotton masks, surgical masks, and N95 masks provide some protection from the transmission of infective SARS-CoV-2 droplets/aerosols; however, medical masks (surgical masks and even N95 masks) could not completely block the transmission of virus droplets/aerosols, even when sealed [2]. Other meta-analyses suggest an association between face mask use and reductions in COVID-19. Of course, these authors also stated that the method of spreading the infection is not easy, but the result is that it is effective in preventing infection [3]. However, there are not many clinical studies in actual clinical settings. Regarding viral infection, complicated factors such as the properties of the virus, the state of droplets, and the state of patients and healthy subjects are involved [4]. There are many reports that the use of masks is recommended as they protect against infection even with these conditions.
Recently, we studied the relationship between the ionic components of PM2.5 and health status and PEFR. During this study, participants experienced health effects on days with high pollution levels. Since February 2020, approximately 20% to 30% of study participants started wearing masks owing to the COVID-19 pandemic, and patients who wore masks began to notice fewer respiratory symptoms. There are not many reports that have clinically examined the effects of masks on the ionic components of PM2.5. We hypothesized that mask use would reduce the adverse health effects of the studied air pollutants on respiratory symptoms and their PEFR.
The aim of this study was to clarify the effect of mask wearing in patients with asthma and allergic diseases on the relationship between the ionic components of PM2.5 and respiratory symptoms or PEFR.
2. Materials and Methods
This study was performed by a research group of the Ministry of the Environment (led by Kanazawa University) as part of joint research with Professor Hiroyuki Nakamura.
2.1. Study Design
This was a prospective observational study. From 1 February to 30 April 2020, and from 1 February to 30 April 2021, we recorded daily concentrations of ionic components of PM2.5 and patients recorded airway symptoms, PEFR, and mask use. Then, we compared data between the two time periods.
For 2020 and 2021, we calculated correlations between daily measured concentrations of ionic components of PM2.5; coughing and nasal symptoms; and daily mean, morning, and evening PEFR values. Then, we examined whether the relationships between the variables were different in the two periods.
2.2. Subjects
Patients with asthma and allergic diseases were recruited from outpatients at National Hospital Organization Fukuoka National Hospital (Fukuoka Hospital), Fukuoka, Japan, from 1 February to 30 April 2020 and from 1 February to 30 April 2021; the number of measurement days was 90 in 2020 and 89 in 2021, because 2020 was a leap year.
The subjects were outpatient allergy patients who were randomly asked for cooperation and consent was obtained.
Patients were asked to measure PEFR three times with a Mini-Wright PEFR meter (Clement Clark International, London, UK) at the same time each morning and evening and to record the highest of the three measurements in a diary. Once patients had confirmed that they would participate in the study, a specialist nurse explained the PEFR measurement method and instructed patients on the use of the PEFR meter until they could perform the measurement well. The nurse also explained how to store and clean the PEFR meter. In addition, patients were asked to also record their symptoms in their diary. At the time of outpatient visits, a nurse confirmed whether the symptoms were being correctly recorded. In the case of pediatric patients, measurements and diary entries were performed by a legal guardian. At the same time, subjects were asked to record their daily mask use in the diary by answering the question “Did you use a mask?” with “yes” or “no”.
If the subjects and their families contracted infectious diseases including coronavirus, they were also asked to write it in the diary, and that day was excluded when counting the diary. When the subject went on a trip or participated in an event such as an athletic meet, the subject was asked to write in a diary. Days with such special circumstances were excluded from the tally.
This time, the subject age range is wide, but it is considered difficult to judge whether or not certain conditions and standards can be met in actual life by separating them by age. Therefore, this time, those who agreed to participate without setting restrictions were included.
2.3. Components of PM2.5
Levels of ionic components of PM2.5 were collected daily by the high volume air sampler HV-RV080130-1203 (Shibata Scientific Technology Ltd., Tokyo, Japan) located on the roof of the Fukuoka Hospital. The sampler sheet was changed daily at 10:00 am by a trained inspection engineer and sent to the National Institute for Environmental Studies every 2 weeks for measurement of the ionic component.
The city of Fukuoka is surrounded by mountains and has a fan-shaped opening towards the sea, and Fukuoka Hospital is at the heart of that fan. Thus, Fukuoka Hospital is said to be in a good location for measuring the air quality because the wind from the sea causes the air in the city to gather towards the mountains, where the hospital is located.
The residence of the subjects in this study was within 10 km even for the farthest person from the measurement point.
This report presents the data acquired from 1 February through to 30 April in each year of the study because the PM2.5 concentration is reported to be relatively high during this period in Japan [5].
2.4. Respiratory Symptoms
Daily prevalence of respiratory symptoms was investigated for coughing and nasal symptoms (runny nose, stuffy nose, sneezing) and PEFR was assessed as the ratio of PEFR at the time of measurement to the personal best PEFR in these periods. The morning (pbPEFRm), evening (pbPEFRe), and mean (pbPEFR) ratios to the personal best PEFR in the study period were calculated with the following formula:
Ratio of personal bestPEFR/pbPEFR = morning, evening, or mean daily PEFR/personal best PEFR (in this study period).
2.5. Statistical Analysis
Statistical analysis was performed with R-3.6.1 (The Foundation for Statistical Computing, Vienna, Austria). The Mann–Whitney U test was used to compare ion concentrations and mask use in 2020 and 2021. Univariate linear regression was used to assess the co-relationships between each ionic component and symptoms with Spearman’s test.
Variables with a skewed distribution were analyzed after logarithmic transformation.
A p-value of less than 0.05 (two tailed) was considered to indicate a statistically significant difference.
3. Results
3.1. Subjects
From February 1 through to April 30, we recruited a total of 72 patients (male, 38; female, 34; mean age, 16.0 ± 14.9 years; median age, 10 years; range, 2–74 years) for the study.
Participants had been diagnosed with the following allergic diseases: asthma (n = 65), atopic dermatitis (n = 29), allergic rhinitis (n = 47), allergic conjunctivitis (n = 4), and sinusitis (n = 7).
3.2. Mask Use
Although participants were asked to record mask use as “yes” or “no”, some wrote only “yes” and others wrote only “no”, and some data were missing. Therefore, to ensure the accuracy of this study, we also asked the participants about their mask use at study visits and excluded those who did not appear to give reliable answers. As shown in Table 1, the mean percentage of patients wearing a mask was higher in 2021 than in 2020. Statistical analysis showed that the difference in mask use was significant (Figure 1).

Table 1.
Participant mask use in 2020 and 2021.
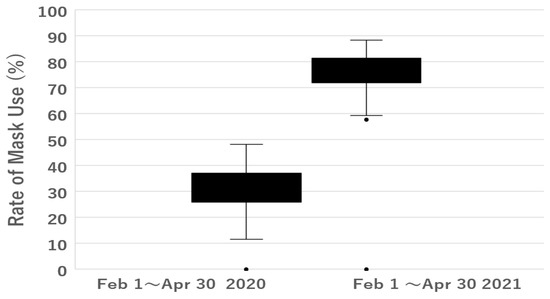
Figure 1.
Rate of mask use.
The mean percentage of patients wearing a mask (Mask+) was higher in 2021 than in 2020. Statistical analysis showed that the difference in mask use was significant (Mann–Whitney U-test, two-tail p = 9.4 × 10⁻¹¹).
Mask+: wearing a mask, Mask-: wearing no mask, SD: standard deviation.
The mean percentage of patients wearing a mask was higher in 2021 than in 2020 and was statistically significant (Mann–Whitney U-test, two-tail p = 9.4 × 10⁻¹¹).
Concentrations of the ionic components of PM2.5 in the two study periods are shown in Table 2. Concentrations of Cl− and Mg2+ were significantly higher in 2021 than in 2020 and the concentration of Ca2+ was significantly lower.
Table 2.
Comparison of concentrations of ionic components of PM2.5 in 2020 and 2021.
The concentrations of ionic components of PM2.5 from 1 February to 30 April in 2020 and 2021 are shown. Cl− and Mg2+ concentrations were significantly higher in 2021 than in 2020 and Ca2+ concentrations were significantly lower. There was no significant difference for other ions.
Because one of the aims of the study was to investigate the effect of mask use, we decided to examine ions in PM2.5 that showed a significant increase or no change in concentration from 2020 to 2021, i.e., we examined NO3−, SO42−, Na+, K+, and Mg2+.
Table 3 shows the correlation coefficients between each component and the daily prevalence of respiratory symptoms or the daily mean pbPEFR, pbPEFRm, and pbPEFRe by univariate analysis in 2020 and 2021.
Table 3.
Correlation coefficients between each ionic component and the daily prevalence of respiratory symptoms or pbPEFR, pbPEFRm, and pbPEFRe in 2020 and 2021, as assessed by univariate analysis.
As shown in Table 2 and Table 3, the concentrations of Cl− and Mg2+ increased significantly from 2020 to 2021. Cl− was significantly correlated with a stuffy nose in 2020. However, although its concentration was significantly higher in 2021, it was no longer significantly correlated with this symptom in 2021 (Table 3). The concentration of Mg2+ in 2021 was significantly correlated with a stuffy nose. As for coughing, Mg2+ showed a significant negative correlation with the symptom in 2020 and a significant positive correlation in 2021. Mg2+ was negatively correlated with pbPEFR, pbPEFRm, and pbPEFRe in 2020 and positively correlated with all three variables in 2021, but without statistically significant correlations.
Regarding the ions whose concentration did not change significantly from 2020 to 2021, NO3 showed a significant correlation with runny nose and sneezing in 2020, but not in 2021. In addition, the ion was not significantly correlated with pbPEFR in 2020, but significantly positively correlated with it in 2021. Although no significant correlations were found between NO3 and pbPEFRm or pbPEFRe, both correlation coefficients were negative in 2020 and positive in 2021.
As for Na⁺, it was significantly negatively correlated with coughing in 2020 and significantly positively correlated with a runny nose in 2021. In addition, we found a significant positive correlation with pbPEFR in 2021.
SO4− and K+ were not associated with symptoms or PEFR in 2020 or 2021.
As a typical example, a scatter plot of the relationship between NO3− and a runny nose is shown in Figure 2 and that between Mg2+ and pbPEFR is shown in Figure 3.
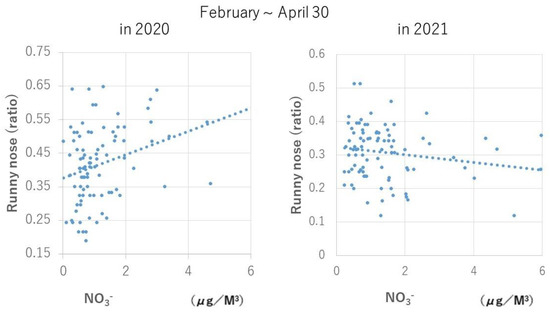
Figure 2.
Relationship between daily NO3− concentration and frequency of runny nose symptoms. On that day, NO3− concentration was significantly positively correlated with a runny nose in 2020 (1 February–30 April; number of days, 90; rs = 0.3150; p = 0.0025), when the rate of mask use was 31.3%, but was no longer correlated with the symptom in 2021 (1 February–30 April; number of days, 89; rs = 0.1520, p = 0.1549), when the rate of mask use was 76.7%.
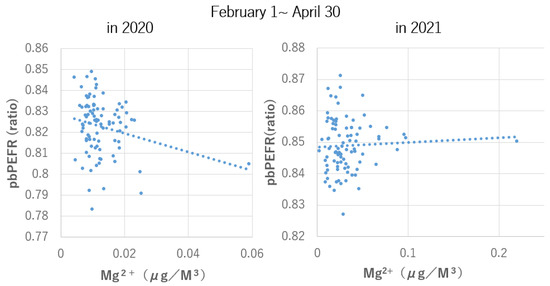
Figure 3.
Relationship between daily Mg2+ concentration and daily average of the ratio of peak expiratory flow rate to personal best peak expiratory flow rate on that day.
In both cases, the correlation trend observed from February to April 2020, when the mask wearing rate was 31.3%, was no longer observed during the same period in 2021, when the mask wearing rate was 76.7%. It is highly likely that mask use is one of the factors behind this change, and further investigation is desired in the future.
There was a tendency for a positive correlation (1 February–30 April; number of days, 90, rs = - 0.2044, p = 0.0533) in 2020 when the rate of mask use was 31.3%, but the relationship disappeared (1 February–30 April; number of days, 89, rs = 0.0408, p = 0.7040) in 2021 when the rate of mask use was 76.7%.
4. Discussion
As the mask usage rate was significantly higher from February to April 2021 compared with the same period in 2020, we investigated whether the relationship between PM2.5 ionic components and respiratory symptoms and PEFR also differs between these two periods.
The main finding of the study was that, on days when the concentration of ionic components of PM2.5 increased, the proportion of participants who showed allergic symptoms also increased. Furthermore, a higher proportion of participants showed a decrease in the pbPEFR value in 2020, but not in 2021. The results showed a trend towards less exacerbation of airway symptoms and less decline in pbPEFR in 2021 compared with 2020 (Table 3), especially in NO3− (Table 3), although the differences were not significant in many other ions. In 2020, Na+ had respiratory protective effects, including cough suppression (5), which had diminished in 2021. Therefore, it was presumed that the use of a mask might attenuate the effects of ionic components, both attenuating and enhancing the symptoms and pulmonary function.
To confirm the differences between the same seasons in these two years, we first compared the concentration of air pollutants as an influencing factor. Among the examined ions, Cl− and Mg2+ levels were significantly higher in 2021 than in 2020 and Ca2+ levels were significantly lower, but otherwise, no significant differences were found.
In 2018, when asked, “What is an effective preventive measure when air pollution is severe?”, many people of all ages answered “masks” (data not shown). In Japan, there was a shortage of masks from the end of March to April, so the government decided to distribute cloth masks. In addition, the price of paper masks began to rise in December 2019 and reached its highest price on 20 June 2020; then, the price started to decrease, so the shortage is assumed to have ended in June 2020 in Japan. Once masks became available, Japanese people started using them quite regularly.
One of the limitations of this study is the small number of subjects. To obtain more accurate results, we did not include participants for whom data on mask use were deemed unreliable. With this approach, we believe the data we obtain on mask use are pretty accurate, especially when it comes to 2021.
Another limitation of the study is that there may be background factors other than masks that explain the differences between 2020 and 2021. For example, the ion concentration in 2021 may have been lower than in 2020, so the concentrations of ions may have had less impact; however, that was not the case. On the other hand, even if the concentration of ions was higher in 2021 than in 2020, e.g., Cl−, no associated effect was seen on symptoms and PEFR. In addition, a significant increase in Mg2+ was seen in 2021 compared with 2020, and although the effect on nasal symptoms was attenuated, it still remained. As for Na+, it appeared to rather protect against nasal symptoms over a longer period [6]. In addition, it is necessary to conduct a detailed study of how to use the mask and the type of mask, but it is possible that a certain conclusion has been reached from the perspective of the possibility of the impact in actual daily life. Needless to say, further investigations are expected in the future.
The strength of this study is that it was previously difficult to conduct research on the effects of mask use by the general public in actual clinical practice, but the spread of COVID-19 made such research possible. We believe that our findings will be useful in clinical practice in the future.
Regarding PEFR, the PEFR metrics used in this study are slightly different from the commonly used metric %PEFR, and they have not been used often in the past. However, they may be more useful than %PEFR for studying changes in individuals with different background factors, such as those with respiratory diseases and children. We have already reported elsewhere on their use and the fact that they are useful [7,8].
This study found some associations between mask use and the effects of ionic components of PM2.5. However, because the data on mask use were not reliable for all participants, future studies need to accurately record who wore masks and who did not.
As to the effectiveness of the mask, there is some debate as to whether or not masks allow pollutants to pass through. Nevertheless, masks do prevent substances from entering the respiratory tract [9,10].
Investigating this topic requires a lot of basic research on air pollutants.
We have published other articles on PM2.5 [11,12,13,14,15]. Previously, we have not investigated the relationships between mask use and PM2.5, but the present study shows that masks may have a certain degree of effectiveness in decreasing the effects of air pollution on respiratory symptoms and PEFR. Future studies may need to consider the use of masks and whether they prevent the effects of ionic components of PM2.5. The prevalence of mask use may also need to be taken into account when interpreting findings of future studies on the effects of air pollutants, given the increased use of masks in the last few years because of the coronavirus epidemic.
5. Conclusions
We investigated the health effects of the ionic components of PM2.5 during the same period in 2020 and 2021. In 2021, compared with 2020, the health effects of PM2.5 ion components were reduced. The average concentration of eight ionic components increased in two for 2 years, remained unchanged in four, and decreased in one, and the effect of concentration changes was difficult to consider. Mask usage increased from 31% to 77%. The use of masks may be one of the factors that attenuate the effects of PM2.5 ionic components.
Author Contributions
Conceptualization, H.O. and H.M.; methodology, H.O., H.M., Y.A., K.K., Y.M., A.Y., A.T., K.H., A.H. and H.N.; software, H.O. and H.M.; validation, H.O., A.Y. and A.T.; formal analysis, H.O., H.M., Y.A., K.K. and Y.M.; investigation, H.O., H.M., K.K., A.Y. and A.T.; resources, H.O., H.M., A.Y. and A.T.; data curation, H.O., H.M., Y.A., K.K. and Y.M.; writing—original draft preparation, H.O. and H.M.; writing—review and editing, H.O., H.M., Y.A., K.K., Y.M., A.Y., A.T., K.H., A.H. and H.N.; visualization, H.O. and H.M.; supervision, H.O.; project administration, H.N., K.H., A.T. and H.O.; funding acquisition, H.N., K.H., A.T. and H.O. All authors have read and agreed to the published version of the manuscript.
Funding
This research was funded by the Environment Research and Technology Development Fund (JPMEERF20195051, JPMEERF20202003, JPMEERF20225M02) of the Environmental Restoration and Conservation Agency of Japan.
Institutional Review Board Statement
The study was conducted in accordance with the Declaration of Helsinki and approved by the Institutional Ethics Committee of National Hospital Organization Fukuoka National Hospital (protocol code F31-03 and date of approval 15 May 2019).
Informed Consent Statement
Informed assent or consent was obtained from all subjects involved in the study or their legal guardians. Written informed consent to publish this article was obtained from the patients or their legal guardians.
Data Availability Statement
The data presented in this study are available upon request from the corresponding author. The data are not publicly available because of privacy concerns.
Acknowledgments
We would like to thank Makiko Oda and Nobuko Takeyama for collecting samples of air pollutants every day. In addition, we thank the following doctors in our hospital for recruiting the subjects: Masatoshi Wakatsuki, Toshiaki Kawano, Koki Okabe, Mihoko Iwata, Naohiko Taba, Chikako Motomura, and Satoshi Honjo. We also thank the researchers at the Japan Environmental Research Institute and Kanazawa University for their involvement in this project. In addition, we would also like to thank the children and their caregivers and the adult participants for their cooperation in completing the diary. Finally, we thank Misako Yamamoto and other secretaries for organizing the data.
Conflicts of Interest
The authors declare no conflict of interest. The funders had no role in the design of the study; in the collection, analyses, or interpretation of data; in the writing of the manuscript; or in the decision to publish the results.
References
- Ju, J.T.I.; Boisvert, L.N.; Zuo, Y.Y. Face masks against COVID-19: Standards, efficacy, testing and decontamination meth ods. Adv. Colloid Interface Sci. 2021, 292, 102435. [Google Scholar] [CrossRef]
- Ueki, H.; Furusawa, Y.; Iwatsuki-Horimoto, K.; Imai Kabata, H.; Nishimura, H.; Kawaokacorresponding, Y. Effectiveness of Face Masks in Preventing Airborne Transmission of SARS, CoV-2. mSphere 2020, 5, e00637-20. [Google Scholar] [CrossRef]
- Tabatabaeizadeh, S.A. Airborne transmission of COVID-19 and the role of face mask to prevent it: A systematic re view and meta-analysis. Eur. J. Med. Res. 2021, 26, 1. [Google Scholar] [CrossRef]
- Li, Y.; Liang, M.; Gao, L.; Ayaz Ahmed, M.; Uy, J.P.; Cheng, C.; Zhou, Q.; Sun, C. Face masks to prevent transmission of COVID-19: A systematic review and meta-analysis. Am. J. Infect. Control 2021, 49, 900–906. [Google Scholar] [CrossRef] [PubMed]
- Environmental Health Department, Japanese Ministry of the Environment. Report of Environmental Health Surveillance Related to Air Pollution; Japanese Ministry of the Environment: Tokyo, Japan, 2018; pp. 95–111. [Google Scholar]
- Odajima, H.; Matsuzaki, H.; Akamine, Y.; Kojima, K.; Murakami, Y.; Yoshino, A.; Takami, A.; Hayakawa, K.; Hara, A.; Nakamura, H. The ionic component of PM2.5 may be associated with respira-tory symptoms and peak expiratory flow rate. Appl. Sci. 2022, 12, 10082. [Google Scholar] [CrossRef]
- Nakamura, T.; Nishiwaki, Y.; Hashimoto, K.; Takeuchi, A.; Kitajima, T.; Komori, K.; Tashiro, K.; Hasunuma, H.; Ueda, K.; Shimizu, A.; et al. Association between Asian dust exposure and respiratory function in children with bronchial asthma in Nagasaki Prefecture, Japan. Environ. Health Prev. Med. 2020, 25, 8. [Google Scholar] [CrossRef] [PubMed]
- Hasunuma, H.; Takeuchi, A.; Ono, R.; Amimoto, Y.; Hwang, Y.H.; Uno, I.; Shimizu, A.; Nishiwaki, Y.; Hashizume, M.; Askew, D.J.; et al. Effect of Asian dust on respiratory symptoms among children with and without asthma, and their sensitivity. Sci. Total Environ. 2021, 753, 141585. [Google Scholar] [CrossRef] [PubMed]
- Dugré, N.; Ton, J.; Perry, D.; Garrison, S.; Falk, J.; McCormack, J.; Moe, S.; Korownyk, C.S.; Lindblad, A.J.; Kolber, M.R.; et al. Masks for prevention of viral respiratory infections among health care workers and the public: PEER umbrella systematic review. Can. Fam. Physician 2020, 66, 509–517. [Google Scholar] [PubMed]
- Rengasamy, S.; Eimer, B.; Shaffer, R.E. Simple respiratory protection--evaluation of the filtration performance of cloth masks and common fabric materials against 20-1000 nm size particles. Ann. Occup. Hyg. 2010, 54, 789–798. [Google Scholar] [CrossRef] [PubMed]
- Odajima, H.; Hirose, T.; Nishima, S. Air pollution (NO2, suspended particulate material) and the number of acute hos-pitalization of patients with asthmatic attack. Jpn. J. Allergol. 1995, 44, 160–190. [Google Scholar]
- Odajima, H.; Yamazaki, S.; Nitta, H. Decline in peak expiratory flow accord ing to hourly short-term concentration of particulate matter in asthmatic children. Inhal. Toxicol. 2008, 20, 1–10. [Google Scholar] [CrossRef] [PubMed]
- Hasunuma, H.; Yamazaki, S.; Tamaru, K.; Hwang, Y.H.; Ono, R.; Amimoto, Y.; Askew, D.J.; Odajima, H. Association between daily ambient air pollution and respiratory symptoms in children with asthma and healthy children in western Japan. J. Asthma 2017, 54, 1–8. [Google Scholar] [CrossRef] [PubMed]
- Ueda, K.; Nitta, H.; Odajima, H. The effects of weather, air pollutants, and Asian dust on hospitalization for asthma in Fukuoka. Environ. Health Prev. Med. 2010, 15, 350–357. [Google Scholar] [CrossRef] [PubMed]
- Odajima, H.; Kawano, T.; Wakatsuki, M.; Akaminea, Y.; Okabe, K.; Oki, T.; Matsuzaki, H.; Murakami, Y.; Iwata, M.; Taba, N.; et al. Annual changes in the prevalence of asthma may be related to air pollution in Fukuoka: 29 years of observation. ERS Open Res. 2020, 6, 00166–2020. [Google Scholar] [CrossRef] [PubMed]


Publisher’s Note: MDPI stays neutral with regard to jurisdictional claims in published maps and institutional affiliations. |
© 2022 by the authors. Licensee MDPI, Basel, Switzerland. This article is an open access article distributed under the terms and conditions of the Creative Commons Attribution (CC BY) license (https://creativecommons.org/licenses/by/4.0/).