Abstract
Protonic ceramic fuel cells (PCFCs) offer direct and efficient conversion of hydrocarbon fuels into electricity. In this study, three internal-reforming (IR)-PCFC/gas turbine (GT) hybrid systems are proposed and analyzed to achieve higher system efficiency. High-quality heat from GT in system 1 and system 2 is supplied to anode and cathode preheaters, respectively, whereas in system 3, the heat is simultaneously split into both preheaters. Effects of air flow rate, fuel utilization factor (Uf), and steam to carbon ratio (S/C) are also investigated. It is found that the best system design can be achieved by effectively utilizing GT exhaust heat for both electrode preheaters, as indicated in system 3. The maximum energy system efficiency obtained among the hybrid systems analyzed in this study is 71% with total exergy destruction of 686.7 kW. When fueled by methane, the hybrid system can achieve energy and exergy efficiencies of 71% and 77%, respectively, with 0.85 Uf. On the other hand, propane-fueled systems can achieve energy and exergy efficiencies of 68% and 75%, respectively. As S/C increases from 2 to 7, system efficiency decreases from 71% to 50%. When system 3 is fueled with butane or propane, system efficiency is only 3% lower than that fueled by methane.
1. Introduction
Energy production is one of the major issues to be addressed worldwide for meeting the increased global energy demand while reducing CO2 emissions. This has led researchers to investigate new energy conversion techniques, such as clean energy, hydrogen production, and power generation technologies [1,2,3]. Among them, converting the wide range of hydrocarbon/renewable fuels using solid oxide fuel cells (SOFCs) is considered a promising technology due to their high efficiency, capability of using a wide range of fuels [4,5,6,7,8,9,10,11], and efficient integration with heat recovery systems [12,13,14,15,16]. Hydrocarbon fuels can be reformed inside SOFCs, and such systems are called internal reforming SOFCs (IR-SOFCs). Eliminating external hydrogen production is an advantage in terms of design and capital costs. Furthermore, the high-quality thermal energy from the fuel cell exhaust makes this technology suitable to integrate or combine with other technologies, such as gas turbines (GT) [4,10,17,18,19,20,21,22,23,24] or steam turbines [25,26].
In recent years, several studies have investigated such hybrid systems in various aspects. Eisavi et al. [27] investigated various configurations of IR-SOFC/GT hybrid systems with pure methane as the input energy source. In these configurations, the high-quality thermal energy from the combustion chamber (CC) flows sequentially into the anode preheater, cathode preheater, and turbine to sustain their operating temperature. They reported that the highest efficiency of 58% was obtained with a single-stack SOFC/GT hybrid system. Zhao et al. [28] aimed to reduce the complexity and implementation of the hybrid power generation system. The ambient pressure of their syngas-fed IR-SOFC/GT hybrid system was varied to achieve maximum system efficiency of 57%. The higher fuel cell temperature led the turbine to generate more power, and such non-complex configurations proved to be easy to operate. Van Biert et al. [29] thermodynamically analyzed and compared the maximum efficiency of the methane-fueled external reforming (ER) SOFC/GT, and SOFC/ST. Their results indicated that an SOFC/ST hybrid system with a fuel utilization (Uf) of 0.9 has the same efficiency as a pressurized SOFC/GT hybrid system with a Uf of 0.72, which is about 62%. However, a pressurized SOFC/GT hybrid system is a better choice for a power plant because steam turbines require higher installation and operation costs.
SOFCs are classified into oxygen ion-conducting SOFCs (O-SOFCs) and proton-conducting SOFCs (P-SOFCs) based on the electrolyte used in the cell. P-SOFCs are also known as protonic ceramic fuel cells (PCFCs). The above-mentioned papers are all based on O-SOFCs. According to the mathematical modeling study of Ni et al. [30], the maximum efficiency of PCFCs can be higher than that of O-SOFCs, as higher concentration of hydrogen can be utilized in the former. For example, the efficiency of PCFCs operating at Uf = 0.8 and oxygen utilization of 0.2 is 11% higher than O-SOFCs. In addition, PCFCs can be operated at lower temperatures than SOFCs, which makes the choice of materials wider.
Cheng et al. [31] studied a direct H2-fed PCFC/GT hybrid system. The influence of anode stoichiometry and cathode stoichiometry were analyzed, and they found an overall efficiency of 51% could be obtained with a Uf of 0.9 at 1023 K. In our previous study [32], a methanol-fed ER-PCFC/GT was analyzed. The results showed that the hybrid system had a promising prospect as the efficiency could reach 66%. However, that system had a complex configuration, and could only be fed with low-reforming temperature fuels. To the extent of our knowledge, very few works investigated PCFC/GT hybrid systems. In this work, three different IR-PCFC/GT hybrid systems are analyzed to obtain the optimum system efficiency. Energy and exergy analyses of the optimum system are further performed to investigate the effects of several important parameters on system characteristics and performance. These parameters include the air flow rate, Uf, steam to carbon ratio (S/C), and fuel variation. Butane, methane, and propane are chosen as the fuels because their reforming temperatures [33] are close to the operation temperature of PCFCs.
2. System Description
Three different IR-PCFC/GT systems are analyzed in this study. All systems consist of a PCFC, a combustion chamber (CC), a turbine (T), an air compressor (AC), two pumps (P1, P2), two heat exchangers (HX1, HX2), two mixers (MX1, MX2), and one gas splitter (SPLTR) as shown in Figure 1, Figure 2 and Figure 3. In all the systems proposed in this study, there is no change in the inlet and outlet flow channel numbers of the main component. But, the arrangement of the IR-PCFC/GT exhaust gas is different to study the effect of heat recycling on the system performance. The main idea of the first system is to provide high-quality heat to anode preheater for the evaporation process. The idea of the second system is to provide high-quality heat to cathode preheater as the air flow rate is higher than the anode fuel flow rate. So, the temperature of the cathode is important for uniform heat distribution in the fuel cell, whereas in the last system, the high-quality heat from GT is proportionally split for preheating the anode and cathode reactants. The detailed operating principles of system operation for each IR-PCFC/GT system are as follows:
Figure 1.
Case 1, high-quality heat from turbine flows into the anode preheater (HX1). A, AC, K, HX, MX, P, SPLTR, and T stand for the anode, air compressor, cathode, combustion chamber, heat exchanger, mixer, pump, splitter, and turbine, respectively. Numbers 1 and 2 on the red lines indicate cathode flow, numbers 3, 4, 5, 5a, 5b, 5c and 6 on the green lines indicate anode flow, and numbers 7, 8, 9 and 10 on the blue lines indicate combustion flow.
Figure 2.
Case 2, high-quality heat from turbine flows into the cathode preheater (HX2). Numbers 1, 1a, 1b, 1c and 2 on the red lines indicate cathode flow, numbers 3, 4, 5 and 6 on the green lines indicate anode flow, and numbers 7, 8, 9 and 10 on the blue lines indicate combustion flow.
Figure 3.
Case 3, high-quality heat from turbine is proportionally distributed into the anode preheater (HX1) and cathode preheater (HX2). Numbers 1 and 2 on the red lines indicate cathode flow, numbers 3, 4, 5, and 6 on the green lines indicate anode flow, and numbers 7, 8, 8a, 8b, 9a, 9b and 10 on the blue lines indicate combustion flow.
2.1. Case 1
The first IR-PCFC/GT system is shown in Figure 1. Fuel mixes with water and is then preheated by a heat exchanger (HX1). To avoid overheating in the anode flow, 24% of fuel-water mixed is unheated and flowed directly to MX2. The mixture of heated and unheated flows then flows to the anode where internal reforming occurs. The generated hydrogen participates in the fuel oxidation reaction, while other reformed species and unreacted hydrogen enter CC. At the cathode side, air is compressed by an AC and heated by an HX2 before entering the cathode inlet. Part of the air takes part in the electrochemical reaction in the cathode, while the unreacted air flows directly to CC. High-pressure and high-temperature exhaust gases from the combustion chamber are expanded in the turbine for additional power generation. Next, the thermal energy of the turbine exhaust gas is used as a heat source for HX1 and HX2. The residual heat is released into the environment.
2.2. Case 2
The second IR-PCFC/GT system is shown in Figure 2. Fuel and water are mixed (MX1) and then fully flow to the anode preheater. The heat source of the anode preheater (HX1) is obtained from the remaining heat of the cathode preheater (HX2). In this system, high thermal energy of the flue gas from GT is used directly for air preheater. For cathode preheater, 57% of air is heated and 43% flows directly to MX2. This splitting is to avoid temperature differences in the electrode inlets.
2.3. Case 3
The last proposed IR-PCFC/GT system is a combination of systems 1 and 2 as shown in Figure 3. The thermal energy of flue gas from the GT is used to preheat the gas entering the anode (HX1) and cathode (HX2) simultaneously. Twenty-five percent of GT exhaust gas flows to HX1, and the remaining 75% flows to HX2, where this percentage is to keep the anode or the cathode temperature from overheating.
3. Modeling
This section describes the electrochemical and mathematical modeling of components in the PCFC/GT hybrid system for energy and exergy analyses. Thermodynamic library software (Thermolib) is applied to build and analyze the system. The input parameters of this hybrid system are tabulated in Table 1.

Table 1.
Balance of plant of PCFC/GT hybrid systems.
3.1. Protonic Ceramic Fuel Cell
In this study, IR-PCFC is used. The reactions in the fuel cell consist of steam reforming, water-gas shift reaction (WGS), and hydrogen fuel cell reaction. They can be written as follows:
Equations (1) to (3) represent the major steam reforming reactions for methane, propane, and butane. These reactions are followed by a WGS reaction, and a hydrogen fuel cell reaction, as described in Equations (4) and (5). The steam reforming and WGS reactions are calculated by chemical reaction conditions, while a fuel cell reaction is calculated by considering the influence of fuel utilization factors.
In PCFC, the maximum electrical voltage can be written as Nernst or open circuit voltage (OCV) as follows:
where , , and are the partial pressure of hydrogen at the anode side, oxygen at the cathode side, and water at the cathode side, while , , and are the number of electron transfer, gas constant, and the Faraday constant.
The reversible cell voltage at a standard pressure can be expressed as follows:
where delta is the function of temperature.
In the fuel cell, Nernst voltage cannot be achieved due to irreversibility or losses. The real voltage output can be written as follows:
where , , and are the activation polarization, ohmic polarization, and concentration polarization, respectively.
3.1.1. Activation Polarization
The voltage loss due to activation polarization can be predicted using the Butler-Volmer equation as below [45]:
where is usually 0.5 for typical electrode materials [8], while and are the current density in A/m2 and the exchange current density of the anode and cathode in A/m2.
3.1.2. Ohmic Polarization
Ohmic polarization can be evaluated as:
where is the conductivity in S/m and is the thickness in m, and the subscript is for the electrolyte, anode, and cathode.
In this study, Yb-doped SrCeO3 (SCYb) is used as the electrolyte material as it has a stable proton conductivity [46]. For SrCe0.95Yb0.05O3-α electrolyte, the protonic conductivity can be obtained from the following equation [35,40]:
where T is Kelvin.
At the anode side, Ni-SCYb is replaced with Ni-SrCe0.9Y0.1O3-α (Ni-SCY) due to the unavailability of data and similarity in structure. For the Ni-SCY, the conductivity () can be expressed as [34]:
At the cathode side, La0.6Sr0.4Co0.2Fe0.8O3-α (LSCF) is used. The conductivity () can be expressed as [38]:
3.1.3. Concentration Polarization
The concentration polarization due to the gas concentration differences in the anode and cathode can be given as follows [8,40]:
The partial pressure of hydrogen, oxygen, and water in the electrode–electrolyte interface can be evaluated from the following equations [8,40]:
The diffusion coefficient of the gas mixture at the anode can be calculated from the effective diffusion of H2, while the diffusion coefficient of the gas mixture at the cathode is calculated from the effective diffusion of O2 and the effective diffusion of H2O, as written as follows [8]:
where the effective diffusion of a single component can be calculated using the Knudsen diffusion formula as follows:
and the effective diffusion of the binary components is calculated using the Chapman-Enskog formula as follows:
and are Lennard-Jones parameters and collision integral parameters, respectively. The value can be calculated using the following formulas.
3.2. Efficiency
The system efficiency is equal to the power outputs from the fuel cell and GT minus the power consumption by the air compressor per energy of given fuel (represented by the lower heating value) in J/mol and the molar flow rate of fuel in mol/s as given below:
The energy balance associated with each component used in the proposed system is given in the second column of Table 2. The thermodynamic properties are obtained from the built-in thermodynamic table in Thermolib, which are originally from NIST [47].
Table 2.
Energy and exergy analysis of the components used in PCFC/GT hybrid systems.
3.3. Exergy
Exergy is the maximum usable work that can be generated. The analysis of exergy flow is important for optimizing a thermodynamic system. The exergy of a gas mixture can be classified into chemical exergy (ch) and physical exergy (ph). It can be expressed as:
The detailed equations of chemical exergy, physical exergy, and exergy destruction of each component can be found from Dincer et al. [48].
The exergy balance associated with each component used in the proposed system is given in the third column of Table 2.
4. Model Validation
The electrochemical modeling of fuel cells is numerically solved, and the results are compared with experimental data from Iwahara [36]. In his study, an electrolyte-supported PCFC (Pt|SrCe0.95Yb0.05O3-α|Pt) at normal atmospheric pressure fed with H2 and air was used to investigate the cell performance at different temperatures. The PCFC performance is predicted using an electrochemical model, in which the electrolyte proton conductivity is 225.92 exp (−6.3 × 10³/T) in S·m−1 [35,40]. Pt porosity, tortuosity, and pore radius are 0.4, 5, and 0.5 [49,50]. Our PCFC electrochemical model results show a good agreement with the experimental data as seen in Figure 4. The model established in this study is therefore reasonable and acceptable.
Figure 4.
Comparison between theoretical modeling results and experiment [36]. The green circle (◯), red triangle (△), and blue square (☐) symbols are experimental data at temperatures of 1073 K, 1173 K, and 1273 K, respectively.
Figure 4 also shows that the calculated data are approximately linear as the polarization in an electrolyte-supported cell is dominated by ohmic polarization, which has a more pronounced effect in the experiment data.
Currently, most fuel cells are anode-supported for better performance. Therefore, in the following study, anode-supported cells are used with anode thickness of 220 μm [39], cathode thickness of 50 μm [8,32,40], and electrolyte thickness of 50 μm [32,40] to tackle the high fuel cell polarization of electrolyte-supported cells and to lower the ohmic polarization as the major loss can enhance the power of the cell. Also, this current study replaces the traditional Pt electrode material with Ni-SrCe0.9Y0.1O3-α (anode) and La0.6Sr0.4Co0.2Fe0.8O3-α (cathode).
The input properties of other components used, such as the isentropic efficiency of the turbine and compressor, are obtained from published data [27].
5. Results and Discussion
5.1. Case Comparison
The performance of the IR-PCFC/GT system in all three configurations is first analyzed with methane fuel and under several nominal conditions. Steam to carbon ratio fed to anode is set at 2. The baseline values considered here are 33 A for the electrical current produced, 0.83 for the fuel utilization factor, 300 kW for the AC power consumption, 253 kW for the total energy input, and others as tabulated in Table 1.
From Figure 5 and Table 3, it can be seen that PCFC temperature can significantly improve cell efficiency. Due to the increase in temperature, polarization losses decrease as the conductivity increases and the output voltage of the PCFC stack increases. In order to analyze better energy conservation and energy management in the hybrid system, all the system parameters are the same, and the thermal management effects on the system performance for higher power production with variation in the flow of GT flue gas are investigated in detail.
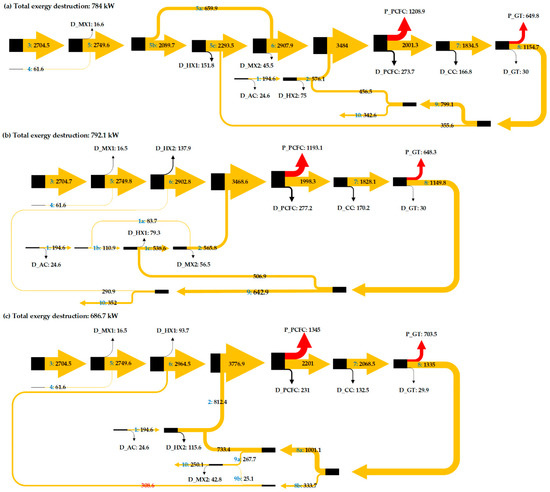
Figure 5.
Sankey diagram to show the exergy flow through the proposed IR-PCFC/GT hybrid system.
Table 3.
Stream properties (temperature, physical exergy flow, chemical exergy flow) in case 1, case 2, and case 3.
In case 1, the heat of GT flue gas (at 1163 K) is used for heating the anode fuel preheater. To conserve energy, 76% of the fuel and air mixture flowing to the anode is preheated and mixed with the remaining 24% unheated fuel to attain the required temperature before entering the PCFC as shown in Figure 1. After the heat exchange in anode fuel preheating, the remaining thermal energy (at 955 K) is used for cathode air preheating. In fuel cells, exothermic chemical reactions increase the temperature of the PCFC stack. The PCFC temperature, power, and energy efficiency in case 1 are 965 K, 1208 kW, and 0.71, respectively. The functioning of the PCFC also depends on its operating temperature and gas inlet temperature. In case 2, the heat of GT flue gas (at 1422 K) is used for air preheating. The results show that the PCFC and GT power do not change as the fuel cell temperature, hydrogen generation, and the heat generated by combustion remain the same. Thus, recycling the GT flue gas to the preheater anode (HX1) or to the preheater cathode (HX2) does not affect the operating temperature and power generated by the fuel cell or turbine.
In case 3, GT flue gas is proportionally used for HX1 and HX2. Figure 5 and Figure 6 show that case 3 has a higher net power output than other cases. The outstanding performance of case 3 is related to its lower total exergy destruction. Installation of splitter (SPLTR1) after GT in case 3 is effective as it can reduce the exergy destruction due to mixing. In case 1, mixing the unheated fuel flow (No. 5a in Figure 1) and heated fuel flow (No. 5c in Figure 1) cause a decrease in exergy flow of 45.5 kW. In case 2, mixing the unheated fuel flow (No. 1c in Figure 2) and heated air flow (No. 1a in Figure 2) cause a decrease in exergy flow of 56.5 kW. In case 3, there is no exergy destruction due to mixing before entering the electrode inlets. So, exergy flow entering the fuel cell is higher along with higher physical exergy and operating temperature. Table 3 shows that the exergy flow entering the fuel cell of case 3 is 3776.9 kW, where this value is 293 kW higher than case 1, and 308.9 kW higher than case 2. Lower operating temperature of the PCFC in case 1 and case 2 than case 3 causes larger exergy destruction. Increasing the operating temperature by increasing the inlet gas temperature with direct utilization of thermal energy of GT has reduced PCFC exergy destruction and improved its power output. The results also show that GT power in case 3 increases due to an increase in exergy flow entering the turbine. For the PCFC/GT hybrid system in case 3, Figure 6 shows that exergy efficiency, energy efficiency, and net power output of case 3 are 77%, 71%, and 1836 kW, respectively.
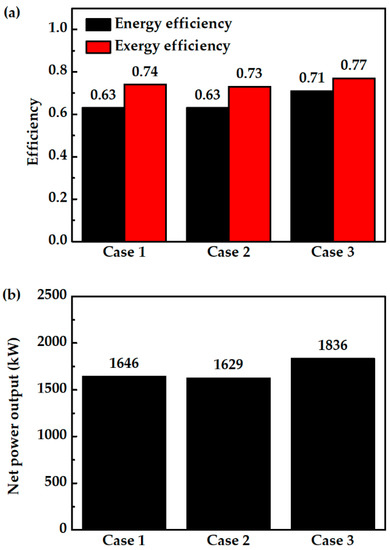
Figure 6.
Case comparison results; (a) energy and exergy efficiency and (b) net power output.
Considering all of the results, case 3 is a suitable configuration for IR-PCFC/GT hybrid systems with high system efficiency. Compared to the hybrid systems mentioned in the literature, case 3 has 13–14% higher energy efficiency than IR-SOFC/GT hybrid systems, 9% higher than ER-SOFC/GT hybrid systems, and 5% higher than ER-PCFC/GT systems. Next, the hybrid system efficiency with variation of several parameters, such as fuel flow rate, fuel utilization factor, steam to carbon, and fuel variation, of case 3 is investigated.
5.2. Effect of Air Flow Rate
Air flow rate significantly affects several system characteristics. The values are varied from 56 to 112 mol/s, which corresponds to air stoichiometry of 2 to 4. Figure 7a shows that increasing the air flow rate decreases PCFC power output. This is because excess air lowers the fuel cell temperature and reduces hydrogen production from the reforming reaction, as shown in Figure 7b. The results in Figure 7a also show that the turbine power increases with the increase in air flow rate. Although enthalpy change per mole across the turbine slightly drops as air flow rate is increased, the increase in air flow rate causes the power output to increase. On the other hand, power consumption by the air compressor increases as the air flow rate is increased. The net effect is that the system power output drops. Therefore, the overall efficiency also decreases, as shown in Figure 7c. The exergy efficiency also decreases as a result of increased exergy destruction. Because of its higher system efficiency, air stoichiometry of 2 is considered for the following parametric study.
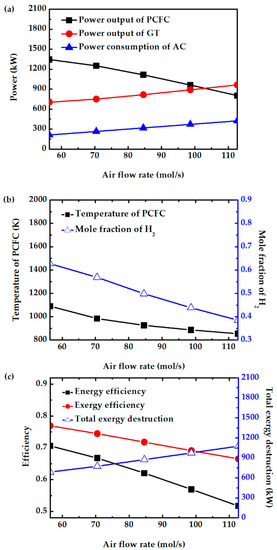
Figure 7.
Effect of air flow rate on (a) power consumption of air compressor, power output of PCFC and GT, (b) PCFC operating temperature and mole fraction of H2, and (c) energy efficiency, exergy efficiency, and total exergy destruction.
5.3. Effect of Fuel Utilization Factor
The effect of fuel utilization factors on system performance is investigated. This factor represents the ratio of the hydrogen consumed by the fuel cell to the amount of hydrogen fed. In this study, Uf is varied from 0.8 to 1. From Figure 8a, increasing Uf increases fuel cell power output. This is because more hydrogen is consumed, and hence more current and power is produced, while the fuel cell temperature is not significantly affected, as shown in Figure 8b. However, the TIT (Figure 8b) and turbine output power (Figure 8a) decrease with increase in Uf due to a decrease in the amount of unreacted fuels entering the CC. Overall, the efficiency of this system slightly increases with increase in Uf due to high fuel conversion and reduced total exergy destruction, as shown in Figure 8c. A maximum difference of 3% is observed in the total power output of the hybrid system operating between Uf of 0.8 and Uf of 1. Operating at moderate Uf helps in the long-term stability of the PCFC. Therefore, a common Uf of 0.85 is chosen for further study.
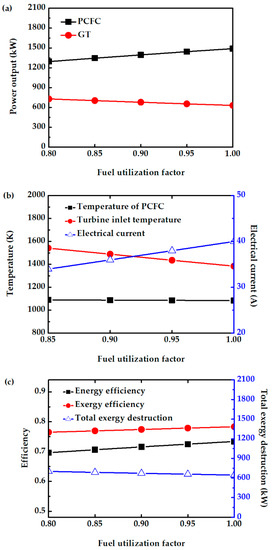
Figure 8.
Effect of Uf on (a) power output of PCFC and GT, (b) electrical current of PCFC and turbine inlet temperature, and (c) energy efficiency, exergy efficiency, and total exergy destruction.
5.4. Effect of Steam to Carbon Ratio
The molar ratio of steam to carbon is varied in the anode feed stream. In this study, the S/C is varied between 2 and 7. For S/C < 2, methane cannot be completely converted. The power output of PCFC decreases with increasing S/C, as shown in Figure 9a. The higher amount of steam dilutes the hydrogen, as shown in Figure 9b. The amount of H2 oxidation reaction also decreases. Further, the fuel cell and reforming temperatures also decrease with increasing S/C, as shown in Figure 9b. The presence of a higher amount of unreacted fuel and steam fed into CC cannot increase the turbine power generation due to the presence of higher amounts of steam. Figure 9c shows that the energy and exergy efficiency decrease with increase in S/C due to a decrease in power generation by PCFC and GT, and an increase in total exergy destruction. Therefore, maintaining S/C of 2 can avoid fuel dilution, decrease in PCFC temperature, and system performance.
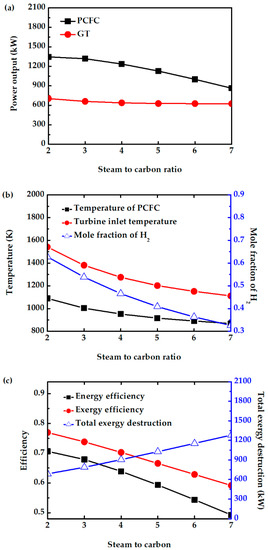
Figure 9.
Effect of S/C on (a) power output of PCFC and GT, (b) PCFC operating temperature, turbine inlet temperature, and mole fraction of H2, and (c) exergy efficiency, energy efficiency and total exergy destruction.
5.5. Fuel Comparison
The hybrid system performance with other gaseous fuels, such as propane and butane, are also analyzed in this study as their reforming temperatures are close to the fuel cell operating temperature. Also, methane, propane, and butane reserves are abundantly available.
Figure 10a shows that replacing methane with propane and butane reduces PCFC performance, because the fuel cell temperature is largely the same when fueled with propane or butane, as shown in Figure 10b. The drops in fuel cell power output are mainly due to less hydrogen produced, as shown in Figure 11a. The higher H2 production when the system is fueled with methane helps the fuel cell to produce more power. This is the reason for the lower total exergy destruction of methane fueled case as compared with propane and butane fueled cases (Figure 10a). On the other hand, propane- and butane-fueled cases produce more CO, as shown in Figure 11a. Although CO cannot be utilized in PCFC, they can be used in CC. This explains why the turbine in this system produces slightly more power when the hybrid system is fueled with propane or butane. This can also be observed from TIT (Figure 10b). Overall, replacing methane with propane or butane does not significantly affect the system efficiency. The system still has high energy efficiency of 68%, or 3% lower than when fueled with methane, as shown in Figure 11b. Therefore, for areas where they are more readily available, propane and butane can be two viable alternative fuels.
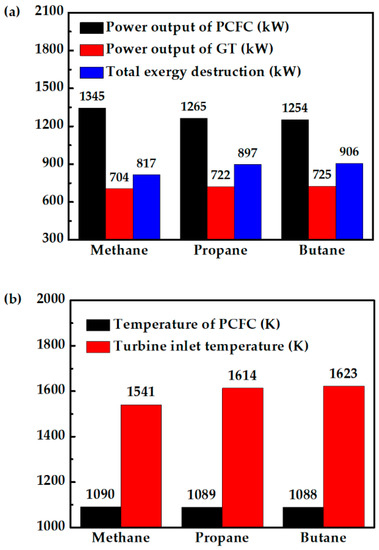
Figure 10.
Comparison of methane-, propane-, and butane-fueled PCFC/GT hybrid systems: (a) PCFC power output, GT power output and total exergy destruction of system, and (b) PCFC operating temperature and turbine inlet temperature.
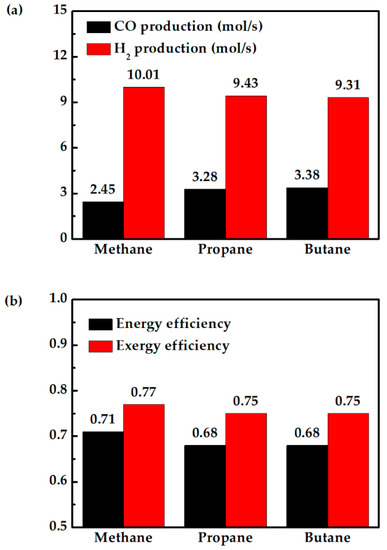
Figure 11.
Comparison of methane-, propane-, and butane-fueled PCFC/GT hybrid systems: (a) CO production and H2 production in the reforming process, and (b) energy and exergy efficiency.
The system efficiency of 68% with butane and propane is higher compared to the discussed high temperature SOFC/GT hybrid systems in the introduction. The exergy efficiencies of methane-, propane-, and butane-fueled PCFC/GT systems are 77%, 75%, and 75%, respectively. The higher exergy efficiency compared to the reported works is achieved by conceptual thermal management and fuel cell operation proposed in this work. The higher turbine power for the propane- and butane-fueled systems compared to the methane-fueled system can partially recover the power loss in the fuel cell. A PCFC/GT hybrid system can achieve similar system efficiency with the same operating conditions when fueled with butane, propane, and methane fuels. This study provides a strategical approach to achieve higher system energy conversion efficiency with thermal management and fuel utilization.
6. Conclusions
This study performed energy and exergy analyses of three IR-PCFC/GT hybrid systems. The first system is designed for using high-quality heat energy to preheat the anode fuel flow. The second system demonstrates the utilization of high-quality heat energy to preheat a large amount of pressurized air entering the cathode. The third system is designed for splitting the GT exhaust heat for efficient heat management to preheat both fuel and air. Several parametric studies such as air flow rate, Uf, S/C, and fuel variation of the best system are conducted to investigate their effects on system performance. The following conclusions can be obtained from this study:
- The third system (case 3) is considered an appropriate design for IR-PCFC/GT hybrid as it has low exergy destruction and high system efficiency.
- The amount of air flow in a PCFC/GT hybrid system plays an important role in the overall power output. Increasing air stoichiometry from 2 to 4 can significantly reduce energy efficiency from 71 to 51% and exergy efficiency from 77 to 66%. Power consumed by air compressor plays a role in the overall system efficiency.
- S/C is also an important factor in this PCFC/GT hybrid system, because the energy efficiency drops drastically from 71 to 50% when S/C is increased from 2 to 7. Dilution of the reactants causes a decrease in the temperature of each component, a decrease of the power generated by the fuel cell and turbine, and an increase of the total exergy destruction.
- For areas which have limited access to methane and higher access to propane or butane, this study shows that propane and butane are good alternatives to methane. An energy efficiency of 68% and exergy efficiency of 75% for propane- or butane-fueled hybrid systems can be achieved.
In summary, the results listed above clearly show that a PCFC/GT hybrid system can be considered as an appropriate technology for a power plant due to its high efficiency (>70%). Also, operating the system at low Uf, low air flow rate, and low S/C is recommended.
Author Contributions
Conceptualization, S., C.-J.T. and A.A.A.; methodology, S. and C.-J.T.; software, C.-J.T.; validation, S.; formal analysis, S.; investigation, S. and C.-J.T.; resources, S.; data curation, S.; writing—original draft preparation, M.B.; writing—review and editing, M.B. and C.-J.T.; visualization, S.; supervision, S.-W.L., W.W., I.N.G.W. and C.-J.T.; project administration, C.-J.T.; funding acquisition, C.-J.T. All authors have read and agreed to the published version of the manuscript.
Funding
This research is partially supported by the Ministry of Science and Technology of Taiwan.
Data Availability Statement
The data obtained in the study are available upon reasonable request sent to the corresponding author.
Conflicts of Interest
The authors declare no conflict of interest.
Nomenclature
| Roman Letters | |
| A | Area (m2) |
| AC | Air compressor |
| CC | Combustion chamber |
| D | Diffusion (m2/s) |
| E | Energy |
| E | Voltage (V) |
| ER | External reforming |
| F | Faraday constant |
| G | Gibbs free energy |
| GT | Gas turbine |
| h | Enthalpy (J/mol) |
| HX | Heat exchanger |
| i0 | Exchange current density (A/m2) |
| ic | Current density (A/m2) |
| ij | Molecule diffused |
| IR | Internal reforming |
| MX | Mixer |
| N | Mol |
| n | Number of electron transfer |
| n/a | not available |
| NTU | Number of thermal unit |
| P | Power (W) |
| P | Pressure (Bar) |
| P | Pump |
| PCFC | Protonic ceramic fuel cell |
| Q | Heat (J) |
| R | Real gas constant |
| S/C | Steam to carbon ratio |
| SOFC | Solid oxide fuel cell |
| SPLTR | Splitter |
| T | Temperature (K) |
| U | Coefficient of heat transfer (W/m2/K) |
| Uf | Fuel utilization factor |
| WGS | Water–gas shift |
| Greek Letters | |
| β | Transfer coefficient of Butler-Volmer |
| δ | Thickness (m) |
| ε | Porosity |
| η | Polarization |
| σ | Conductivity (S/m) |
| τ | Tortuosity |
| Ω | Lennard-Jones parameters |
| Subscripts | |
| act | Activation |
| conc | Concentration |
| in | Inlet |
| j | Fuel cell structure (anode, cathode, and electrolyte) |
| K | Knudsen |
| max | Maximum |
| min | Minimum |
| mix | Mixture |
| ohm | Ohmic |
| out | Outlet |
| p | Product |
| r | Reactant |
| s | Isentropic |
| TPB | Three-phase boundary |
| Superscripts | |
| eff | Effective |
| OCV | Open circuit voltage |
References
- Duan, L.Q.; Huang, K.X.; Zhang, X.Y.; Yang, Y.P. Comparison study on different SOFC hybrid systems with zero-CO2 emission. Energy 2013, 58, 66–77. [Google Scholar] [CrossRef]
- Tseng, C.L.; Tseng, C.J.; Chen, J.C. Thermodynamic analysis of a photoelectrochemical hydrogen production system. Int. J. Hydrog. Energy 2010, 35, 2781–2785. [Google Scholar] [CrossRef]
- Hsu, Y.P.; Lee, S.W.; Chang, J.K.; Tseng, C.J.; Lee, K.R.; Wang, C.H. Effects of platinum doping on the photoelectrochemical properties of Fe2O3 electrodes. Int. J. Electrochem. Sci. 2013, 8, 11615–11623. [Google Scholar]
- Stamatis, A.; Vinni, C.; Bakalis, D.; Tzorbatzoglou, F.; Tsiakaras, P. Exergy analysis of an intermediate temperature solid oxide fuel cell-gas turbine hybrid system fed with ethanol. Energies 2012, 5, 4268–4287. [Google Scholar] [CrossRef]
- Prodromidis, G.N.; Coutelieris, F. The effect of biogas origin on the electricity production by solid oxide fuel cells. App. Sci. 2021, 11, 3112. [Google Scholar] [CrossRef]
- Jhuang, J.W.; Lee, K.R.; Lee, S.W.; Wang, B.; Xia, C.; Hung, I.M.; Tseng, C.J. A triple (e−/O2−/H+) conducting perovskite BaCo0.4Fe0.4Zr0.1Y0.1O3-δ for low temperature solid oxide fuel cell. Int. J. Hydrog. Energy 2021, 46, 9767–9774. [Google Scholar] [CrossRef]
- Fan, S.; Zhu, P.; Liu, Y.; Yang, L.; Jin, Z. Three-dimensional structure research of anode-supported planar solid oxide fuel cells. J Energy Eng.-Asce 2022, 148, 04022010. [Google Scholar] [CrossRef]
- Kalinci, Y.; Dincer, I. Analysis and performance assessment of NH3 and H2 fed SOFC with proton-conducting electrolyte. Int. J. Hydrog. Energy 2018, 43, 5795–5807. [Google Scholar] [CrossRef]
- Jhuang, J.W.; Lee, K.R.; Lee, S.W.; Chang, J.K.; Jang, S.C.; Tseng, C.J. Microstructures and electrical properties of zirconium doped barium cerate perovskite proton conductors. Int. J. Hydrog. Energy 2019, 44, 21174–21180. [Google Scholar] [CrossRef]
- Cocco, D.; Tola, V. Externally reformed solid oxide fuel cell-micro-gas turbine (SOFC-MGT) hybrid systems fueled by methanol and di-methyl-ether (DME). Energy 2009, 34, 2124–2130. [Google Scholar] [CrossRef]
- Lee, K.R.; Tseng, C.J.; Jang, S.C.; Lin, J.C.; Wang, K.W.; Chang, J.K.; Chen, T.C.; Lee, S.W. Fabrication of anode-supported thin BCZY electrolyte protonic fuel cells using NiO sintering aid. Int. J. Hydrog. Energy 2019, 44, 23784–23792. [Google Scholar] [CrossRef]
- Moretti, C.; Corona, B.; Rühlin, V.; Götz, T.; Junginger, M.; Brunner, T.; Obernberger, I.; Shen, L. Combining biomass gasification and solid oxid fuel cell for heat and power generation: An early-stage life cycle assessment. Energies 2020, 13, 2773. [Google Scholar] [CrossRef]
- Yang, C.H.; Chang, S.C.; Chan, Y.H.; Chang, W.S. Dynamic analysis of the multi-stack SOFC-CHP system for power modulation. Energies 2019, 12, 3686. [Google Scholar]
- Liso, V.; Zhao, Y.; Yang, W.; Nielsen, M.P. Modelling of a solid oxide fuel cell CHP system coupled with a hot water storage tank for a single household. Energies 2015, 8, 2211–2229. [Google Scholar] [CrossRef]
- Narayanan, M.; Mengedoht, G.; Commerell, W. Evaluation of SOFC-CHP’s ability to integrate thermal and electrical energy system decentrally in a single-family house with model predictive controller. Sustain. Energy Technol. Assess 2021, 233, 113876. [Google Scholar] [CrossRef]
- Barelli, L.; Bidini, G.; Gallorini, F.; Ottaviano, P.A. Design optimization of a SOFC-based CHP system through dynamic analysis. Int. J. Hydrog. Energy 2013, 38, 354–369. [Google Scholar] [CrossRef]
- Lai, H.X.; Harun, N.F.; Tucker, D.; Adams, T.A. Design and eco-technoeconomic analyses of SOFC/GT hybrid systems accounting for long-term degradation effects. Int. J. Hydrog. Energy 2021, 46, 5612–5629. [Google Scholar] [CrossRef]
- Barelli, L.; Bidini, G.; Ottaviano, A. Integration of SOFC/GT hybrid systems in Micro-Grids. Energy 2017, 118, 716–728. [Google Scholar] [CrossRef]
- Wang, X.S.; Lv, X.J.; Weng, Y.W. Performance analysis of a biogas-fueled SOFC/GT hybrid system integrated with anode-combustor exhaust gas recirculation loops. Energy 2020, 197, 117213. [Google Scholar] [CrossRef]
- Badur, J.; Lemański, M.; Kowalczyk, T.; Ziółkowski, P.; Kornet, S. Zero-dimensional robust model of an SOFC with internal reforming for hybrid energy cycles. Energy 2018, 158, 128–138. [Google Scholar] [CrossRef]
- Martinez, A.S.; Brouwer, J.; Samuelsen, G.S. Comparative analysis of SOFC-GT freight locomotive fueled by natural gas and diesel with onboard reformation. Appl. Energy 2015, 148, 421–438. [Google Scholar] [CrossRef]
- Ghorbani, S.; Khoshgoftar-Manesh, M.H.; Nourpour, M.; Blanco-Marigorta, A.M. Exergoeconomic and exergoenvironmental analyses of an integrated SOFC-GT-ORC hybrid system. Energy 2020, 206, 118151. [Google Scholar] [CrossRef]
- Bakalis, D.P.; Stamatis, A.G. Optimization methodology of turbomachines for hybrid SOFC-GT applications. Energy 2014, 70, 86–94. [Google Scholar] [CrossRef]
- Bang-Møller, C.; Rokni, M.; Elmegaard, B. Exergy analysis and optimization of a biomass gasification, solid oxide fuel cell and micro gas turbine hybrid system. Energy 2011, 36, 4740–4752. [Google Scholar] [CrossRef]
- Duong, P.A.; Ryu, B.; Kim, C.; Lee, J.; Kang, H. Energy and exergy analysis of an ammonia fuel cell integrated system for marine vessels. Energies 2022, 15, 3331. [Google Scholar] [CrossRef]
- Pirkandi, J.; Penhani, H.; Maroufi, A. Thermodynamic analysis of the performance of a hybrid system consisting of steam turbine, gas turbine and solid oxide fuel cell (SOFC-GT-ST). Energy Convers. Manag. 2020, 213, 112816. [Google Scholar] [CrossRef]
- Eisavi, B.; Chitsaz, A.; Hosseinpour, J.; Ranjbar, F. Thermo-environmental and economic comparison of three different arrangements of solid oxide fuel cell-gas turbine (SOFC-GT) hybrid systems. Energy Convers. Manag. 2018, 168, 343–356. [Google Scholar] [CrossRef]
- Zhao, Y.R.; Sadhukhan, J.; Lanzini, A.; Brandon, N.; Shah, N. Optimal integration strategies for a syngas fuelled SOFC and gas turbine hybrid. J. Power Sources 2011, 196, 9516–9527. [Google Scholar] [CrossRef]
- Van Biert, L.; Woudstra, T.; Godjevac, M.; Visser, K.; Aravind, P.V. A thermodynamic comparison of solid oxide fuel cell-combined cycles. J. Power Sources 2018, 397, 382–396. [Google Scholar] [CrossRef]
- Ni, M.; Leung, D.Y.C.; Leung, M.K.H. Thermodynamic analysis of ammonia fed solid oxide fuel cells: Comparison between proton-conducting electrolyte and oxygen ion-conducting electrolyte. J. Power Sources 2008, 183, 682–686. [Google Scholar] [CrossRef]
- Cheng, T.C.; Huang, T.Y.; Chen, C.F.; Tseng, C.J.; Lee, S.W.; Chang, J.K.; Jang, J.S.C. Analysis of an intermediate-temperature proton-conducting SOFC hybrid system. Int. J. Green Energy 2016, 13, 1640–1647. [Google Scholar] [CrossRef]
- Sasmoko; Lee, S.W.; Bhavanari, M.; Wijayanti, W.; Osman, N.; Tseng, C.J. System analysis of a protonic ceramic fuel cell and gas turbine hybrid system with methanol reformer. Int. J. Hydrog. Energy 2022, in press. [CrossRef]
- Schädel, B.T.; Duisberg, M.; Deutschmann, O. Steam reforming of methane, ethane, propane, butane, and natural gas over a rhodium-based catalyst. Catal. Today 2009, 142, 42–51. [Google Scholar] [CrossRef]
- Lee, Y.S. Mixing Effect of Transition Metals, Aliovalent Dopants and Component Elements on Proton-Conducting Properties of Perovskite-Type Oxides. Ph.D. Thesis, Kyushu University, Fukuoka, Japan, 2017; p. 50. [Google Scholar]
- Potter, A.R.; Baker, R.T. Impedance studies on Pt|SrCe0.95Yb0.05O3|Pt under dried and humidified air, argon and hydrogen. Solid State Ionics 2006, 177, 1917–1924. [Google Scholar] [CrossRef]
- Iwahara, H. High temperature proton conducting oxides and their applications to solid electrolyte fuel cells and steam electrolyzer for hydrogen production. Solid State Ionics 1988, 28–30, 573–578. [Google Scholar] [CrossRef]
- Song, J.; Hei, Y.; Li, C.; Yang, N.; Meng, B.; Tan, X.; Sunarso, J.; Liu, S. Dehydrogenation coupling of methane using catalyst-loaded proton-conducting perovskite hollow fiber membranes. Membranes 2022, 12, 191. [Google Scholar] [CrossRef]
- Hang, Q.; Hou, Y.; Chen, L.; Wang, L.; Chou, K. Enhancement of electrochemical performance for proton conductive solid oxide fuel cell by 30%GDC-LSCF cathode. Ceram. Int. 2022, 48, 17816–17827. [Google Scholar]
- Chen, C.; Dong, Y.; Li, L.; Wang, Z.; Liu, M.; Rainwater, B.H. High performance of anode supported BaZr0.1Ce0.7Y0.1Yb0.1O3-δ proton-conducting electrolyte micro-tubular cells with asymmetric structure for IT-SOFCs. J. Electroanal. Chem. 2019, 844, 49–57. [Google Scholar] [CrossRef]
- Arpornwichanop, A.; Patcharavorachot, Y.; Assabumrungrat, S. Analysis of a proton-conducting SOFC with direct internal reforming. Chem. Eng. Sci. 2010, 65, 581–589. [Google Scholar] [CrossRef]
- Patcharavorachot, Y.; Brandon, N.P.; Paengjuntuek, W.; Assabumrungrat, S.; Arpornwichanop, A. Analysis of planar solid oxide fuel cells based on proton-conducting electrolyte. Solid State Ionics 2010, 181, 1568–1576. [Google Scholar] [CrossRef]
- Brus, G.; Miyawaki, K.; Iwai, H.; Saito, M.; Yoshida, H. Tortuosity of an SOFC anode estimated from saturation currents and a mass transport model in comparison with a real micro-structure. Solid State Ionics 2014, 265, 13–21. [Google Scholar] [CrossRef]
- Gostovic, D.; Smith, J.R.; Kundinger, D.P.; Jones, K.S.; Wachsman, E.D. Three-dimensional reconstruction of porous LSCF cathodes. Electrochem. Solid-State Lett. 2007, 10, B214. [Google Scholar] [CrossRef]
- Cheddie, F.F.; Murray, R. Thermo-economic modeling of a solid oxide fuel cell/gas turbine power plant with semi-direct coupling and anode recycling. Int. J. Hydrog. Energy 2010, 35, 11208–11215. [Google Scholar] [CrossRef]
- Chan, S.H.; Khor, K.A.; Xia, Z.T. A complete polarization model of a solid oxide fuel cell and its sensitivity to the change of cell component thickness. J. Power Sources 2001, 93, 130–140. [Google Scholar] [CrossRef]
- Takamura, Y.; Leonard, K.; Luo, A.; Martin, L.W.; Matsumoto, H. Platinum nanoparticle induced nanoionic effects on electrical conduction in strontium cerate and zirconate. J. Solid State Electrochem. 2019, 23, 953–996. [Google Scholar] [CrossRef]
- NIST-Webbook. Available online: https://webbook.nist.gov/chemistry/ (accessed on 26 February 2022).
- Dincer, I.; Rosen, M.A. Exergy: Energy, Environment and Sustainable Development, 2nd ed.; Elsevier: Oxford, UK, 2013; pp. 35, 39, 46. [Google Scholar]
- Ni, M.; Leung, D.Y.C.; Leung, M.K.H. Electrochemical modeling of ammonia-fed solid oxide fuel cells based on proton conducting electrolyte. J. Power Sources 2008, 183, 687–692. [Google Scholar] [CrossRef]
- Ni, M.; Leung, M.K.H.; Leung, D.Y.C. Parametric study of solid oxide fuel cell performance. Energy Convers. Manag. 2007, 48, 1525–1535. [Google Scholar] [CrossRef]


Publisher’s Note: MDPI stays neutral with regard to jurisdictional claims in published maps and institutional affiliations. |
© 2022 by the authors. Licensee MDPI, Basel, Switzerland. This article is an open access article distributed under the terms and conditions of the Creative Commons Attribution (CC BY) license (https://creativecommons.org/licenses/by/4.0/).