Abstract
Micro-expression is the involuntary emotion of the human that reflects the genuine feelings that cannot be hidden. Micro-expression is exhibited by facial expressions that last for a short duration and have very low intensity. Because of these reasons, micro-expression recognition is a challenging task. Recent research on the application of 3D convolutional neural networks (CNNs) has gained much popularity for video-based micro-expression analysis. For this purpose, both spatial as well as temporal features are of great importance to achieve high accuracies. The real possibly suppressed emotions of a person are valuable information for a variety of applications, such as in security, psychology, neuroscience, medicine and many other disciplines. This paper proposes a 3D CNN model architecture which is able to extract spatial and temporal features simultaneously. Thereby, the selection of the frame sequence plays a crucial role, since the emotions are only distinctive in a subset of the frames. Thus, we employ a novel pre-processing technique to select the Apex frame sequence from the entire video, where the timestamp of the most pronounced emotion is centered within this sequence. After an extensive evaluation including many experiments, the results show that the train–test split evaluation is biased toward a particular split and cannot be recommended in case of small and imbalanced datasets. Instead, a stratified K-fold evaluation technique is utilized to evaluate the model, which proves to be much more appropriate when using the three benchmark datasets CASME II, SMIC, and SAMM. Moreover, intra-dataset as well as cross-dataset evaluations were conducted in a total of eight different scenarios. For comparison purposes, two networks from the state of the art were reimplemented and compared with the presented architecture. In stratified K-fold evaluation, our proposed model outperforms both reimplemented state-of-the-art methods in seven out of eight evaluation scenarios.
1. Introduction
Micro-expressions are the type of expression that occurs when a person tries to suppress their true feelings. Micro-expressions are spontaneous and usually last for less than 0.5 s [1], resulting in tiny facial muscles’ movements. As per [2], micro-expressions are generated when someone attempts to hide their true intentions, as these expressions can neither be mimicked nor concealed. In 1966, micro-expressions were first discovered by Haggard and Isaacs [3], assuming that they are associated with defense mechanisms and conveyed feelings.
Later, in 1969, when Ekman and Friesen [4] conducted some experiments, they inadvertently encountered micro-expression. In the experiment, they examined the video of a person with depression who tried to lie about their suicide plan. During ordinary watching of the patient’s video, they did not observe anything suspicious, but when they watched the same clip at reduced video speed, they noticed that after the doctor asked the patient about his future, there was an expression of pain on the patient’s face. These expressions lasted for a short time and were only present in two frames of the video, so they named them micro-expressions [2].
Micro-expression recognition is applicable in many domains, e.g., doctors can recognize if a patient is suffering from pain [5], or it can be used with criminals during interrogations or at court to find out if they are lying. In addition, the real possibly suppressed emotions of a person are valuable information for many more applications in the fields of security, psychology, neuroscience, and medicine. Traditionally, micro-expression recognition was performed using a handcrafted descriptor that was manually adjusted to extract features from video clips or images. Local Binary Patterns (LBP) [6], optical flow features [7], and Local Binary Pattern histograms from Three Orthogonal Planes (LBP-TOP) [8] were some of these famous manual techniques used for feature extraction. However, the main drawback of the handcrafted methods was that they extract the manually created features and do not provide a generic data representation. Deep learning has recently gained much popularity, and convolutional neural networks (CNNs) are extensively used in solving computer vision problems. By using CNNs [9,10,11], the results in the field of micro-expression analysis have also been outperformed compared to traditional approaches, which is why this field continues to be of great interest for the research community.
Most of the recently proposed architectures for micro-expression recognition are based on CNN, long short-term memory (LSTM), or a combination of both network types. The disadvantage of standard CNNs is that they are only able to gather spatial features and are unable to capture motion over several frames. Some work [12] attempted to capture temporal information with the optical flow, but this often involves detecting unwanted background motion. Usually, the spatial information was extracted with CNNs, and subsequently, the features obtained were given into an LSTM to analyze the temporal information [13,14]. However, simultaneous extraction of the spatio-temporal features is not possible with this workflow. To overcome all the limitations of existing methods, a 3D CNN model is proposed in this work. It is a new custom architecture for directly recognizing the persons’ micro-expressions from the video sequences. In addition, we employ a novel pre-processing technique by selecting the Apex frame sequence from the entire video. The advantage of this approach is that the Apex event with the highest emotion shown by the subject is located in the middle of this sequence. This yields better results in classification compared to using the initial sequence. Moreover, extensive experimental evaluation is performed with intra-dataset as well as cross-dataset experiments on the three benchmark datasets CASME II, SMIC, and SAMM. This comparison of cross-dataset results is unprecedented in the state of the art for micro-expression recognition, and we are the first to perform this kind of evaluation. It clearly shows that our new 3D CNN architecture outperforms other state-of-the-art models in terms of recognition performance.
The main contributions of this paper can be summarized as follows:
- We have developed a 3D CNN model architecture for micro-expression recognition which is able to extract spatial and temporal features simultaneously;
- A novel pre-processing technique is employed by selecting the Apex frame sequence from the entire video, where the timestamp of the most pronounced emotion is centered within this sequence;
- Stratified K-fold was applied for model evaluation because it is suitable for small datasets with imbalanced class distribution as in our case;
- Comprehensive experimental validation was performed by comparing the proposed model with two reimplemented state-of-the-art methods in intra-dataset as well as cross-dataset evaluations in a total of eight different scenarios. To the best of our knowledge, such an extensive evaluation in this or comparable manner has not been conducted for micro-expression recognition so far.
The paper is organized in the following way: The related works proposed so far are presented in Section 2. Section 3 is about the spontaneous micro-expression datasets. In Section 4, the pre-processing steps are examined, and in Section 5, our network architecture is outlined in detail. Section 8 reports the results and discussions. Finally, in Section 10, a conclusion is drawn and future work is outlined.
2. Related Works
In micro-expression recognition, feature extraction is the most crucial task [15]. The classification accuracy of micro-expressions is directly proportional to the feature extraction efficiency. In recent years, many methods have been proposed to effectively extract features from facial images [15]. These approaches are mainly classified into two types: those based on handcrafted methods and those based on deep learning.
2.1. Handcrafted Methods
In the past decade, micro-expression recognition has been based entirely on handcrafted approaches. In [16], a feature extraction based on 3D histogram-oriented gradients (3DHOG) was proposed to detect motion in the smaller regions of the face. Polikovsky et al. [17] presented a 3DHOG descriptor capable of capturing temporal characteristics and sudden changes on the facial surface. A classifier such as k-means and the voting method were used to classify the micro-expressions. Pfister et al. [18] utilized the temporal interpolation method to normalize the length of the video sequence to deal with the problem of short video samples. In addition, temporal and spatial features were extracted using the LBP-TOP descriptor and used for the classification with support vector machine (SVM) or random forest. In [19], new feature extraction techniques were proposed using a fusion approach. This is based on a histogram of the motion boundaries, where the vertical and horizontal components of the differential optical flow are fused. The extracted features are classified by SVM. Shreve et al. [20] proposed a technique to spot the temporal information from long videos. During expressions in the facial regions, strains were produced. The optical flow uses these strains in the mouth, chin, forehead, and cheek areas of the face to identify temporal features. Moreover, the extended video sequence consists of both the micro- and macro-expression. In [21], a new approach was presented that automatically recognizes facial expressions. Instead of an expression, this approach concentrated more on clues related to identity. Hence, video frames were used to generate registration points or landmarks on the face; then, the local regions and LBP were extracted for feature representation, and finally, the expressions were classified by SVM.
2.2. Deep Learning-Based Methods
Recent developments in GPUs extended the potential of deep learning models in various domains. In the last few years, deep learning has become popular in solving computer vision problems, leading to more advanced algorithms for micro-expression recognition. Liong et al. [22] designed a network that uses the on-set and Apex frame of each sample to compute optical flow features. Three such optical flow information, namely the vertical, horizontal and optical strain, were used, which is why this network is called shallow triple-stream 3D CNN. Thus, a compact and discriminative feature representation is learned according to the authors. In [23], a 3D convolutional neural network capable of extracting spatial and temporal features was proposed, taking advantage of three-dimensional kernels. The authors used a frame sequence to classify the micro-expression, but in the entire paper, the authors have not discussed the use of Apex frame or the selection of an Apex frame sequence. In this paper, the author considered only initial starting frames of the samples. Furthermore, two different networks were designed, one using the whole image as input and the other obtaining only cropped parts of the face. For this purpose, experiments were performed on the intermediate and late fusion of eyes and mouth regions based on 3D CNNs.
The 3D CNN-based network by Zhang et al. [24] proposed a multi-scale fusion network that fuses local regions (such as eyes or mouth) along with the global region (full face) in order to select the appropriate region of interest to focus on for micro-expression recognition. These features were later passed to an LSTM to better process the temporal features. Thus, they presented a multi-channel fusion model. In [25], the VGG network was used for micro-expression detection. Since VGG is a deep network model, batch normalization and dropout techniques were applied to avoid the problem of overfitting. Furthermore, the insufficient dataset problem was tackled by choosing a random starting frame, fixing the sequence length, and repeating the process for entire samples to amplify the data. Xu et al. [26] proposed a method using optical flow to extract motion information between only two frames (on-set and Apex) in the entire sequence of samples. These features were inputted to a pre-trained MobileNetV2 and the micro-expressions classified by SVM. They conclude that micro-expressions involve only local areas of the face, and there are some irrelevant muscle movements. In [27], the temporal sample deformation method was introduced to preserve the temporal information, since normalizing the length of the video sequence is an essential aspect in the case of micro-expressions. The new sequence is randomly sampled by a normal distribution. The authors developed a three-branched architecture combining 2D and 3D CNNs. They were able to show the advantages of single 3D kernel sizes and multiple 3D kernel combination. The Eulerian video magnification (EVM) technique adopted by Wang et al. [28] for magnifying the motion in micro-expressions was performed to extract the spatio-temporal features for the CNNs. Therefore, Eulerian motion feature maps were extracted by employing a spatial scale temporal filtering approach. Next, these feature maps are fed into a 3D CNN for final recognition. In contrast to the previous approaches, where the optical flow information was obtained from on-set and Apex frames, Chen et al. [29] utilized a novel method by dividing the optical flow image into small blocks and then processed them by CNN. A weighted loss function of implicit semantic data augmentation is applied for augmentation of the training data in the deep features space. In [30], the authors used only two frames (Apex frame and on-set frame) from the entire frame sequence of micro-expression samples. Later, feature extraction was performed using Bi-Weighted Oriented Optical Flow (Bi-WOOF) based on only those two frames instead of a complete sequence. Thereby, discriminately weighted motion features are intended to be captured and are weighted by their own magnitudes. The facial regions are weighted by the magnitude of optical strain. Subsequently, SVM was used to classify the micro-expressions. Li et al. [31] presented a method that consists of two sub-networks. First, a hierarchical convolutional recurrent neural network is utilized for the extraction of spatio-temporal features. Then, a principal-component-analysis-based recurrent neural network is applied, and the features are merged through the fusion of sub-networks.
3. Datasets
There are two types of micro-expressions posed and spontaneous ones. In earlier studies, participants were often asked to pose their facial expressions, so the datasets were generated on this basis. However, the disadvantage of collecting datasets in this way was that the expressions elicited by the participants were not genuine, which lead them to differ from natural micro-expressions. In this paper, three spontaneous datasets are used: Chinese Academy of Sciences Micro-Expression II (CASME II), Spontaneous Actions and Micro-Movements (SAMM), and Spontaneous Micro-Expression Corpus (SMIC).
3.1. CASME II
The dataset [32] consists of 255 samples collected from 26 subjects with the same ethnicity. Action Units (AUs) on the basis of the Facial Action Coding System (FACS) system were employed for labeling the samples. The videos are recorded at a resolution of 640 × 480 pixels. The samples in the CASME II dataset are distributed among seven classes namely happiness, disgust, fear, sadness, repression, surprise, and others. However, only the three classes happiness, disgust, and surprise are taken for the experiment (see Table 1), as the remaining classes only contained very few samples and the class others was not annotated consistently across the three datasets. The rest of the samples was therefore discarded.

Table 1.
Experimental datasets with their class distribution.
3.2. SMIC
In the SMIC [33] dataset, 16 participants were recorded. Participants were chosen from three different ethnicities to make this dataset more diversified. This dataset consists of 164 samples, which were further classified into three classes, namely the positive class that contains happy emotions, combining the three sad, disgust, and fear emotions to form the negative class and the surprise class.
3.3. SAMM
The SAMM [34] dataset consists of micro-expression samples obtained from 29 participants. This was the first spontaneous high-resolution dataset in which participants belonged to different geographical regions from a total of 13 ethnic groups. AUs were used to label these samples based on FACS. SAMM contains seven emotions that were captured at 200 FPS with a high resolution of 2040 × 1088. Again, only three classes are further processed because of the small amount of samples in the remaining classes and to ensure a fair comparison between the databases.
4. Pre-Processing
In micro-expression recognition, pre-processing is one of the most critical stages, consisting of necessary steps before extracting the essential and useful features. Face detection and face alignment are used to bring all the frames to a common reference. Next, the landmarks are identified to discard unwanted background information or noise that negatively affects the model’s accuracy. The final step is to capture the Apex frame sequence where the emotion is high. Most of the pre-processing is performed by using algorithms from the Dlib library.
4.1. Face Detection and Alignment
Detecting the face and aligning the faces to a common reference were major steps which ensure that the extracted features belong to same location corresponding to each face. Both these steps were performed by calling a function in Dlib named dlib.get_frontal_face_detector(). This is a face detector that receives as input the image and the up-scaling factor for the two arguments. By increasing the up-scaling value, even smaller faces can be detected in the image, but this also increases the computation time [35]. The output of the face detection function returns x, y, w, and h values, which are the coordinates of the diagonal corners forming a bounding box around the detected face.
4.2. Facial Landmark Detection
After detecting the face, the next task was to obtain the facial landmarks. Based on these landmarks, the face can be cropped properly ignoring the background as shown in Figure 1. In Dlib, there is a pre-trained model called shape_predictor_68_face_landmarks.dat that is used to generate the landmarks on the detected face. With the help of this pre-trained model, a function called dlib.shape_predictor(). acts as a landmark detector. The output of this model returns 68 points on the face [35]. After determining the landmarks, all micro-expression frames were cropped according to the requirements of each model.
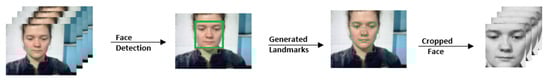
Figure 1.
The workflow of pre-processing steps.
4.3. Apex Frame Spotting
In our work, Apex frame spotting is not applied, since the information is already provided in the datasets. The purpose of this section is to give an overview of existing approaches for this task, which in particular has high relevance for real-world applications. In real applications, the recorded data do not contain information about the Apex, which indicates the point of time in the sequence with the highest micro-expression present. However, this information can help to effectively reveal the genuine emotions behind a particular video sample [36]. Few works have been proposed to detect the Apex frame from a video sequence. In [37], the authors used an LBP descriptor to extract the features from each frame and computed the difference by subtracting the features of the on-set frame with the remaining frames. Then, they divided the sequence into two halves and calculated the sum of each subsequence. The subsequence with the largest difference is selected. This binary search process continues as described until an Apex frame is determined from the entire sequence. In [38], optical flow and the LBP algorithm were used to determine the Apex frame. Based on the distance of facial movements and their directions, the optical flow was employed to examine the facial changes for identifying the Apex frame. In [39], the authors used Region HOOF to spot the Apex frame with the help of five ROIs.
4.4. Selection of Apex Frame Sequence
In pre-processing, the last task was to choose the best sequence of frames with high emotion or where the facial muscle movement was at its peak. The sequence with high emotion needs to be considered for micro-expression recognition. Details about the frames with high emotional content are obtained from the data annotations by analyzing their AU levels. The CASME II and SMIC datasets also provide information about the on-set frame (where micro-expression starts), the Apex frame (where micro-expression peaks), and the off-set frame (where micro-expression ends). By taking advantage of these details, the selection of frame sequence is performed. The Apex frame sequence consists only of frames surrounding the Apex event with the highest micro-expression intensity. For instance, a fixed frame length of 36 frames is chosen for a video sample from CASME II. Then, 18 frames before and 18 frames after the Apex frame (including it) are considered in the Apex frame sequence. For SMIC, the sequence length is 26 frames.
5. Network Architectures
The application of 3D CNN exploits the spatio-temporal correlation. Our proposed model is named Model-A. The main aim of this work is to improve the recognition performance of micro-expressions by using a 3D CNN. Two state-of-the-art models are reimplemented to compare the performance with our model. These two models are named Model-B [23] and Model-C [40], respectively. Both also employ a 3D CNN in their model architecture. In this section, the networks of Model-A, Model-B, and Model-C are presented.
5.1. Model-A (Proposed 3D CNN Model)
The goal of the proposed 3D CNN model architecture named Model-A is to recognize micro-expressions in video clips. The architecture is demonstrated in Figure 2. The dimensions height, width, and depth were passed as input into the model. Height and width are kept constant with a size of 128 × 128 pixels, and the depth dimension varies based on the frame sequence length of each dataset (36 frames for CASME II, 26 frames for SMIC, and 30 frames for the Combined dataset). The entire model was created using the Keras framework. Initially, a sequential model was constructed to which the layers were added.
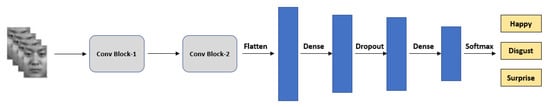
Figure 2.
Architecture of our proposed 3D CNN Model-A.
The main block of Model-A consists of two Conv blocks followed by flatten and dense layers. Each Conv block contains a convolution, batch normalization, max pooling, and dropout layer, as shown in Figure 3. For the convolutional layer, a 3D CNN was chosen instead of a 2D CNN because 3D CNNs are capable of capturing temporal information along with spatial information. Each convolutional layer operates with 16 filters and a kernel size of 3 × 3 × 3. The model uses a HeNormal initializer for better initial weights. The padding type was kept the same so that edge information was retained. The output from each convolution was passed to the batch normalization in order to converge the model faster and reduce the problem of overfitting. Then, 3D max-pooling with a 3 × 3 × 3 kernel was applied to decrease the spatio-temporal size and preserve critical features. Furthermore, to avoid overfitting, dropout layers were added to the model with a dropout rate of 0.4.
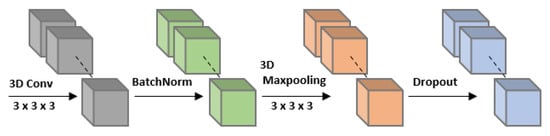
Figure 3.
Layers of each Conv block.
As the dimensions for the dense layer need to be one-dimensional, a flatten layer was applied prior to dense. The first dense layer consists of 128 neurons, which is subsequently connected to another dropout layer. Then, a second dense layer with three neurons performs the classification into the three micro-expression classes. Finally, softmax is applied to the output. Rectified linear unit (ReLU) activation functions were used across all feasible layers. A summary of the sequential model is shown in Table 2, indicating the output feature map size of each layer.
Table 2.
Summary of our Model-A with CASME II dataset samples as input.
5.2. Split-Model
The architecture of Model-A employed for the train–test split evaluation differs slightly from the proposed one in Section 5.1. The only difference is that the architecture consists of three Conv blocks instead of two for Model-A. The rest of the layers and model parameters remain unchanged. For better distinction, this variant for the intra-dataset train–test split is named Split Model.
5.3. Model-B
This reimplemented model was originally called MicroExpSTCNN [23] in the corresponding paper. To avoid confusion, our reimplementation is called Model-B. It is a 3D CNN with input dimensions for width and height of 64 × 64, whereby the depth dimension changes depending on the database selection. The model starts with a convolutional layer with 32 filters and a kernel size of 3 × 3 × 15. Then, max-pooling is applied with a size of 3 × 3 × 3 to retain important features. To prevent model overfitting, a dropout layer with 0.5 dropout rate is employed afterwards. Then, the obtained output was flattened and inputted to a dense layer with 128 neurons, which was followed by another dropout layer. Finally, a dense layer with three neurons and softmax activation are used to classify the samples into the classes anger, disgust, or happy. More details can be found in the original paper [23].
5.4. Model-C
In the original work, the architecture was referred to as the 3D CNN network model [40]. This is the second reimplementation, which will be called Model-C in the rest of this paper. This model is again a 3D CNN, but some model parameters were not listed by the authors, e.g., the input image shape, the number of filters and the kernel size for the convolution, the max-pooling size, the number of neurons in the dense layer, and the dropout rate. To the best of our knowledge, missing values were assumed and empirically selected. An input image size of 128 × 128 was chosen, and the depth depends as with Model-B on the database. A convolution with 32 filters and a 3 × 3 × 3 kernel was picked; additionally, batch normalization was added for better convergence. For the two max-pooling blocks, a pooling size of 3 × 3 × 3 was taken. Moreover, a dropout rate of 0.5 was implemented, and for the dense layer, 128 neurons were chosen. See [40] for more information.
6. Model Training Parameters
In this section, the parameter specifications for each model are specified.
6.1. Model-A
Our proposed model was implemented with the Keras framework and TensorFlow backend. The system specification involved in all experimental setups includes a Intel® Core™ i7-4770S CPU @ 3.10GHz, with 16 GB RAM and a NVIDIA GeForce RTX 2080 Ti GPU with 12 GB. As hyperparameters during model training, a learning rate of 0.001 was chosen with a batch size of 4. Categorical cross-entropy was used as the loss function, and stochastic gradient descent (SGD) was used as the optimizer with a momentum of 0.9. Accuracy was the metric utilized for measuring the performance of the model. In total, the model was trained for 100 epochs.
6.2. Model-B
In the paper [23], the model was implemented through the Keras framework via TensorFlow. The model training was performed along with an NVIDIA Tesla K80 GPU server with 24 GB dedicated GDDR5 graphics processor. For the experiment, SGD was the optimizer used along with categorical cross-entropy as the loss function. The model was trained with a batch size of eight for 100 epochs.
6.3. Model-C
The experiment conducted in the paper [40] also employed the Keras framework with TensorFlow backend. The experimental setup was equipped with an Intel® Core™ i7-9700 CPU 3.70 GHz with 32 GB RAM and a NVIDIA GeForce GTX 3090 GPU. The model parameters included a learning rate of 0.01, an SGD optimizer with a momentum 0.9, and categorical cross-entropy as the loss function. The Nesterov accelerated gradient is employed for SGD, and the learning rate decay is 1 × 10⁻⁶. The model was trained with a batch size of four for 800 epochs.
Note that the learning rate of 0.01 was changed to 0.001 and the number of training epochs was changed from 800 to 100 for experimental purposes. Many model parameters were not mentioned in the paper and therefore had to be assumed. As a result, some given hyperparameters had to be adjusted, as they were no longer suitable for model training due to the assumptions made. The initial assumptions on the parameters were made based on the proposed Model-A, since Model-C has a similar architecture. Subsequently, these model parameters were fine-tuned and empirically optimized to improve the results of Model-C.
7. Experimental Analysis
In this section, an experiment is conducted to observe the difference in the performance of the proposed model by selecting the initial frames or the frames around the Apex frame. For experimental purposes, 36 frames were used in CASME II and 26 frames in SMIC. The number of frames for SMIC is less because the average video length is shorter at 34 frames compared to 68 frames in CASME II. From the results comparison in Table 3, it is clearly visible that the performance of the proposed model achieves 9.6% higher accuracy when using the Apex frame sequence instead of the original frame sequence for the CASME II dataset. A similar observation is made for the SMIC dataset, where Model-A performs 9.4% better in accuracy using the Apex frame sequence compared to the initial frame sequence. More details about the process of selecting the Apex frame sequence can be found in Section 4.4.
Table 3.
Performance of Model-A using initial frames and the Apex frame sequence.
From the results of this experiment, the overall superiority of our choice of the Apex frame sequence is clearly demonstrated. Therefore, in all experiments for the eight scenarios in the next section, the Apex frame sequence is used instead of the initial frames.
8. Results And Discussions
The results for the two evaluation techniques and eight scenarios are given and discussed in this section. All the evaluation results are stated in the terms of accuracy. The accuracy metric is used for model evaluation, as it is applied in two state-of-the art models [23,40] as well. For better comparison, this paper applies the accuracy as the main evaluation measure for all three models in the eight scenarios.
8.1. Train–Test Split
In the experiments, the Split Model was used for train–test split evaluation. It was trained on the CASME II dataset and achieved an accuracy of 85.2% compared to 80.3% by Model-C.
The results obtained seemed good at first sight, but a major problem was encountered, as they are not reproducible for randomly shuffled splits and differ drastically in their performance. In an experiment of five random splits, Run-1 achieved the highest accuracy of 85.2%, whereas Run-3 achieved only 45%. The results of the other three splits are in between them. The validation curves for all runs are shown in Figure 4.
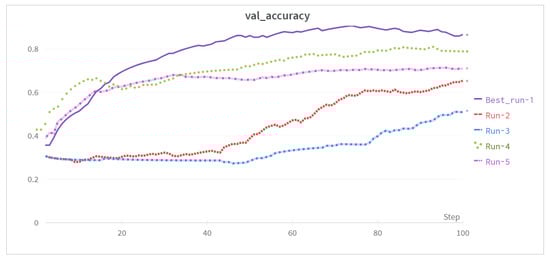
Figure 4.
Evaluation accuracies for our Split Model with train–test split for multiple runs.
This clearly illustrates that a train–test split is not suitable for the small and imbalanced datasets in micro-expression recognition. In other papers in the state of the art, a split was then accordingly selected allowing the generation of the best possible results. However, from our point of view, this does not correspond to a fair comparison and is not a good scientific practice. To address this common practice in the field of micro-expression recognition and to provide a fair comparison, we compared our model with two state-of-the-art models in eight evaluation scenarios for both intra-dataset and cross-dataset. The splits were generated using stratified K-fold validation. More details can be found in the next subsection. To the best of our knowledge, we are the first to perform such a comparison in this manner in micro-expression recognition.
8.2. Stratified K-Fold
The approach of stratified K-fold validation ensures that in every split, there will be always the same ratio of class samples. Therefore, this approach was deployed for all experiments. Overall, stratified K-fold validation was employed for eight different evaluation scenarios. The number of K was always chosen to be five. Three of these scenarios are intra-dataset experiments and five are cross-dataset experiments. For this purpose, varying combinations of the three datasets CASME II, SMIC, and SAMM (see Section 3) were applied. The combined dataset is a merging of CASME II and SMIC. As the number of samples in SAMM with 50 was insufficient for training, it is only used for testing purposes in the cross-dataset comparisons.
The results of the three methods Model-A, Model-B, and Model-C across all eight scenarios are summarized in Table 4. It can be observed that our proposed Model-A outperforms the state-of-the-art architectures Model-B and Model-C in seven out of eight scenarios, with the exception of Scenario-8, where Model-C performs best. This clearly shows the superiority of our architecture compared to the methods presented so far. Detailed results for each scenario with further explanations and discussions can be found in the following subsections.
Table 4.
Accuracy comparison of the three models across all eight evaluation scenarios.
8.2.1. Scenario-1
Scenario-1 is an intra-dataset experiment where both training and validation were performed on the SMIC dataset. Our Model-A reached an accuracy of 43.7% compared to 33.5% and 37.3% of Model-B and Model-C, respectively. Thus, the performance difference is 10.2% and 6.4%. The advantage of Model-A is that it is deeper and consists of more convolutional layers. Therefore, it is able to better identify spatio-temporal features related to micro-expressions. Another benefit is provided by our pre-processing technique, which involves selecting an Apex sequence and interpolating the first and last frames of each video, resulting in fewer samples being discarded because of too short length.
A overall low accuracy can be noticed for all three models. The main reason for this is that the videos were recorded at 100 FPS, which is low compared to the other benchmark datasets. Thus, there is a lag in the models’ ability to capture the temporal information, which is an essential factor in micro-expression recognition. Consequently, poor temporal feature quality leads to low accuracies. Additionally, the average sample length in SMIC is only 34 frames, which is shorter than for the other databases. It is likely that this only allows the extraction of features with lower quality from the samples.
8.2.2. Scenario-2
In Scenario-2, CASME II was applied for training and testing. Again, Model-A performs best with a margin of 8.4% to the second best Model-C. An accuracy of 56.5% was obtained for Model-A, which is 12.8% higher than for the SMIC dataset in Scenario-1. Model-B and Model-C were also able to increase by 11.9% and 10.8%, respectively. This can be mainly attributed to the higher frame rate in the video recordings, which is with 200 FPS twice as high as with SMIC. Thus, the networks are capable of detecting even more minor motion information. As mentioned above, a higher frame rate can help produce higher accuracies in micro-expression recognition. Another advantage of the CASME II dataset is that the on-set frame, Apex frame, and off-set frame information is provided by the authors. As the Apex frame was known in the entire video, the pre-processing was executed easily in a correct manner.
Even though the accuracy achieved with CASME II is higher than with SMIC, it is still not very high for micro-expression recognition. There are some reasons for this: The major problem in CASME II was the data imbalance. So, for the experiments, only three classes are appropriate: namely, happiness, disgust, and surprise. These emotions were mainly considered in order to be consistent with SMIC and SAMM. Even though the dataset has 255 samples, only 123 samples were utilized in the experiments. Thus, the low overall performance in CASME II can be attributed to insufficient and imbalanced samples.
8.2.3. Scenario-3
In Scenario-3, SMIC and CASME II are combined by joining their samples. Discussing the performance of the individual models, all three models achieved more than 80% accuracy. The performance of Model-A with an accuracy of 88.2% is the best over all eight scenarios. Model-B and Model-C rank behind with 85.4% and 80.4%, respectively.
The higher performance for this scenario can be explained by two reasons: First, the combined dataset contains an amount of 230 more samples for training. Second, the model benefits from the mixture of higher and lower frame rates, making it more robust.
8.2.4. Scenario-4
In this cross-dataset scenario, the SMIC dataset was used for model training, whereas SAMM was used for evaluation. Model-A achieved an accuracy of 44.3%. This can be regarded as relatively high when it is compared to the intra-dataset evaluation results of SMIC in Scenario-1, where the performance of Model-A is lowered by 0.6%. In cross-dataset experiments, the ethnicities of the subjects play a crucial role, as they will lead to better generalization of the model. It is all the more astonishing that the model trained on SMIC, which includes only three ethnicities (Africa, Asia, and Caucasian) in the training samples, performs that well on SAMM.
Compared to Model-C, Model-A performs better by 2.3%. A relatively large drop can be seen for Model-B with a difference of over 13% to Model-A.
8.2.5. Scenario-5
In Scenario-5, the models were trained on CASME II and evaluated on SAMM. Compared to Scenario-4, where SAMM was also employed for evaluation, there is a significant decrease in the accuracies of between 7% and 20% for the three models. Reasons for this may be that CASME II contains only Asian subjects and therefore generalizes less accurately for other people. In addition, CASME II has a high data imbalance.
All three models perform almost identically in Scenario-5 with a slight edge: Model-A is 0.5% higher than Model-B and 1.7% higher than Model-C.
8.2.6. Scenario-6
The SMIC dataset was used for training in Scenario-6 and CASME II was used for evaluating the model. Model-A again outperforms the two others with 44.7% accuracy, which is 1.0% and 5.6% higher in comparison with Model-B and Model-C, respectively.
In contrast to Scenario-2, where intra-dataset evaluation was performed for CASME II, the model trained on SMIC has to cope with a drop of 11.8%.
It can be observed that all models trained on SMIC perform similarly well on the different test sets. The accuracy of Model-A on the intra-dataset in Scenario-1 is 43.7%, while in Scenario-4 on SAMM, it is 44.3%. Such balanced results are found only with the model trained on SMIC. Due to the comparatively high number of samples of 164, the different ethnicities of the subjects, and a relatively balanced class distribution, the networks trained on SMIC show the best generalization and do not vary strongly across the datasets, which would be an indicator for a bias in the training data.
8.2.7. Scenario-7
In this scenario, the training was performed on CASME II and evaluation was performed on SMIC. The performances of all three models are comparable with only a difference of 2.3% between the worst and the best. Model-A ranks again first with an accuracy of 37.7%.
The drop of Model-A in Scenario-7 is kept within limits at 6% compared to the model trained on SMIC (Scenario-1). Nevertheless, if we examine all three models trained on CASME II, it is noticeable that the results differ heavily depending on the test set. Here, again, the lack of diversity and the class imbalance problem of CASME II become obvious. The intra-dataset experiment (Scenario-2) performs about 20 % better than testing on SMIC (Scenario-7), which is in turn around 13% better than on SAMM (Scenario-5). Overall, it appears that CASME II contains high levels of bias, and therefore, the models trained on it have limited ability to cope with other data.
8.2.8. Scenario-8
Scenario-8 along with Scenario-5 contain the worst results across all eight experiments. Here, again, testing is completed on SAMM, but here, the training is carried out on the combined dataset of SMIC and CASME II. This scenario forms an exception, because it is the only scenario not dominated by Model-A. Model-C clearly performs better here with 36.9% compared with Model-A’s 27.1%.
Comparing the results of Model-A, CASME II seems to have a greater impact on training the model. Through the combination, the accuracy compared to training solely on CASME II can increase from 24.8% to 27.1%. However, this still leaves a large gap with the SMIC trained model in Scenario-4, where the accuracy is 17.2% higher. This confirms the conclusions drawn in Scenario-7 that CASME II is only limitedly qualified for the implementation of models with a high degree regarding generalization ability.
9. Applications and Use Cases
Micro-expressions play an important role in applications of lie detection, person authentication, and many more. For instance, in an interrogation, facial micro-expressions of the criminal can assist the police in convicting him. Another use case is that border guards can use them to identify unusual behavior of persons during border control [41]. Moreover, knowing a patient’s true feelings is considered to be very helpful for psychotherapists while treating their patients. Furthermore, micro-expression can also be used in the field of marketing to understand people’s reactions and comments to the company’s advertisements, goods and services [41].
10. Conclusions
In this work, we proposed a novel 3D CNN architecture capable of extracting features from both spatial as well as temporal dimensions simultaneously. Especially in micro-expression recognition, these combined spatio-temporal features are crucial for the subsequent performance of the network. In order to improve the input sequence selection, a pre-processing technique was introduced to select the Apex frame sequence from the video, which is the part with the most visible emotions. This Apex frame sequence shows better results than picking the first or a random starting frame from the video. Another benefit of our pre-processing is that for samples with short videos, the first and last frame will be interpolated to meet the fixed-lenght input criteria so that they do not need to be discarded.
In addition, an extensive experimental evaluation was performed in our work, which is unprecedented in the state of the art for micro-expression recognition. To conduct this comparison, two state-of-the-art models were reimplemented, and intra-dataset as well as cross-dataset experiments were executed on the three datasets: CASME II, SMIC, and SAMM across a total of eight different evaluation scenarios. In addition, a stratified K-fold evaluation was proposed and adopted, since in a classical train–test split comparison, the performance varies strongly depending on the split chosen and the samples included for training and testing, making the results not meaningful. Our proposed Model-A was able to outperform the other two state-of-the-art architectures in seven out of eight evaluation scenarios, clearly demonstrating the superiority of our network. The highest accuracy of 88.2% is shown in the intra-dataset validation in Scenario-3, where the CASME II and SMIC datasets were merged.
Overall, in particular, the cross-dataset results of consistently below 50% accuracy exhibit great potential for improvement. Specifically, the CASME II dataset reveals that it is not suitable for achieving a network with a high degree of generalization ability. The lack of diversity in the subjects’ origin countries and the class imbalance between the samples lead to a severe performance drop on other datasets. In comparison, SMIC is well suited for achieving consistent results on a variety of data, but results also need to be further improved. Especially, the different ethnicities (Africa, Asia, and Caucasian) of the subjects and the class distribution are good, but the frame rate of 100 FPS and the total number of 164 samples are not high enough. Even though the results seem comparatively poor and irrelevant at first glance, they show an unvarnished, fair and reproducible comparison which allows existing challenges and future work to be identified for the field of micro-expression recognition. In this regard, the main task for the future is the acquisition of new large databases with a high level of annotation quality. Thereby, SMIC can provide good preliminary knowledge on how to set up and accomplish this dataset recording. In addition, generative adversarial networks might be able to contribute to the collection of these additionally required amounts of data. In recent years, these could be successfully exploited in many areas of deep learning to enhance the available data.
Author Contributions
Conceptualization, K.K.T. and M.-A.F.; methodology, K.K.T. and M.-A.F.; software, K.K.T. and M.-A.F.; validation, K.K.T. and M.-A.F.; formal analysis, K.K.T. and M.-A.F.; investigation, K.K.T. and M.-A.F.; resources, K.K.T. and M.-A.F.; data curation, K.K.T. and M.-A.F.; writing—original draft preparation, K.K.T. and M.-A.F.; writing—review and editing, K.K.T., M.-A.F. and A.A.-H.; visualization, K.K.T. and M.-A.F.; supervision, A.A.-H.; project administration, A.A.-H.; funding acquisition, A.A.-H. All authors have read and agreed to the published version of the manuscript.
Funding
This work was supported by the German Research Foundation (DFG) under grants AL 638/13-1 and AL 638/14-1.
Institutional Review Board Statement
Ethical review and approval were waived for this study due to the use of public databases, which were conducted according to the guidelines of the Declaration of Helsinki and approved by the relevant review boards. We complied with the terms of use of the databases regarding the publication of data.
Informed Consent Statement
According to the documentation of the used public databases, informed consent was obtained from all subjects involved.
Data Availability Statement
The SAMM, SMIC, and CASME II datasets are publicly not available. To obtain access to these datasets, please write an email to the corresponding authors, and the access procedures to these datasets are mentioned in the respective links: the SAMM dataset can be obtained at http://www2.docm.mmu.ac.uk/STAFF/m.yap/dataset.php (accessed on 23 December 2021); the SMIC datasets can be obtained at https://www.oulu.fi/en/university/faculties-and-units/faculty-information-technology-and-electrical-engineering/center-machine-vision-and-signal-analysis (accessed on 22 December 2021); the CASME II dataset can be obtained at http://fu.psych.ac.cn/CASME/casme2-en.php (accessed on 23 February 2022).
Conflicts of Interest
The authors declare no conflict of interest.
Abbreviations
The following abbreviations are used in this manuscript:
| 3D CNN | 3D Convolutional Neural Networks |
| 3DHOG | 3D Histogram-Oriented Gradients |
| ANN | Artificial Neural Networks |
| AU | Action Unit |
| CASME | Chinese Academy of Sciences Micro-Expression |
| CASME II | Chinese Academy of Sciences Micro-Expression II |
| CNN | Convolutional Neural Networks |
| EVM | Eulerian Video Magnification |
| FACS | Facial Action Coding System |
| FPS | Frames per second |
| HOG | Histogram of Gradients |
| LBP | Local Binary Pattern |
| LBP-TOP | Local Binary Pattern histograms from Three Orthogonal Planes |
| LSTM | Long Short-Term Memory |
| MMOD | max-margin object-detection algorithm |
| ReLU | Rectified Linear Unit |
| ROI | Region of Interest |
| SAM | Self-Assessment Manikins |
| SAMM | Spontaneous Actions and Micro-Movements |
| SGD | Stochastic Gradient Descent |
| SMIC | Spontaneous Micro-Expression Corpus |
| SVM | Support Vector Machine |
| TIM | Temporal interpolation model |
References
- Yan, W.J.; Wu, Q.; Liang, J.; Chen, Y.H.; Fu, X. How fast are the leaked facial expressions: The duration of micro-expressions. J. Nonverbal Behav. 2013, 37, 217–230. [Google Scholar] [CrossRef]
- Ekman, P. Darwin, deception, and facial expression. Ann. N. Y. Acad. Sci. 2003, 1000, 205–221. [Google Scholar] [CrossRef]
- Haggard, E.A.; Isaacs, K.S. Micromomentary facial expressions as indicators of ego mechanisms in psychotherapy. In Methods of Research in Psychotherapy; The Century Psychology Series; Springer: Boston, MA, USA, 1966; pp. 154–165. [Google Scholar] [CrossRef]
- Ekman, P.; Friesen, W.V. Nonverbal leakage and clues to deception. Psychiatry 1969, 32, 88–106. [Google Scholar] [CrossRef] [PubMed]
- Endres, J.; Laidlaw, A. Micro-expression recognition training in medical students: A pilot study. BMC Med. Educ. 2009, 9, 1–6. [Google Scholar] [CrossRef] [PubMed]
- Huang, X.; Wang, S.J.; Zhao, G.; Piteikainen, M. Facial micro-expression recognition using spatiotemporal local binary pattern with integral projection. In Proceedings of the 2015 IEEE International Conference on Computer Vision Workshop (ICCVW), Santiago, Chile, 7–13 December 2015; pp. 1–9. [Google Scholar]
- Liu, Y.J.; Zhang, J.K.; Yan, W.J.; Wang, S.J.; Zhao, G.; Fu, X. A main directional mean optical flow feature for spontaneous micro-expression recognition. IEEE Trans. Affect. Comput. 2015, 7, 299–310. [Google Scholar] [CrossRef]
- Wang, Y.; See, J.; Phan, R.C.W.; Oh, Y.H. Lbp with six intersection points: Reducing redundant information in lbp-top for micro-expression recognition. In ACCV 2014: Computer Vision—ACCV 2014; Lecture Notes in Computer Science Book Series; Springer: Cham, Switzerland, 2015; pp. 525–537. [Google Scholar]
- Guo, J.; Zhou, S.; Wu, J.; Wan, J.; Zhu, X.; Lei, Z.; Li, S.Z. Multi-modality network with visual and geometrical information for micro emotion recognition. In Proceedings of the 2017 12th IEEE International Conference on Automatic Face & Gesture Recognition (FG 2017), Washington, DC, USA, 30 May–3 June 2017; pp. 814–819. [Google Scholar]
- Liong, S.T.; Gan, Y.S.; Yau, W.C.; Huang, Y.C.; Ken, T.L. Off-apexnet on micro-expression recognition system. arXiv 2018, arXiv:1805.08699. [Google Scholar]
- Patel, D.; Hong, X.; Zhao, G. Selective deep features for micro-expression recognition. In Proceedings of the 2016 23rd International Conference on Pattern Recognition (ICPR), Cancun, Mexico, 4–8 December 2016; pp. 2258–2263. [Google Scholar]
- Li, J.; Wang, Y.; See, J.; Liu, W. Micro-expression recognition based on 3D flow convolutional neural network. Pattern Anal. Appl. 2019, 22, 1331–1339. [Google Scholar] [CrossRef]
- Khor, H.Q.; See, J.; Phan, R.C.W.; Lin, W. Enriched long-term recurrent convolutional network for facial micro-expression recognition. In Proceedings of the 2018 13th IEEE International Conference on Automatic Face & Gesture Recognition (FG 2018), Xi’an, China, 15–19 May 2018; pp. 667–674. [Google Scholar]
- Kim, D.H.; Baddar, W.J.; Jang, J.; Ro, Y.M. Multi-objective based spatio-temporal feature representation learning robust to expression intensity variations for facial expression recognition. IEEE Trans. Affect. Comput. 2017, 10, 223–236. [Google Scholar] [CrossRef]
- Wang, L.; Jia, J.; Mao, N. Micro-Expression Recognition Based on 2D-3D CNN. In Proceedings of the 2020 39th Chinese Control Conference (CCC), Shenyang, China, 27–29 July 2020; pp. 3152–3157. [Google Scholar]
- Polikovsky, S.; Kameda, Y.; Ohta, Y. Facial micro-expressions recognition using high speed camera and 3D-gradient descriptor. In Proceedings of the 3rd International Conference on Imaging for Crime Detection and Prevention (ICDP 2009), London, UK, 3 December 2009. [Google Scholar]
- Polikovsky, S.; Kameda, Y.; Ohta, Y. Facial micro-expression detection in hi-speed video based on facial action coding system (FACS). IEICE Trans. Inf. Syst. 2013, 96, 81–92. [Google Scholar] [CrossRef]
- Pfister, T.; Li, X.; Zhao, G.; Pietikäinen, M. Recognising spontaneous facial micro-expressions. In Proceedings of the 2011 International Conference on Computer Vision, Barcelona, Spain, 6–13 November 2011; pp. 1449–1456. [Google Scholar]
- Lu, H.; Kpalma, K.; Ronsin, J. Motion descriptors for micro-expression recognition. Signal Process. Image Commun. 2018, 67, 108–117. [Google Scholar] [CrossRef]
- Shreve, M.; Godavarthy, S.; Goldgof, D.; Sarkar, S. Macro-and micro-expression spotting in long videos using spatio-temporal strain. In Proceedings of the 2011 IEEE International Conference on Automatic Face & Gesture Recognition (FG), Santa Barbara, CA, USA, 21–25 March 2011; pp. 51–56. [Google Scholar]
- Wang, Y.; Yu, H.; Stevens, B.; Liu, H. Dynamic facial expression recognition using local patch and LBP-TOP. In Proceedings of the 2015 8th International Conference on Human System Interaction (HSI), Warsaw, Poland, 25–27 June 2015; pp. 362–367. [Google Scholar]
- Liong, S.T.; Gan, Y.S.; See, J.; Khor, H.Q.; Huang, Y.C. Shallow Triple Stream Three-dimensional CNN (STSTNet) for Micro-expression Recognition. In Proceedings of the 2019 14th IEEE International Conference on Automatic Face & Gesture Recognition (FG 2019), Lille, France, 14–18 May 2019; pp. 1–5. [Google Scholar]
- Reddy, S.P.T.; Karri, S.T.; Dubey, S.R.; Mukherjee, S. Spontaneous facial micro-expression recognition using 3D spatiotemporal convolutional neural networks. In Proceedings of the 2019 International Joint Conference on Neural Networks (IJCNN), Budapest, Hungary, 14–19 July 2019; pp. 1–8. [Google Scholar]
- Zhang, H.; Liu, B.; Tao, J.; Lv, Z. Facial Micro-Expression Recognition Based on Multi-Scale Temporal and Spatial Features. In Proceedings of the ICMI ’21: International Conference on Multimodal Interaction, Montreal, QC, Canada, 18–22 October 2021; pp. 80–84. [Google Scholar]
- Jin, W.; Meng, X.; Wei, D.; Lei, W.; Xinran, W. Micro-expression recognition algorithm based on the combination of spatial and temporal domains. High Technol. Lett. 2021, 27, 303–309. [Google Scholar]
- Xu, W.; Zheng, H.; Yang, Z.; Yang, Y. Micro-Expression Recognition Base on Optical Flow Features and Improved MobileNetV2. KSII Trans. Internet Inf. Syst. (TIIS) 2021, 15, 1981–1995. [Google Scholar]
- Wu, C.; Guo, F. TSNN: Three-Stream Combining 2D and 3D Convolutional Neural Network for Micro-Expression Recognition. IEEJ Trans. Electr. Electron. Eng. 2021, 16, 98–107. [Google Scholar] [CrossRef]
- Wang, Y.; Ma, H.; Xing, X.; Pan, Z. Eulerian Motion Based 3DCNN Architecture for Facial Micro-Expression Recognition. In International Conference on Multimedia Modeling; Lecture Notes in Computer Science; Springer: Cham, Switzerland, 2020; pp. 266–277. [Google Scholar]
- Chen, B.; Liu, K.H.; Xu, Y.; Wu, Q.Q.; Yao, J.F. Block Division Convolutional Network with Implicit Deep Features Augmentation for Micro-Expression Recognition. IEEE Trans. Multimed. 2022; early access. [Google Scholar] [CrossRef]
- Liong, S.T.; See, J.; Wong, K.; Phan, R.C.W. Less is more: Micro-expression recognition from video using apex frame. Signal Process. Image Commun. 2018, 62, 82–92. [Google Scholar] [CrossRef]
- Li, J.; Wang, T.; Wang, S.J. Facial micro-expression recognition based on deep local-holistic network. Appl. Sci. 2022, 12, 4643. [Google Scholar] [CrossRef]
- Yan, W.J.; Li, X.; Wang, S.J.; Zhao, G.; Liu, Y.J.; Chen, Y.H.; Fu, X. CASME II: An improved spontaneous micro-expression database and the baseline evaluation. PLoS ONE 2014, 9, e86041. [Google Scholar] [CrossRef]
- Li, X.; Pfister, T.; Huang, X.; Zhao, G.; Pietikäinen, M. A spontaneous micro-expression database: Inducement, collection and baseline. In Proceedings of the 2013 10th IEEE International Conference and Workshops on Automatic Face and Gesture Recognition (FG), Shanghai, China, 22–26 April 2013; pp. 1–6. [Google Scholar]
- Davison, A.K.; Lansley, C.; Costen, N.; Tan, K.; Yap, M.H. Samm: A spontaneous micro-facial movement dataset. IEEE Trans. Affect. Comput. 2016, 9, 116–129. [Google Scholar] [CrossRef]
- King, D.E. Dlib-ml: A Machine Learning Toolkit. J. Mach. Learn. Res. 2009, 10, 1755–1758. [Google Scholar]
- Oh, Y.H.; See, J.; Le Ngo, A.C.; Phan, R.C.W.; Baskaran, V.M. A survey of automatic facial micro-expression analysis: Databases, methods, and challenges. Front. Psychol. 2018, 9, 1128. [Google Scholar] [CrossRef]
- Liong, S.T.; See, J.; Wong, K.; Le Ngo, A.C.; Oh, Y.H.; Phan, R. Automatic apex frame spotting in micro-expression database. In Proceedings of the 2015 3rd IAPR Asian Conference on Pattern Recognition (ACPR), Kuala Lumpur, Malaysia, 3–6 November 2015; pp. 665–669. [Google Scholar]
- Yan, W.J.; Chen, Y.H. Measuring dynamic micro-expressions via feature extraction methods. J. Comput. Sci. 2018, 25, 318–326. [Google Scholar] [CrossRef]
- Ma, H.; An, G.; Wu, S.; Yang, F. A region histogram of oriented optical flow (RHOOF) feature for apex frame spotting in micro-expression. In Proceedings of the 2017 International Symposium on Intelligent Signal Processing and Communication Systems (ISPACS), Xiamen, China, 6–9 November 2017; pp. 281–286. [Google Scholar]
- Jiao, Y.; Jing, M.; Hu, Y.; Sun, K. Research on a Micro-Expression Recognition Algorithm based on 3D-CNN. In Proceedings of the 2021 3rd International Conference on Intelligent Control, Measurement and Signal Processing and Intelligent Oil Field (ICMSP), Xi’an, China, 23–25 July 2021; pp. 221–225. [Google Scholar]
- Takalkar, M.; Xu, M.; Wu, Q.; Chaczko, Z. A survey: Facial micro-expression recognition. Multimed. Tools Appl. 2018, 77, 19301–19325. [Google Scholar] [CrossRef]


Publisher’s Note: MDPI stays neutral with regard to jurisdictional claims in published maps and institutional affiliations. |
© 2022 by the authors. Licensee MDPI, Basel, Switzerland. This article is an open access article distributed under the terms and conditions of the Creative Commons Attribution (CC BY) license (https://creativecommons.org/licenses/by/4.0/).