Article

An Anomaly Detection Framework for Twitter Data

by
Sandeep Kumar
1,
Muhammad Badruddin Khan
2,
Mozaherul Hoque Abul Hasanat
2,
Abdul Khader Jilani Saudagar
2,*,
Abdullah AlTameem
2 and
Mohammed AlKhathami
2
1
Department of Computer Science and Engineering, CHRIST (Deemed to be University), Bangalore 560074, India
2
Information Systems Department, College of Computer and Information Sciences, Imam Mohammad Ibn Saud Islamic University (IMSIU), Riyadh 11432, Saudi Arabia
*
Author to whom correspondence should be addressed.
Appl. Sci. 2022, 12(21), 11059; https://doi.org/10.3390/app122111059
Submission received: 25 August 2022 / Revised: 28 September 2022 / Accepted: 1 October 2022 / Published: 1 November 2022
(This article belongs to the Special Issue Information Retrieval in Health)

Abstract

:
An anomaly indicates something unusual, related to detecting a sudden behavior change, and is also helpful in detecting irregular and malicious behavior. Anomaly detection identifies unusual events, suspicious objects, or observations that differ significantly from normal behavior or patterns. Discrepancies in data can be observed in different ways, such as outliers, standard deviation, and noise. Anomaly detection helps us understand the emergence of specific diseases based on health-related tweets. This paper aims to analyze tweets to detect the unusual emergence of healthcare-related tweets, especially pre-COVID-19 and during COVID-19. After pre-processing, this work collected more than 44 thousand tweets and performed topic modeling. Non-negative matrix factorization (NMF) and latent Dirichlet allocation (LDA) were deployed for topic modeling, and a query set was designed based on resultant topics. This query set was used for anomaly detection using a sentence transformer. K-means was also employed for clustering outlier tweets from the cleaned tweets based on similarity. Finally, an unusual cluster was selected to identify pandemic-like healthcare emergencies. Experimental results show that the proposed framework can detect a sudden rise of unusual tweets unrelated to regular tweets. The new framework was employed in two case studies for anomaly detection and performed with 78.57% and 70.19% accuracy.

1. Introduction

The number of people using social media has rapidly increased, especially in the last decade. Over the preceding year, Facebook, Twitter, YouTube, Linked In, and Pinterest saw significant growth. Facebook is the most popular social media network, with more than 2.9 billion monthly active users, whereas Twitter has around 400 million monthly active users and sends out up to 500 million tweets daily (Source: https://datareportal.com/social-media-users accessed on 14 August 2022); these data are increasing exponentially. Twitter is rapidly gaining popularity around the world and is experiencing rapid growth. Certain users use the Twitter interface to support various opinions, such as a platforms for fighting, information, and social mission dissemination; as well, it plays an increasingly important role in societal development. Social network analysis (SNA) is becoming an essential component for gauging the mood and behavior of the public. Researchers are currently studying social media posts to predict or achieve results. Social media is excellent for expressing feelings, thoughts, and opinions. Twitter is one of the most widely used social media platforms, allowing users to publish whatever they want. It allows users to express themselves authentically and in real-time. Detecting anomalies in social media is essential to prevent malicious activities such as stalking, planning terrorist attacks, and spreading fraudulent information. Guarino et al. [1] proposed a sentence embedding method based on machine learning for privacy awareness to social media users. Mao et al. [2] raised the same issue and identified different types of privacy leaks and later developed an automated classifier for them. With the recent popularity of social media, new types of abnormal behavior are emerging, raising concerns from various parties. While much work has been devoted to traditional anomaly detection problems, we see an increased research interest in the new area of social media anomaly detection [3].
Social media is a prime source of recent information, and Twitter is one of the most popular social outlets. Analyzing tweets indicates usual and unusual events happening in society as people react quickly to new events on Twitter. Savage et al. [4] presented a detailed review of existing anomaly detection techniques and developed a five-point process for anomaly detection. While detecting an anomaly, a complex task is to define the normal behavior. The growing popularity of social media means that many social networks have become substantial prey for malicious people who illegally cause mental and financial harm to the users of these systems. Recently, humanity has faced severe threats from deadly diseases such as severe acute respiratory syndrome (SARS) in 2004, the H1N1pdm09 virus in 2009, and COVID-19 in late 2019. These diseases are highly infectious. COVID-19 covered the whole world in a short period. At the beginning of COVID-19, people started posting tweets about health issues such as breathing, lung problems, cough, and fever. An analysis of tweets from November-December 2019 indicates a sudden change in health-related tweets.
The main motivation for this paper is that during the COVID-19 pandemic period there was no direct/physical communication among public and government functionaries. To bridge this gap this paper focuses on detecting unusual tweet patterns in health-related posts. We propose a framework for the same. Casalino et al. [5] worked on a similar problem and created a dataset of tweets followed by preprocessing steps and NMF decomposing and topics extracted after cluster analysis, while we used topic modelling methods after pre-processing followed by BERT sentence transformer for anomaly detection. Anomaly has different definitions, but a widely accepted definition of anomaly is given by Hawkins [6]: “An anomaly is an observation which deviates so much from other observations as to arouse suspicions that a different mechanism generated it.” The significant research contributions of this work are as follows:
  • Collected 44,162 tweets using Tweepy API and created a dataset (available at https://github.com/sandpoonia/Twitter_Anomaly accessed on 18 September 2022).
  • Performed topic modeling using NMF and LDA to obtain the most dominant tweets.
  • Created a query set using most frequent words detected by topic modeling.
  • BERT model deployed for anomaly detection.
  • Two case study evaluated using the proposed framework.
The rest of the paper is organized as follows: Section 2 discusses recent developments of anomaly detection. Section 3 proposes a framework for analyzing tweets collected from Twitter and discussed each step in detail. Section 4 and Section 5 discuss the prediction performed and analysis of results for two case studies. Section 6 contains discussion on results and limitations of the work. Section 7 concludes and opens some future research directions.

2. Literature Review

Anomalous data are usually associated with rare events or problems, such as natural disasters, equipment malfunctions, the emergence of a new disease, bank fraud, hacking, and more. For this reason, it is crucial from a business viewpoint to identify true anomalies. When investigating anomalous data, the investigator will undoubtedly encounter some noise, resulting in strange behavior. The border between normal and aberrant behavior is frequently blurred and can vary as malicious attackers refine their techniques over time. Many data patterns are affected by seasonality and time, and anomaly detection systems have additional complexity. For example, breaking down trends throughout time necessitates more advanced methodologies for identifying fundamental changes in seasonal vs. noisy or heterogeneous data. As a result, there are numerous anomaly detection strategies. Depending on the conditions, one may be preferable to another for a specific person or data set. A generative technique constructs a model from typical data samples from training and then examines each test case to see how well it fits the model. On the other hand, a discriminating technique distinguishes between normal and abnormal data groups. Both forms of data are used to train the algorithm discriminately [7].
Anomaly detection techniques are mainly divided into clustering-based, density-based, and classification-based methods. Clustering-based techniques are popularly used in unsupervised learning. This method uses clustering algorithms such as K-means to create a cluster of similar data points. These methods are not helpful for data that evolve. Density-based methods work for labeled data. These anomalies are detected using K-nearest neighbor (k-NN) and local outlier factor (LOF) methods. These methods are mainly based on distance. The third type of method is classification-based approaches such as using a support vector machine (SVM).
Ahmed et al. [7] analyzed four essential anomaly detection categories: clustering, classification, statistical, and information theory-based techniques. Ahmed et al. [7] identified anomaly detection issues such as defining normal behavior, lack of universally applicable anomaly detection techniques, lack of publicly available labeled datasets, and difficulty segregating noisy data. Defining normal behavior is a significant problem in anomaly detection as it continuously evolves and may not be expected in the long term. There is a need for more contemporary and refined techniques to tackle these issues. Ahmed et al. [7] focused on network anomaly detection and mapped attacks with anomalies. Patcha and Park [8] detected anomalies in the network. Here, we discuss various methods for anomaly detection, including machine learning (ML)-based techniques. Additionally, Patcha and Park [8] highlighted that outlier detection is also useful in this process with clustering.
Alatawi and Aljuhani [9] detected anomalies to counter cyber-attacks. The new framework deployed several methods for feature selection to improve classification accuracy. Network traffic was analyzed using the ensemble learning method. Results indicate that feature selection helps in improving performance. Ragab and Sabir [10] proposed a new approach for anomaly detection in an intelligent environment. This work considered video frames for input and deployed an arithmetic optimization algorithm (AOA) for finetuning deep consensus network (DCN) parameters. Zhao et al. [11] proposed an approach for anomaly detection based on hierarchical deep learning in an industrial environment. Saqaeeyan et al. [12] proposed a probabilistic approach to detect anomalies in smart homes, using a Bayesian network to predict anomalous data by computing the probability of abnormality. Wang et al. [13] analyzed system logs and proposed an approach for log anomaly detection using Word2Vec to improve system performance.
Mujahid et al. [14] processed education-related tweets during COVID-19. This study covered all the stake-holders of the education system, including students, teachers, and parents. Mujahid et al. [14] established a pipeline for analyzing tweets and topic modeling. This research created its dataset with 17,155 tweets. It deployed TextBlob for computing sentiment score after pre-processing, a synthetic minority oversampling technique (SMOTE) for balancing dataset, bag-of-words (BoW) and term frequency-inverse document frequency (TF-IDF) for feature extraction. Latent semantic analysis (LSA) used for topic modeling and supervised ML models were deployed for classification. Lyu et al. [15] collected 1,499,421 tweets and deployed LDA for topic modeling. This study concluded that sentiments became positive over time, but it had a limitation in that it was not generalized in terms of geographical coverage.
Amen et al. [16] detected anomalous events with the help of a Twitter dataset using a distributed directed acyclic graph (DAG)-based framework. They used word embedding and clustering to detect an anomalous event. This work was conducted with limited testing. Yousefinaghani et al. [17] used Google search and social media to detect the COVID-19 wave, focusing on US and Canada, and identified the most influential symptoms and accurately predicted different waves. This study concluded that Google search is more effective than social media data. Kabir and Madria [18] developed a neural network (NN)-based model for emotion detection. Kabir and Madria [18] customized the phrase extraction model named EMOCOV. The proposed model may be extended for live applications. Gharavi et al. [19] detected an outbreak for COVID-19 using a tweet dataset and observed that tweet data allowed accurate predictions. Table 1 summarizes some of the recent research utilizing LDA and NMF for topic modeling.
Jónsson and Stolee [29] analyzed the performances of LDA, NMF and a biterm topic model (BTM) and some of their variants. Jónsson and Stolee concluded that LDA performed well but BTM outperformed it for short documents. It was observed in experiments that the traditional approach (LDA) constructed more legible topics in comparison to other considered methods. Casalino et al. [30] discussed a case study using NMF to find a correction between skills of student performance.
Our work deployed LDA, NMF, TF-IDF, and BERT for various activities. These methods are discussed in detail in subsequent sections. LDA was used for topic modeling with text. Based on words, this method was used to identify the topics a document contains. LDA is composed of two steps: first, words already known, and second, words related to a topic where the probability of belonging must be computed. Along with LDA, NMF is a popular statistical topic modeling approach based on factor analysis. NMF assigns weight to each word based on coherence.
TF-IDF computes the importance of a word in a given document and converts it into a vector with a numerical value. TF-IDF extracts the weighted features from a Tweet dataset and provides the weighting of each word in the corpus, which improves the learning feature of the model’s performance. BERT architecture is a collection of various transformer encoders stacks, and has a feed-forward layer and a self-attention layer. This method is used to find the relationship between the words of a sentence and divides them into two categories: normal and anomaly.

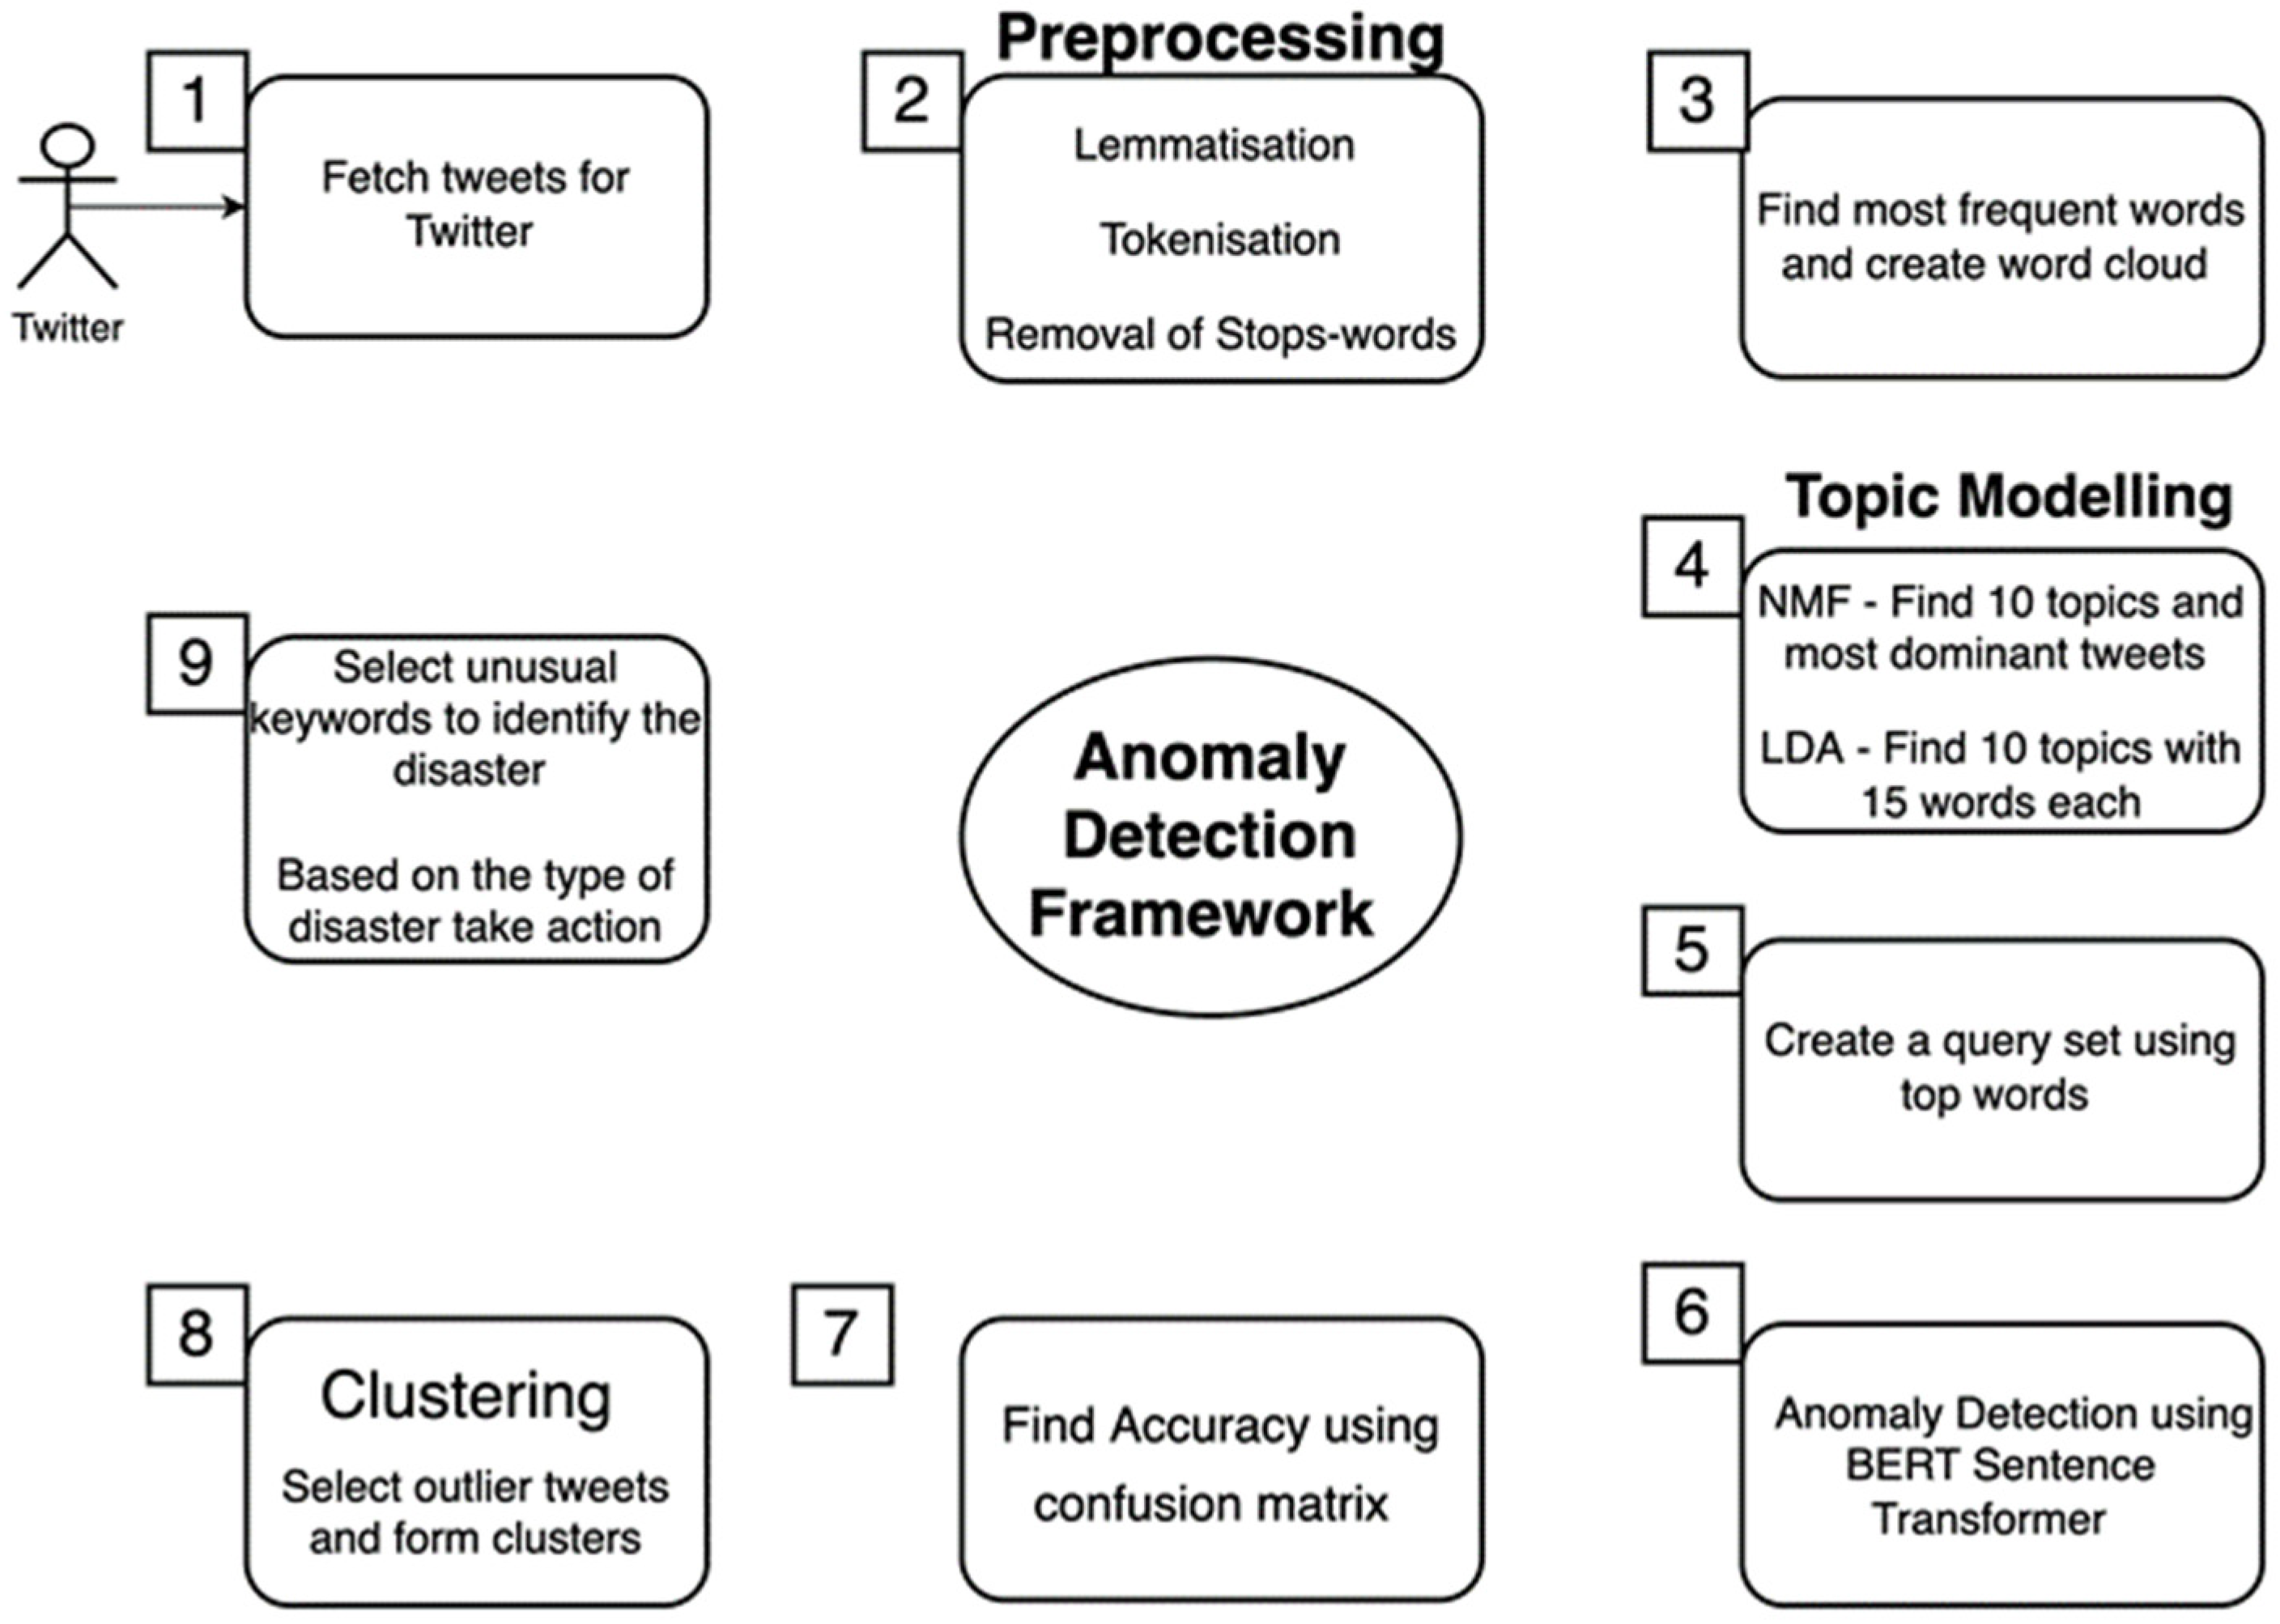
3. Social Media Data Analysis and Anomaly Detection

This paper proposes a framework to detect anomalies in social media data and preparations of a dataset by collecting tweets. The proposed anomaly detection framework is illustrated in Figure 1. The proposed work includes the creation of a dataset, preprocessing with lemmatization, tokenization, and stop-word removal. Later it identifies the most frequent word and performs topic modeling using NMF and LDA. In the next phase, a query set is created with the help of top words and a BERT sentence transformer is employed for anomaly detection. The proposed system includes the following steps:
  • Collection of tweets from Twitter
  • Pre-processing of data
  • Topic modeling
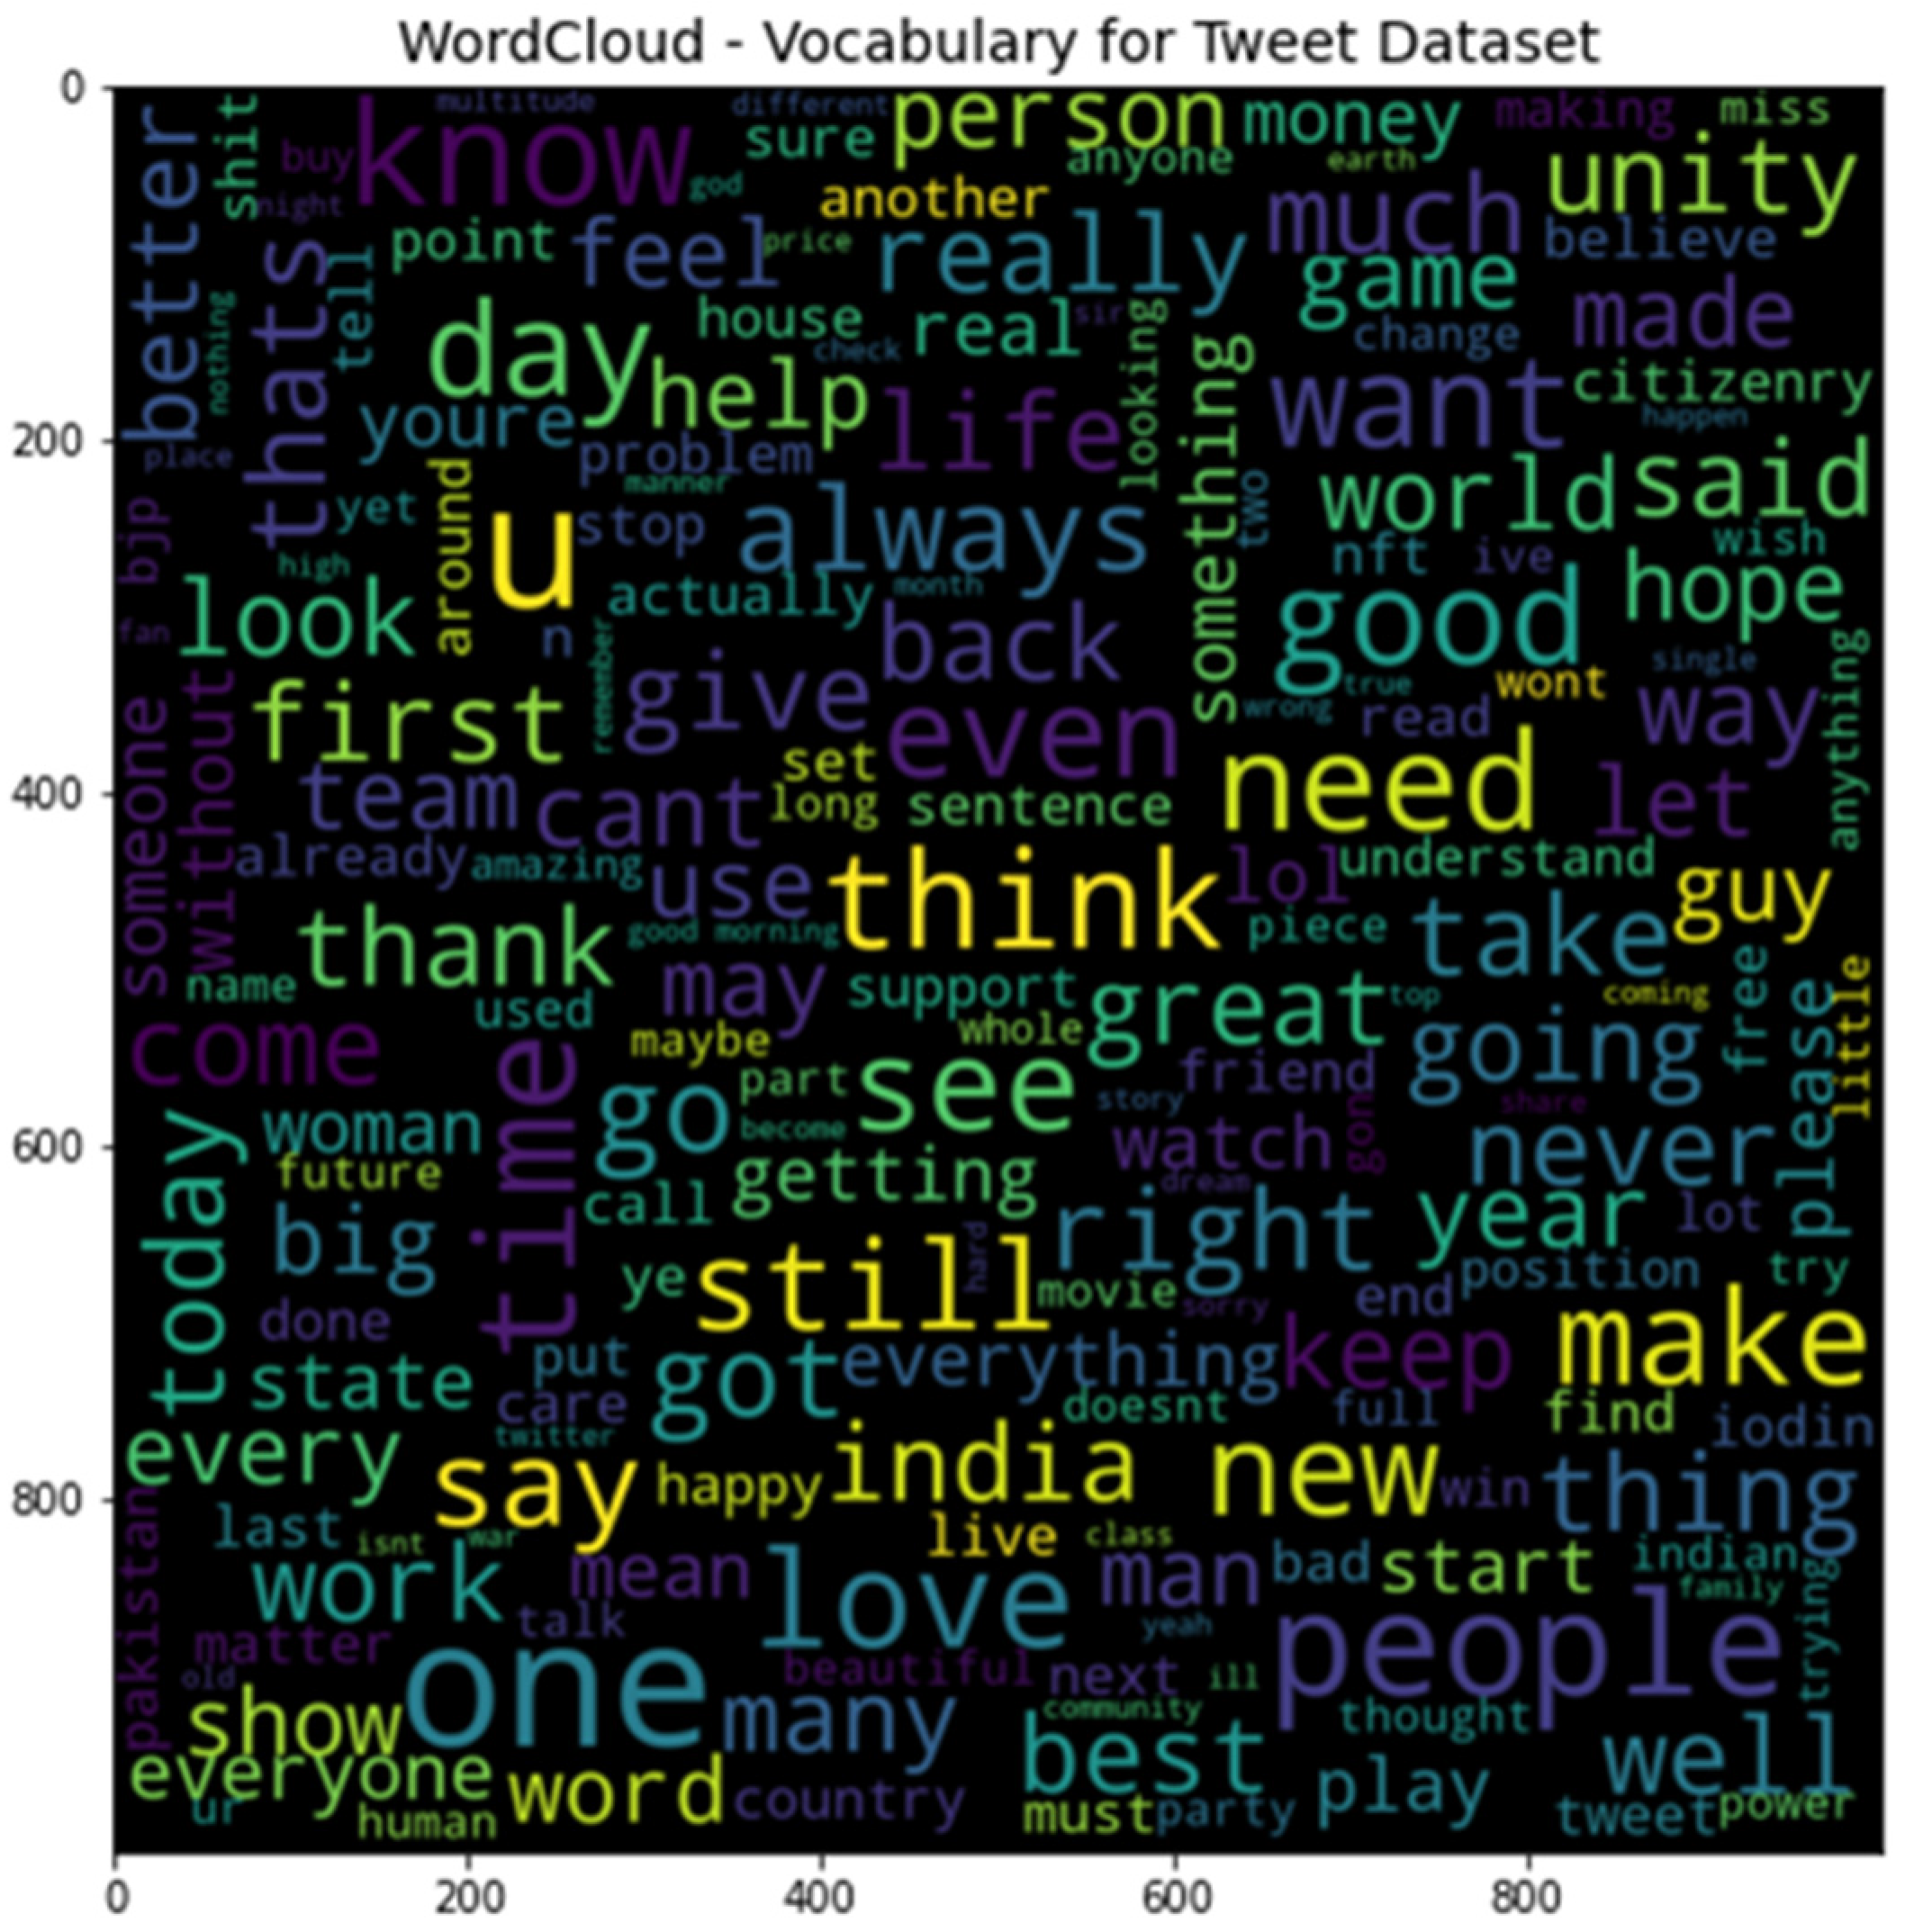
  • Collect the most frequently used words using topic modeling
  • Anomaly detection
  • Clustering using K-means
These steps are discussed in detail in subsequent sections.

3.1. Collection of Tweet Dataset from Twitter

The dataset was collected from a Twitter developer account using a Twitter API key and an access token key. Tweets were mainly general posts about happiness, sadness, likes, and dislikes containing 44,162 tweets. No specific keywords were used in the collection of this dataset. Table 2 shows some sample datasets with the corresponding location and date. The retrieved tweets have different fields, namely id, tweet_text, tweet_source, tweet_location, tweet_created_at, and tweet_retweet, tweet_like, username, hashtags, and mentions. These tweets mainly came from USA, India, UAE, UK, and Singapore.

3.2. Pre-Processing of Data

Pre-processing is an important step in model building for tweet data analysis. It includes tweet cleaning, tokenization, lower casing, stop-word removal, and lemmatization to remove excessive information to increase the accuracy of the learning process. Initially, tweet cleaning is performed on the tweet dataset, followed by removing links, HTML tags, HTTPS, hashtags, slashes, punctuation, and username. Once cleaned up, converting tweets into lower case diminishes the complexity of the feature set and splitting tweets into small chunks. Applying lemmatization techniques to create a homogeneous form of token words and removes stop words from cleaned tweets, which are not useful in construction for analysis. A word cloud is created to find the frequency of each term to analyze tweets for further process.
Figure 2 shows the most frequently appearing words across the datasets. Figure 3 depicts a visual representation of highlighted words based on their frequency and relevancy in the tweets. Table 3 shows the top 10 words that appear in the dataset with most frequency.

3.3. Topic Modeling

Topic modeling is a popular approach for recognizing the top word from a corpus of the tweet dataset, and is used to create a query set to find a similarity score with each tweet of the corpus. A pre-processed tweet dataset is used for topic modeling methods.
We used two topic modeling techniques, namely NMF and LDA. NMF is an unlabeled subject on which training is given. It factors a high dimensional vector into a low dimensional vector. This creates two matrices, W and H, for the subjects by term and by coefficients. LDA is used to map each document in the corpus with a set of topics and assign a probability to each document related to a topic.
The first step is to vectorize each tweet using the TF-IDF vectorizer. Once the tweets are converted into vectors, the second step uses NMF and LDA methods to extract the hidden topics from the large tweet dataset.
  • Topic modeling using NMF. This method is based on the dominant score of each topic, which is used to select topics with a higher score to form a query set. It involves finding the top 10 topics from the entire dataset, and each topic with the 15 most similar words. It obtains the leading topic for each tweet and finds the most relevant topic for each tweet. Based on the dominant score of each topic with each tweet, its finds the most dominant topics, which are ordinary tweets. These tweets are used to find anomalies in a new set of tweet datasets. The most dominant tweets from the entire dataset are selected that are most relevant to the above ten topics. Table 4 shows the top 10 topics; each has 15 words. Table 5 shows the sample’s most dominant tweets.
  • Topic modeling using LDA. This method is based on the weightage of each word in each topic. The top 10 topics from the entire dataset are found; each topic has 15 of the most similar words with their weightage. The most weighted topics are used to create a query string. Here most frequently used topics identified by topic modeling were: know, food, happy, fan, like, thank you, people, nice, really, time, great, love, today, strong, day, good morning, always, think, look, want, best, help, never, please, and make.
Table 4. Top 10 topics having 15 most similar words.
S. No.Topic
1know time people want make think see even go still say take would thing never
2good morning good morning dawn good dawn drink beautiful luck ka nice happy today water look everyone
3like look like feel feel like would like sound act something looking lol unity seems really
4one person one best another also right ever give best made top many buy last two
5love much always thank listen radio would playing happy channel unity fall art give birthday
6day nice every happy got today morning last great ka hope another beautiful drink start
7get check shopee get shopee free airdrop mx mar mx get airdrop mar rm soon mexcglobal participate well
8project best great team hope happy future nft labor really crypto thank community strong amazing
9need really help please stop india learn programming go much freelance hope unity business engagement
10new nft come india year live check news season start design next song update token
Table 5. Sample of most dominant tweets.
S. No.Tweet No.Tweets
1Tweet1389wonderful project best quality project currently running market hopefully project get success
2Tweet2841Shiba incredibly awesome project managed experienced promoter great success potential join get benefited airdrop electroshiba
3Tweet4824interesting project definitely going huge thank giving u great opportunity hope I’ll get reward from event project get moon giveaways airdrop
4Tweet18770aaronok answer question like anime unlike anime really emotionally attached anime main character understand motif that’s like alliance despite refiner one fav
5Tweet16857go ward half-hour early check bed select one disease prepared well guy allotted one bed make sure someone prepared test well
6Tweet12258specifically, Noida newsroom one Mumbai well
7Tweet15844buddy telling truth people rate last obviously toxic one solo one them why yall misunderstanding
8Tweet10068bunch known corrupt people unite one-man spare effort ridicule blackmail attempt assassinate character blindly follow one man Marcus
9Tweet18946happy see people masked getting grocery today last week one store wearing one
10Tweet9550bunch known corrupt people unite one-man spare attempt assassinate character blindly follow one man Marcus aurelias
The third step is to collect the most frequently generated words using the NMF and LDA topic modeling methods. The most frequent words using NMF and LDA topic modeling are shown in Table 6.

3.4. Anomaly Detection

Anomaly detection is a technique to identify some rare events or disasters based on suspicious observations, and identifies unusual tweets based on similarity scores to detect different types of disasters. The first step is to build a query set using the top words generated using the topic modelling described in the previous step. This query set is used to find the similarity score of each tweet. Then, the query set is created using the top word.
“Happy family listen music and voice looking good watch movies good food enjoy with fun successful and strong relation feel good I want help to new hope I know my friend I think the game is always for people first time see world dream still it takes time to save life people do not want or make today you will look good or better answer rightly agree success start wish night god beautiful family member movie student support strong great nice think already look birth everyday luck good news day-night always everyone play games it would be better feel India understand help feel free day time know people like listen love wish you a very happy birthday today thank you so much thanks to everyone for help friend good morning with good news congratulations for your success it’s really good reason for a person very true”.
The second step is finding the threshold value for anomaly tweets using the quartile formula. Each of the most dominant tweets is compared with the query set to find the similarity score of each tweet and the average cosine similarity of the most dominant tweets. The average cosine similarity is used as a threshold value.
The third step is to detect anomalies using the base bidirectional encoder representations from the transformers (BERT) model. The sentence-BERT model is used with its encoder to encode the query set and tweets and calculate the cosine similarity of each tweet with the query set with the help of the cosine formula.
c o s i n e t e x t 1 ,   t e x t 2 = P r o d u c t t e x t 1 , t e x t 2 v e c t o r   n o r m t e x t 1 v e c t o r   n o r m t e x t 2
Steps to follow the BERT anomaly detection:
  • Use a different set of tweets related to any disaster, analyze each tweet and assign, as usual, or anomaly tweet by human annotation.
  • Compare each tweet of a new set of tweets with the query set and find the cosine similarity score for each tweet. The similarity score of each tweet is compared with the threshold value, and tweets are categorized as normal and anomalous tweets.
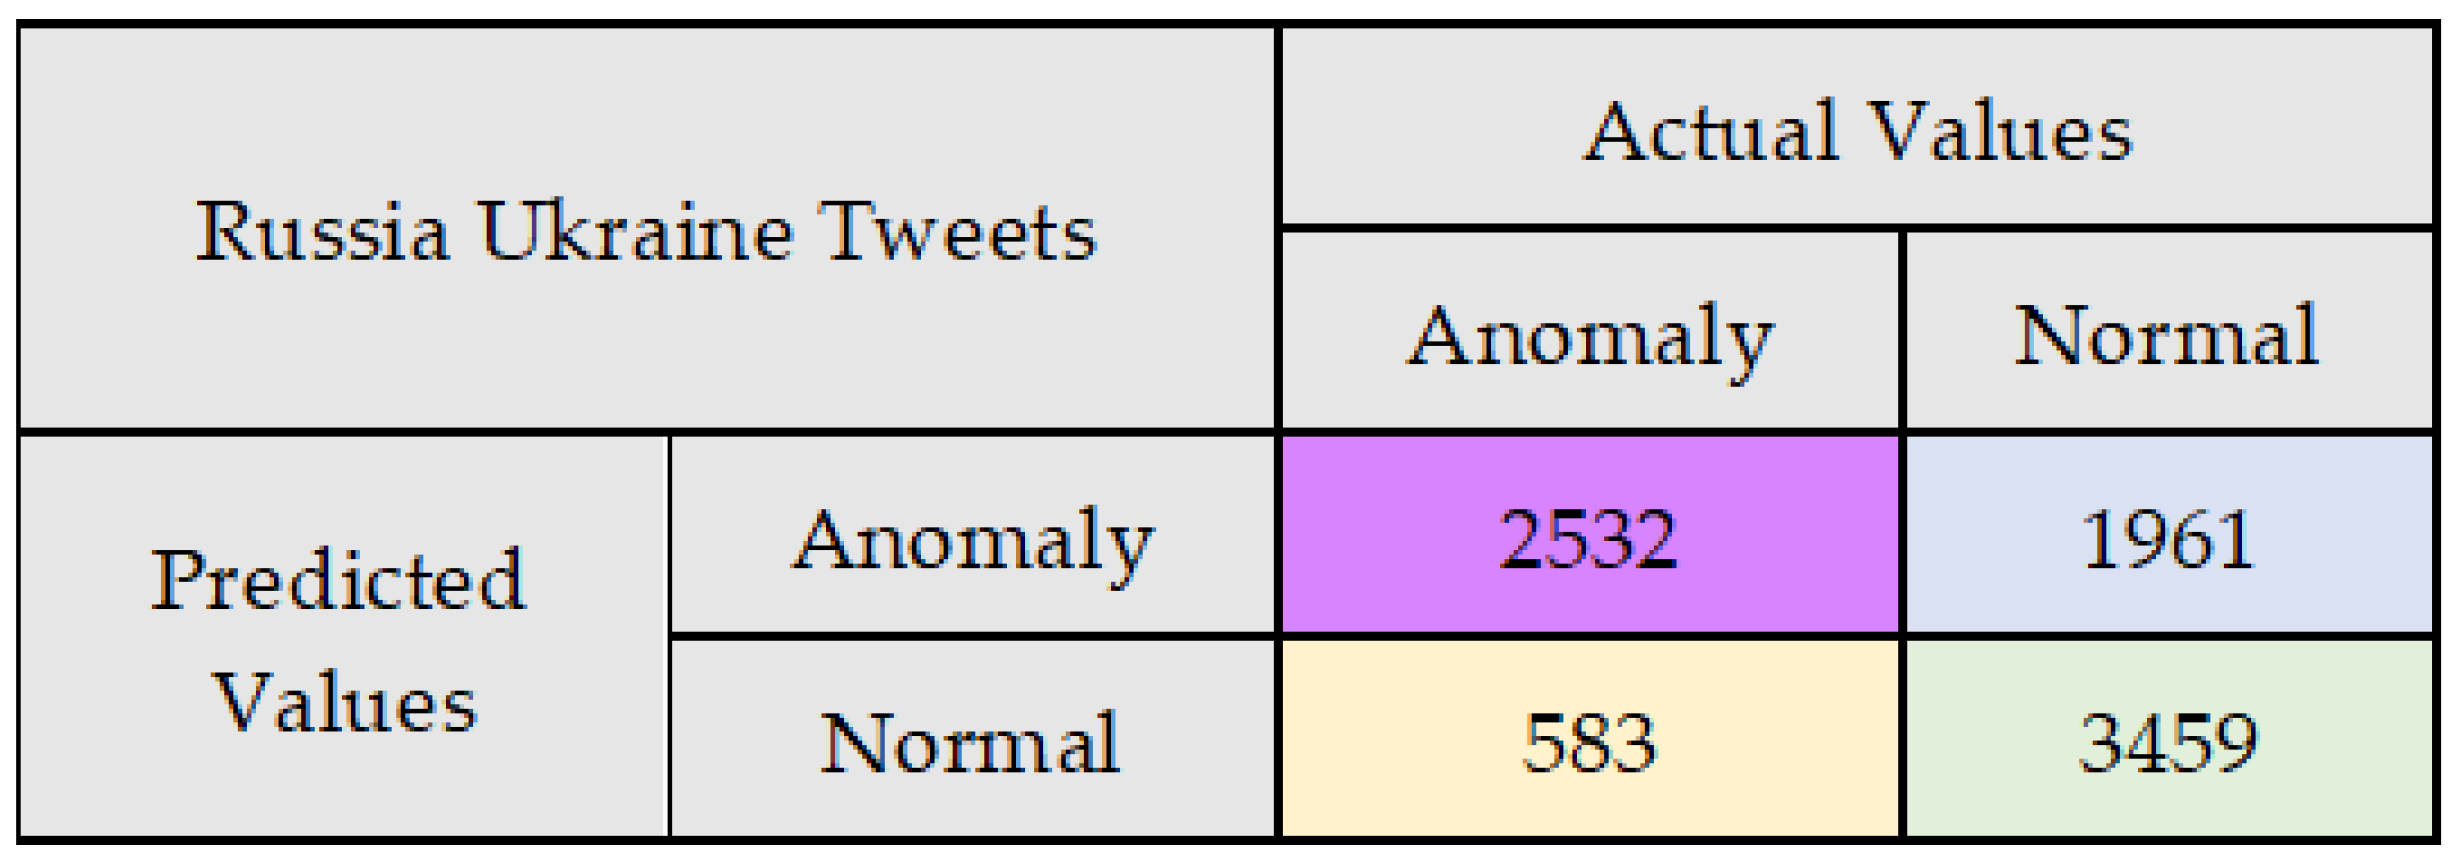
  • Compare the actual type of tweet with predicted values and find the accuracy score with the help of a confusion matrix.

3.5. Clustering Using K-Means

Clustering is a method of automatically finding natural clusters of datasets and annotating input tweets to the final cluster in a specified feature space. This involves dividing tweets into groups based on their similarity. Two clusters, Cluster 0 and Cluster 1, are created using the most dominant Tweets in this section. Both groups have some keywords related to happiness, betterment, hope, success, love, good, morning, growth, and development. Based on both clusters, it is found that all tweets are casual. Figure 4 shows the frequent words of cluster 0, and Figure 5 shows most frequent word of the most dominant tweets.

4. Case Study 1—Corona Virus Tweet Dataset

Once the query set was prepared, we detected anomalies in a new set of tweets. Here we used two different case studies. The first case involved tweets related to COVID-19, including some normal tweets. The process categorizes each tweet as anomalous or normal using human annotation. In the next step, the cosine similarity of each tweet is found using the BERT model. This similarity score is compared with a threshold value to decide the type of tweets. Tweets with a similarity score less than the threshold value are categorized as anomalous; otherwise, they are treated as normal tweets. Actual with predicted categories are compared to find recall, precision, F1 score, and accuracy. Table 7 shows five sample tweets from a corona virus tweet dataset with location and date of tweet.
The dataset was collected from a Twitter developer account using a Twitter API key and an access token key. Tweets were mainly related to COVID-19 containing 10,586 tweets. Table 7 shows some sample datasets with date of creation and location. The retrieved tweets have different fields, namely, tweet_text, tweet_created_at, tweet_source, tweet_retweet, tweet_like, and tweet_location.
The confusion matrix for this case study (Corona Virus Tweet Dataset) is depicted in Figure 6. The results are calculated by calculating the F1 score, precision, recall, and accuracy using Equations (2)–(9). The results show that the new framework detected anomalous data with 79% accuracy.
S e n s i t i v i t y   o r   R e c a l l = S u m   o f   a l l   T P   f o r   e a c h   c l a s s S u m   o f   a l l   T P + S u m   o f   a l l   F N
S e n s i t i v i t y   o r   R e c a l l = 4816 4816 + 1218 = 0.7981
P r e c i s i o n = S u m   o f   a l l   T P   f o r   e a c h   c l a s s S u m   o f   a l l   T P + S u m   o f   a l l   F P
P r e c i s i o n = 4816 4816 + 1050 = 0.8210
F 1   S c o r e = 2 P r e c i s i o n R e c a l l P r e c i s i o n + R e c a l l
F 1   S c o r e = 2 0.8210 0.7981 0.8210 + 0.7981 = 0.8093
A c c u r a c y = S u m   o f   a l l   T P   f o r   e a c h   c l a s s + S u m   o f   a l l   T N   f o r   e a c h   c l a s s S u m   o f   a l l   T P + S u m   o f   a l l   T N + S u m   o f   a l l   F P + S u m   o f   a l l   F N
A c c u r a c y = 4816 + 3502 4816 + 3502 + 1050 + 1218 = 0.7857
Here, TP stands for true positive, TN stands for true negative, FP stands for false positive, and FN stands for false negative. Based on cosine similarity, a tweet is defined as a normal or anomaly tweet. The average cosine similarity was 0.4549 for the considered dataset. The cosine similarity of each tweet was compared with the average cosine similarity. The tweet was treated as a normal tweet if the tweet had a greater cosine value than the average cosine value. The tweet was treated as an anomaly tweet if the tweet had a lower cosine value than the average cosine value.
The new framework selected all anomalous tweets to form and analyze the clusters. Subsequently, it created two clusters, cluster 0 and cluster 1, for those tweets. Both groups had some keywords related to the COVID-19 vaccine, Pfizer, Covaxin, Covishield, India, Sputnik, and vaccination. Based on both the groups, all the tweets were related to coronavirus and vaccination; hence, the type of disaster was analyzed. Figure 7 shows the consecutive terms of cluster 0, and Figure 8 illustrates the most frequent words of coronavirus tweets.

5. Case Study 2—Russia Ukraine Tweet Dataset

The authors prepared another dataset with tweets related the ongoing Russia-Ukraine war. This test dataset contained 8535 tweets. The confusion matrix for this case study is depicted in Figure 9. The results were calculated by calculating the F1 score, precision, recall, and accuracy using Equations (10)–(13). The results show that the new framework detected anomalous data with 70% accuracy. Table 8 shows five sample tweets from the Russia-Ukraine tweet dataset with location and date of tweet. The retrieved tweets have different fields, namely, tweet_text, tweet_created_at, tweet_retweet, tweet_like, and tweet_location.
S e n s i t i v i t y   o r   R e c a l l = 2532 2532 + 583 = 0.8128   .
P r e c i s i o n = 2532 2532 + 1961 = 0.5635
F 1   S c o r e = 2 0.5635 0.8128 0.5635 + 0.8128 = 0.665
A c c u r a c y = 2532 + 3459 2532 + 1961 + 583 + 3459 = 0.7019
The average cosine similarity was 0.4435 for the considered dataset. The cosine similarity of each tweet was compared with the average cosine similarity. The tweet was treated as a normal tweet if the tweet had a greater cosine value than the average cosine value. The new framework selected all the anomalous tweets and created two clusters, cluster 0 and cluster 1, for this dataset. Some keywords related to this are Russia, Ukraine, killed, conflict, country, project, military, and NATO in both groups. Based on both the groups, all the tweets were related to the Russia-Ukraine war, thereby identifying the type of incident. Figure 10 shows the consecutive terms of cluster 0 and Figure 11 for cluster 1 for case study 2.
Table 9 shows call, precision, F1 score, and accuracy of case studies 1 and 2. Results show that the new framework detected anomalous data with high accuracy for the case studies.

6. Discussion and Limitation of This Study

Our research included the creation of a dataset, preprocessing with lemmatization, tokenization, and stop-word removal. Later, it identified the most frequent word and performed topic modeling using NMF and LDA. In the next phase, we created a query set with the help of top words and employed the BERT sentence trans-former for anomaly detection. Results and case studies demonstrate that the proposed framework could detect anomalies in the considered dataset. Detected anomalies were validated with clusters of most frequent words, and results were visualized using a word cloud.
The main limitation of this work is very few, or no repetition of words, as this work used the most frequent words to detect anomalies. A data set with a unique word may lead to false anomaly detection. Another limitation is the small size of the dataset.

7. Conclusions

We developed a framework for anomaly detection in social media data that involves the collection of tweets from Twitter, pre-processing of data, topic modelling, collection of the most frequently used words using topic modelling, anomaly detection, and clustering using K-means. After pre-processing, LDA and NMF were used to identify the most dominated topics, and BERT was deployed to detect an anomaly. Further, anomalous data were divided into clusters using K-means to decide the anomaly type. Results show that most of the time anomalous data were detected. The proposed framework performed well when deployed in two case studies to detect unusual behavior.
In the future, the proposed framework may be modified with a significant update in the computation of similarity or topic modeling approaches. The dataset will be extended to obtain detailed insight into Twitter data. Currently, this work considers only Twitter data. In the future, it will be extended to other social media data. Additionally, it may be improved for detection anomaly in real-time social media data.

Author Contributions

Conceptualization, All; methodology, S.K.; implementation, S.K.; validation, S.K., M.B.K. and A.K.J.S.; formal analysis, M.B.K.; investigation, S.K.; resources, M.B.K., M.H.A.H., A.K.J.S., A.A. and M.A.; data curation, S.K.; writing, S.K.; visualization, supervision and project administration, M.B.K., M.H.A.H., A.K.J.S., A.A. and M.A.; funding acquisition, A.K.J.S. All authors have read and agreed to the published version of the manuscript.

Funding

This research was supported by Deputyship for Research & Innovation, Ministry of Education in Saudi Arabia, through project number 959.

Institutional Review Board Statement

Not applicable.

Informed Consent Statement

Not applicable.

Data Availability Statement

A new Twitter dataset was created and may be provided on request.

Acknowledgments

The authors extend their appreciation to the Deputyship for Research & Innovation, Ministry of Education in Saudi Arabia for funding this research work through project number 959.

Conflicts of Interest

The authors declare no conflict of interest.

References

  1. Guarino, A.; Malandrino, D.; Zaccagnino, R. An automatic mechanism to provide privacy awareness and control over unwittingly dissemination of online private information. Comput. Netw. 2022, 202, 108614. [Google Scholar] [CrossRef]
  2. Mao, H.; Shuai, X.; Kapadia, A. Loose tweets: An analysis of privacy leaks on twitter. In Proceedings of the 10th Annual ACM Workshop on Privacy in the Electronic Society, Chicago, IL, USA, 17 October 2011; pp. 1–12. [Google Scholar]
  3. Yu, R.; Qiu, H.; Wen, Z.; Lin, C.; Liu, Y. A survey on social media anomaly detection. ACM SIGKDD Explorations. Newsletter 2016, 18, 1–14. [Google Scholar]
  4. Savage, D.; Zhang, X.; Yu, X.; Chou, P.; Wang, Q. Anomaly detection in online social networks. Soc. Netw. 2014, 39, 62–70. [Google Scholar] [CrossRef] [Green Version]
  5. Casalino, G.; Castiello, C.; del Buono, N.; Mencar, C. A framework for intelligent Twitter data analysis with non-negative matrix factorization. Int. J. Web Inf. Syst. 2018, 14, 334–356. [Google Scholar] [CrossRef]
  6. Hawkins, D.M. Identification of Outliers; Chapman and Hall: London, UK, 1980; Volume 11. [Google Scholar]
  7. Ahmed, M.; Mahmood, A.N.; Hu, J. A survey of network anomaly detection techniques. J. Netw. Comput. Appl. 2016, 60, 19–31. [Google Scholar] [CrossRef]
  8. Patcha, A.; Park, J.M. An overview of anomaly detection techniques: Existing solutions and latest technological trends. Comput. Netw. 2007, 51, 3448–3470. [Google Scholar] [CrossRef]
  9. Alatawi, T.; Aljuhani, A. Anomaly detection framework in fog-to-things communication for industrial internet of things. Comput. Mater. Contin. 2022, 73, 1067–1086. [Google Scholar] [CrossRef]
  10. Ragab, M.; Sabir, M.F.S. Arithmetic optimization with deep learning-enabled anomaly detection in smart city. Comput. Mater. Contin. 2022, 73, 381–395. [Google Scholar]
  11. Zhao, J.; Zeng, P.; Chen, C.; Dong, Z.; Han, J. Deep learning anomaly detection based on hierarchical status-connection features in networked control systems. Intell. Autom. Soft Comput. 2021, 30, 337–350. [Google Scholar] [CrossRef]
  12. Saqaeeyan, S.; Haj, H.; Amirkhani, H. A Novel Probabilistic Hybrid Model to Detect Anomaly in Smart Homes. CMES-Comput. Model. Eng. Sci. 2019, 121, 815–834. [Google Scholar] [CrossRef]
  13. Wang, J.; Zhao, C.; He, S.; Gu, Y.; Alfarraj, O.; Abugabah, A. Loguad: Log unsupervised anomaly detection based on word2vec. Comput. Syst. Sci. Eng. 2022, 41, 1207–1222. [Google Scholar] [CrossRef]
  14. Mujahid, M.; Lee, E.; Rustam, F.; Washington, P.B.; Ullah, S.; Reshi, A.A.; Ashraf, I. Sentiment analysis and topic modeling on tweets about online education during COVID-19. Appl. Sci. 2021, 11, 8438. [Google Scholar] [CrossRef]
  15. Lyu, J.C.; le Han, E.; Luli, G.K. COVID-19 vaccine-related discussion on Twitter: Topic modeling and sentiment analysis. J. Med. Internet Res. 2021, 23, e24435. [Google Scholar] [CrossRef] [PubMed]
  16. Amen, B.; Faiza, S.; Do, T.T. Big data directed acyclic graph model for real-time COVID-19 twitter stream detection. Pattern Recognit. 2022, 123, 108404. [Google Scholar] [CrossRef] [PubMed]
  17. Yousefinaghani, S.; Dara, R.; Mubareka, S.; Sharif, S. Prediction of COVID-19 waves using social media and Google search: A case study of the US and Canada. Front. Public Health 2021, 9, 656635. [Google Scholar] [CrossRef]
  18. Kabir, M.Y.; Madria, S. EMOCOV: Machine learning for emotion detection, analysis and visualization using COVID-19 tweets. Online Soc. Netw. Media 2021, 23, 100135. [Google Scholar] [CrossRef]
  19. Gharavi, E.; Nazemi, N.; Dadgostari, F. Early outbreak detection for proactive crisis management using twitter data: COVID-19 a case study in the US. arXiv 2020, arXiv:2005.00475. [Google Scholar]
  20. Tam, N.T.; Weidlich, M.; Zheng, B.; Yin, H.; Hung, N.Q.V.; Stantic, B. From anomaly detection to rumour detection using data streams of social platforms. Proc. VLDB Endow. 2019, 12, 1016–1029. [Google Scholar] [CrossRef] [Green Version]
  21. Xu, Z.; Huang, X.; Zhao, Y.; Dong, Y.; Li, J. Contrastive Attributed Network Anomaly Detection with Data Augmentation. In Pacific-Asia Conference on Knowledge Discovery and Data Mining; Springer: Cham, Switzerland, 2022; pp. 444–457. [Google Scholar]
  22. Hoeltgebaum, H.; Adams, N.; Fernandes, C. Estimation, Forecasting, and Anomaly Detection for Nonstationary Streams Using Adaptive Estimation. IEEE Trans. Cybern. 2021, 52, 7956–7967. [Google Scholar] [CrossRef]
  23. Nanda, G.; Douglas, K.A.; Waller, D.R.; Merzdorf, H.E.; Goldwasser, D. Analyzing large collections of open-ended feedback from MOOC learners using LDA topic modeling and qualitative analysis. IEEE Trans. Learn. Technol. 2021, 14, 146–160. [Google Scholar] [CrossRef]
  24. Farkhod, A.; Abdusalomov, A.; Makhmudov, F.; Cho, Y.I. LDA-Based Topic Modeling Sentiment Analysis Using Topic/Document/Sentence (TDS) Model. Appl. Sci. 2021, 11, 11091. [Google Scholar] [CrossRef]
  25. Kim, M.; Kim, D. A Suggestion on the LDA-Based Topic Modeling Technique Based on ElasticSearch for Indexing Academic Research Results. Appl. Sci. 2022, 12, 3118. [Google Scholar] [CrossRef]
  26. Bastani, K.; Namavari, H.; Shaffer, J. Latent Dirichlet allocation (LDA) for topic modeling of the CFPB consumer complaints. Expert Syst. Appl. 2019, 127, 256–271. [Google Scholar] [CrossRef]
  27. Xie, R.; Chu, S.K.W.; Chiu, D.K.W.; Wang, Y. Exploring public response to COVID-19 on Weibo with LDA topic modeling and sentiment analysis. Data Inf. Manag. 2021, 5, 86–99. [Google Scholar] [CrossRef]
  28. Abuzayed, A.; Al-Khalifa, H. BERT for Arabic topic modeling: An experimental study on BERTopic technique. Procedia Comput. Sci. 2021, 189, 191–194. [Google Scholar] [CrossRef]
  29. Jónsson, E.; Stolee, J. An evaluation of topic modelling techniques for twitter. In Proceedings of the 53th Annual Meeting of the Association for Computational Linguistics and the 7th International Joint Conference on Natural Language Processing, Beijing, China, 26–31 July 2015; short papers. pp. 489–494. [Google Scholar]
  30. Casalino, G.; Grilli, L.; Guarino, A.; Schicchi, D.; Taibi, D. Intelligent knowledge understanding from students questionnaires: A case study. In International Workshop on Higher Education Learning Methodologies and Technologies Online; Springer: Cham, Switzerland, 2021; pp. 74–86. [Google Scholar]
Figure 1. Proposed anomaly detection framework.
Applsci 12 11059 g001
Figure 2. Sixty most frequently appearing words in the considered datasets.
Applsci 12 11059 g002
Figure 3. Highlighted words based on their frequency and relevancy in the tweets.
Applsci 12 11059 g003
Figure 4. Word Cloud for Cluster 0 of the most dominant tweets.
Applsci 12 11059 g004
Figure 5. Most frequent words of the most dominant tweets.
Applsci 12 11059 g005
Figure 6. Confusion matrix of case study—Corona Virus Tweet Dataset.
Applsci 12 11059 g006
Figure 7. Word Cloud for Cluster 0 of Coronavirus tweets.
Applsci 12 11059 g007
Figure 8. Most frequent words of Coronavirus Tweets.
Applsci 12 11059 g008
Figure 9. Confusion matrix of case study Russia Ukraine Tweet Dataset.
Applsci 12 11059 g009
Figure 10. Word Cloud for Cluster 0 of Russia Ukraine tweets.
Applsci 12 11059 g010
Figure 11. Most frequent words of Russia-Ukraine tweets.
Applsci 12 11059 g011
Table 1. Summary of recent development on LDA and NMF for topic modeling.
Author [Ref.]ActivityTechnique UsedData SourceDescriptionApplications
Tam et al. [20]Social media analysisGraph-based approach. Social platformsMultimodal approach used to detect anomalies in posts, users and hashtags. Rumour Detection
Xu et al. [21]Siamese graph neural network with a contrastive lossAmazon, Flickr, Facebook, Enron, Twitter datasetData augmentation approach used to model human knowledge and employed use reconstruction loss to obtain anomaly
scores
Network Anomaly
Detection
Hoeltgebaum et al. [22]Penalized-regression modelStreaming dataProposed a real-time adaptive componentEstimation, Forecasting, and Anomaly Detection
Nanda et al. [23] LDA for topic modelingLDASurveyIdentified MOOC learning experience from learnersMassive open online course
Farkhod et al. [24]Topic/Document/Sentence (TDS) ModelIMDB
dataset
Topic-based sentiment analysis performedSentiment analysis
Kim and Kim [25] ElasticSearchNot applicableTopic-based LDA model (to improve supervised learning) were deployed to extract the features of academic papersIndexing Academic Research Results
Bastani et al. [26]LDACFPB datasetDeveloped an LDA based decision support systemAnalysis of consumer complaints
Xie et al. [27]LDAWeibo postsDeployed LDA for topics modeling and performed sentiment analysisPublic opinion about COVID-19 on Weibo
Abuzayed and Al-Khalifa [28]NMF for topic modelingBERTopicArabic languageBERTopic deployed for Arabic
Language models
Topic modeling for Arabic
language
Table 2. Sample datasets with the corresponding location and date.
TweetsLocationCreated on
After all the headaches I am finally able to leave Singapore and head back to Malaysia But first some Chwee Kueh at the lounge Basically its steamed rice cake with preserved radish sprinkled on top Never tried this until I’m in Singapore Love itMalaysia25 April 2022 23:59
origins I remember while I was in the car with my mom, I thought about the concept that reality could end at any moment scared the shit out of me so much that I cried so hard that my mom had to pull over and I threw up it was all sparked by this image btwPakistan24 March 2022 23:59
Today love yourself as you are unique and brave and full of love Chennai, India25 February 2022 23:59
People should think about the fact that official US policy prohibits assassination of the one person causing a war but slaughtering soldiers and others by the thousands is OKSingapore12 January 2022 23:47
He said Climate leader Because like winter summer and rainy season our BCM won’t come out of his house If he comes out it becomes a climate Looking at the whole picture here Ajit Pawar is controlling the cabinet orders from Bade Shaheb Only for namesake Uddhav is CMIndia13 November 2012 23:46
Table 3. Most frequent 10 words that appear in the dataset.
S. No.WordFrequency
1like3601
2good2460
3day2062
4know1882
5time1873
6make1696
7love1643
8people1618
9need1540
10want1525
Table 6. Most frequent words using NMF and LDA.
goodthanksthinkbeautiful
morningbestalwaysblessed
Indiafuturelovefriend
information greatlife birthday
likehealthknowhope
happywaterdayactually
phototeampeoplenew
sociallifeneedlisten
wellfutureeveryonedream
worldtruthnicesorry
Table 7. Sample tweets (Corona Virus Tweet Dataset) with the corresponding location and date.
TweetsLocationCreated on
Hindu Pfizer is in another deadlock with the GOI They continue to insist they will only provide their vaccine if the company waDelhi, India22 May 2021
Pfizers COVID-19 vaccine can now can be stored at conventional refrigerator temperatures for up to a month as per HealthBarcelona19 May 2021
PublicHealth CUPHD is hosting COVID-19 walk-in vaccination clinics each Friday from 830 AM400 PM wPfizer Moderna and Johnson ampUrbana, IL9 June 2021
Can a COVID-19 vaccine make me sick with COVID-19 NO COVID-19 vaccines contain the live virus that causes COVID-19 Broadway Brooklyn1 March 2018
My Grandmommy was very sick with pneumonia last month amp got over it slowly I was so worried shed catch COVID-19$RayeStreams28 April 2019
Table 8. Sample tweets (Russia-Ukraine Tweet Dataset) with the corresponding location and date.
TweetsLocationCreated on
Russians remind me of the dynamic between dogs when one is obviously kinda dumb and goofy. Russia 01 June 2022
Iraq and Afghanistan were thousands of km away. Afghanistan and Iraq were defeated militarily very quickly, it was the insurgency that was the problem.Belgium02 June 2022
news project good whitepaper also clear hope project successful future also hope community grow even biggerRussia 28 March 2022
Trump was impeached for taking congressionally-approved taxpayer money and extorting UkraineUS01 June 2022
amazing sexy quiet heartwarming cool really good rapper love way bare face way walk rapping savage man look funny fineeeeeyou like basketball likeUS24 April 2022
Table 9. Most frequent words using NMF and LDA.
RecallPrecisionF1 ScoreAccuracy
Case Study 1 0.79810.82100.80930.7857
Case Study 20.81280.56350.6650.7019
Publisher’s Note: MDPI stays neutral with regard to jurisdictional claims in published maps and institutional affiliations.

