Article

A Novel Cementing Quality Evaluation Method Based on Convolutional Neural Network

1
Sinopec Research Institute of Petroleum Engineering, Beijing 100101, China
2
State Key Laboratory of Shale Oil and Gas Enrichment Mechanism and Effective Development, Beijing 100083, China
3
School of Petroleum Engineering, China University of Petroleum (Beijing), Beijing 102249, China
4
State Key Laboratory of Petroleum Resources and Prospecting, China University of Petroleum, Beijing 102249, China
*
Author to whom correspondence should be addressed.
Appl. Sci. 2022, 12(21), 10997; https://doi.org/10.3390/app122110997
Submission received: 7 October 2022 / Revised: 21 October 2022 / Accepted: 28 October 2022 / Published: 30 October 2022

Abstract

:
The quality of cement in cased boreholes is related to the production and life of wells. At present, the most commonly used method is to use CBL-VDL to evaluate, but the interpretation process is complicated, and decisions associated with significant risks may be taken based on the interpretation results. Therefore, cementing quality evaluation must be interpreted by experienced experts, which is time-consuming and labor-intensive. To improve the efficiency of cementing interpretation, this paper used VGG, ResNet, and other convolutional neural networks to automatically evaluate the cementing quality, but the accuracy is insufficient. Therefore, this paper proposes a multi-scale perceptual convolutional neural network with kernels of different sizes that can extract and fuse information of different scales in VDL logging. In total, 5500 datasets in Tarim Oilfield were used for training and validation. Compared with other convolutional neural network algorithms, the multi-scale perceptual convolutional neural network algorithm proposed in this paper can evaluate cementing quality more accurately by identifying VDL logging. At the same time, this model’s time and space complexity are lower, and the operation efficiency is higher. To verify the anti-interference of the model, this paper added 3%, 6%, and 9% of white noise to the VDL data set for cementing evaluation. The results show that, compared with other convolutional neural networks, the multi-scale perceptual convolutional neural network model is more stable and more suitable for the identification of cementing quality.

1. Introduction

Cementing is a very common operation carried out during the construction phase of the majority of oil wells. It is the last operation of each drilling project, and the key project connecting the drilling and the production [1]. Cementing is used to effectively seal the annular space between the casing string running in the well and the formation or outer casing with cementing equipment, technology, and fluid. Cementing quality is not only related to drilling engineering, but also has a great impact on the later production of wells. If the cementing quality is poor, it will not only bring difficulties to the subsequent drilling and oil testing but also greatly impact the oil well’s production life [2].
To ensure that the cementing job is successful, we must test the quality of the cement sheath. The quality of the old cement sheaths may also be tested again to ensure that they are still effective. To date, pressure testing, cement bond logging, and variable density logging can evaluate the quality of the cement sheath [3]. However, pressure tests may not be economically feasible, and field experience has shown that, in some cases, pressure tests may cause damage to the cement sheath [4], whereas cement bond logging (CBL) and variable density logging (VDL) will not. Therefore, cement bonding logging and variable density logging are the main methods for evaluating cementing quality at present.
However, the CBL-VDL interpretation is a complex process [5], and cementing quality must be evaluated manually by trained experts. They use their understanding to integrate the logging results and their knowledge about the well to produce an evaluation of the cement status. This also results in a slow cementing interpretation and low efficiency [6]. At the same time, further oil and gas well development may depend on the evaluation results of cementing quality. Therefore, cementing interpretation is performed under time pressure [7]. Thus, the evaluation method urgently needs to be improved.
Some scholars have carried out relevant research on the automatic interpretation of cement cementation and variable density logging. In 2015, Chen Xiangjun et al. [8] proposed evaluating the cementing quality according to the method of acoustic energy, which has a high interpretation efficiency but insufficient accuracy. In 2020, Deepak Kumar Voleti et al. [9] established different machine learning algorithms, such as CBL-VDL-based random forest and neural network prediction, and ultrasonic imaging data, to output the prediction results of cementing quality and achieve an automatic interpretation of cementing quality. In 2021, Santos, L. et al. [10] used the Gaussian process regression algorithm for training, generated new characteristic curves according to CBL and VDL logging data, and accurately evaluated the cementing quality through the new curves. Although these two methods can realize an automatic interpretation, they require a large amount of pre-processing of data, and the evaluation process is tedious and time-consuming.
In this study, an automatic interpretation method of cementing quality based on a convolutional neural network is proposed. Based on the trained convolutional neural network, it can identify variable density images and automatically output cementing quality results. This method does not need a large amount of data preprocessing, and greatly improves the accuracy and efficiency of cementing quality evaluation.

2. Background

2.1. Logging Interpretation

After drilling, the logging tools are installed in the wellbore to collect logging data. It is usually necessary to collect various data such as resistivity, spontaneous potential, and acoustic velocity, and then log interpretation experts can process and interpret these data. In this process, experts need to integrate geological knowledge and their own experience to convert logging data into geological information, such as lithology, shale content, water saturation, permeability, etc., to accurately understand the geological conditions around the wellbore.

2.1.1. Interpretation of CBL-VDL

CBL-VDL is a kind of acoustic logging. Its principle is to reflect the cementation quality between cement and casing and between casing and formation by using the attenuation effect of the acoustic impedance of cement and drilling fluid (or water) on the acoustic wave propagating along the casing axis [11].
The schematic diagram of CBL-VDL logging is shown in Figure 1. In the figure, T is the acoustic transmitter, and R1 and R2 are two acoustic receivers. The distance between T and R1 is 3ft, and the distance between T and R2 is 5ft. The source distance of CBL is 3ft. R1 receives the casing wave and records the first wave amplitude of the casing wave. The amplitude of the head wave depends on the degree of cementation between the cement and the casing’s outer wall. Therefore, only the quality of the first interface (the interface between the casing and the cement sheath) can be detected, whereas whether the second interface (the interface between the cement sheath and the formation) is well cemented or not cannot be detected. The VDL source spacing is 5ft, R2 receives the casing wave, cement sheath wave, formation wave, and direct wave, and the recording method is brightness modulation recording, which can check the cementation of the first and second interfaces of the casing well.
In order to record the wave train received by the receiver as a continuous record that changes with depth, and to ensure that the wave trains at each depth point do not interfere with each other, variable density logging (VDL) needs to be recorded in the light adjustment mode.
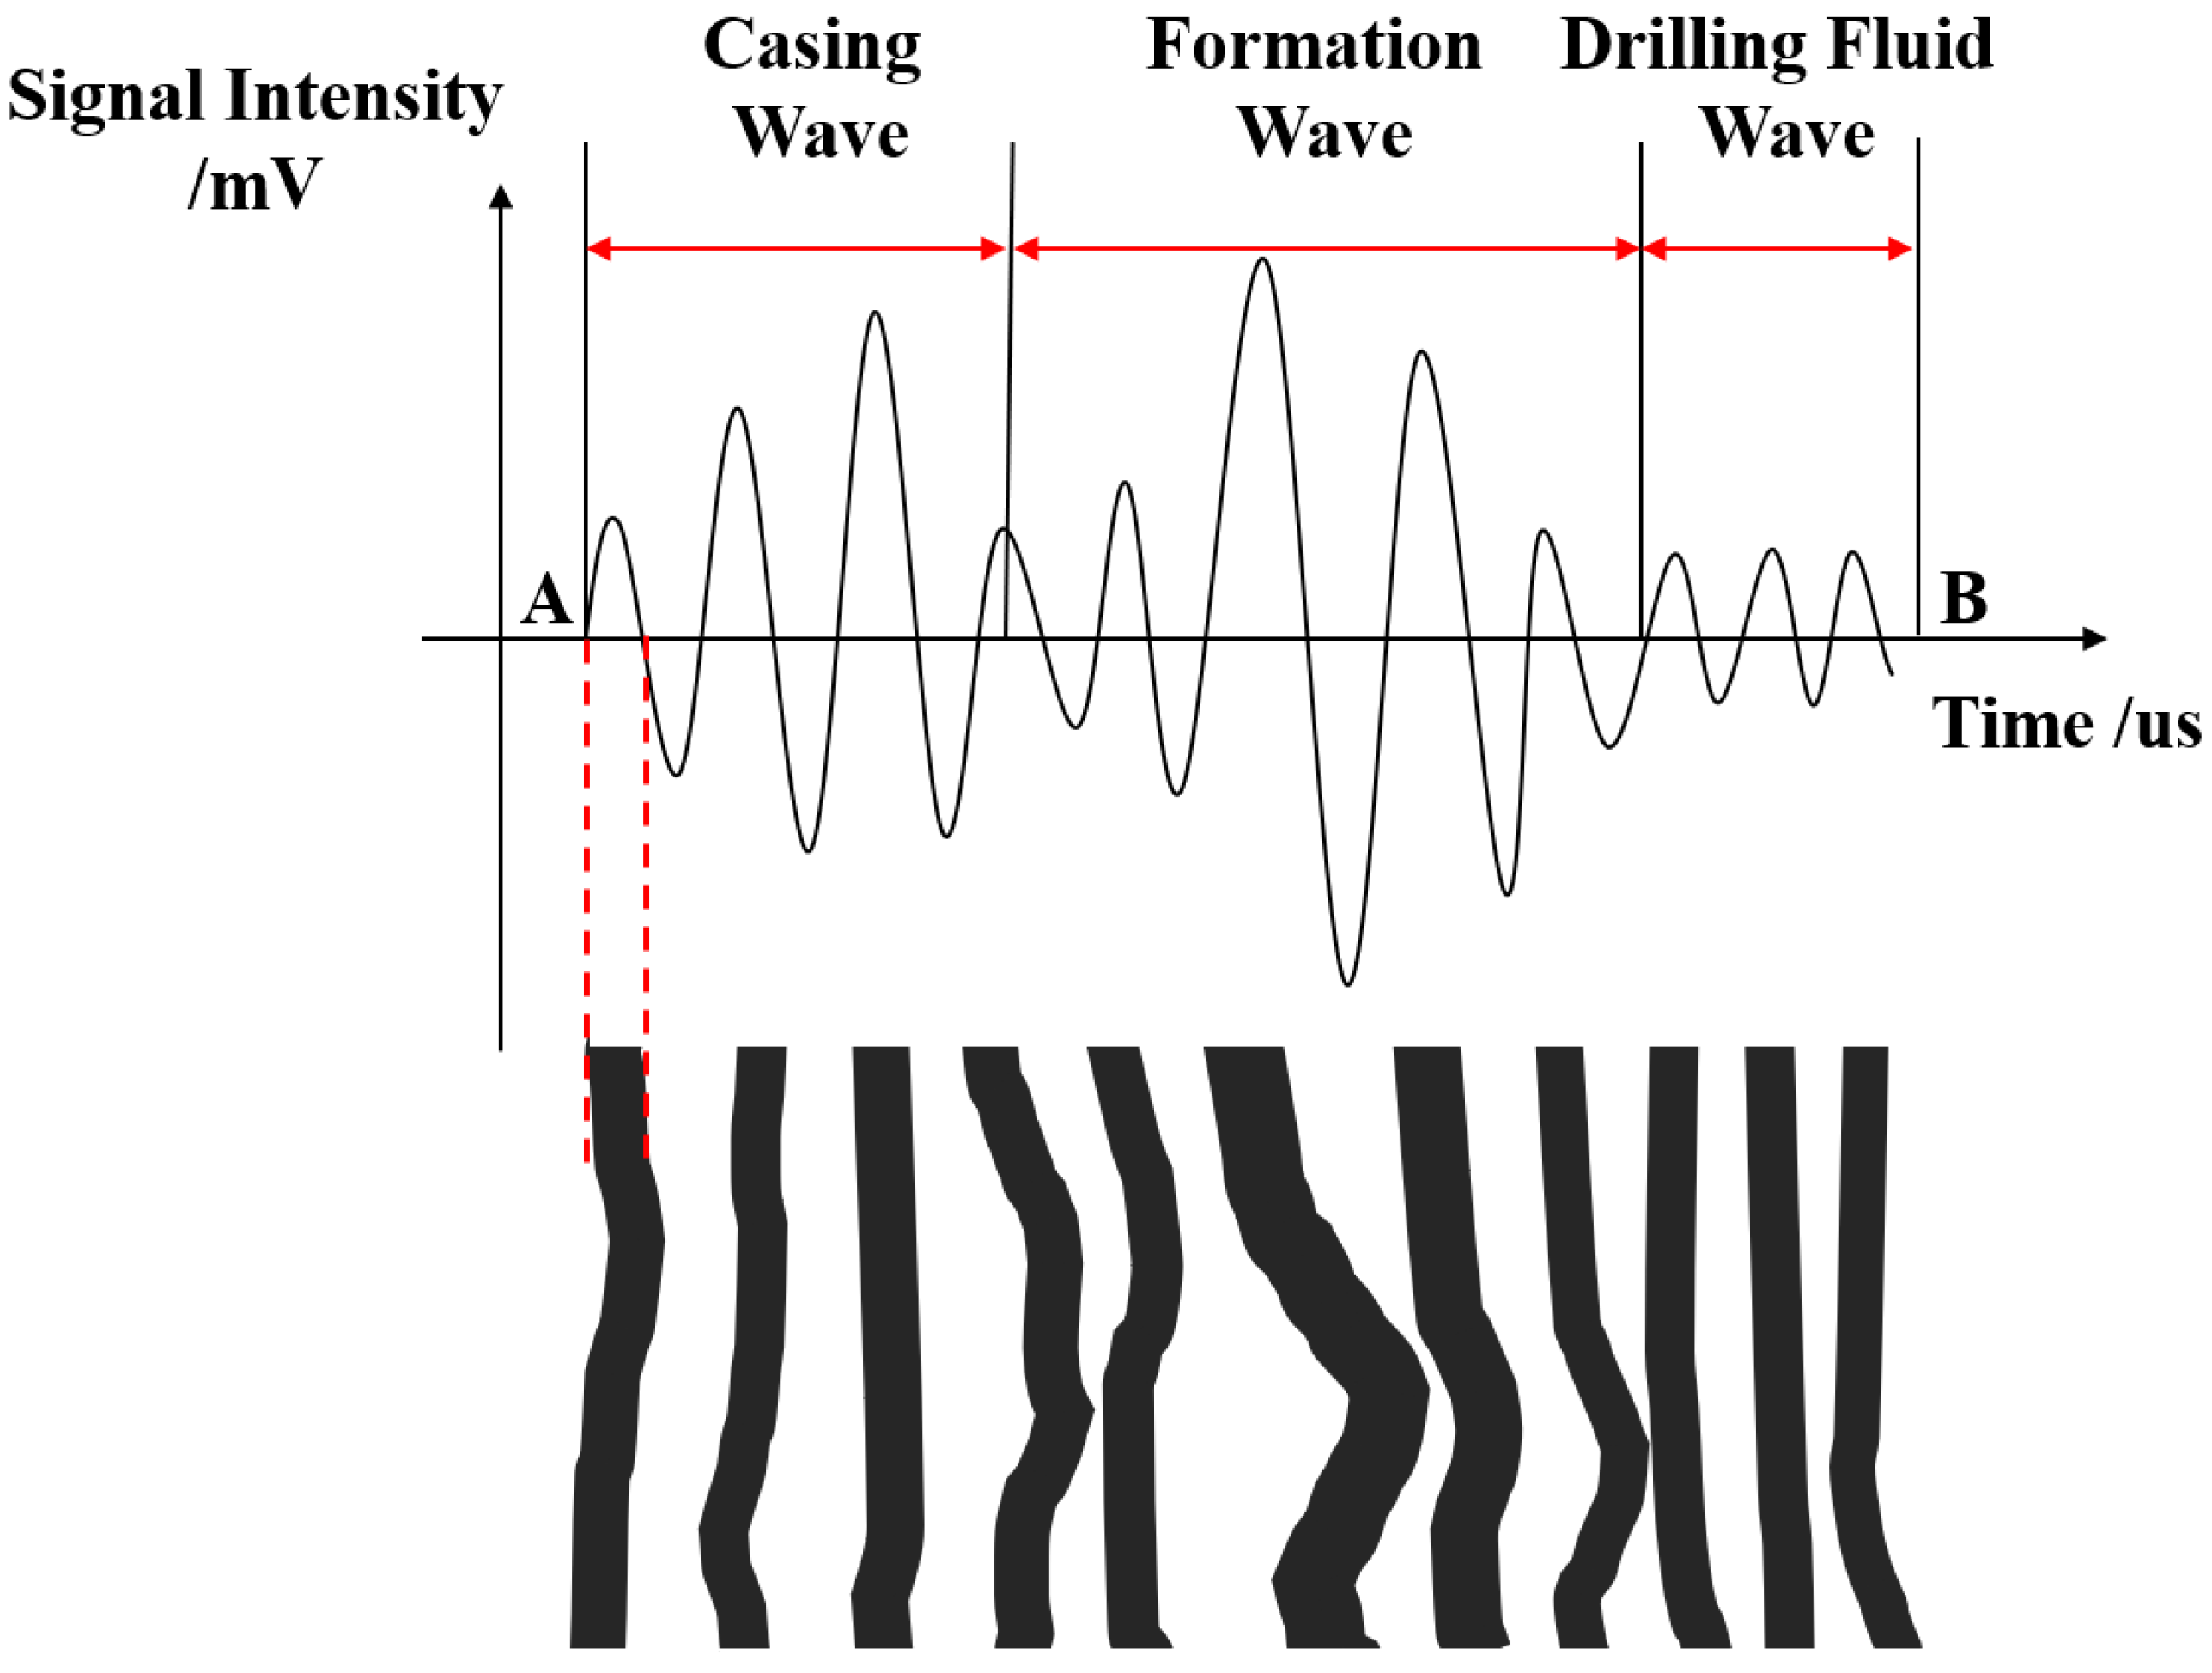
VDL light adjustment method: first, the full wave train signal as shown in Figure 2 is clipped to remove the negative half cycle, and the remaining positive half cycle signal is amplified to become a rectangular wave with a consistent width and proportional amplitude. The rectangular wave train is used as the brightness control signal of the light spot of the oscilloscope tube. When the light spot of the oscilloscope tube is scanned from A to B, due to the different amplitude of the rectangular wave, a scanning line with alternating light and dark colors is displayed on the fluorescent screen, and the logging map shows a strip with alternating black (gray) and white colors. The amplitude of the casing wave and formation wave can be analyzed by the brightness and darkness of the black and white strip, and the cementing quality between the casing and cement sheath and between the cement sheath and the formation can be judged. According to the different cementation degrees, the CBL-VDL has the following response characteristics [12]:
(1)
Free casing.
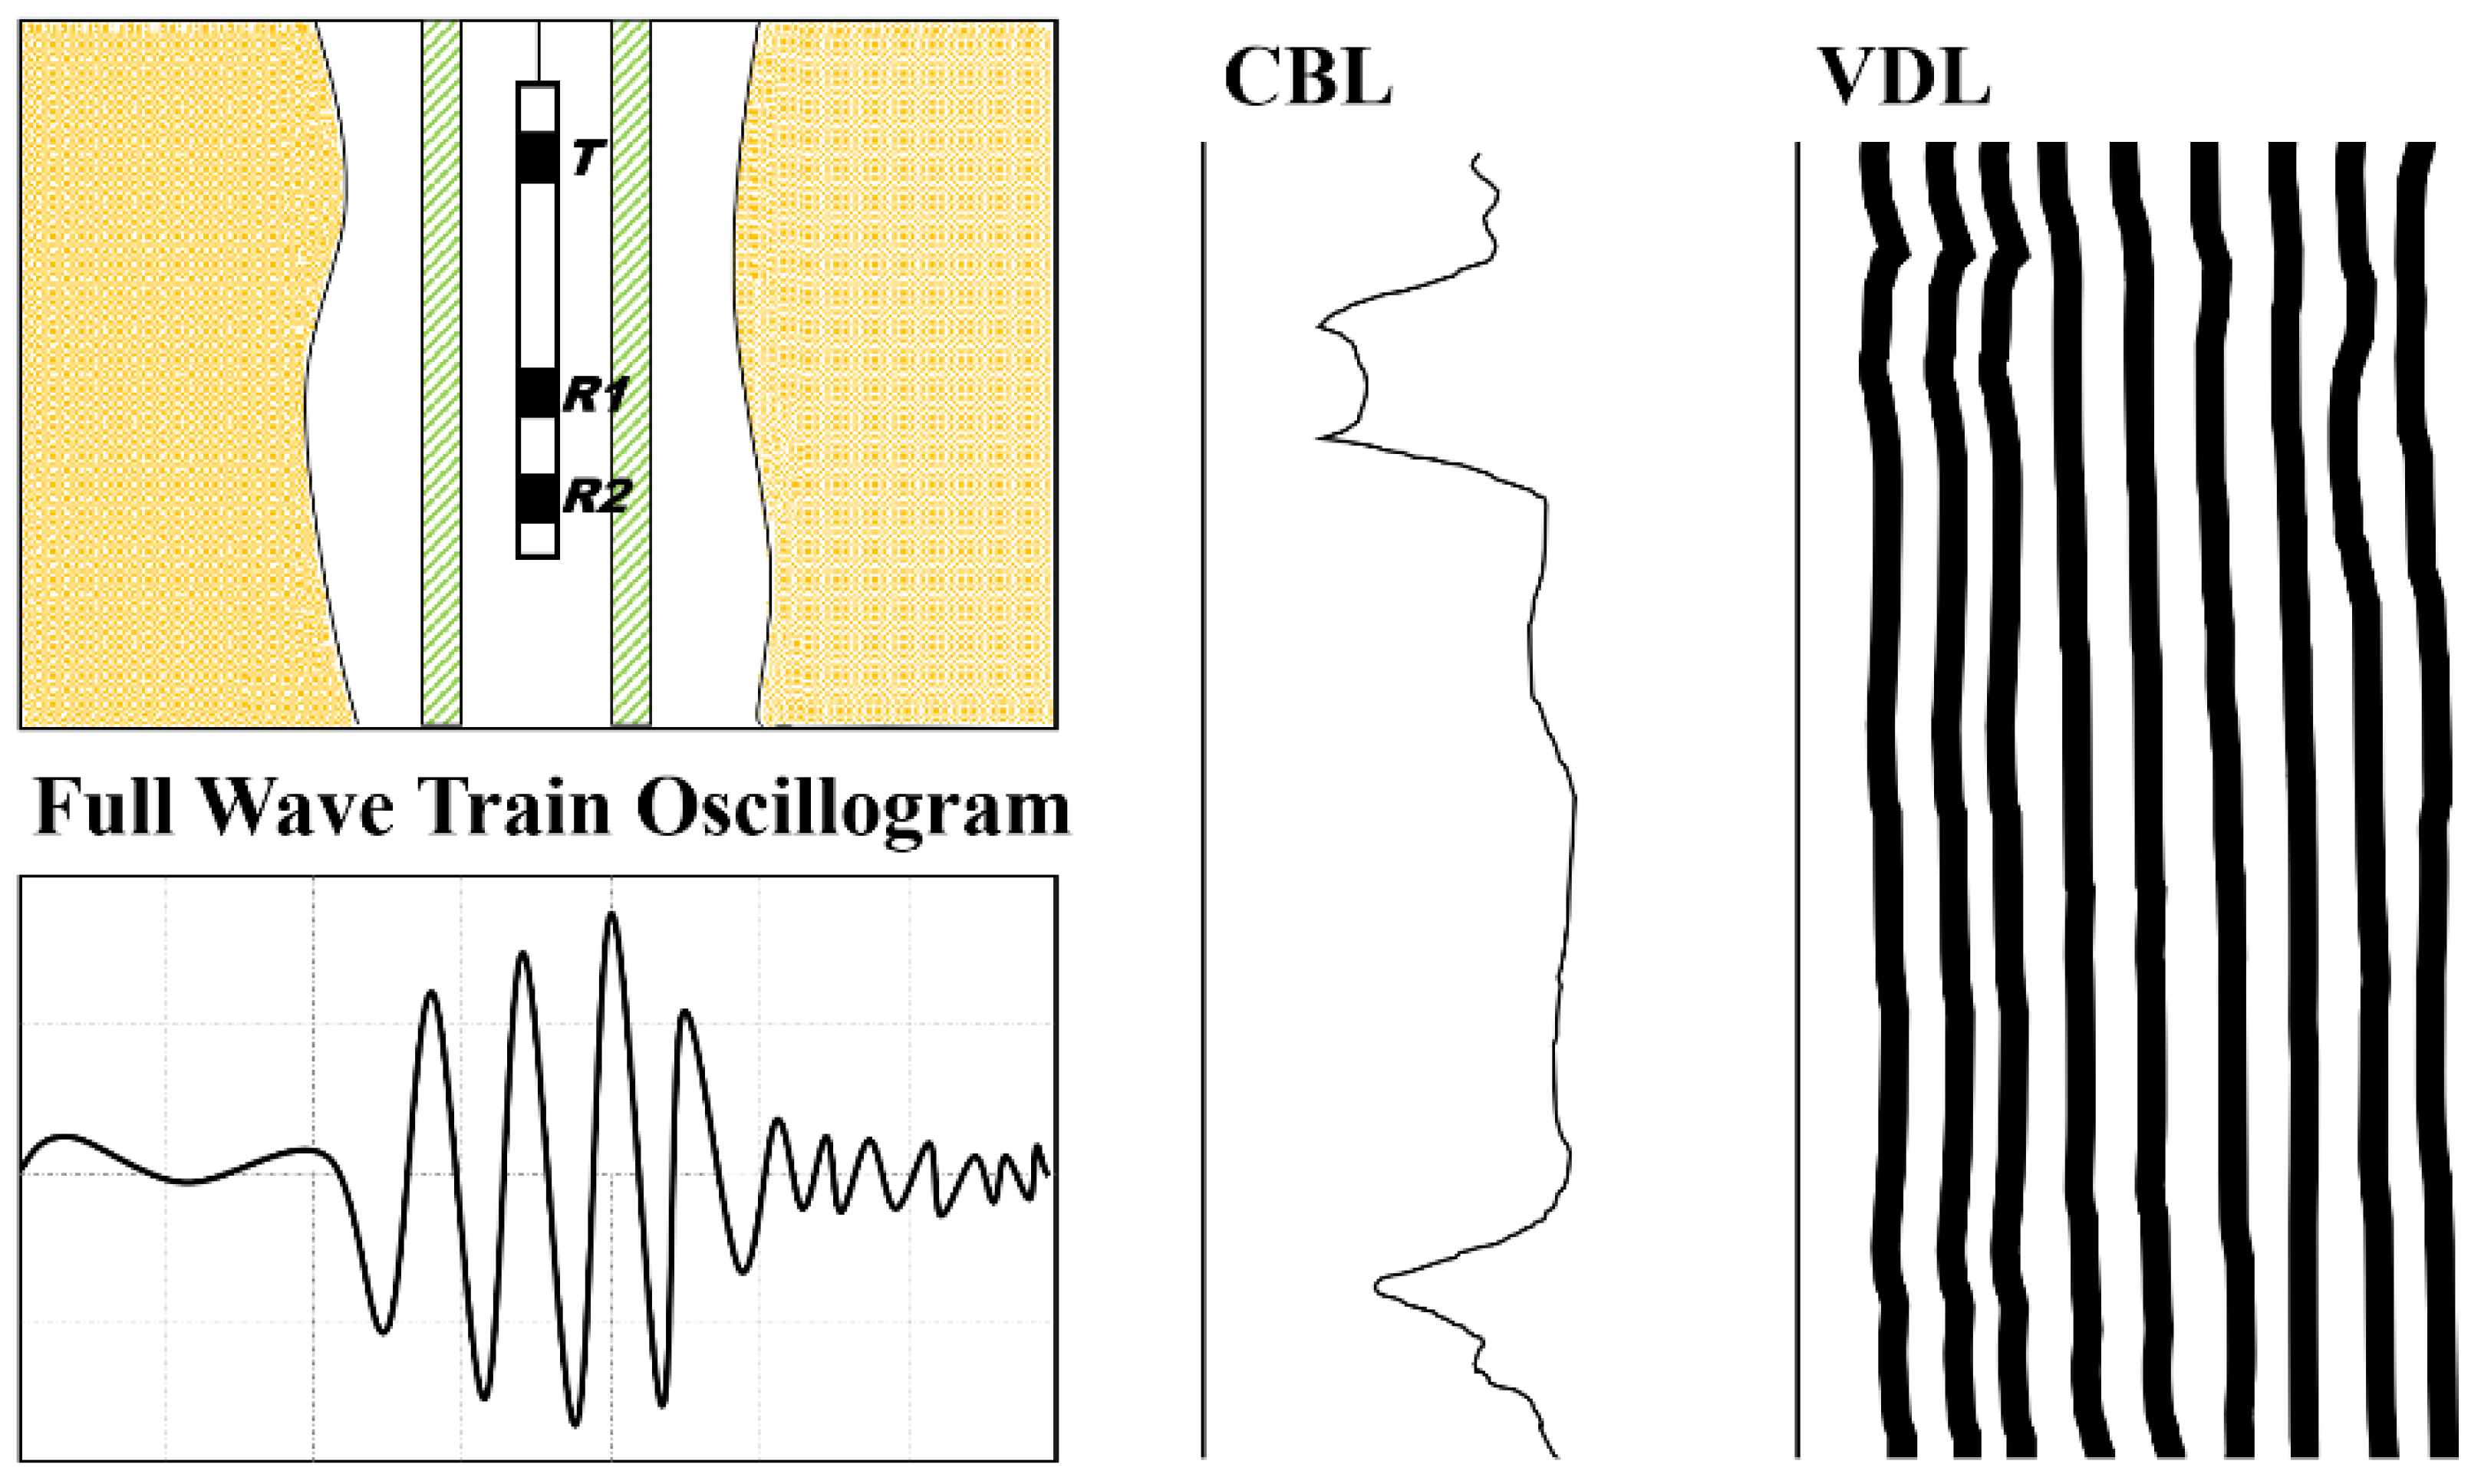
Above the cement surface, the casing is surrounded by drilling fluid, forming the first acoustic interface between the casing and drilling fluid. On the full wave train oscillogram, because there is no cement outside the casing, the interface wave impedance varies greatly, so the casing wave reflection is very strong, most of the acoustic energy travels along the casing, the energy transmitted to the formation is very low, and the formation wave is weak or absent. Therefore, in the VDL, it shows a strong casing wave signal, with six to eight obvious bands on the left side and a blank formation wave, and the acoustic amplitude curve is the highest value (Figure 3).
(2)
The first interface and the second interface are well cemented.
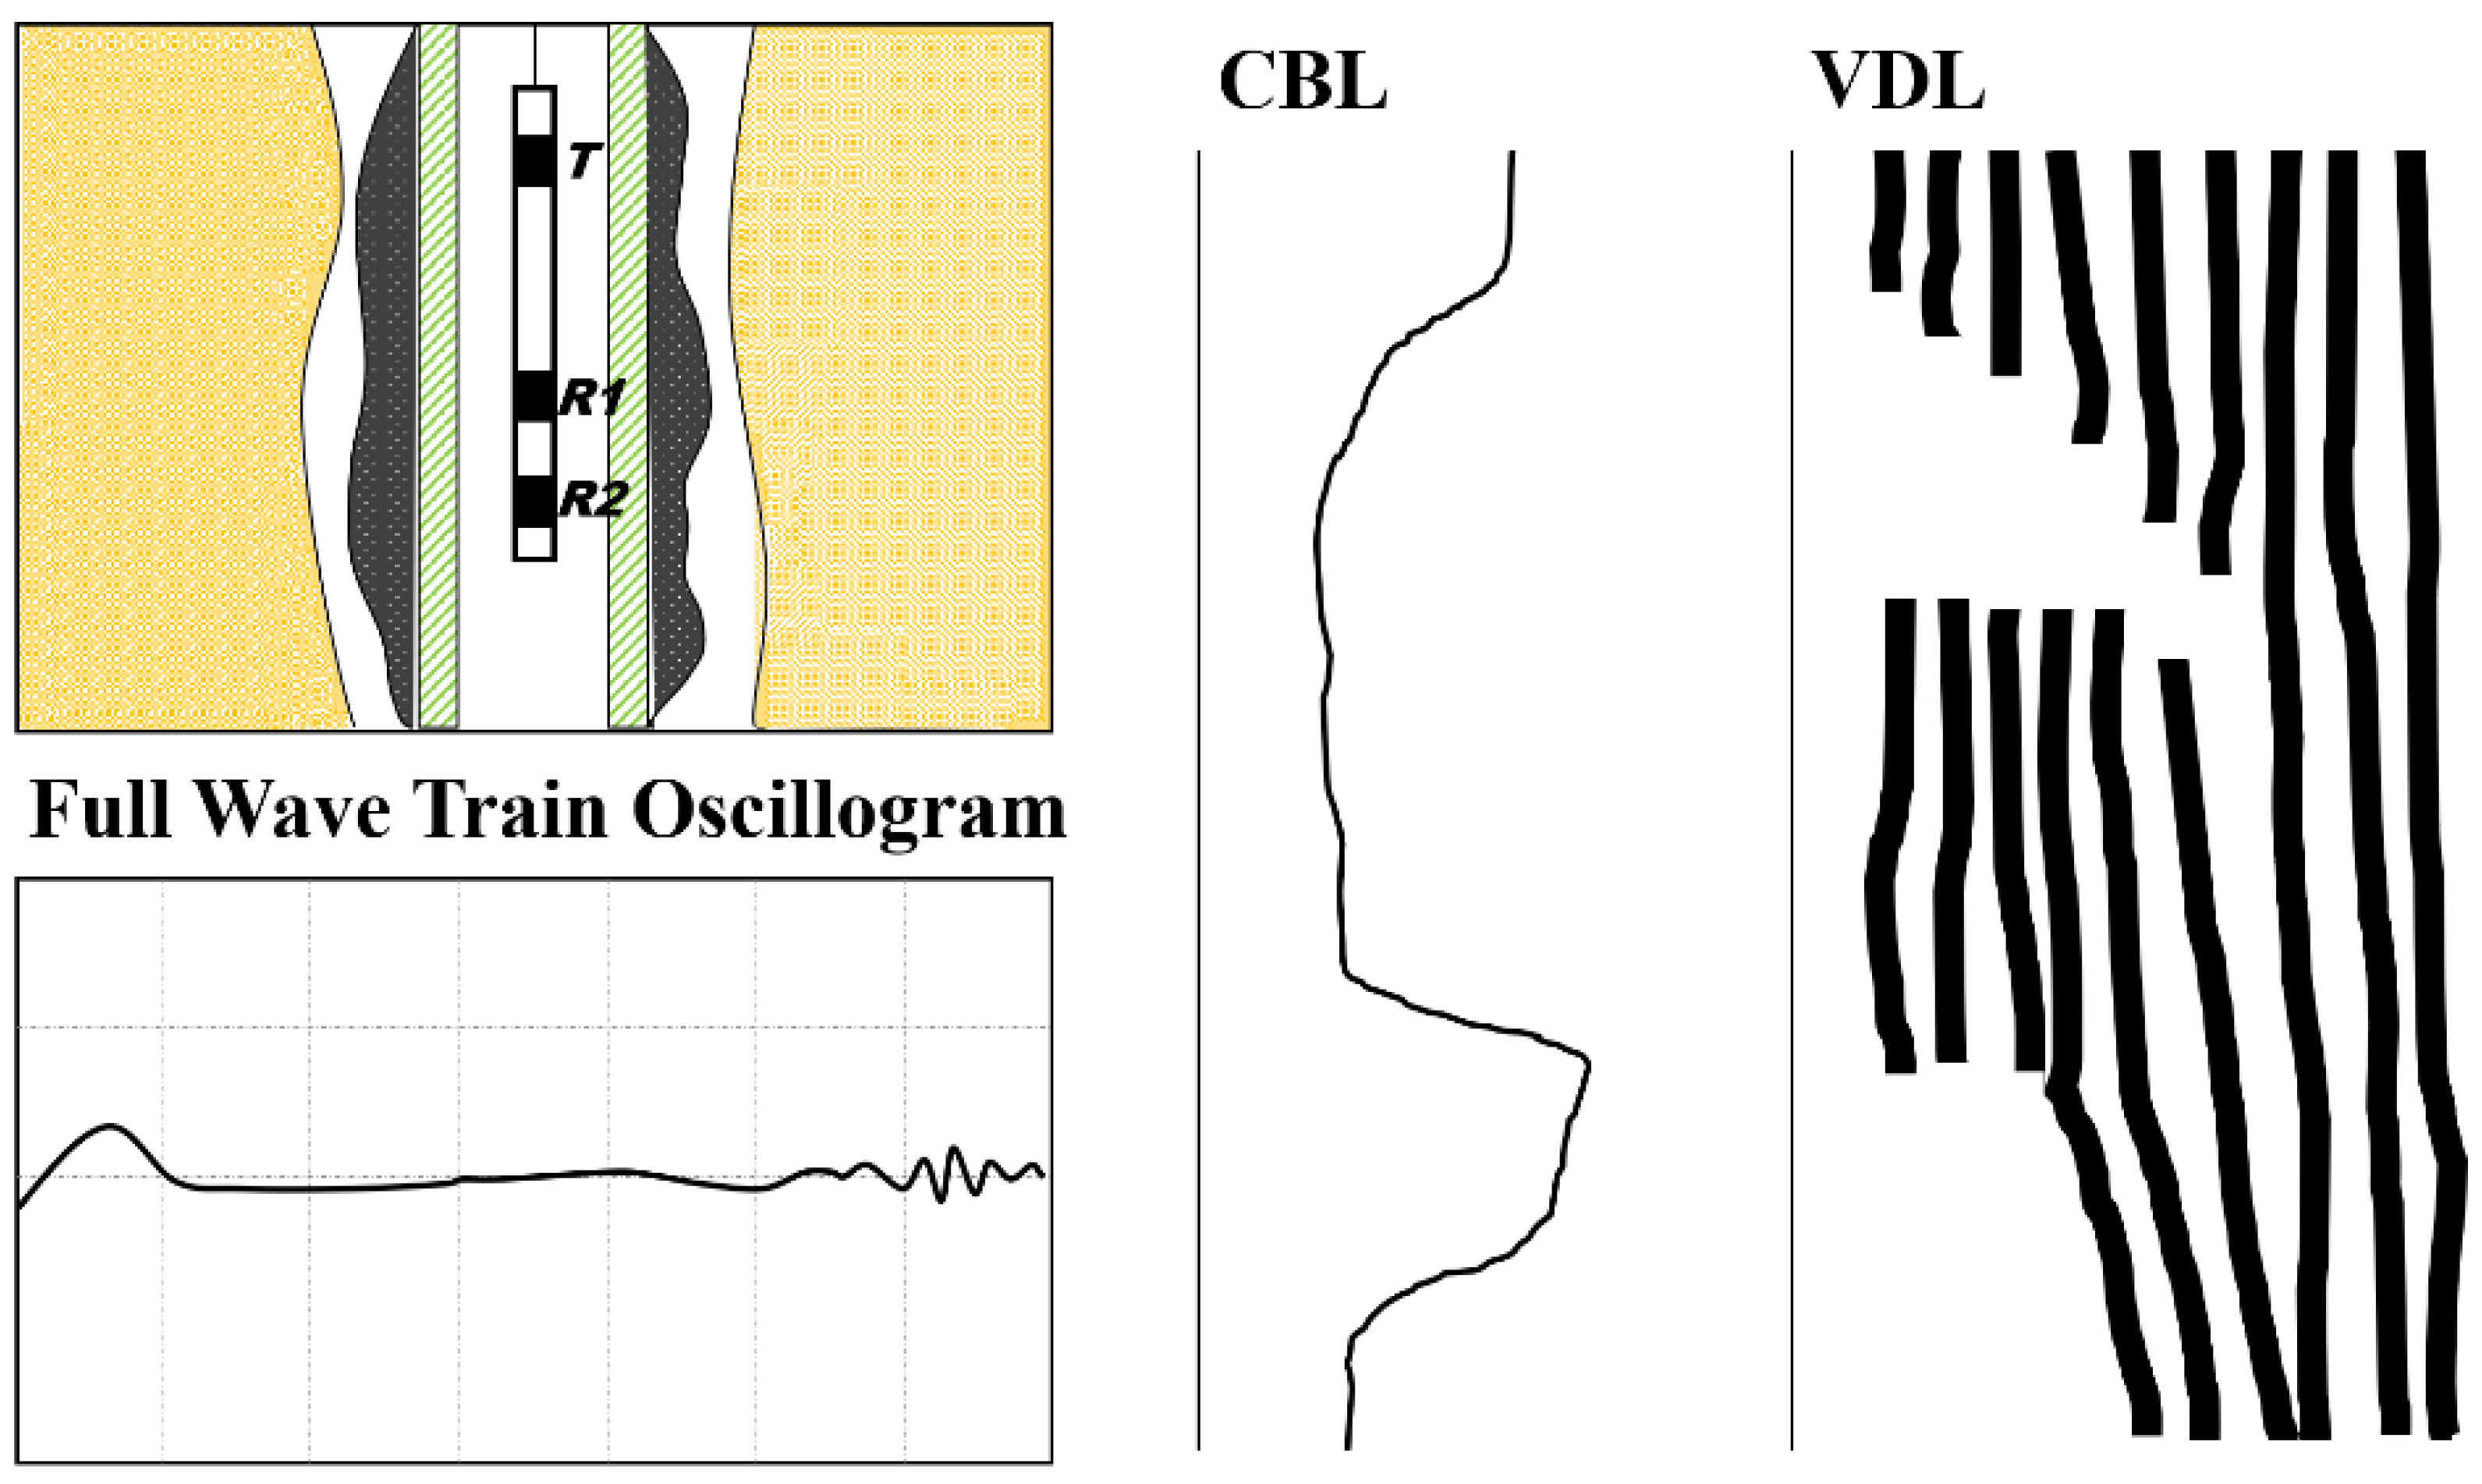
In the section with good cement and casing formation cementation, the measured value of the amplitude is the lowest. On the full wave train waveform, the casing wave is very weak and the formation wave is very strong. Therefore, on the VDL, the left fringe is blurred or disappeared, and the right fringe is clear (Figure 4).
(3)
Good cementation at the first interface, poor cementation at the second interface.
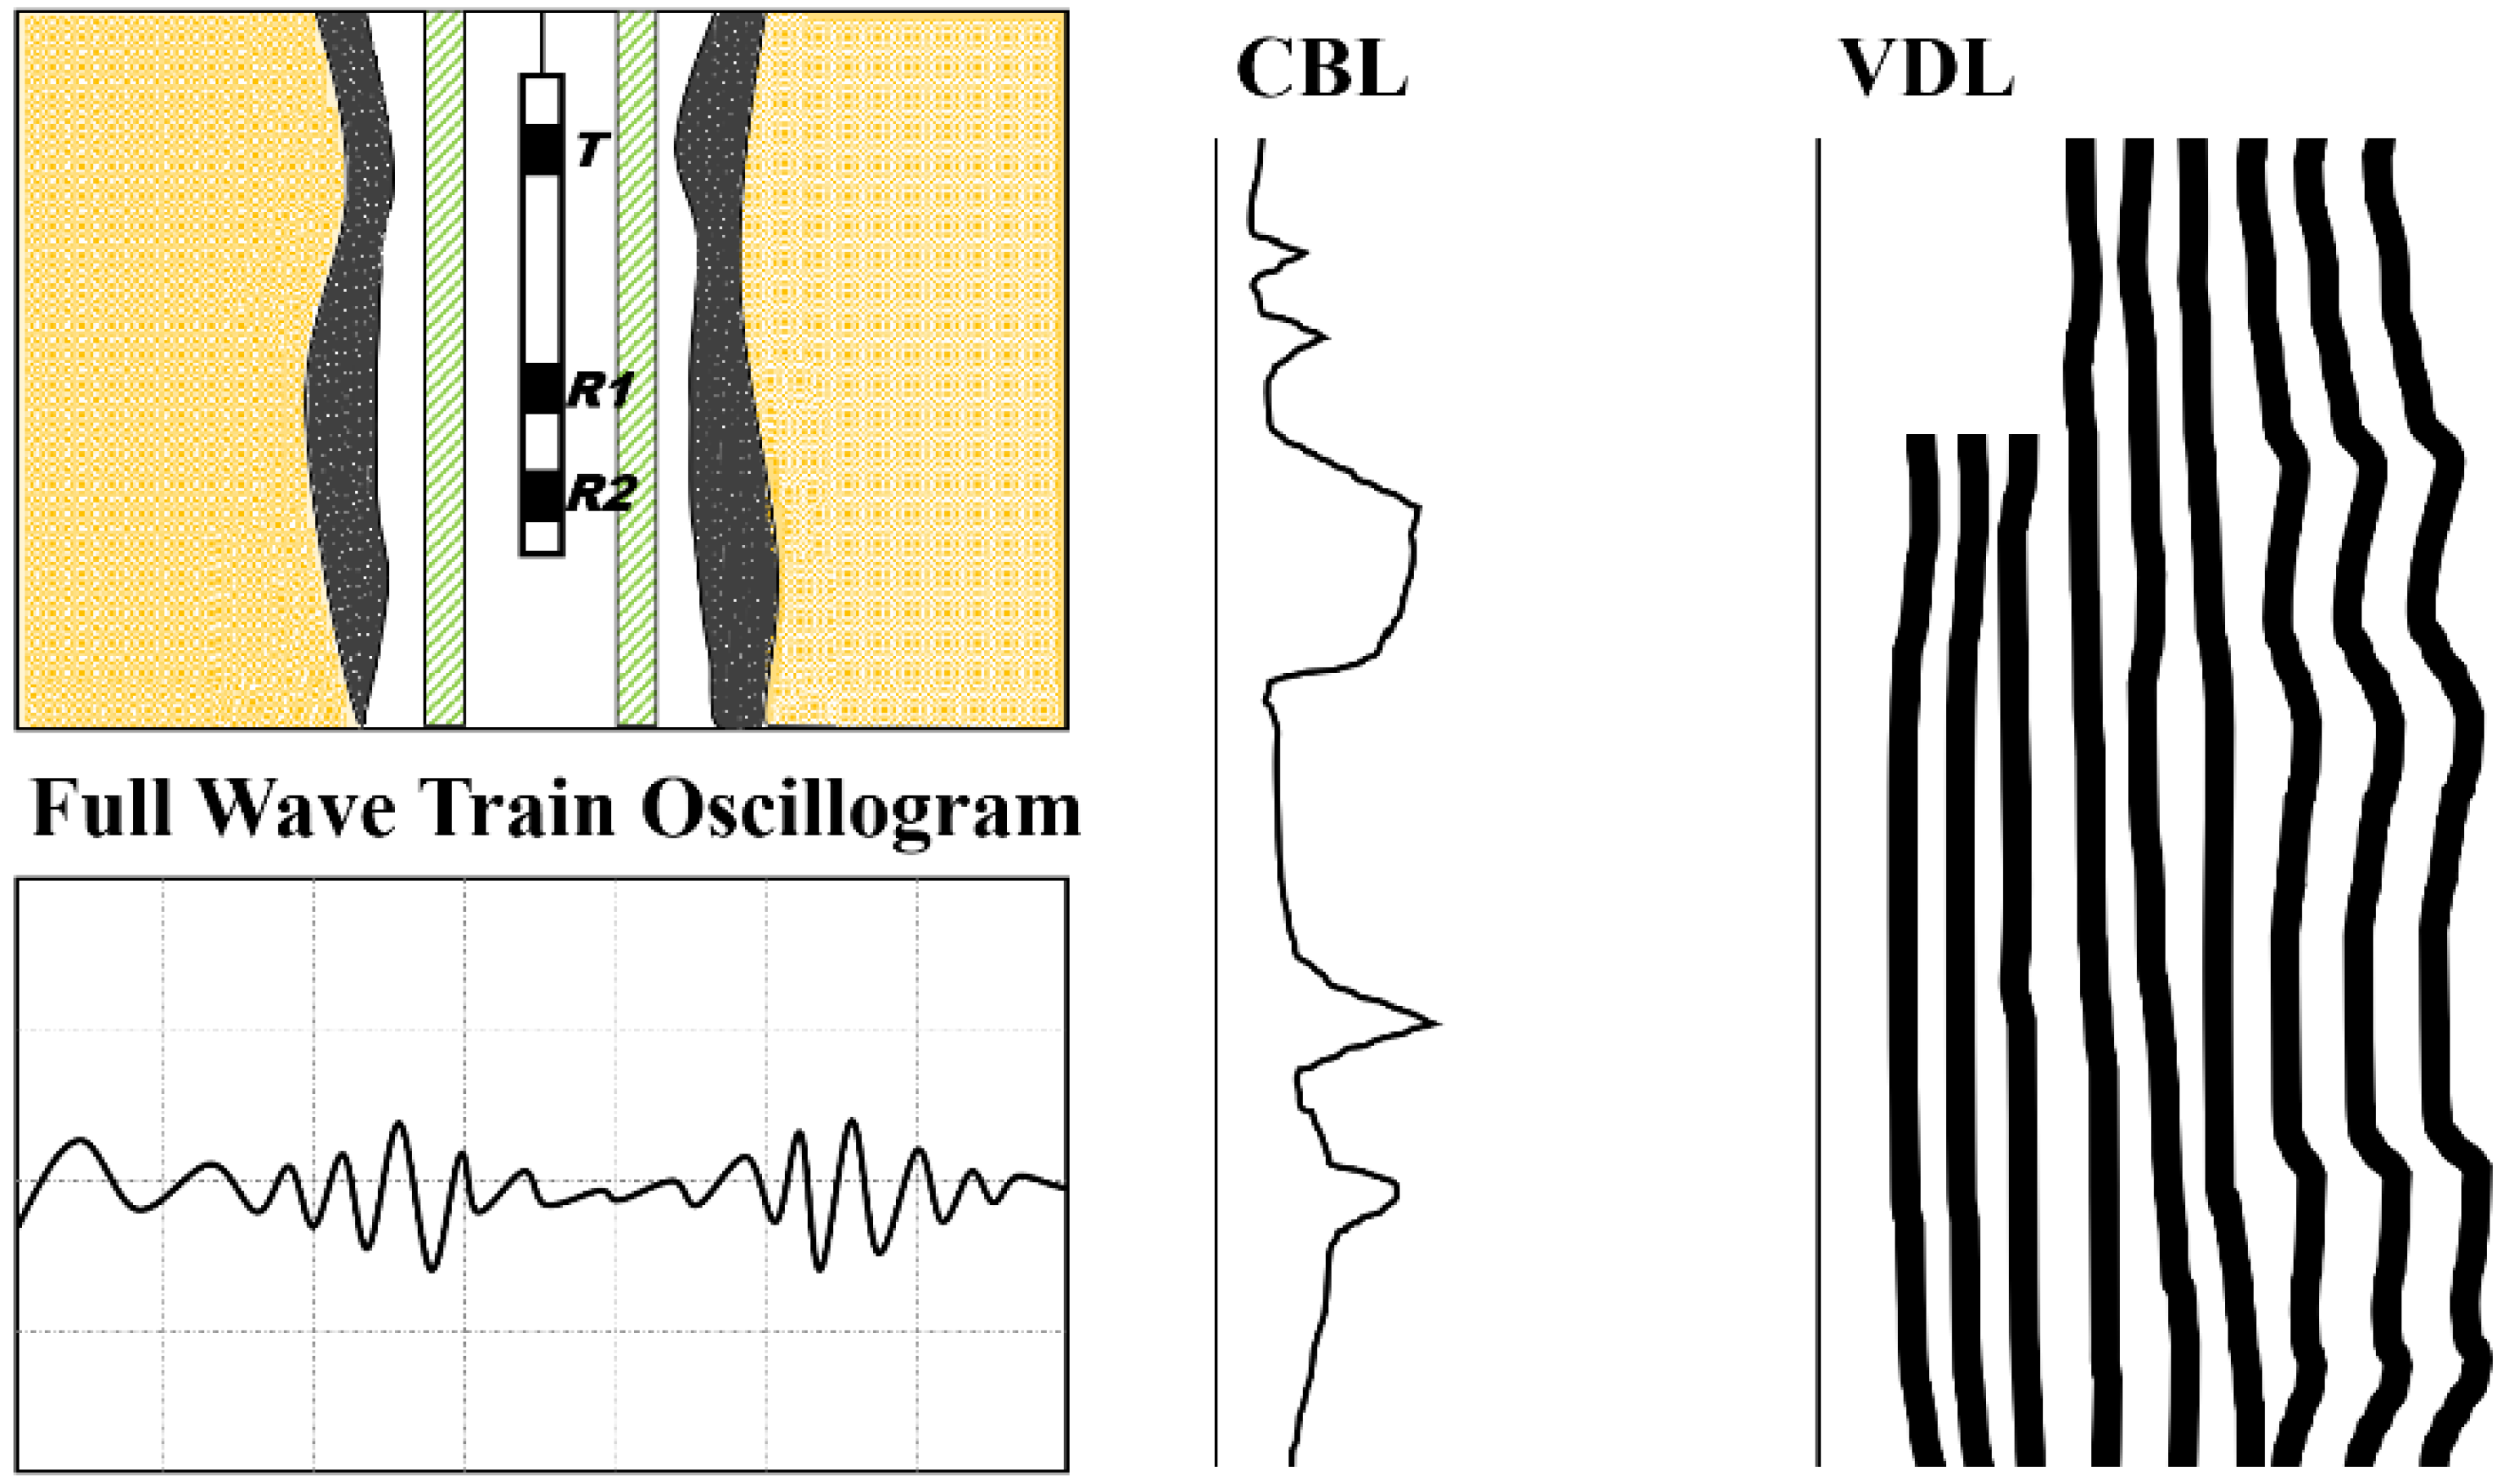
When the cement sheath is well cemented to the casing and poorly cemented to the formation, the casing wave is very weak, and the formation wave is also very weak. On the VDL, the stripes on the left and middle are fuzzy, and the signal is weak. In this case, if only looking at the sound amplitude curve, the sound amplitude is low, indicating good cementation, but this is not the case, and the cementation quality of the second interface is poor (Figure 5).
(4)
Poor cementation at the first interface, good cementation at the second interface.
The casing and cement sheath are poorly cemented, and the cement sheath is well cemented with the formation, that is, there is drilling fluid or slurry around the casing, as well as cement. On the waveform of the full wave train, the casing wave is strong. Because there is cement between the casing and the formation, the formation signal display is medium, which is stronger than the free casing. On the VDL, there are obvious stripes on the left and right sides (Figure 6).
(5)
Poor cementation of the first and second interfaces.
This situation is similar to the free casing. The casing wave is obvious, not only with many stripes—but also with large amplitude. The casing signal of some sections occupies the position of the formation wave and casing wave, which is similar to the casing wave of the free casing. The formation wave is weak, and the stripes of the drilling fluid wave appear wavy due to the influence of the casing wave.

2.1.2. Subjectivity of Manual Interpretation

Due to VDL containing a large number of light and dark stripes, the shape of the strip and the degree of light and dark depend entirely on the subjective feelings of the evaluator. Therefore, the evaluation results are mixed with the subjectivity of the evaluator. Different experts can view the same image and draw different conclusions [13]. An observer will make different judgments when interpreting the same VDL many times.
To reduce the subjectivity of manual interpretation, oil companies usually use multiple logging interpreters to work together to interpret and analyze the same logging results to obtain more accurate results, but this also further increases the time and consumes more manpower. Therefore, it is very difficult to evaluate the cementing quality accurately and efficiently. If a computer program is compiled to realize the interpretation and decision-making process of logging interpretation experts, the accuracy and efficiency of cementing quality identification will be greatly improved.

2.2. Automatic Interpretation Based on Neural Network

Machine learning algorithms, especially supervised learning algorithms, use evaluated well data for training to achieve an intelligent evaluation of cementing quality. A major advantage of supervised learning is that it does not require manual decision making. The algorithm will establish the relationship with the cementing quality after training enough amplitude variable density logging data. If the training is correct, the supervised learning algorithm can reasonably explain the data not seen in the training process.
Many scholars have applied machine learning algorithms in the field of logging interpretation. Onalo (2018) et al. [14] used neural networks to obtain information from open-hole logging data and reconstruct open-hole acoustic logging data. Belozerov (2018) et al. [7] used neural networks to identify reservoir locations from logging data, and Gkortsas (2019) et al. [15] used support vector machines and neural networks to automatically identify ultrasonic waveform characteristics, which can predict additional information about the longitudinal wave velocity of annular materials in cased wells. Deepak Kumar Voleti et al. [9] (2020) established different machine learning algorithms, such as random forest and neural network prediction based on CBL-VDL, and ultrasonic imaging data, to output the prediction results of cementing quality. Santos, L. et al. [10] (2021) used the Gaussian process regression algorithm for training and generated new characteristic curves based on CBL and VDL logging data to accurately evaluate the cementing quality.
Cementing quality evaluation based on CBL-VDL is very similar to the general image classification task. In the classification task, the variable density image is segmented and input into the neural network for training, and the cementing quality is classified in this way. Relevant scholars have conducted a large amount of research on image classification algorithms. At present, the best method is based on convolutional neural networks (CNNs) [16]. Therefore, the work of this paper is also based on a convolutional neural network to complete the classification task. However, in this problem, the VDL is not a simple image recognition task. In the VDL evaluation, it is necessary to integrate the overall and local features of the image, that is, the evaluation results of cementing quality are not only based on the light and dark features of a single strip, but also refer to the shape and density of all strips. Thus, this paper builds a multi-dimensional feature extraction convolution neural network to classify the cementing quality.

3. Data and Methods

3.1. Datasets

The data set used in this paper was the data of two independent wells in Tarim Block, Xinjiang Oilfield, China, with a total length of 5500 m, including magnetic positioning, CBL, VDL, and cementing interpretation results of two wells. The shortest interpretation interval is 1m, and the longest interpretation interval is 802 m. However, the convolutional neural network needs to input data with consistent resolution. We divided the VDL into 1 m long depth segments.
Concerning the five response characteristics of the CBL-VDL in Section 2.1.1, we developed a method for labeling the cementing quality training set, as shown in Table 1, and relabeled the training label for the data set. To ensure the accuracy of manual labeling as much as possible, we entrusted the data labeling work to three experts with years of experience in logging engineering and research, and took their interpretation results as the final data labels.

3.2. Neural Network Setting

The input of the neural network is VDL with the same size and resolution. For image-type data, the convolutional neural network has been proven to be very effective [17]. Therefore, our network settings were based on these. The network in this paper used the Tensorflow backend in Keras.
The classic convolution neural network has a convolution layer, a pooling layer, and then an encryption layer. Only increasing the number of layers or convolution cores can improve the accuracy of image recognition, but it may also lead to overfitting problems. The network settings in this paper followed the recommendations of Chollet [18]. The maximum pooling was adopted after each convolution. After the maximum pooling, the batch standardization operation was carried out. The number of convolution layers was set to 15, and the activation function of the convolution layer adopted the Relu activation function. To prevent overfitting, the encryption layer was added with Dropout, the drop probability was 0.5, and the training batch was 16 samples.
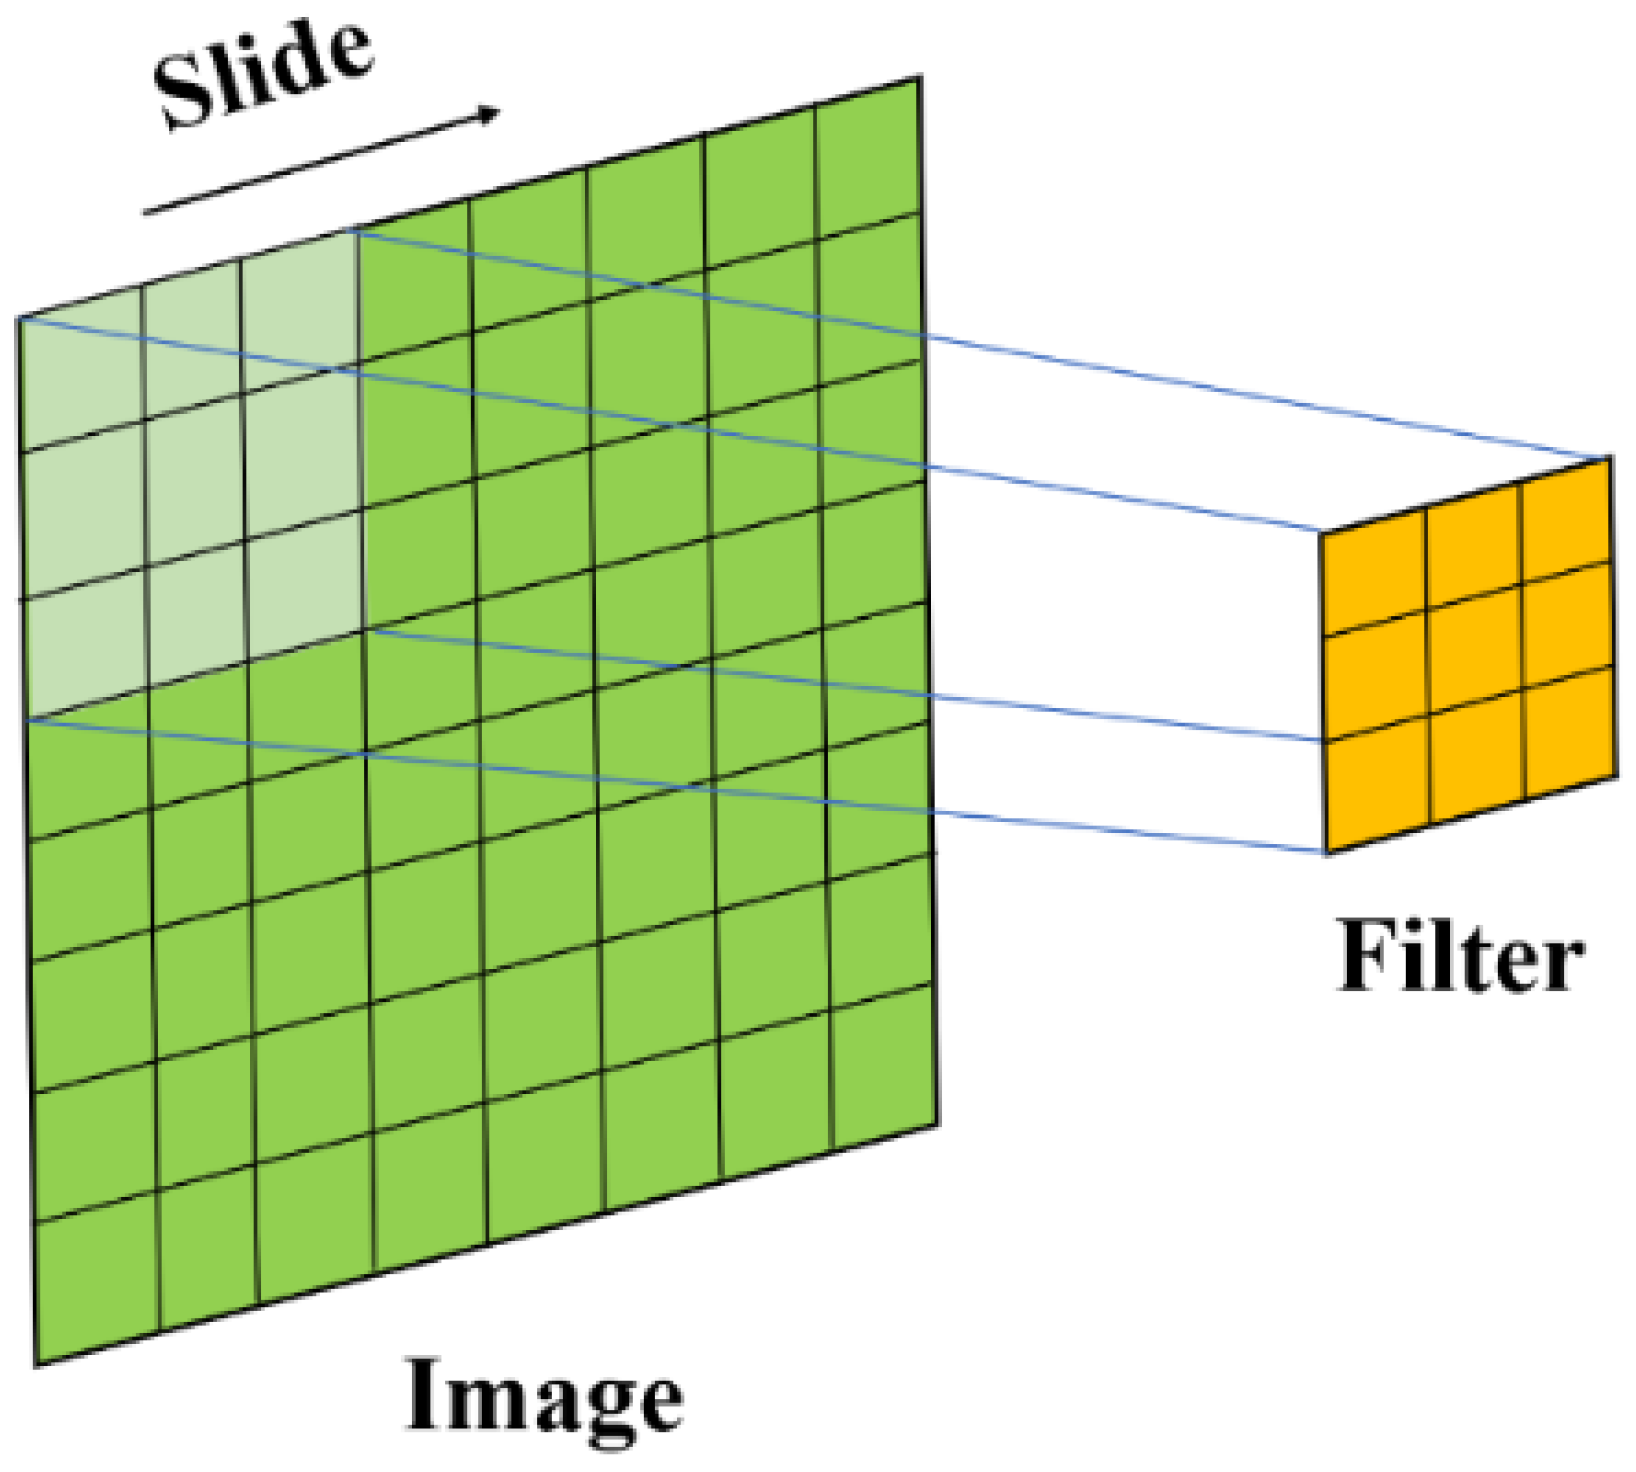
The filter is a sliding window that convolves the input data in the convolution layer to extract the features of the input data, as shown in Figure 7. The size of the filter needs to be combined with the image information to be extracted. Generally, the larger filter applies to the widely distributed information, and the smaller filter applies to the local information [19]. Considering that, when evaluating the cementing quality, it is not only necessary to observe the color, position, and waveform of the strip in the image by referring to the VDL; therefore, when extracting features, it is not only necessary to require small-scale information (strip light and shade, position), but also large-scale information (strip shape and number) in the VDL.
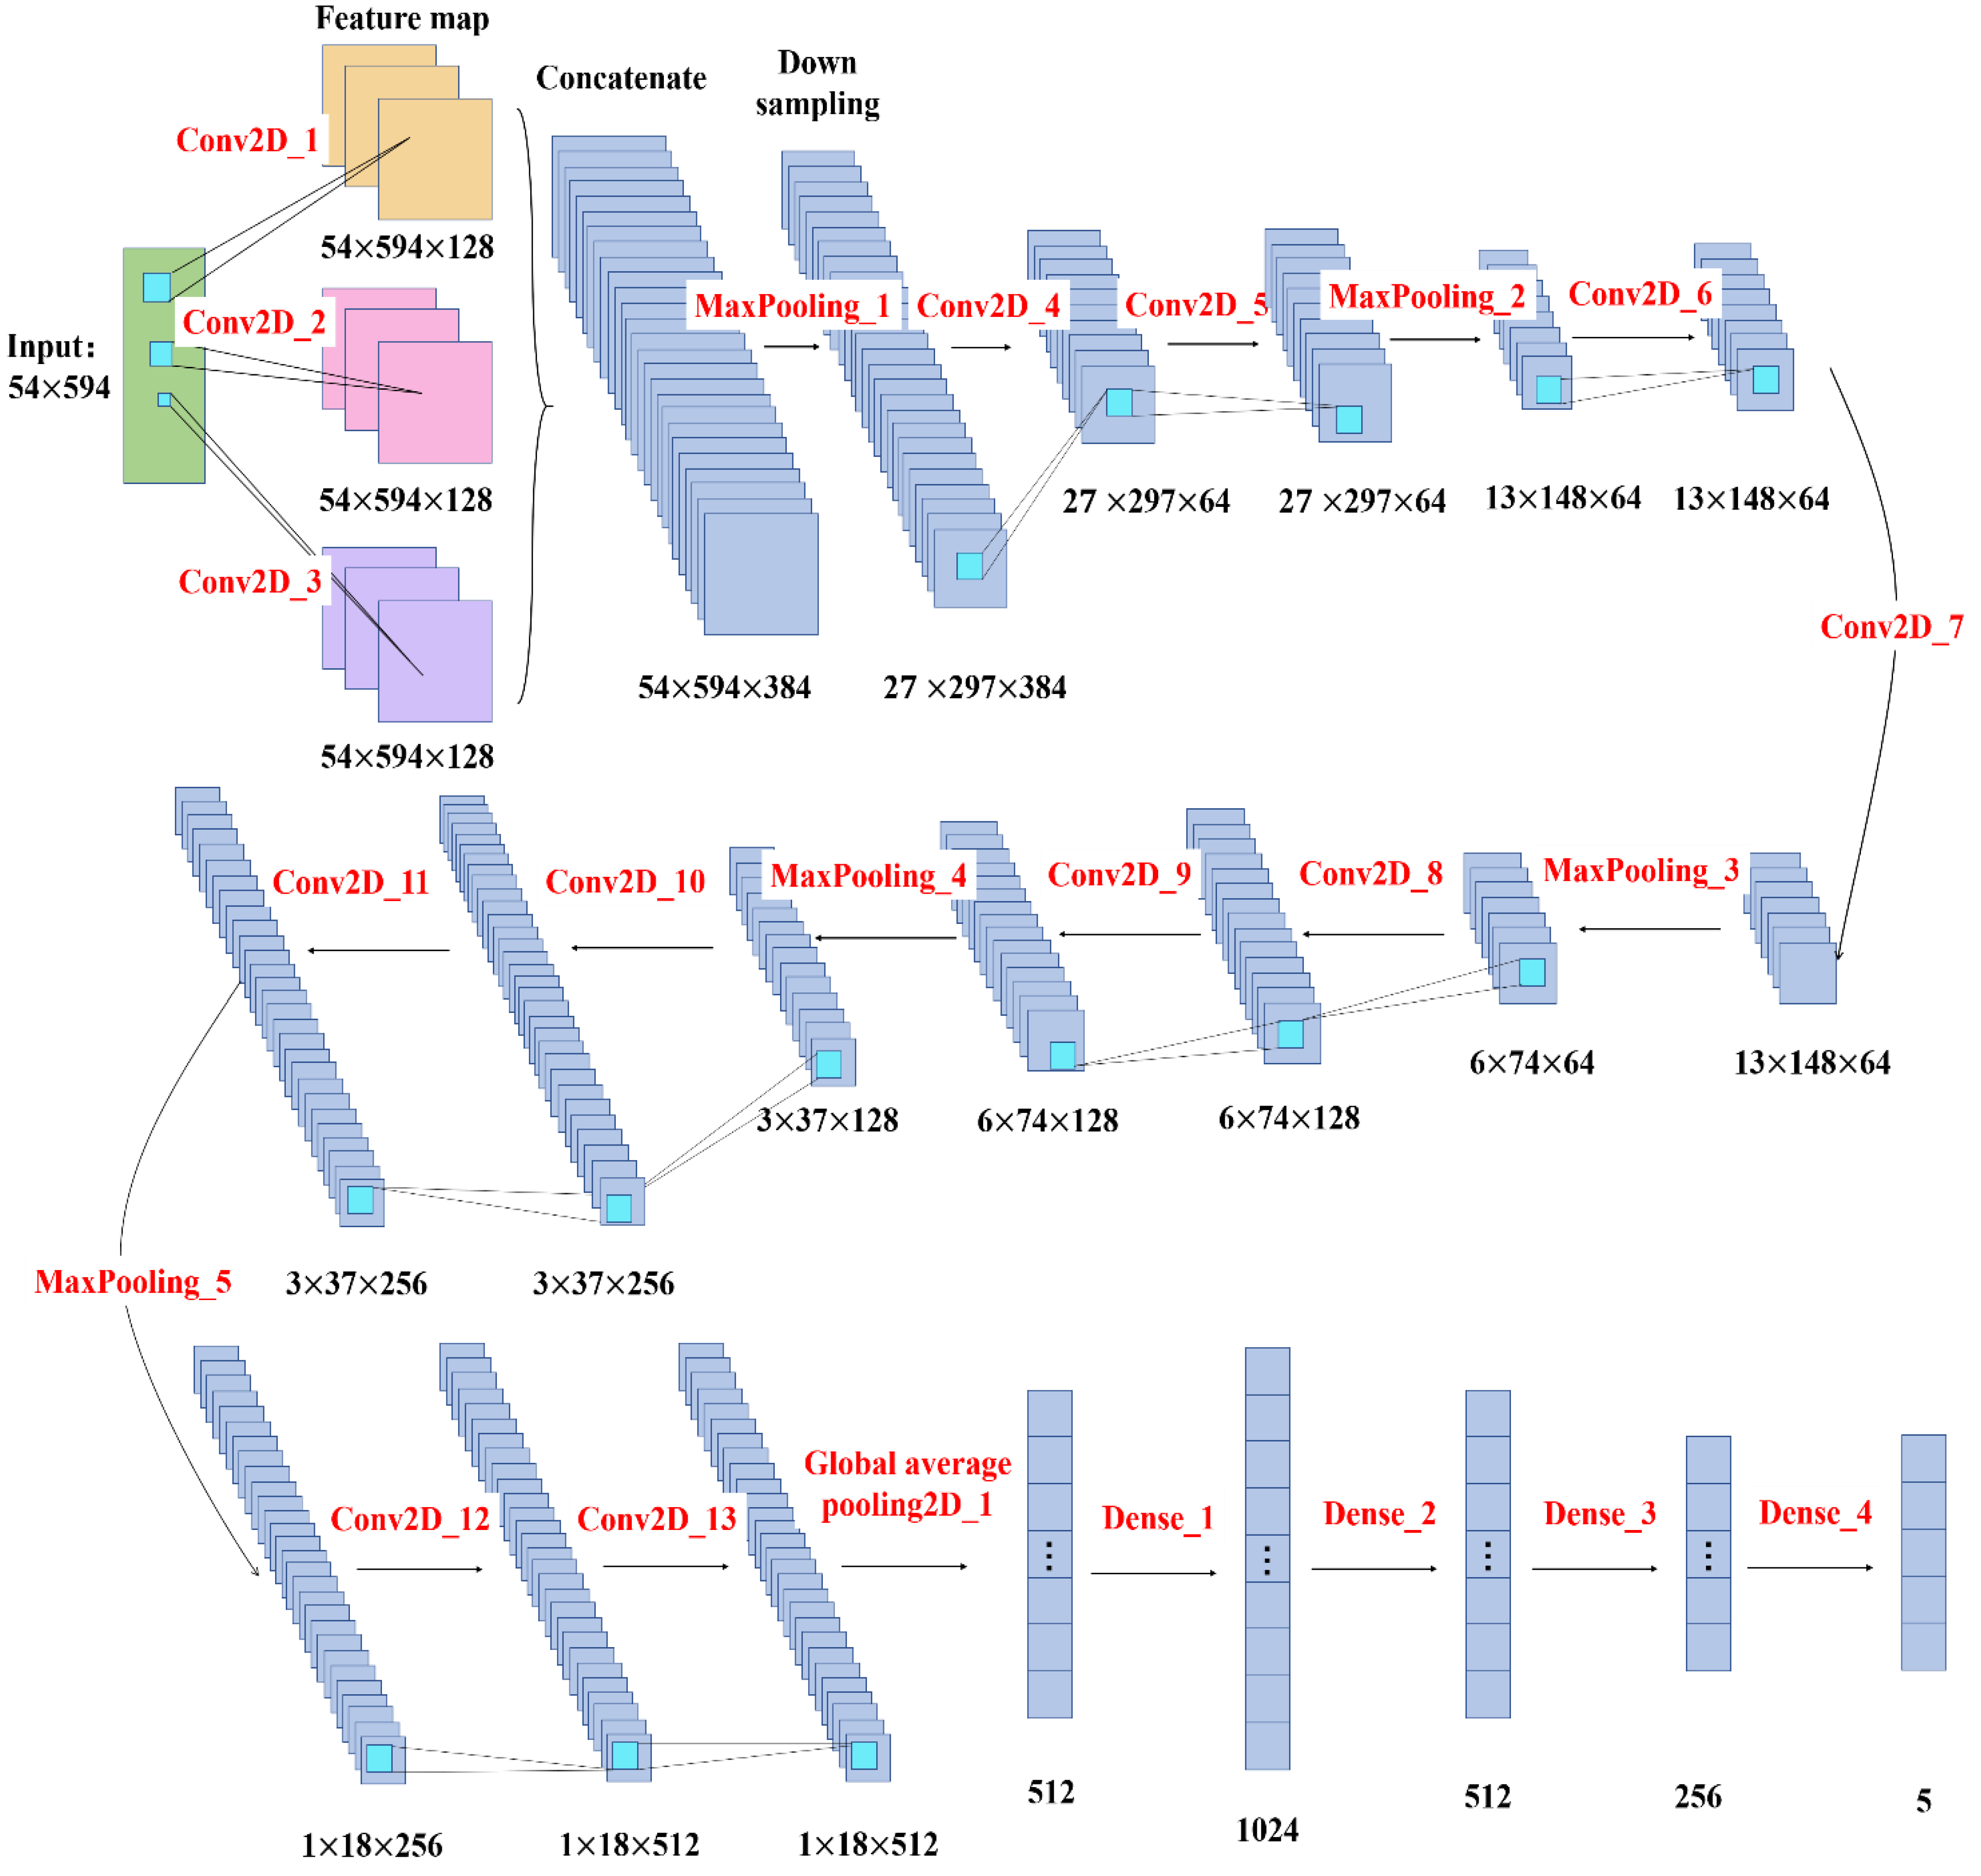
To solve this problem, this paper used multiple parallel filters of different sizes for convolution, and simultaneously detected features of different sizes, as shown in Figure 8, which is the convolution network structure used in this paper. The 1 × 1 filter looks at very localized information, whereas 5 × 5 filters will view more global characteristics, and the overall design result of the convolution network is shown in Figure 9.
In order to better fuse image information, after information splicing, this paper designed a follow-up convolution structure to continuously extract features from the fused information. The parameters of each layer of the convolution neural network are set up in Table 2.

3.3. Accuracy and Measurement Standards

In the logging interpretation, the quality can only be determined through the cement core recovery method [20]. This method is not only expensive but will also damage the integrity of proficiency. Therefore, the supervised learning algorithm used in this paper was only through model training, with a high accuracy, reproducing the evaluation results of cementing quality by experts based on CBL-VDL.
In this paper, the accuracy rate was used as the measurement standard of the model. The accuracy rate is the proportion of the number of correctly classified samples in the total number of samples. For the sample set D, m samples, the calculation formula of the accuracy rate is as follows:
a c c ( f ; D ) = 1 m i = 1 m ( f ( x i ) = y i )
In this paper, the cross-entropy function was selected as the loss function of the model. Cross entropy can measure the difference between two different probability distributions in the same random variable, which is expressed as the difference between the real probability distribution and the predicted probability distribution. The smaller the value of cross-entropy, the better the prediction effect of the model. It was used with the softmax function in the program to process the output results so that the sum of the predicted values of multiple classifications was 1, and then the loss was calculated through cross-entropy. The calculation formula is as follows:
L oss = 1 N i L i = 1 N i c = 1 M y i c log ( p i c )
where M, as a variable, represents the number of classifications; parameter y i c indicates whether this category belongs to the same category as sample i, and 0 if the same category is 1 but different; parameter p i c is the prediction probability that sample i belongs to category c.

4. Results and Discussion

In this paper, the data of Well B-1 and Well B-2 in Tarim Oilfield were used to train, verify, and test the intelligent evaluation model of cementing quality. A total of 5500 pieces of data were used, 70% of which were randomly selected for training and verification, and 30% of which were used for model testing. The model was trained by an Adam optimizer. Compared with the traditional SGD algorithm, the Adam optimizer can adaptively adjust the learning rate during the training iteration process, significantly improving the learning speed of the model [21]. Based on the parameters set by the neural network in Section 3.2, the model was built and trained on the platform.
The model training results are shown in Figure 10. After 40 epochs, the identification accuracy of the intelligent evaluation model for cementing quality reached 90%, as shown in Figure 10a, meeting the engineering requirements. However, to further improve the accuracy of the model, this paper optimized the model in terms of the network structure.

4.1. Impact of Network Structure on Results

To prove that the convolution neural network with multiple filters of different sizes is better, this paper compared the VGG-16, VGG-19, ResNet-18, ResNet-34, and AlexNet convolution networks commonly used in the field of image recognition with the convolution neural network in this paper using four indicators, namely, cross-entropy, validation set accuracy, time complexity, and space complexity.
  • Time complexity
Time complexity, that is, the number of operations of the model, can be measured by FLOPs [22], that is, floating point operations. Time complexity determines the training/prediction time of the model. If the complexity is too high, model training and prediction will consume a large amount of time. We can neither quickly verify ideas and improve models nor can we quickly predict. The time complexity formula for a single convolution layer is as follows:
T i m e ~ O ( M 2 K 2 C i n C o u t )
where M is the side length of the output characteristic graph of each convolution kernel; K is the side length of each convolution kernel; Cin is the number of channels of each convolution kernel, that is, the number of input channels, that is, the number of output channels of the upper layer; Cout is the number of convolution cores of the convolution layer, that is, the number of output channels;
It can be seen that the time complexity of each convolution kernel is completely determined by the area of the output feature map M2, the area of the convolution kernel K2, the number of input channels Cin, and the number of output channels Cout. The output feature size itself is determined by the input matrix size X, convolution kernel size K, padding, and stride, which are shown as follows:
M = ( X K + 2 × P a d d i n g ) S t r i d e + 1
The overall time complexity of the convolutional neural network is the sum of the time complexity of all convolutional layers. The calculation formula is as follows:
T i m e ~ O ( l = 1 D M l 2 K l 2 C l 1 C l )
where D is the number of convolution kernels possessed by the neural network, that is, the depth of the network; l is the l-th convolution layer of the neural network; Cl is the number of output channels of the l-th convolution layer of the neural network, Cout, that is, the number of convolution cores of this layer; for the convolution layer, the number of input channels Cin is the number of output channels of the (l-1)-th convolution layer.
2.
Space complexity
The number of parameters of the model determines the space complexity. Due to the limitation of the dimension curse, the more parameters of the model, the more data required for training the model. However, the data set in real life is usually not too large, which will lead to an easier overfitting of model training. The space complexity is calculated as follows:
S p a c e ~ O ( l = 1 D K l 2 C l 1 C l + l = 1 D M 2 C l )
The total parameters are only related to the size K, channel number C, and layer number D of the convolution kernel, and are independent of the size of the input data.
Through the calculation of cross-entropy, model accuracy, network time complexity, and space complexity, the results of the six models are shown in Table 3. It can be seen from Figure 11 that the multi-scale perceptual convolutional neural network established in this paper has a high model accuracy. From Figure 12, it can be concluded that the convolutional neural network established in this paper is superior to other convolutional neural network models in terms of the time complexity and space complexity model.

4.2. Model Stability Analysis

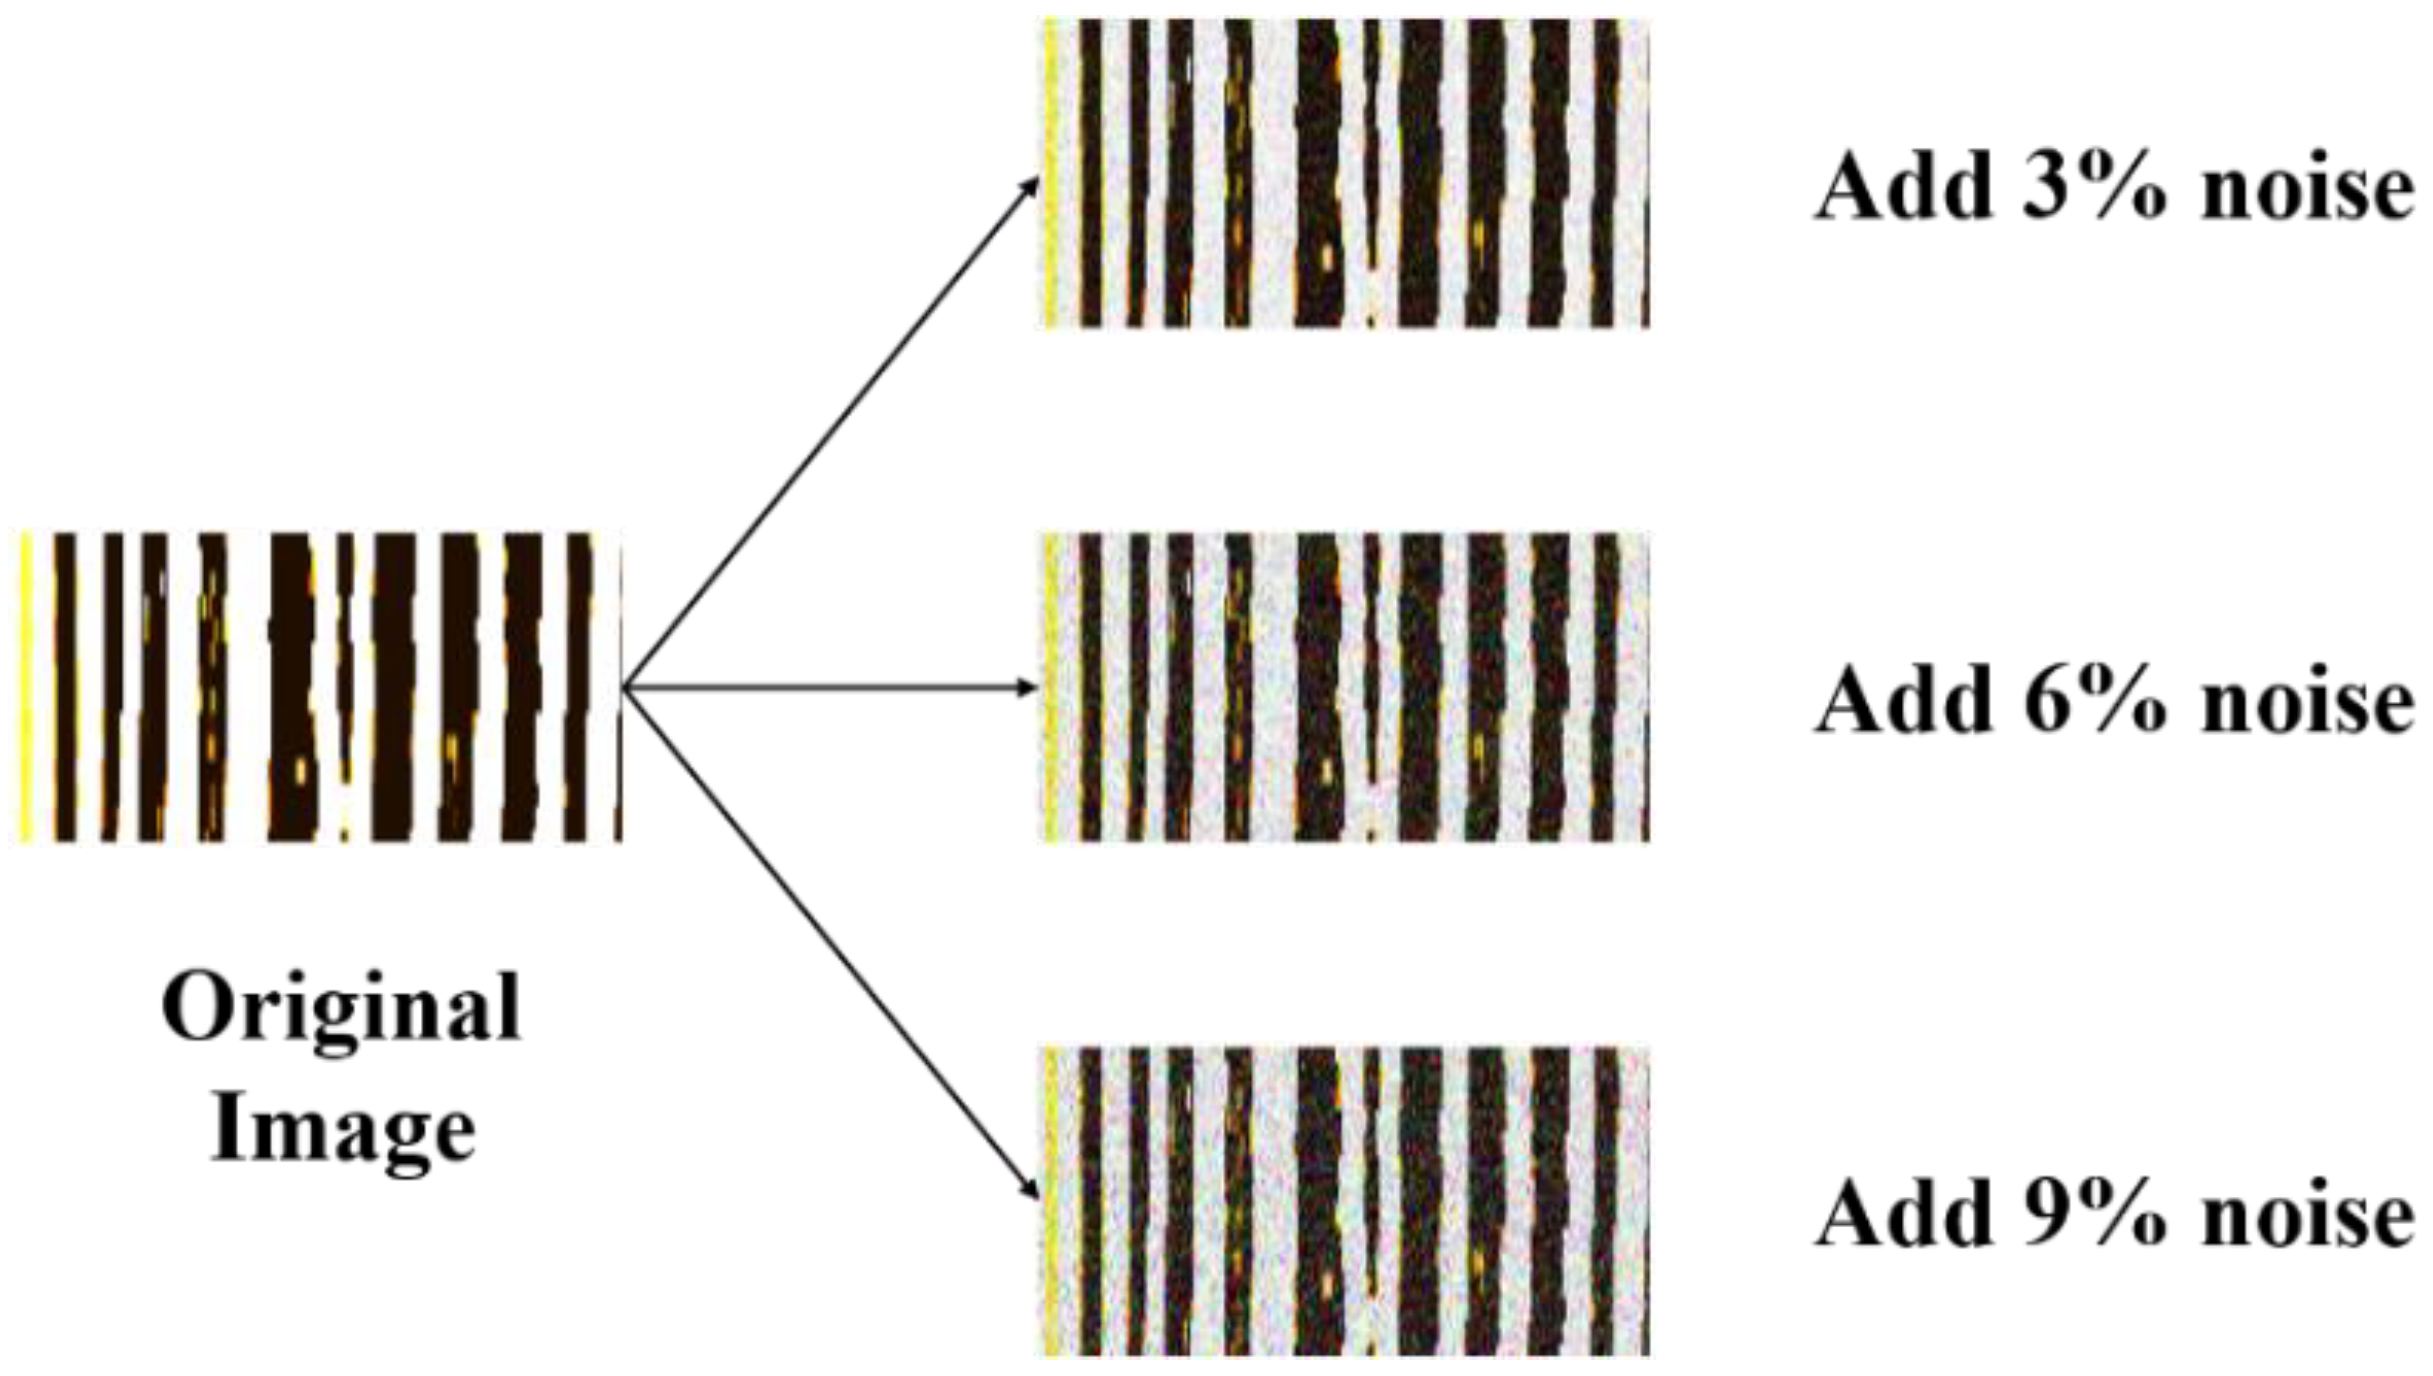
During logging interpretation, the generated variable density image may be disturbed and distorted. In order to test whether the multi-scale perceptual convolution neural network can accurately identify, this paper explored the anti-interference of the model. To verify the stability of the model [23], this paper added 3%, 6%, and 9% white noise to the variable density image, as shown in Figure 13. Six different convolutional neural networks were used to identify the cementing quality. The operation results are as follows:
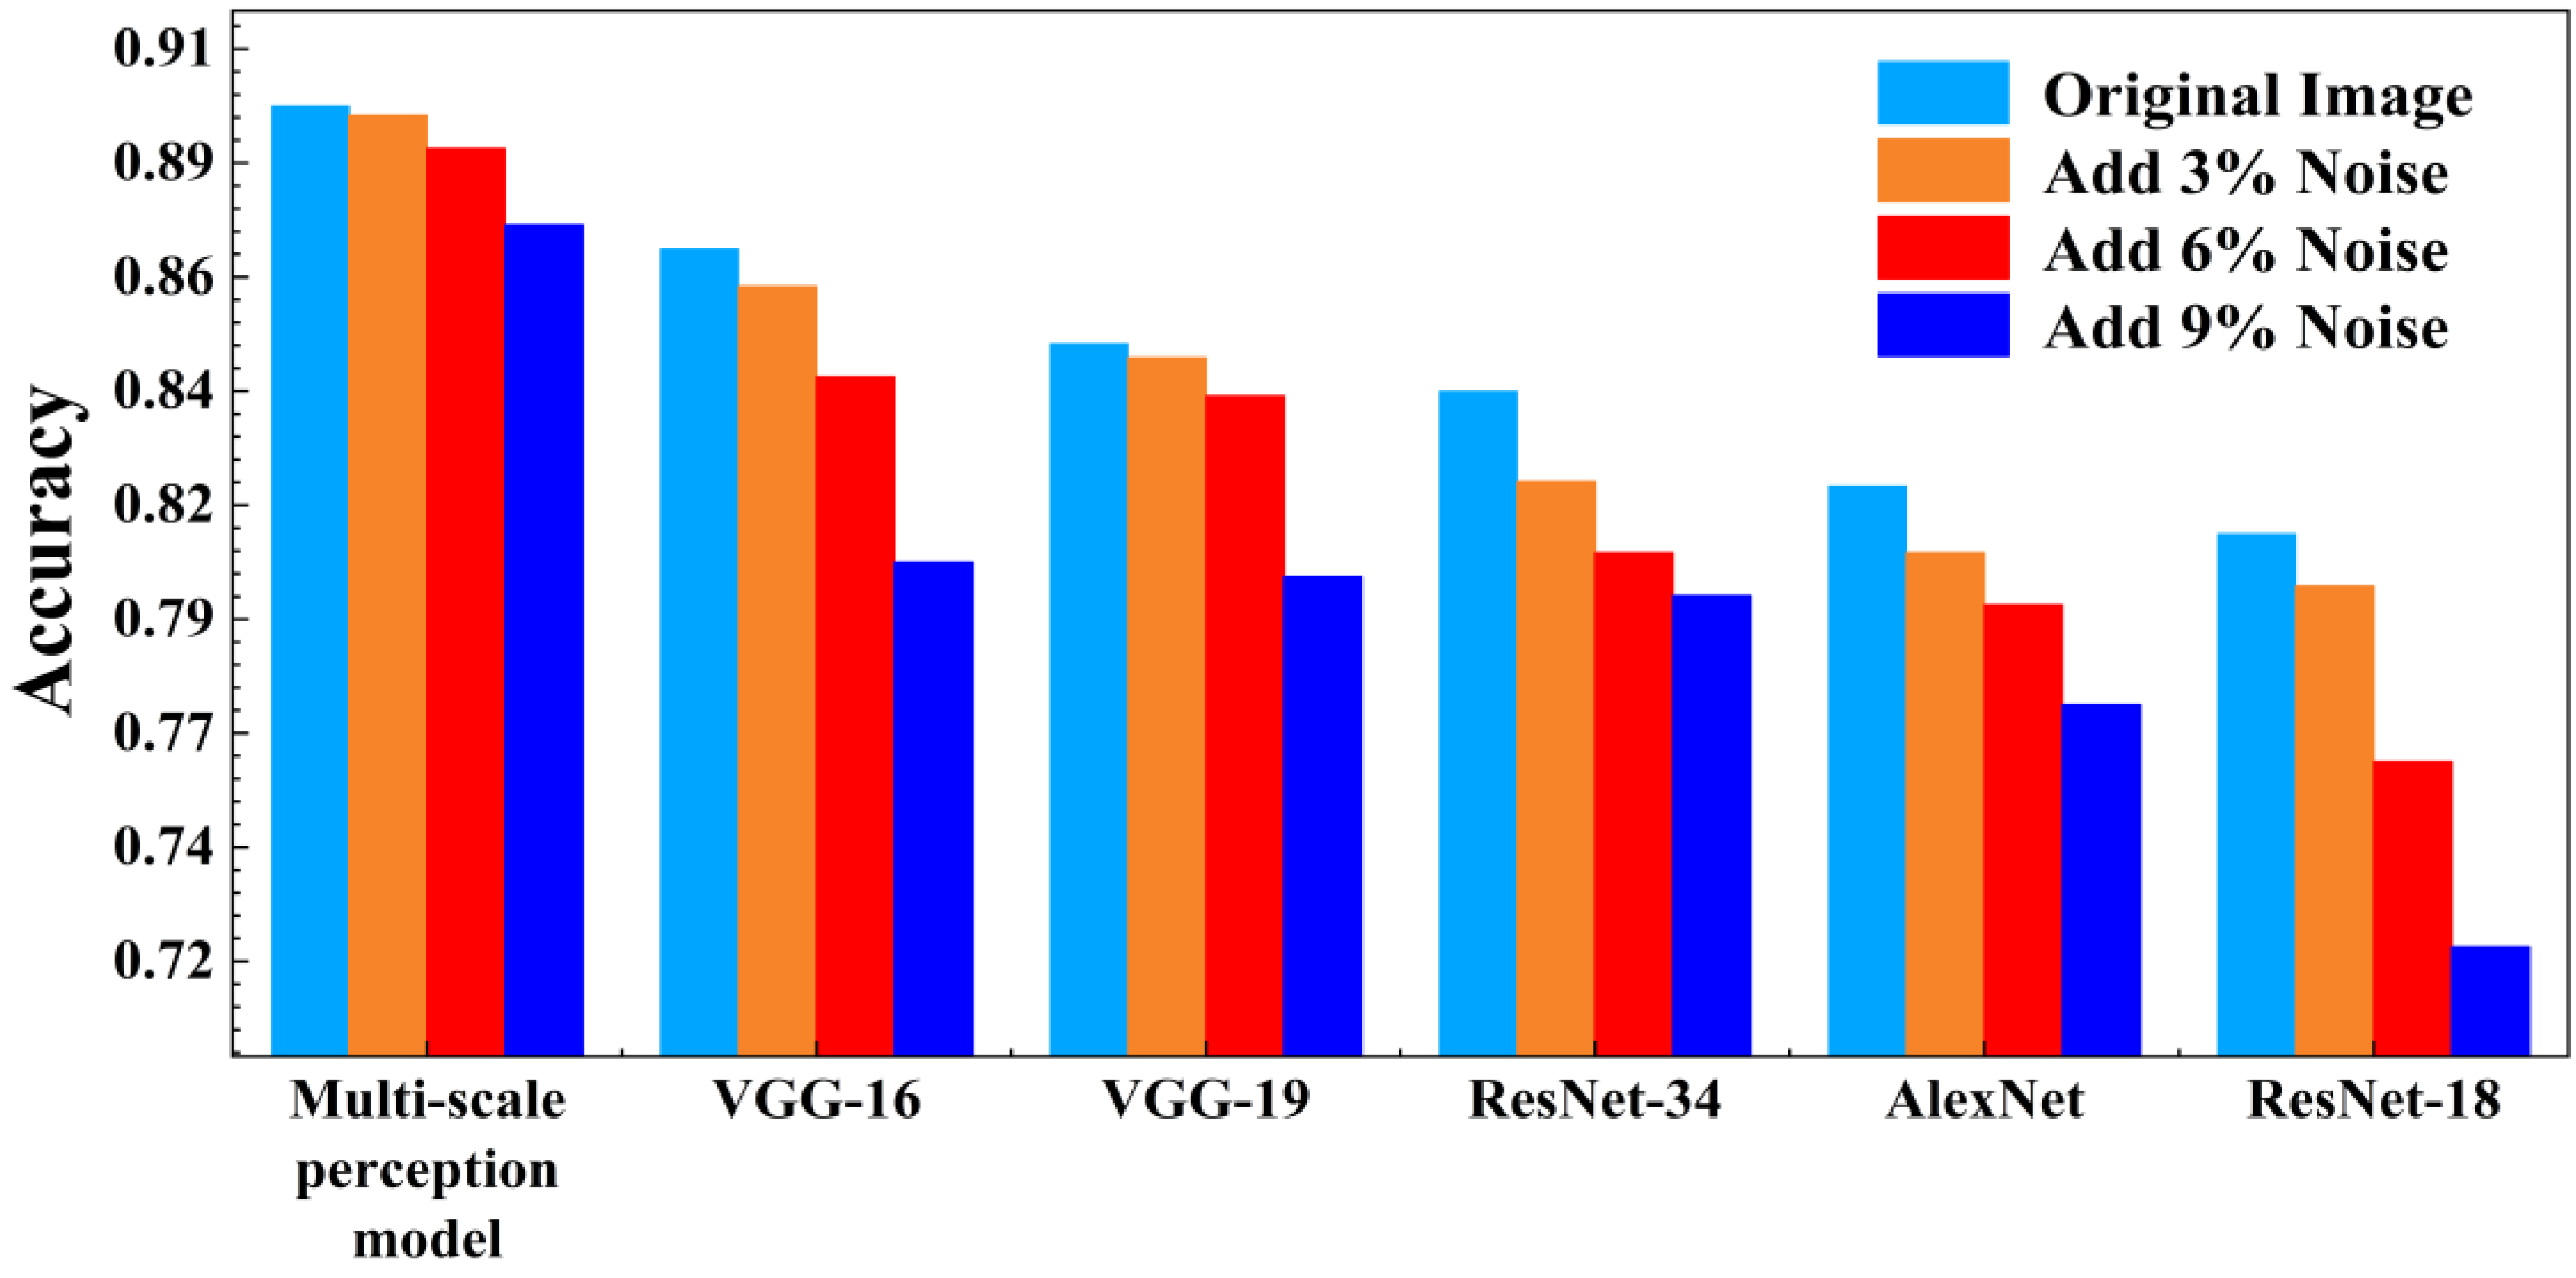
It can be seen from Figure 14 That, compared with other convolutional neural networks, the multi-scale perceptual convolutional neural network established in this paper has a stronger anti-interference ability. This is because this model has convolution cores of different sizes, which can extract image features from multiple scales, and fuse the features, resulting in a better image representation and stronger anti-interference ability. Therefore, even if the variable density logging image is distorted and has noise, the multi-scale perceptual convolution neural network proposed in this paper can still accurately evaluate the cementing quality.

5. Conclusions

It is a challenging problem to interpret cementing quality by logging data, and it is also a challenging problem to establish an automatic interpretation and analysis method with high accuracy. In the work of this paper, we showed that the variable density image can be automatically recognized by a convolution neural network and the cementing quality can be evaluated. The multi-scale perceptual convolution neural network established in this paper can capture and integrate more image features. Compared with the traditional convolution neural network model, this model is more suitable for identifying variable density images of logging and evaluating cementing quality. Through data experiments, a multi-scale perceptual convolution neural network not only has a higher recognition accuracy and smaller model complexity, but also has a stronger anti-interference ability, which can be better applied to the recognition of variable density images of logging and the evaluation of cementing quality.

Author Contributions

Conceptualization, C.F. and X.S.; software, Z.W.; formal analysis, Z.Z.; data curation, D.Y.; writing—original draft preparation, M.L.; writing—review and editing, Z.W.; visualization, Z.W.; project administration, X.S.; funding acquisition, C.F. All authors have read and agreed to the published version of the manuscript.

Funding

This research was funded by Sinopec Key Laboratory of Well Cementing and Completion (Grant No. 21-GWJ-KF-02).

Institutional Review Board Statement

Not applicable.

Informed Consent Statement

Not applicable.

Data Availability Statement

Not applicable.

Conflicts of Interest

The authors declare no conflict of interest.

References

  1. Al Farsi, G. Casing Failures Correlated with Cementing Quality in Steam Injection Wells. In Proceedings of the SPE Annual Technical Conference and Exhibition, Amsterdam, The Netherlands, 27 October 2014. [Google Scholar] [CrossRef]
  2. Ravi, K.; Weber, L. Drill-Cutting Removal in a Horizontal Wellbore for Cementing. In Proceedings of the Society of Petroleum Engineers SPE/IADC Drilling Conference, New Orleans, LA, USA, 3 December 1996. [Google Scholar] [CrossRef]
  3. Time, E.; Viggen, E.M.; Mishra, S.; Berg, E. Assisted Cement Log Interpretation. In Proceedings of the SPE Norway Subsurface Conference, Bergen, Norway, 22 April 2022. [Google Scholar] [CrossRef]
  4. Viggen, E.M.; Merciu, I.A.; Løvstakken, L.; Måsøy, S.-E. Automatic interpretation of cement evaluation logs from cased boreholes using supervised deep neural networks. J. Pet. Sci. Eng. 2020, 195, 107539. [Google Scholar] [CrossRef]
  5. Benge, G. Cement Evaluation—A Risky Business. Spe Drill. Completion 2016, 30, 322–326. [Google Scholar] [CrossRef]
  6. Hanif, R.; Ashour, S.H.; Yee, S.; Hay, M.A. Understanding Cement Quality in Intermediate Casing Against Aquifers Using Cement Bond Logs: A Case Study of Cementing Against Aquifers in UAE. In Proceedings of the SPE/IADC Middle East Drilling Technology Conference and Exhibition, Abu Dhabi, United Arab Emirates, 29 January 2018. [Google Scholar] [CrossRef]
  7. Belozerov, B.; Bukhanov, N.; Egorov, D. Automatic Well Log Analysis Across Priobskoe Field Using Machine Learning Methods. In Proceedings of the SPE Russian Petroleum Technology Conference, Moscow, Russia, 15 October 2018. [Google Scholar] [CrossRef]
  8. Xiangjun, C.; Weiyan, L.; Shunhui, Y. New problems and ideas in cementing quality evaluation. Logging Technol. 2015, 39, 1–5. [Google Scholar] [CrossRef]
  9. Voleti, D.K.; Reddicharla, N.; Guntupalli, S. Smart Way for Consistent Cement Bond Evaluation and Reducing Human Bias Using Machine Learning. In Proceedings of the Abu Dhabi International Petroleum Exhibition & Conference, Abu Dhabi, United Arab Emirates, 11 September 2020. [Google Scholar] [CrossRef]
  10. Santos, L.; Taleghani, A.D. Machine learning framework to generate synthetic cement evaluation logs for wellbore integrity analysis. In Proceedings of the 55th U.S. Rock Mechanics/Geomechanics Symposium, Virtual, 18 June 2021. [Google Scholar]
  11. Pardue, G.H.; Morris, R.L. Cement Bond Log-A Study of Cement and Casing Variables. J. Pet. Technol. 1963, 15, 545–555. [Google Scholar] [CrossRef]
  12. Fan, H.; Yu, J. Cementing and Completion Operations; Petroleum Industry Press: Beijing, China, 2007; pp. 110–111. [Google Scholar]
  13. Popović, Z.B.; Thomas, J.D. A user’s guide. Cardiovascular Diagnosis and Therapy. Assess. Obs. Var. 2017, 7, 317–324. [Google Scholar] [CrossRef] [Green Version]
  14. Onalo, D.; Adedigba, S.; Khan, F.; James, L.A.; Butt, S. Data driven model for sonic well log prediction. J. Pet. Sci. Eng. 2018, 170, 1022–1037. [Google Scholar] [CrossRef]
  15. Gkortsas, V.-M.; Bose, S.; Zeroug, S. Machine learning for the automated detection of diagnosis-revealing features on leaky flexural wave imager data. In Proceedings of the 45th Annual Review of Progress in Quantitative Nondestructive Evaluation, Burlington, VT, USA, 15 July 2018. [Google Scholar] [CrossRef]
  16. He, H.; Xu, H.; Zhang, Y.; Gao, K.; Li, H.; Ma, L.; Li, J. Mask R-CNN based automated identification and extraction of oil well sites. Int. J. Appl. Earth Obs. Geoinf. 2022, 112, 102875. [Google Scholar] [CrossRef]
  17. Shelhamer, E.; Long, J.; Darrell, T. Fully Convolutional Networks for Semantic Segmentation. IEEE Trans. Pattern Anal. Mach. Intell. 2017, 39, 640–651. [Google Scholar] [CrossRef] [PubMed]
  18. Chollet, F. Deep Learning with Python; Manning Publications, Co.: Shelter Island, NY, USA, 2018; pp. 213–220. [Google Scholar]
  19. Khan, A.; Sohail, A.; Zahoora, U.; Qureshi, A.S. A survey of the recent architectures of deep convolutional neural networks. Artif. Intell. Rev. 2020, 53, 5455–5516. [Google Scholar] [CrossRef] [Green Version]
  20. Crow, W.; Carey, J.W.; Gasda, S.; Williams, D.B.; Celia, M. Wellbore integrity analysis of a natural CO2 producer. Int. J. Greenh. Gas Control. 2010, 4, 186–197. [Google Scholar] [CrossRef]
  21. Zhongyuan, W.; Zhang, X.; Zhang, C.; Wang, H. Lithology identification method based on LSTM recurrent neural network. Lithol. Reserv. 2021, 33, 120–128. [Google Scholar] [CrossRef]
  22. Smirnov, E.A.; Timoshenko, D.M.; Andrianov, S.N. Comparison of Regularization Methods for ImageNet Classification with Deep Convolutional Neural Networks. Aasri Procedia 2014, 6, 89–94. [Google Scholar] [CrossRef]
  23. Nazaré, T.S.; da Costa, G.B.P.; Contato, W.A.; Ponti, M. Deep Convolutional Neural Networks and Noisy Images. Progress in Pattern Recognition, Image Analysis, Computer Vision, and Applications. In Proceedings of the 22nd Iberoamerican Congress, CIARP 2017, Valparaíso, Chile, 7–10 November 2017; pp. 416–424. [Google Scholar] [CrossRef]
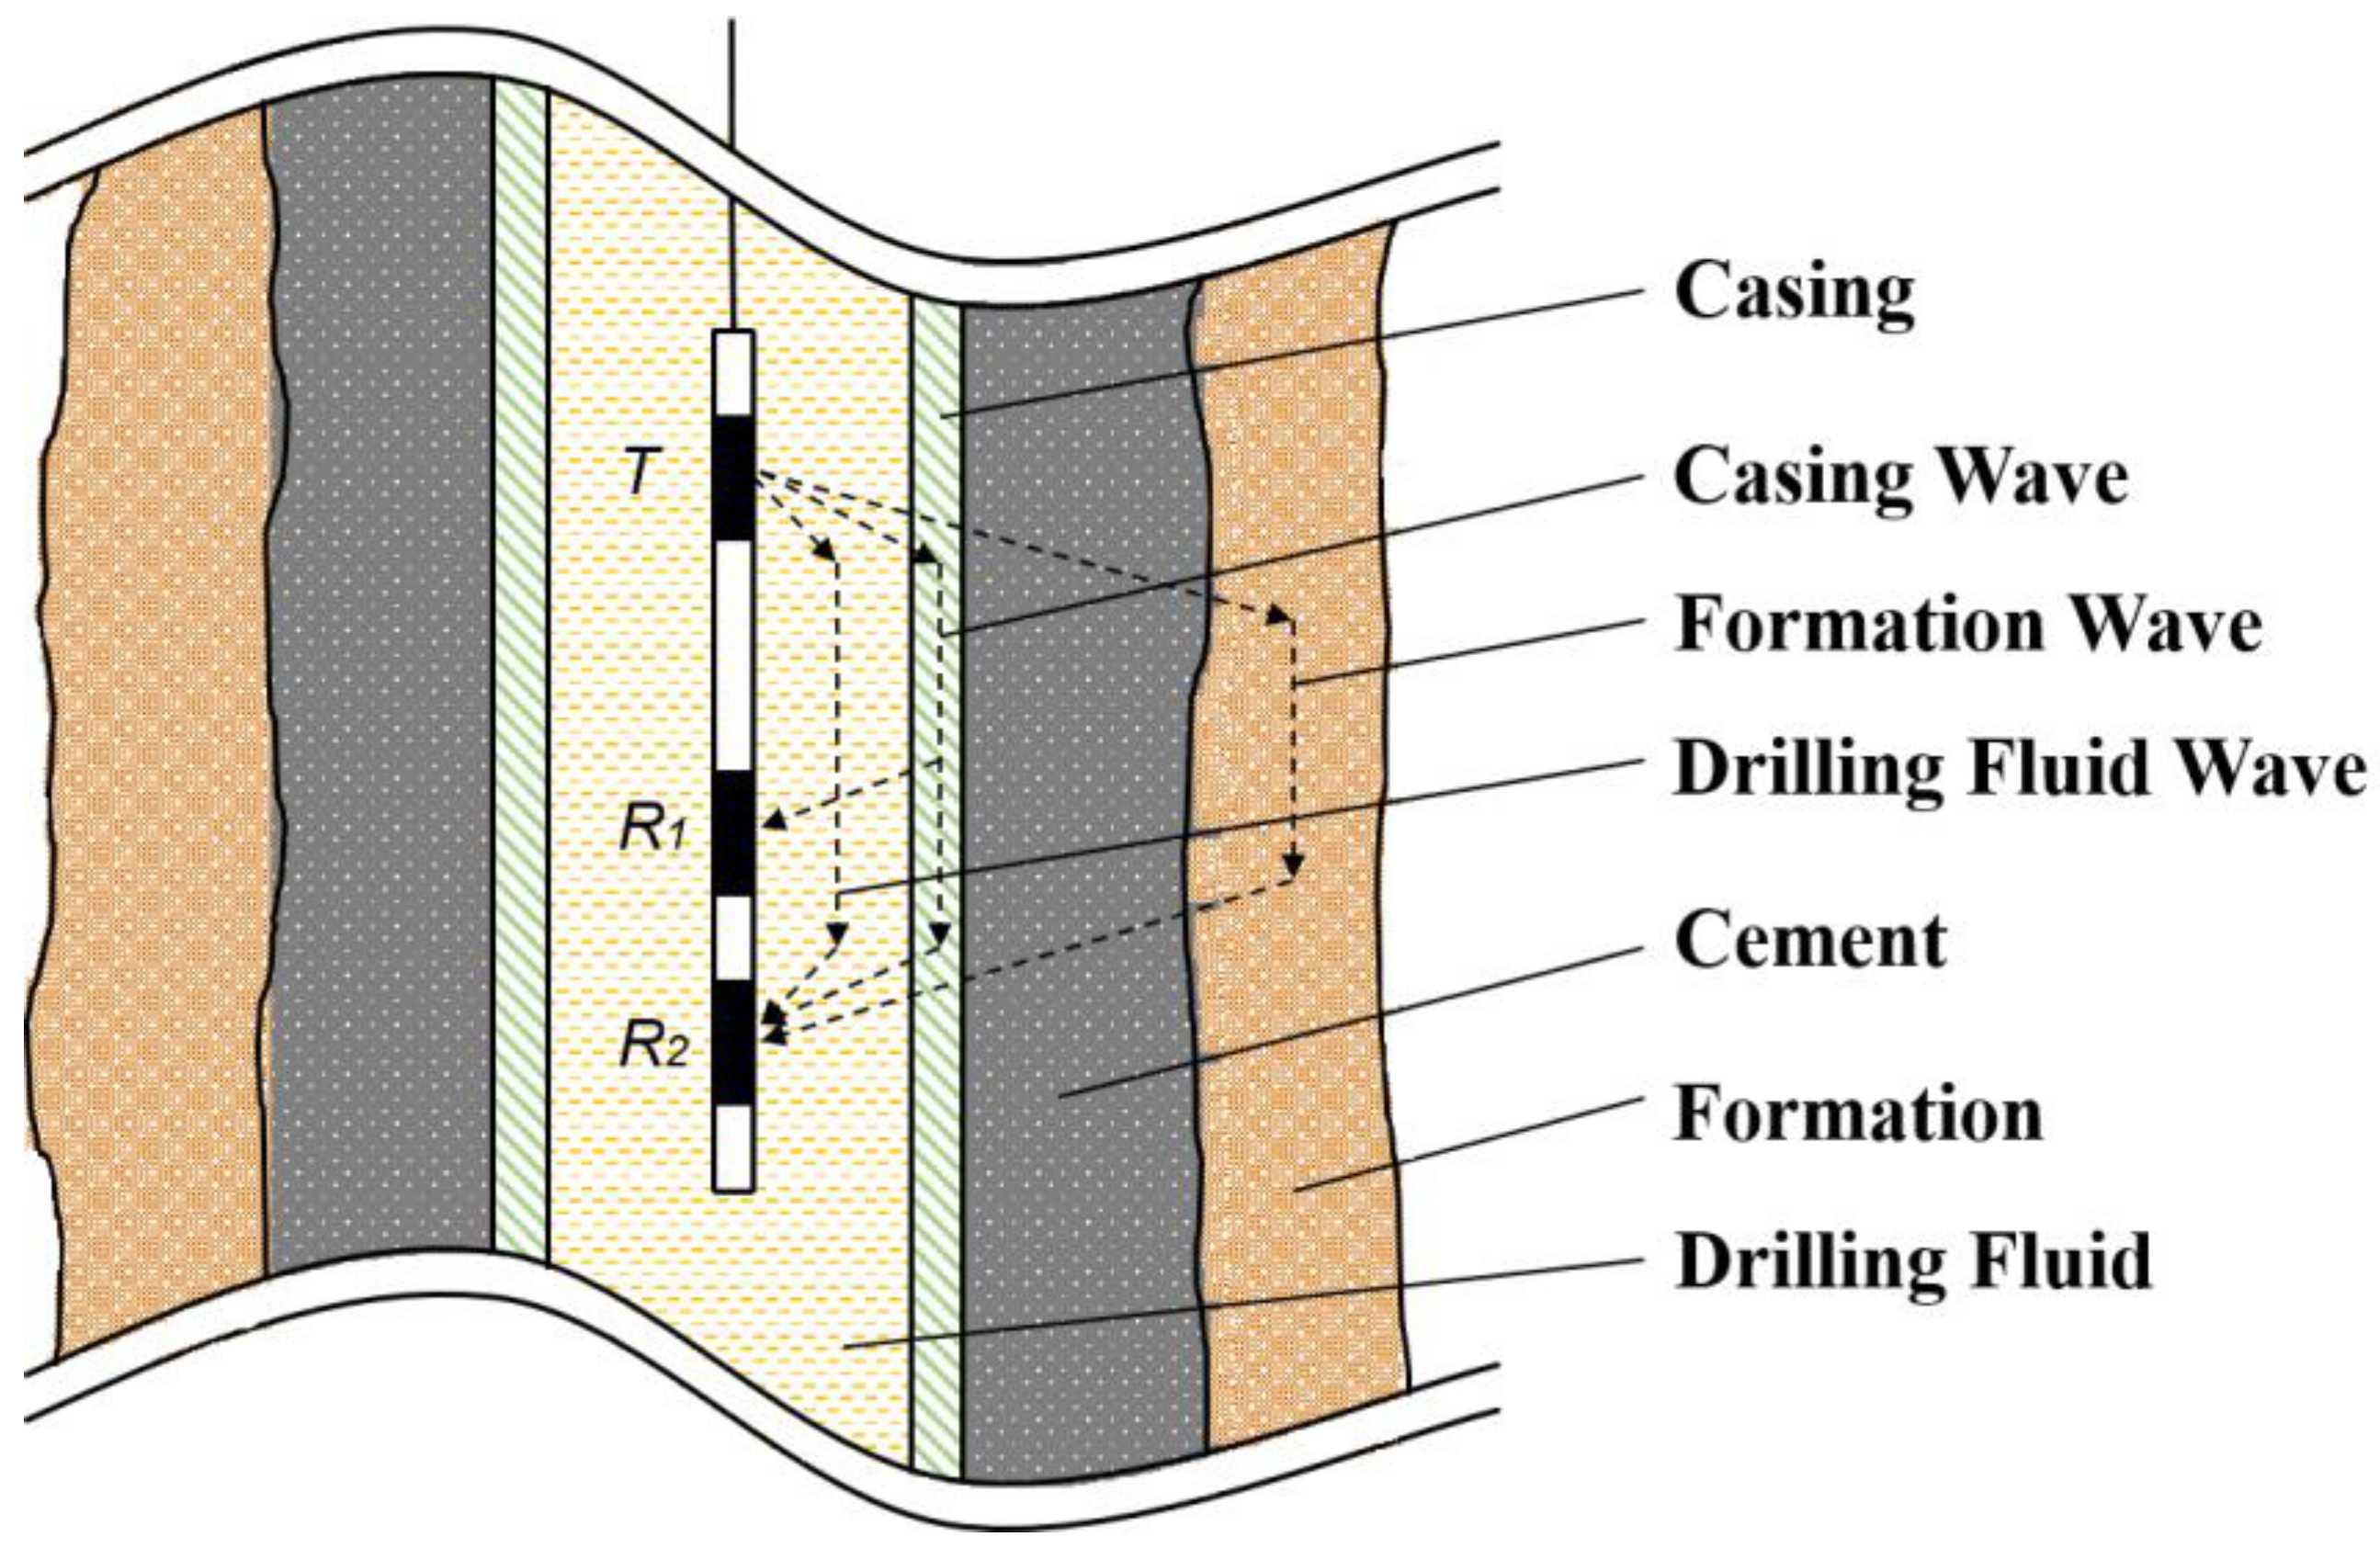
Figure 1. Schematic diagram of CBL-VDL.
Applsci 12 10997 g001
Figure 2. Waveform chart of full wave train of VDL.
Applsci 12 10997 g002
Figure 3. Waveform and CBL-VDL under the free casing.
Applsci 12 10997 g003
Figure 4. Waveform and CBL-VDL under good cementation of the first and second interface.
Applsci 12 10997 g004
Figure 5. Waveform and CBL-VDL of good cementation at the first interface and poor cementation at the second interface.
Applsci 12 10997 g005
Figure 6. Waveform and CBL-VDL of poor cementation at the first interface and good cementation at the second interface.
Applsci 12 10997 g006
Figure 7. Filter extracting image features.
Applsci 12 10997 g007
Figure 8. Image feature extraction with multiple parallel filters of different sizes.
Applsci 12 10997 g008
Figure 9. Convolution neural network structure.
Applsci 12 10997 g009
Figure 10. Recognition results of convolutional neural network.
Applsci 12 10997 g010
Figure 11. Comparison of accuracy of different models.
Applsci 12 10997 g011
Figure 12. Comparison of the complexity of different models.
Applsci 12 10997 g012
Figure 13. Adding white noise to the original image.
Applsci 12 10997 g013
Figure 14. Comparison of different models after adding noise.
Applsci 12 10997 g014
Table 1. Marking method of cementing quality training set.
CBL CharacteristicsVDL CharacteristicCementing Quality Results
MaximumObvious casing wave band and blank formation waveFree casing
MinimumThe casing wave is dark and the formation wave is obviousGood
LowBoth casing wave and formation wave are darkBetter
MediumObvious casing wave and dark formation waveFair
High, but not maximumThe casing wave band is obvious, the formation wave stripe is darkWeak
Table 2. Structural parameters of convolutional neural network.
LayersParametersActivation
Conv2D_1Filters: 128, Kernel size: 5 × 5, Strides (1, 1)ReLu
Conv2D_2Filters: 128, Kernel size: 3 × 3, Strides (1, 1)ReLu
Conv2D_3Filters: 128, Kernel size: 1 × 1, Strides (1, 1)ReLu
MaxPooling_1Pool size: 3 × 3, Strides (2, 2)None
Conv2D_4Filters: 64, Kernel size: 3 × 3, Strides (1, 1)ReLu
Conv2D_5Filters: 64, Kernel size: 3 × 3, Strides (1, 1)ReLu
MaxPooling_2Pool size: 2 × 2, Strides (2, 2)None
Conv2D_6Filters: 64, Kernel size: 3 × 3, Strides (1, 1)ReLu
Conv2D_7Filters: 64, Kernel size: 3 × 3, Strides (1, 1)ReLu
MaxPooling_3Pool size: 2 × 2, Strides (2, 2)None
Conv2D_8Filters: 128, Kernel size: 3 × 3, Strides (1, 1)ReLu
Conv2D_9Filters: 128, Kernel size: 3 × 3, Strides (1, 1)ReLu
MaxPooling_4Pool size: 2 × 2, Strides (2, 2)None
Conv2D_10Filters: 256, Kernel size: 3 × 3, Strides (1, 1)ReLu
Conv2D_11Filters: 256, Kernel size: 3 × 3, Strides (1, 1)ReLu
MaxPooling_5Pool size: 2 × 2, Strides (2, 2)None
Conv2D_12Filters: 512, Kernel size: 3 × 3, Strides (1, 1)ReLu
Conv2D_13Filters: 512, Kernel size: 3 × 3, Strides (1, 1)ReLu
Global average Pooling2D_1--
Dense_1Number of neurons: 1024, Dropout: 0.5ReLu
Dense_2Number of neurons: 512, Dropout: 0.5ReLu
Dense_3Number of neurons: 256, Dropout: 0.5ReLu
Dense_4Number of neurons: 5Softmax
Table 3. Performance comparison of different algorithms.
ModelAccuracyCross-EntropyTime Complexity (1,000,000)Space Complexity
(1,000,000)
Multi-scale perception model0.900.248184367
VGG-160.870.291323,49966
VGG-190.850.341228,38971
ResNet-340.840.368413,02625
AlexNet0.820.537711,821111
ResNet-180.810.5687989413
Publisher’s Note: MDPI stays neutral with regard to jurisdictional claims in published maps and institutional affiliations.