Featured Application
The presented techniques can be applied to access a splice depth and a total length of driven precast piles.
Abstract
The difficulties with the application of low strain integrity testing for evaluating the length of driven precast piles of two sections justify the need for new data acquisition and analysis techniques. The standard time domain analysis of the recorded signals may not allow for distinguishing the desired responses from a pile toe and a splice. In this paper, we propose the use of a set of hammers of different weights and tip materials that will provide various sensitivities of the test to a pile splice. To further analyze the collected data, we study the distributions of phase angles obtained using complex continuous wavelet transform. The characteristic phase shifts that distribute from higher to lower frequencies can be interpreted as responses from a pile toe and a splice. To verify the proposed approaches, a series of numerical simulations were performed using the finite element method for the driven pile models with the different properties of a splice zone. Numerical simulation results show that the pile splices are clearly identified when using the shorter input pulses which can be generated by light hammers with a hard head material. The total length of a simulated pile with a 1 mm air gap between sections was undetectable by standard data analysis approaches and was evaluated when analyzing the wavelet phase angle distributions. Numerically validated data acquisition and analysis techniques were applied to field data analysis and allowed us to confidently identify the length of two-section piles grouped with a pile cap.
1. Introduction
Due to the active development of large cities and intensive population growth, which are natural in the process of urbanization [1,2,3], the trend of building mega-cities in the interior has gradually exhausted itself, giving rise to the need for high-rise construction. This is due to the reduction in the number of free urban areas and the high cost of land, as well as the solution of urban planning problems related to increasing the life cycle, resource-saving, energy efficiency, the preservation of green areas of cities, and other issues [4,5,6,7].
Pile foundations are widely used to transfer the load from superstructures due to their reliability and high load-bearing capacity, making it possible to erect and then operate the building safely [8,9,10]. One of the most common pile foundation types is driven precast piles, which have proven themselves as a technological, less time-consuming, and cost-effective method of foundation works [8,11]. As the project pile lengths could be too long for transportation or driving, a driven pile can consist of a few (typically, two) individual sections that are joined together during the pile installation.
To evaluate the length and integrity of driven piles, a non-destructive low strain impact integrity test is implemented, which is based on the analysis of the propagation of elastic waves induced in a pile body by a hammer blow [12,13,14,15,16,17]. However, the ASTM D5882 standard states that the integrity evaluation of a pile section below a manufactured mechanical joint is not normally possible since the impact wave likely will reflect completely at the discontinuity [18]. The evaluation of the length of driven piles of two sections requires the development of new techniques to carry out the testing and analyze the recorded data.
One of the promising tools to enhance signal processing and interpretation is wavelet transform analysis, which studies a signal in both the time and frequency domains simultaneously [19,20,21,22,23,24,25]. Wavelet analysis for low strain integrity testing of piles was introduced by Addison and Watson [26,27]. The technique was further developed in the papers [28,29,30,31,32], in which the advantages of analyzing the phase of the complex continuous wavelet transform (CCWT) are shown using synthetic and experimental data. In [33], an improved algorithm for pile defect localization based on automatic extraction of abnormal values of wavelet coefficients followed by the analysis of wavelet spectrum phase sections was presented. In [34], a wavelet de-noising technique based on CCWT was applied to filter the low strain test data with a low signal-to-noise ratio.
The resolution of the low strain method for the defects of different sizes will depend on the frequency content of the input force pulses. It is advised to jointly analyze the signals generated with hammers of different weights and head materials [35].
To determine the length of each section and the total length of a driven precast pile, in this paper, we introduce the implementation of a CCWT technique to the low strain test data collected with a set of different hammers.
2. Materials and Methods
2.1. Driven Precast Piles
Driven precast piles are designed to be sunk into the soil by indentation or hammering to transfer the load from the building above to the surrounding soil mass [36]. A driven pile can consist of a single section or several sections joined together using pile splices. One of the most common and low-cost pile splice types [11] is the welded splice (Figure 1).
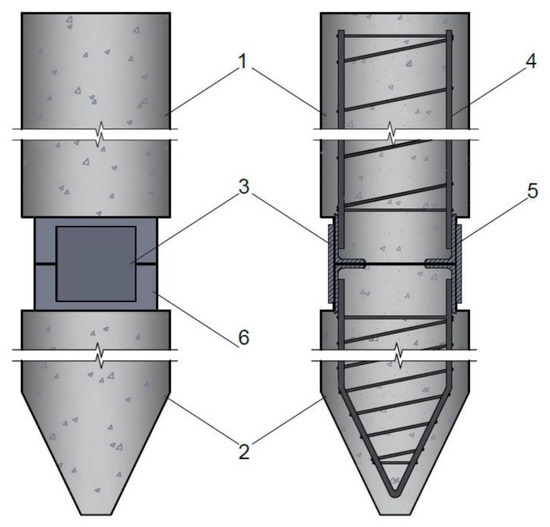
Figure 1.
Driven precast pile (plan view and section): 1—upper section, 2—bottom section, 3—steel plate, 4—reinforcement cage, 5—steel angles, 6—corrosion-resistant coating.
The pile making process involves five steps. The first step is to make the reinforcement cage, consisting of steel rods with diameters of 10 to 20 mm with a smooth or fluted surface. The second step is to weld steel corners in the area of the splice along the perimeter of the reinforcement cage. In the third step, the reinforcement cage is placed into a special metal mold, which is pre-treated with a lubricant to prevent the concrete from sticking to the walls. In the fourth step, the mold is filled with a concrete mixture and moved to the steam-curing chamber, where it is subjected to accelerated hardening.
Once the pile manufacturing is completed, it is subjected to an output inspection before being shipped to the construction site. Indicators such as concrete strength (concrete compressive strength, transfer, and handling strength), compliance of reinforcement and embedded items to detailed drawings, the strength of welded splice, the accuracy of geometric parameters, the thickness of the protective concrete layer to the reinforcement bars, the opening of processing cracks, the category of a concrete surface, etc., are checked [36].
The fifth pile fabrication stage is carried out directly at the construction site. First, the bottom section of the pile is sunk into the soil using impact or vibration hammers. Then, using steel plates, the bottom and upper sections of the pile are spliced together through embedded parts, namely through the steel angles welded to the reinforcement cage. Once the steel elements are welded, the splice is lubricated with corrosion-resistant coating, and the finished pile is sunk down to the design depth [11,36,37,38,39].
2.2. Low Strain Integrity Testing
Low strain impact integrity testing (also referred to as sonic, pulse-echo, PIT, or SIT) is a non-destructive test method that is widely used to determine the length and integrity of deep foundations. The method complies with ASTM D5882 [18] and other international codes.
The elastic waves are produced by a hammer blow applied to the pile head surface and registered by an accelerometer attached to the pile head. The excited waves travel downwards along the pile body and reflect upward from the pile toe or non-uniformities such as cross-section changes, variations in elastic modulus, or density of the pile material.
The recorded signals can be analyzed in both the time and frequency domains [15,40,41]. Data processing operations usually include integration, normalization, amplification, filtering, and averaging. Signals are converted from units of time (t) to units of length (L) according to the equation:
where V is the wave speed, assumed to be a constant value (typically 3600–4400 m/s for concrete piles).
To verify the integrity of the pile and determine its length, the processed signals are analyzed along with site records, soil profile, and other relevant information. Signal features associated with reflections from a pile toe or structural defects are identified. A clearly pronounced reflection from a pile toe and a sufficiently stable signal are signs of a defect-free pile.
When inspecting driven precast piles, special attention is to be paid to the splices between the sections. A splice can produce multiple reflection pulses, making it difficult to estimate the total length of a pile. As the resolution of the low strain method will vary depending on the frequency content of the input force pulses, it seems promising to use a set of hammers of different weights and head materials to access both the splice depth and the total length of a driven pile.
2.3. Numerical Simulation of Low Strain Testing of Driven Precast Piles with Input Pulses of Different Durations
To study the resolution of low strain integrity testing, particularly its ability to localize the splice and determine the total length of driven precast piles, full-wave numerical simulations were performed for four series of models. Each series consisted of 4 calculations with different durations of the input force pulse ranging from 0.5 to 2.0 ms.
The numerical simulations were performed in the axisymmetric formulation using the finite element method and specialized software [14,42], created in the COMSOL Multiphysics 5.3 package (Comsol Inc., Stockholm, Sweden). The calculations were carried out using a high-performance workstation based on two Intel Xeon processors (a total of 24 cores) and 512 GB RAM. To solve the system of equations, a direct solver MUMPS was used.
The layouts of four synthetic pile models with three splice options are presented in Figure 2. Model 1 represents a single-section driven pile 14 m in length, and Models 2–4 represent piles of two jointed sections 8 and 6 m in length. Different types and conditions of pile splices were simulated with a 5 mm sand gap (Model 2), a 1 mm sand gap (Model 3), and a 1 mm air gap (Model 4) between the pile sections.
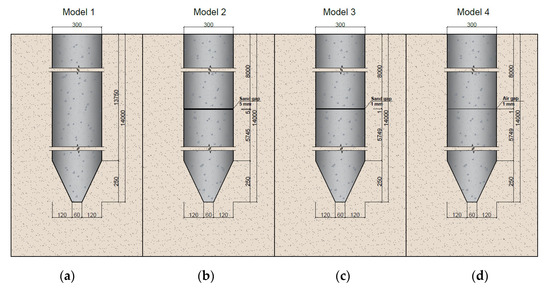
Figure 2.
The layouts of synthetic driven pile models with different splice types: (a) single-section pile (without a splice)—Model 1; (b) 5 mm sand gap—Model 2; (c) 1 mm sand gap—Model 3; (d) 1 mm air gap—Model 4.
The surrounding medium for the piles was modeled as dry sand. To avoid wave reflections from the external boundaries of the models, low-reflecting boundary conditions were imposed on the side and bottom boundaries of the surrounding soil.
The physical properties of the materials specified in numerical models—density, pressure, shear wave speeds, and damping coefficients α and β of the Rayleigh attenuation model [43,44,45,46]—are given in Table 1.

Table 1.
The properties of simulated materials.
The modeling time duration was set to 10 ms. The time discretization was related to the spatial mesh size, and the time step was set to 1 μs following the convergence condition by Courant–Friedrichs–Lewy. The size of the finite elements was chosen considering the typical dimensions of the model geometry and the wavelength in the material so as to ensure that the calculation error does not exceed 0.5%.
To generate the elastic waves, an external vertical force in the form of a Gaussian pulse modulated by a Hanning window was applied at the center of the pile top to an impact area 30 mm in diameter:
where A is the maximum force value, is the time, and T is the pulse duration. The acoustic waves were registered with a 25 mm synthetic acceleration sensor offset from the pile axis by 75 mm.
The duration of the input force pulses was set to be 0.5, 0.8, 1.2, and 2.0 ms to simulate the typical impacts of hammers of different weights and head materials. Shorter pulses correspond to hitting by a lightweight hammer with a metal tip, while long-duration input pulses correspond to heavy hammers with a rubber tip.
Figure 3 shows the results of numerical simulations obtained for each synthetic model layout and each input force pulse. The simulations demonstrate that the length of the single-section pile (Model 1) can be determined with any duration of input pulse force applied (Figure 3a).
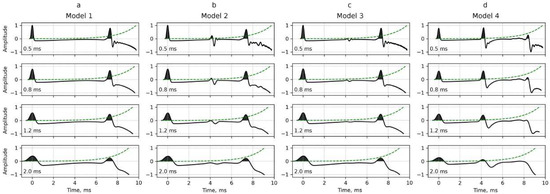
Figure 3.
Results of numerical simulations of low strain integrity testing with input pulse forces of 0.5, 0.8, 1.2, and 2.0 ms calculated for the driven pile models: (a) single-section pile—Model 1; (b) 5 mm sand gap—Model 2; (c) 1 mm sand gap—Model 3; (d) 1 mm air gap—Model 4.
The simulations for a 5 mm sand gap splice model (Model 2) show a clear response of a pile toe at 7 ms (Figure 3b). Using different input pulse forces, we can observe reflections from a pile splice at 4 ms on almost every signal. While the splice response is clearly detected for short input pulses, it becomes barely visible for the duration of the input pulse of 2 ms.
The simulations for a 1 mm sand gap splice model (Model 3) show that both low-frequency (long-duration) and high-frequency (short-duration) signal excitations allow us to determine the total length of the pile, as evidenced by the reflection pulse registered at 7 ms (Figure 3c). Regarding the detection of the splice, with short-duration input pulses, a weak reflection can be observed at 4 ms. With long-duration input pulses of 1.2 ms and 2 ms, no reflection from the pile splice can be distinguished. The time domain analysis of these signals can lead to false conclusions that the pile consists of a single section.
The simulation results for a 1 mm air gap splice (Model 4, Figure 3d) show a clear splice reflection at 4 ms. Moreover, a second reflection from the splice can be observed at 8 ms. Consequently, we can conclude that the air gap splice represents a significant obstacle to the acoustic waves, and the total length of a pile could not be assessed.
2.4. Complex Continuous Wavelet Transform
To increase the reliability of low strain integrity testing, in [29,30,31,32,33,34], it was proposed to use the complex continuous wavelet transform to perform a time–frequency analysis of the recorded signals. CCWT converts the studied signal ∈ L2(R) into a function of two variables a, b ∈ R, a > 0:
where ψ(t) is the complex mother wavelet, * represents the complex conjugation operation, a is the scale parameter of the mother wavelet, and b is the time shift that determines the location of the wavelet.
To apply the wavelet transform successfully, it is important to select the best-suited mother wavelet. In [36], we have shown that an optimal mother wavelet for low strain test data CCWT analysis is a complex Morlet wavelet:
where B is the bandwidth and C is the center frequency. By varying the bandwidth and center frequency parameters, we can adjust the mother wavelet for the test data obtained with the initial force pulses of different frequency content.
The CCWT results can be presented as an image in a time–frequency plane, where the energy distribution of the wavelet transform coefficients is shown in gradations of the color scale. The more precisely the local feature of a signal coincides with the wavelet function obtained by scaling and shifting, the more effectively it will stand out in the CCWT energy plot.
To relate scale parameter a to frequency , we use the following relationship:
where is the center frequency of the wavelet.
The instantaneous phase angle of can be calculated as:
where and represent the imaginary part and the real part of , respectively. The phase angles of the wavelet coefficients can be presented as an image in a time–frequency plane (phase spectrum), where the blue color indicates −180 degrees (−π) of a phase angle and the red color denotes 180 degrees (π).
To obtain the location of the pile toe or defects, Ni et al. (2019) [27] suggested finding the area of concentrated energy of the wavelet transform coefficients, then finding the phase shift from π to -π (or where the phase angle equals 0), which distributes in the form of a straight line from a higher frequency to a lower frequency in the phase spectrum near the corresponding concentrated energy area. If the reflected concentrated energy is not obvious, the phase shift line will be closer to a straight line from a higher frequency to a lower frequency.
By analyzing the phase shift moments, it is possible to assess the pile integrity and precisely localize the defect or determine the pile length. In this paper, we propose to use the CCWT phase analysis to determine the lengths of the driven precast piles, as well as to localize their splices.
3. Results
3.1. Application of Complex Continuous Wavelet Transform for the Numerical Simulation Results
Here, we apply the CCWT analysis to the results of numerical simulations presented in Section 2.3 (Figure 3). As a mother wavelet, we use a complex Morlet wavelet with the bandwidth parameter B of 0.2 and the center frequency C of 1.2 (Equation (4)).
Figure 4 shows the application of CCWT for a single-section pile (Model 1). The CCWT energy concentration points and the phase shift locations for each duration of the input force pulse are clearly visible at 0 (Line 1) and 7.5 ms (Line 2), which correspond to the responses of the initial hammer impact and the pile toe, respectively.
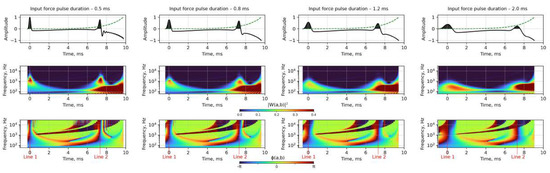
Figure 4.
CCWT analysis of the low strain test numerical simulation results for a single-section pile (Model 1) with input force pulses of 0.5, 0.8, 1.2, and 2 ms duration. 1st row—the simulated signals, 2nd row—the distribution of energy of the wavelet transform coefficients, 3rd row—the distribution of phase angles of the wavelet coefficients. Lines 1 and 2 delineate the phase shift moments.
Next, we consider the application of the CCWT on numerical models of driven piles of two sections with different splice types. While analyzing the data in the time domain, the response of a 5 mm sand gap splice (Model 2) was barely visible when using long-duration signal excitations. The CCWT results (Figure 5) obtained for these signals with the input force pulses of 0.5 and 0.8 ms show bright energy concentration points at 0.0, 4.2, and 7.5 ms. For longer input pulses of 1.2 and 2.0 ms, there are no energy concentration points in the splice area (in the vicinity of 4 ms). However, when analyzing the phase spectrum, we observe clear phase changes at 0.0 (Line 1), 4.2 (Line 2), and 7.5 ms (Line 3) for each duration of input force pulse. These phase changes outline the response from the initial hammer impact, 5 mm sand gap splice, and the pile toe, respectively.
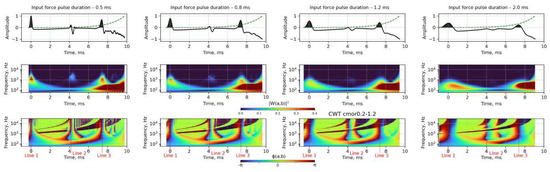
Figure 5.
CCWT analysis of the low strain test numerical simulation results for a pile with a splice of 5 mm sand gap (Model 2) with input force pulses of 0.5, 0.8, 1.2, and 2 ms duration. 1st row—the simulated signals, 2nd row—the distributions of energy of the wavelet transform coefficients, 3rd row—the distributions of phase angles of the wavelet coefficients. Lines 1, 2, and 3 delineate the phase shift moments.
The CCWT analysis of the numerical simulation results for a pile with a 1 mm sand gap splice (Model 3) is shown in Figure 6. While the splice responses are poorly distinguishable when analyzing the time domain representations of signals and the distributions of CCWT energy, they clearly stand out as phase changes at 4 ms (Line 2) for the durations of input force pulses of 0.5, 0.8, and 1.2 ms.
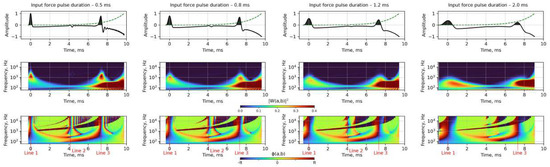
Figure 6.
CCWT analysis of the low strain test numerical simulation results for a pile with a splice of 1 mm sand gap (Model 3) with input force pulses of 0.5, 0.8, 1.2, and 2 ms duration. 1st row—the simulated signals, 2nd row—the distributions of energy of the wavelet transform coefficients, 3rd row—the distributions of phase angles of the wavelet coefficients. Lines 1, 2, and 3 delineate the phase shift moments.
The time domain analysis of the simulation results for a pile with a 1 mm air gap splice (Model 4) delineates pronounced responses at 4 and 8 ms, related to first and second reflections from the splice, respectively (Figure 7). No pulse that can be interpreted as a reflection from the pile toe is distinguished neither for the time domain representations of the signals nor for the distributions of the wavelet energy. While there are several distinctive changes in the phase spectrum for different signals with various input force pulses, the only characteristic phase shift that manifests itself upon all input pulses is the one at 7.5 ms (Line 3). This phase change corresponds to a total pile length of 14 m.
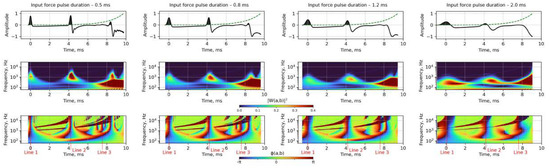
Figure 7.
CCWT analysis of the low strain test numerical simulation results for a pile with a splice of 1 mm air gap (Model 4) with input force pulses of 0.5, 0.8, 1.2, and 2 ms duration. 1st row—the simulated signals, 2nd row—the distributions of energy of the wavelet transform coefficients, 3rd row—the distributions of phase angles of the wavelet coefficients. Lines 1, 2, and 3 delineate the phase shift moments.
3.2. Application of Complex Continuous Wavelet Transform for the Field Low Strain Integrity Testing
The proposed method to carry out the low strain integrity testing (the application of a set of hammers that produce pulses of various frequency content) and analyze the recorded signals (the joint analysis of the energy and phase images of CCWT) was applied for the field data collected at a construction site in Moscow.
The existing building was demolished, and the question arose about the possibility of using the exposed driven pile foundation for future construction. In the absence of executive documentation, it was necessary to determine the length and integrity of the piles.
The low strain integrity test was carried out from the top of the pile cap 1 m high. To generate the acoustic waves, a set of three hammers was used: hammer 1 of 100 g with a metal tip, hammer 2 of 200 g with a metal tip, and hammer 3 of 500 g with a rubber tip (a rubber mallet).
The low strain test signals obtained for one of the tested piles are presented in Figure 8, first row. The recorded data are complicated by a large number of features that do not allow us to safely outline the responses from the pile toe and possible existing splices when analyzing the data in the time domain.
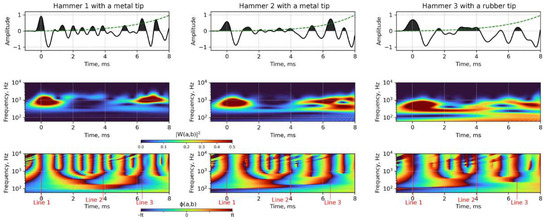
Figure 8.
CCWT analysis of the field low strain tests of a driven precast pile of the unknown depth. The data was collected with a set of 3 hammers of different weights and tip materials. 1st row—the recorded signals, 2nd row—the distributions of energy of the wavelet transform coefficients, 3rd row—the distributions of phase angles of the wavelet coefficients. Lines 1, 2, and 3 delineate the phase shift moments.
To increase the data decoding reliability, the CCWT with a complex Morlet wavelet was applied to process the obtained field data (Figure 8, second and third rows). The distributions of energy of the wavelet transform coefficients show a complex pattern of anomalies. When analyzing the phase distributions, for each registered signal, one can note the characteristic phase shifts that distribute from higher to lower frequencies at 4 ms (Line 2) and ~6.5 ms (Line 3). These phase changes are interpreted as responses from a pile splice at a depth of 8 m and a pile toe at a depth of 13 m, respectively (with the wave speed assumed to be equal to 4000 m/s). Considering the 1 m height of the pile beam, we can conclude that the length of a top pile section is 7 m, and the total pile length is 12 m.
4. Conclusions
The current techniques for collecting and analyzing the low strain integrity test data do not allow for safely evaluating the length of driven precast piles of two sections. In this paper, we propose the use of hammers of different weights and tip materials for the data acquisition and the subsequent analysis of the recorded data using a complex continuous wavelet transform.
To illustrate the proposed approach, we performed a series of numerical simulations using the finite element method for the four driven pile models of 14 m with the different properties of the splice area. The simulations show that the short-duration input force pulses (that correspond to a wave generation by lightweight hammers with a hard tip) are more sensitive to the splice area than the long-duration ones. However, the use of lightweight hammers in real-life testing can lead to a low signal-to-noise ratio of the recorded data.
The numerical simulation results for the splice area of 1 mm air gap did not allow us to access the total length of a driven pile when using standard time domain analysis of the simulated signals. To further increase the reliability of the data interpretation, we analyzed the modeled signals using CCWT with a complex Morlet wavelet.
The main advantage of using a complex mother function for the wavelet analysis is the ability to study the phase spectrums, where even very low-amplitude reflected waves become distinguishable. While the registered data can have multiple phase shifts associated with the desired responses or noise, a joint analysis of the signals collected with a set of different hammers can help in localizing the required phase changes. The analysis of the CCWT phase distributions for a series of signals of different input force pulses allowed us to localize the splice and access the total length of all modeled piles.
The proposed techniques piloted on numerical simulation data were applied for the field low strain test of driven precast piles of unknown lengths. The wavelet phase analysis assessed the depth of the splices and the total pile lengths, allowing the design organization to decide on the future use of the pile foundation.
Author Contributions
Conceptualization, I.L. and E.L.; methodology, I.L. and E.L.; software, R.Z. (numerical simulations) and I.L. (wavelet analysis); validation, V.S.; investigation, E.L. and I.L.; data curation, I.L.; writing—original draft preparation, E.L.; writing—review and editing, I.L.; visualization, I.L.; supervision, V.S.; project administration, E.L. All authors have read and agreed to the published version of the manuscript.
Funding
This research received no external funding.
Institutional Review Board Statement
Not applicable.
Informed Consent Statement
Not applicable.
Acknowledgments
The authors would like to thank Aleksei Churkin (Laboratory of Pile Foundations in NIIOSP JSS SIC «Construction») for the provided field data.
Conflicts of Interest
The authors declare no conflict of interest.
References
- Shabalov, M.Y.; Zhukovskiy, Y.L.; Buldysko, A.D.; Gil, B.; Starshaia, V.V. The influence of technological changes in energy efficiency on the infrastructure deterioration in the energy sector. Energy Rep. 2021, 7, 2664–2680. [Google Scholar] [CrossRef]
- Litvinenko, V.S. Digital Economy as a Factor in the Technological Development of the Mineral Sector. Nat. Resour. Res. 2020, 29, 1521–1541. [Google Scholar] [CrossRef]
- Filatova, I.; Nikolaichuk, L.; Zakaev, D.; Ilin, I. Public-Private Partnership as a Tool of Sustainable Development in the Oil-Refining Sector: Russian Case. Sustainability 2021, 13, 5153. [Google Scholar] [CrossRef]
- Mardashov, D.; Duryagin, V.; Islamov, S. Technology for improving the efficiency of fractured reservoir development using gel-forming compositions. Energies 2021, 14, 8254. [Google Scholar] [CrossRef]
- Kadochnikov, V.G.; Dvoynikov, M.V. Development of Technology for Hydromechanical Breakdown of Mud Plugs and Improvement of Well Cleaning by Controlled Buckling of the Drill String. Appl. Sci. 2022, 12, 6460. [Google Scholar] [CrossRef]
- Dvoynikov, M.; Sidorov, D.; Kambulov, E.; Rose, F.; Ahiyarov, R. Salt Deposits and Brine Blowout: Development of a Cross-Linking Composition for Blocking Formations and Methodology for Its Testing. Energies 2022, 15, 7415. [Google Scholar] [CrossRef]
- Dvoynikov, M.; Buslaev, G.; Kunshin, A.; Sidorov, D.; Kraslawski, A.; Budovskaya, M. New Concepts of Hydrogen Production and Storage in Arctic Region. Resources 2021, 10, 3. [Google Scholar] [CrossRef]
- Fleming, K.; Weltman, A.; Randolph, M.; Elson, K. Piling Engineering, 3rd ed.; Taylor & Francis: London, UK, 2008; pp. 253–283. [Google Scholar] [CrossRef]
- Mangushev, R.A.; Ershov, A.V.; Osokin, A.I. Modern Pile Technologies; ASV: Saint Petersburg, Russia, 2007; pp. 1–160. [Google Scholar]
- Verstov, V.V.; Gaido, A.N. Pile Foundation Technology; SPbGASU: Saint Petersburg, Russia, 2010; pp. 1–180. [Google Scholar]
- Churkin, A.A.; Ulybin, A.V.; Kapustin, V.V. Application of low strain impact testing to spliced driven piles quality control. Constr. Unique Build. Struct. 2021, 96, 1–14. [Google Scholar] [CrossRef]
- Amir, J.M. Pile integrity testing: History, present situation, and future agenda. In Proceeding of 3rd Bolivian International Conference on Deep Foundations, Santa Cruz de la Sierra, Bolivia, 29 April 2017. [Google Scholar]
- Churkin, A.A.; Kapustin, V.V.; Lozovsky, I.N.; Zhostkov, R.A. Research of the influence of the parameters of the ‘‘pile-soil’’ system on the dynamic attributes of the acoustic signal using numerical simulation. Bull. Tomsk. Polytech. Univ. Geo. Assets Eng. 2020, 332, 129–140. [Google Scholar] [CrossRef]
- Likins, G.; Rausche, F. Recent advances and proper use of PDI low strain pile integrity testing. In Proceedings of the 6th International Conference on the Application of Stress-Wave Theory to Piles, Sao Paulo, Brazil, 13 September 2000. [Google Scholar]
- Zheng, C.; Kouretzis, G.P.; Ding, X.; Liu, H.; Poulos, H.G. Threedimensional effects in low-strain integrity testing of piles: Analytical solution. Can. Geotech. J. 2015, 53, 225–235. [Google Scholar] [CrossRef]
- Potapov, A.I.; Kondratev, A.V. Non-destructive testing of multilayer medium by the method of velocity of elastic waves hodograph. J. Min. Inst. 2020, 243, 348. [Google Scholar] [CrossRef]
- Syas’ko, V.; Shikhov, A. Assessing the State of Structural Foundations in Permafrost Regions by Means of Acoustic Testing. Appl. Sci. 2022, 12, 2364. [Google Scholar] [CrossRef]
- ASTM D5882–16; Standard Test Method for Low Strain Impact Integrity Testing of Deep Foundations. ASTM International: West Conshohocken, PA, USA, 2016. [CrossRef]
- Grossmann, A.; Morlet, J. Decomposition of Hardy Functions into Square Integrable Wavelets of Constant Shape. SIAM J. Math. Anal. 1984, 15, 723–736. [Google Scholar] [CrossRef]
- Lee, G.R.; Gommers, R.; Wasilewski, F.; Wohlfahrt, K.; O’Leary, A. PyWavelets: A Python package for wavelet analysis. J. Open Source Softw. 2019, 4, 1237. [Google Scholar] [CrossRef]
- Byrnes, J.S.; Byrnes, J.L.; Hargreaves, K.A.; Berry, K. Wavelets and Their Applications; Jones and Barlett: Boston, MA, USA, 1992; pp. 1–434. [Google Scholar]
- Rhif, M.; Ben Abbes, A.; Farah, I.; Martínez, B.; Sang, Y. Wavelet Transform Application for/in Non-Stationary Time-Series Analysis: A Review. Appl. Sci. 2019, 9, 1345. [Google Scholar] [CrossRef]
- Nagornov, O.V.; Nikitaev, V.G.; Prostokishin, V.M. Wavelet Analysis in Examples; NRNU MEPhI: Moscow, Russia, 2010; pp. 1–120. [Google Scholar]
- Koronovsky, A.A.; Khramov, A.E. Continuous Wavelet Analysis and Its Applications; FIZMATLIT: Moscow, Russia, 2003; pp. 1–176. [Google Scholar]
- Yarmolenko, A.S.; Skobenko, O.V. Application of the theory of wavelets for compression and filtration of geoinformation. J. Min. Inst. 2018, 234, 612. [Google Scholar] [CrossRef]
- Addison, P.S.; Watson, J.N. Wavelet analysis for low strain integrity testing of foundation piles. In Proceedings of the 5th International Conference on Inspection, Appraisal, Repairs, Maintenance of Buildings and Structures, Singapore, 15−16 May 1997; pp. 15–16. [Google Scholar]
- Watson, J.N.; Addison, P.S.; Sibbald, A. The de-noising of sonic echo test data through wavelet transform reconstruction. Shock. Vib. 1999, 6, 175750. [Google Scholar] [CrossRef]
- Ni, S.H.; Isenhower, W.M.; Huang, Y.H. Continuous wavelet transform technique for low-strain integrity testing of deep drilled shafts. J. GeoEngineering 2012, 7, 97–105. [Google Scholar] [CrossRef]
- Ni, S.H.; Yang, Y.Z.; Tsai, P.H.; Chou, W.H. Evaluation of pile defects using complex continuous wavelet transform analysis. NDT E Int. 2017, 87, 50–59. [Google Scholar] [CrossRef]
- Ni, S.H.; Yang, Y.Z.; Lyu, C.R. Application of wavelet analysis for the impulse response of pile. Smart Struct. Syst. 2017, 19, 513–521. [Google Scholar] [CrossRef]
- Ni, S.H.; Li, J.L.; Yang, Y.Z.; Lai, Y.Y. Applicability of complex wavelet transform to evaluate the integrity of commonly used pile types. J. GeoEngineering 2019, 14, 21–30. [Google Scholar] [CrossRef]
- Zheng, W.; Zheng, W.; Wang, S.; Lin, C.; Yu, X.; Liu, J. Damage localization of piles based on complex continuous wavelet transform: Numerical example and experimental verification. Shock. Vib. 2020, 2020, 058640. [Google Scholar] [CrossRef]
- Liu, J.L.; Lin, C.X.; Ye, X.J.; Zheng, W.T.; Luo, Y.P. An improved algorithm for pile damage localization based on complex continuous wavelet transform. Smart Struct. Syst. 2021, 27, 493–506. [Google Scholar] [CrossRef]
- Lozovsky, I.N.; Loseva, E.S.; Syasko, V.A. Wavelet denoising for low strain pile integrity testing. Test. Diagn. 2022, 25, 36–45. [Google Scholar]
- Churkin, A.A.; Loseva, E.S.; Lozovsky, I.N.; Syasko, V.A. Increasing the reliability of the low strain integrity testing of piles under existing structures. Test. Diagn. 2022, 25, 24–32. [Google Scholar]
- GOST 19804-2012; Prefabricated Reinforced Concrete Piles. Specifications. Interstate Scientific and Technical Commission for Standardization, Technical Regulation and Conformity Assessment in Construction: Moscow, Russia, 2012.
- Series 1.011.1-10; Reinforced Concrete Driven Piles. Issue 8. Fundamentproekt Institute: Moscow, Russia, 2021.
- GOST 8510-86; Hot-Rolled Steel Unequal-Leg Angels. Dimensions. Interstate Council for Standardization, Metrology and Certification: Moscow, Russia, 2012.
- GOST 14098-2014; Welded Joints of Reinforcement and Inserts for Reinforced Concrete Structures. Types, Constructions and Dimensions. Interstate Council for Standardization, Metrology and Certification: Moscow, Russia, 2015.
- Cui, D.M.; Yan, W.; Wang, X.Q.; Lu, L.M. Towards intelligent interpretation of low strain pile integrity testing results using machine learning techniques. Sensors 2017, 7, 2443. [Google Scholar] [CrossRef]
- Kim, H.J.; Mission, J.L.; Dinoy, P.R.; Kim, H.S.; Park, T.W. Guidelines for impact echo test signal interpretation based on wavelet packet transform for the detection of pile defects. Appl. Sci. 2020, 10, 2633. [Google Scholar] [CrossRef]
- Zhostkov, R.A. A Software for Simulation of Low Integrity Testing for Cast-in-Place Piles. Patent RF. 2019.665449.
- Clough, R.W.; Penzien, J.; Griffin, D.S. Dynamics of Structures; McGraw-Hill: New York, NY, USA, 1975. [Google Scholar]
- Stojić, D.; Nestorović, T.; Marković, N.; Marjanović, M. Experimental and numerical research on damage localization in plate-like concrete structures using hybrid approach. Struct. Control. Health Monit. 2018, 25, e2214. [Google Scholar] [CrossRef]
- Lozovsky, I.N.; Zhostkov, R.A.; Churkin, A.A. Numerical simulation of ultrasonic pile integrity testing. Russ. J. Nondestruct. Test. 2020, 56, 1–11. [Google Scholar] [CrossRef]
- Vasilyeva, N.V.; Boikov, A.V.; Erokhina, O.O.; Trifonov, A.Y. Automated digitization of radial charts. J. Min. Inst. 2021, 247, 82–87. [Google Scholar] [CrossRef]


Publisher’s Note: MDPI stays neutral with regard to jurisdictional claims in published maps and institutional affiliations. |
© 2022 by the authors. Licensee MDPI, Basel, Switzerland. This article is an open access article distributed under the terms and conditions of the Creative Commons Attribution (CC BY) license (https://creativecommons.org/licenses/by/4.0/).