Abstract
The combination of signal processing and Artificial Intelligence (AI) is revolutionizing the robotics and automation industry by the deployment of intelligent systems and reducing human intervention. Reading human brain signal through electroencephalography (EEG) has provided a new direction of research that automate machines through the human brain and computer interface or Brain–Computer Interface (BCI). The study is also inspired by the same concept of intelligently controlling a robotic arm using BCI and AI to help physically disabled individuals. The proposed system is non-invasive, unlike existing technologies that provide a reliable comparison of different AI-based classification algorithms. This paper also predicts a reliable bandwidth for the BCI process and provides exact placements of EEG electrodes to verify different arm moments. We have applied different classification algorithms, i.e., Random Forest, KNN, Gradient Boosting, Logistic Regression, SVM, and Decision Tree, to four different users. The accuracy of all prescribed classifiers has been calculated by considering the first user as a reference. The presented results validate the novel deployment, and the comparison shows that the accuracy for Random Forest remained optimal at around 76%, Gradient Boosting is around 74%, while the lowest is 64% for Decision Tree. It has been observed that people have different activation bandwidths while the dominant frequency varies from person-to-person that causes fluctuations in the EEG dataset.
1. Introduction and Related Studies
The brain–computer interface (BCI) allows the brain and various machines to communicate with one another through recording electrical activity and their connections with external devices. Vidal used the term “brain–computer interface” for the first time in [1]. Later the first implanted devices were implanted in humans following years of animal testing in the late 1990s [2]. An ever-increasing number of studies and clinical studies have been conducted on the brain–computer interface as one of the best methods for assisting individuals with motor paralysis caused by strokes, spinal cord injuries, cerebral palsy, and amyotrophic lateral sclerosis [3].
BCI can replace useful functions for disabled people suffering from neuromuscular disorders. A BCI is a computer-based device that captures an EEG and converts them into commands that are sent to an output device to perform the desired action [4]. In contrast to all other devices, it is completely non-invasive [5], cost-effective, and unique in that it can be utilized to address a wide array of needs, including those associated with prosthetics. In order to make the signal useful, its desired information is converted into active functions. It is the active function that operates the microcontroller [6,7]. Based on the required input, the microcontroller determines the degree of freedom of the actuators, and the robotic arm acts as per the received signal. Moreover, the electric impulses transmit between neurons in the brain during sleep which is measured by EEG. The recorded EEG signals are obtained through a single electrode that uses a Local field potential (LFP) to measure EEG signals [7]. LFPs are temporary electrical signals generated by individual neurons in the brain and other tissues when their electrical activity is summed and synchronized [7]. The placement of electrodes is critical to this design. Typically, electrodes consisting of conductors such as gold or silver chloride are utilized. A headset is used to translate EEG data into movement patterns that measure brain activity via the scalp of the head. AF3, F7, F3, FC5, P7, O1, O2, P8, T8, FC6, F4, F8, and AF4 electrodes are calibrated on this 14-channel hardware. Odd-numbered electrodes are located on the left hemisphere, while even-numbered electrodes are located on the right [8]. Therefore, the maximum number of degrees of freedom (DOF) is identified [9]. To implement the code, we have used a jupyter notebook. It is an Integrated Development Environment (IDE) for Python. The classification is performed using machine learning and artificial intelligence techniques. Machine learning aims to understand the structure of data and make models based on that data that are human-comprehensible and useful. Figure 1 illustrates an overview of the proposed system that shows an extremely versatile robotic arm controlled by reading brain signals. Degrees of freedom is the most important aspect of this brain-controlled arm that corresponds to the joint of each other that represents the point on the arm where the arm can bend, rotate or translate. A joint can perform two motions: rotation and translation. A link is a connector that connects two actuators.
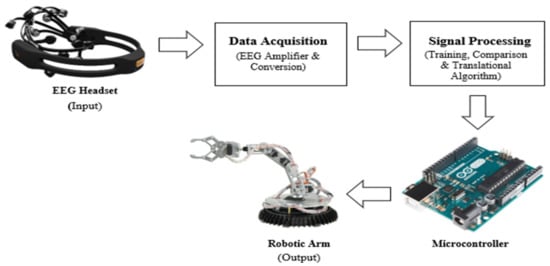
Figure 1.
Block Diagram and System Architecture.
This BCI-based study shows how to actuate a robotic arm with the help of device commands derived from EEG signals. We have used an emotive headset to acquire EEG signals from the brain, which are further used to run the actuator of the robotic arm through artificial intelligence and machine learning techniques.
In this area, some work has also been conducted that proposed different methods to control different objects. We have discussed the most specific works, i.e., the author in [10] has proposed an attention mechanism for the classification of motor imagery (MI) signals. As a result of the dynamic properties of the motor imagery signals, the attention mechanism can extract spatial context features. This model is more accurate than current best practices that use convolution with varying filter sizes to extract features from MI signals in various spatial contexts. The authors in [11] have used an inception approach that claims accuracy with the BCI challenge dataset. Further, a variety of deep learning methods have been developed in the existing literature to classify motor imagery (MI) [8,9,10,11,12]. In [13], CNN is used which uses spatial features to classify EEG signals which also shows relatively better results.
In [14,15,16,17], EEG data has been directly fed into the long short-term memory (LSTM) models. The authors in [18] developed an application of BCI for LabVIEW with which a robotic hand is controlled by voluntary blinking of the eyes. The embedded sensor in the Neurosky MindWave Mobile headset picked up the blinking. Another study proposed the design of a wheelchair controlled by an EEG signal [19]. The authors have constructed an electric wheelchair that can be directly controlled by the brain of the disabled person. Emotiv EPOC headset has been used for the acquisition of EEG signals. Additionally, an Arduino IDE is used for the programming. Their program can read and process the EEG data from the Emotiv EPOC headset into mental command. In [20], the authors used a headset but did not use any classification algorithms for the classification of signals and nor achieve an accuracy of more than 60%. The criteria of the total number of users are also not achieved in this proposal. In [21,22,23,24,25,26,27,28,29], the authors have implemented a better version of the BCI process as they used headset and machine learning algorithms in Python. Consequently, their proposals are also validated through their results that achieved an accuracy of more than 60%, and the product is also used by most rs. In [30,31,32,33,34,35], the authors used the headset for signal acquisition, and neunetworks and fuzzy logic have been implemented to achieve an accuracy of more than 60%, and the product was used by more than two users. However, like [36], no classification algorithms are employed, nor any framework for programming is used.
In the proposed work, we have used the Emotive EPOC headset for signals acquisition to predict a reliable bandwidth for the BCI process and provide exact placements of EEG electrodes to verify different arm moments. We have applied different classification algorithms, i.e., Random Forest, KNN, Gradient Boosting, Logistic Regression, SVM, and Decision Tree, to four different users. The proposal is validated through results that achieve an accuracy of more than 60%. Table 1 shows the comparison between different related studies and proposed work. In this paper, classification has been performed using various machine learning and artificial techniques, and a comparative analysis of all techniques has been provided to decide the most accurate based results (accuracy). Afterward, the robotic arm will be controlled by a microcontroller using input from the brain. A study proposed a new authentication approach for Internet of Things (IoT) devices. This method is entirely based on EEG signals and hand gestures. For signal acquisition, they also use low price Neurosky MindWave headset. This was based on choosing the authentication key’s adaptive thresholds of attention and meditation mode. The authentication process for hand gestures is controlled by using a camera. Results revealed that the proposed method demonstrated the usability of authentication by using EEG signals with an accuracy of 92% and an efficiency of 93%, and user satisfaction is acceptable and satisfying. The results showed that the password strength using the proposed system is stronger than the traditional keyboard. The proposed authentication method also is resistant to target impersonation and physical observation.

Table 1.
Comparison table of related study and proposed work.
2. Methodology
We have designed a system that acquires EEG data through left and right arm movement sessions. Furthermore, we have developed a machine learning framework for decoding user intent and evaluating the overall performance of our system. The following sub-section presents the methods and materials to achieve the objectives specified in this study.
2.1. EEG Analysis
The bandwidth of EEG signals falls in the following rhythms as shown in Table 2, i.e., alpha, beta, gamma, delta, and theta, respectively. These rhythms identify the human brain activity levels.
Table 2.
EEG Waves Analysis.
The delta and theta frequencies are dominant while sleeping and unconscious, whereas the gamma frequencies are dominant during hyper-activities, also known as exciting activities. Therefore, the desired dominant frequencies for this study are alpha (8 Hz–13 Hz) and beta (13 Hz–32 Hz), respectively. With the continuous thinking of moving the arm left or right, the frequencies are generated in the 8 Hz–32 Hz bandwidth. Moreover, the EEG headsets are responsible for acquiring data from the brain and vectorizing it into numerical form.
2.2. Data Pre-Processing
The second step after fetching the data is to preprocess the raw data acquired from the sensor node that is full of errors and missing values. It is important to refine this data as the machine learning algorithms behave irregularly due to this raw data [10]. The raw data is converted into meaningful data using the pandas preprocessing techniques that consist of removing NaN/Null and missing values. The rows consisting of null values are dropped by the panda’s row drop function, whereas the lowest correlated features acquired by the features extraction technique are also dropped by the panda’s columns dropping function. The system does not use the filling techniques of pandas for missing values to maintain the data integrity. The meaningful data is converted into a comma-separated file (CSV), and further, these CSV files are fed into artificial intelligence algorithms for processing. We have implemented the restrictions in alpha and beta domains; therefore, the threshold for maximum value acquired by each electrode is set to 32. The proposed work deals with the higher alpha and beta bandwidth of EEG signals. It is generally regarded as a normal rhythm. While a patient is alert, anxious, or has their eyes open, this rhythm is dominant. It shows that we are working in the correct range of EEG waves and choosing the right rhythms. Another type of preprocessing implemented in the study is labeling the activities. We use three classes, as shown in the following Table 3.
Table 3.
Labeling the movement of the user and its predicted output.
2.3. Data Acquisition
EMOTIV EPOC + 14 channel electroencephalogram was used for recording brain impulses. There are 14 electrode channels numbered AF3, F7, F3, FC5, T7, P7, O1, O2, P8, T8, FC6, F4, F8, and AF4 with a sampling frequency of 128 Hz and a 16-bit analog to digital converter was used. The participant was exposed to images depicting voluntary motor actions during each of these acquisition cycles, namely: a right arrow representing motor action in the right direction, a left arrow representing motor action in the left direction, and a circle representing no motor action. In this case, the participant is given a beep to open his eyes only at certain times. The numerical data is gathered from the Kaggle data platform given in Table A1, Appendix A despite raw EEG waveforms.
2.4. Machine Learning Approach and Classification Techniques
The choice of an algorithm is the most critical process due to the variation of the EEG data. Figure 2 represents the presence of a dataset that tends to deploy a supervised learning algorithm that is a subdivision of machine learning algorithms and puts forward a choice between regression and classification algorithms. The proposed system aims to predict discrete responses; therefore, the regression algorithms are not useful because they tend to predict continuous values. Several classification algorithms are deployed for the prediction of the classes, including Random Forest, K-Nearest Neighbor (KNN), Logistic Regression, Support Vector Machine (SVM), Naïve Bayes, and Gradient Boosting for comparison and accuracy.
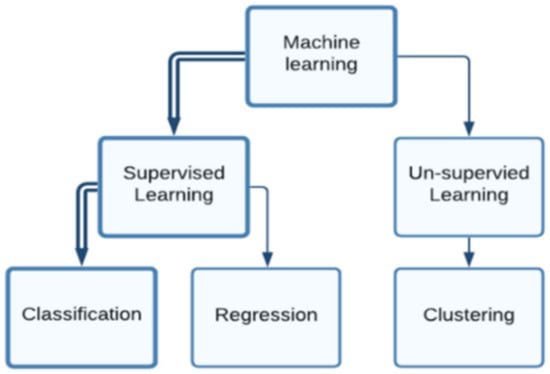
Figure 2.
The presence of a dataset tends to predict continuous values.
The data is s into testing and training data, i.e., X_train, X_test, Y_train, Y_test, through the SK-learn model selection library. The data is split as 80% for training data and 20% for testing data, whereas the training data, i.e., X_train and Y_train are fed to the classifiers for fitting and teaching the model. Whereas the unseen data, i.e., X_test and Y_test are used to drive the accuracy matrix known as confusion matrix and classification reports as discussed in Section 3.1. The parameters used in modeling the classification algorithms are shown in Table A2 in Appendix B.
2.5. Translation Algorithms
The strength of the Python language and the supportive environment of Arduino is the key feature of our system. It is a practical implementation and real-time integration of the Python environment and Arduino. The framework that connects the other environments with Arduino is called “Firmata”. It is a protocol to connect the Arduino serial interface with other programming languages. Predicted output is translated into actuator driving commands through serial communication formed by Pyfirmata.
2.6. Robotic Arm
A robotic arm [7] is an extremely adaptable robot that can be used in a wide range of applications. The single most important factor in the design of a bionic manipulator is the Degree of Freedom (DOF). Each degree of freedom corresponds to each arm joint, a point on the arm at which it may bend, rotate, or translate.
The robotic arm is structured on articulated structures of the robotic arm; these types of robotic arms are mainly used in industries such as automotive. The design of the robotic arm is not as important as its working for the project. Therefore, the main objective is to work with actuators. Figure 3 represents the circuit diagram of the system that illustrates the servo to interfacing using a microcontroller that aids in developing a robotic arm that has abilities to mimic unidirectional movements. Table 4 shows the components of a robotic arm. Figure 4 represents the flow of the system. The input bandwidth is processed in a pre-processing block to apply limitations that aid in the learning model and predictions. The predicted outputs are set as parameters for Python Arduino interfacing that are converted into machine-understandable language. The movement of the actuator is based on the predicted category.
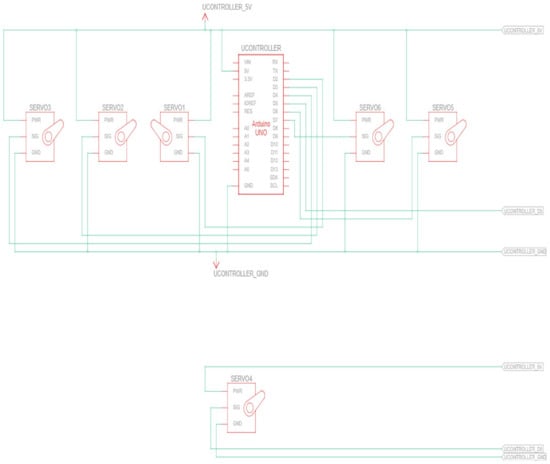
Figure 3.
Circuit diagram of the microcontroller and servos interfacing for assembly of the robotic arm.
Table 4.
Components for the robotic arm.
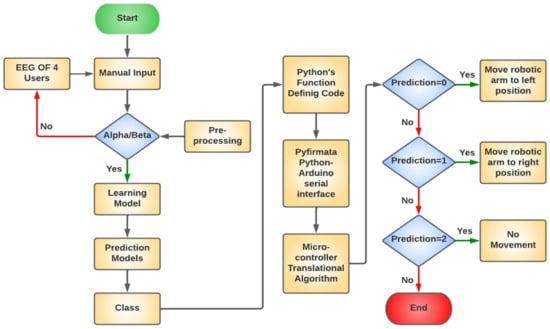
Figure 4.
Flow chart of the system.
3. Results and Discussion
The results in the project are divided into the best fit classification algorithm, individual results of the best fit classifier, and several medical science-related insights and findings.
The results promise to hold novel achievements for BCI and artificial intelligence. The system aims to predict the left or right movement through the highest scoring algorithm. In the user, one case is taken as a reference for all of the users. Figure 5 is the graphical representation of the classifiers scores that aid in the best-recommended algorithms. The chart in Figure 5 is a bar chart that is built by matplotlib which illustrates the accuracies of the models, i.e., 52.60%, 60.07%, 50.69%, 46.35%, 74.13%, 64.24%, and 72.74% for lg, knn, svm, nb, gb, tree, and rf, respectively.
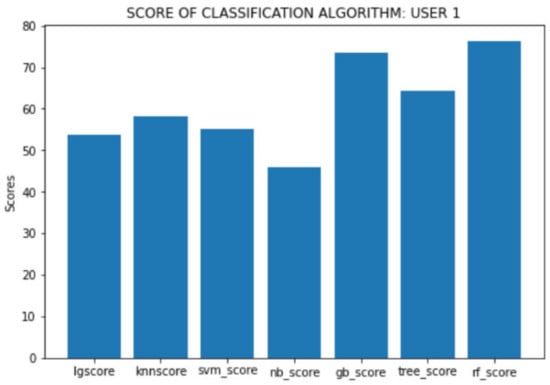
Figure 5.
Classifier Scores to predict the labeled classes.
The foremost algorithms to deploy are Random Forest (rf), Gradient Boosting (GB), and Decision Trees (tree). The models are prioritized based on their scores. The score is the accuracy of the model to predict the accurate target. The input data is unseen for the model to predict the classes. A pictorial representation of the recommendation levels of the above models can be shown in Figure 6.
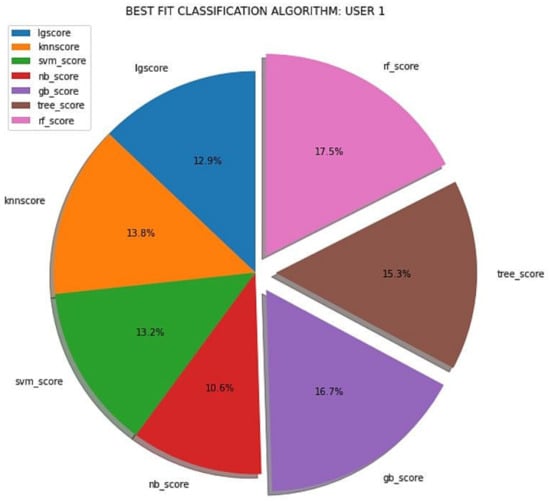
Figure 6.
Recommended Classifiers.
3.1. Confusion Matrix and Classification Reports of Best-Fit Classifiers
Confusion matrices are to illustrate the comparison between truth values and predicted values acquired by predictions from classification algorithms. The classification report is a useful method that is used to take out all of the necessary information from the output of classification algorithms. A confusion matrix is shown in Figure 7, Figure 8 and Figure 9 with their report in Table 5, Table 6 and Table 7 for a Random Forest, Decision Tree, and a Gradient Boosting classifier, respectively.
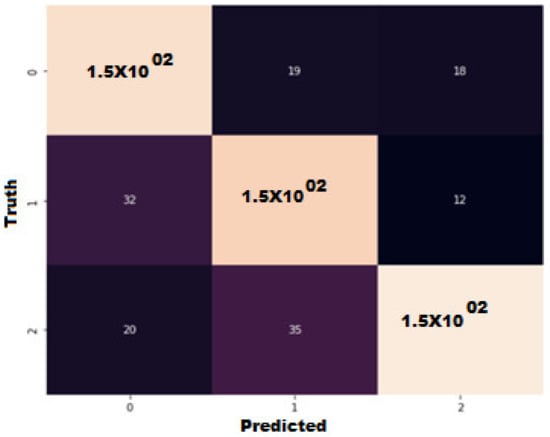
Figure 7.
Best fit algorithms to deploy with recommendations levels.
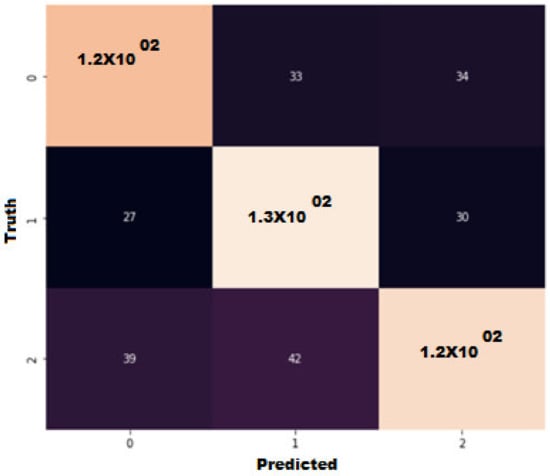
Figure 8.
Confusion matrix of Random Forest classifier.
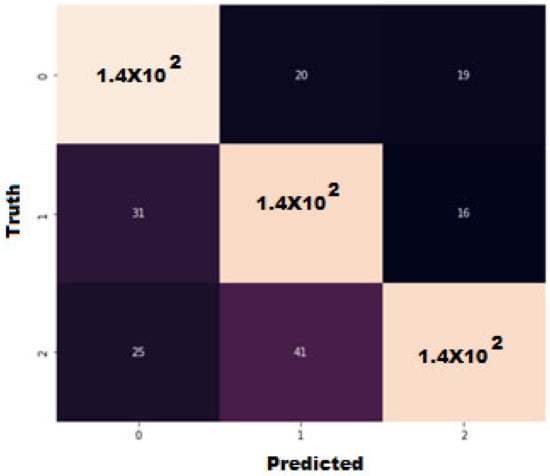
Figure 9.
Confusion matrix of Gradient Boosting classifier.
Table 5.
Classification report of Random Forest classifier.
Table 6.
Classification report of Decision Trees classifier.
Table 7.
Classification Gradient Boost Classifier.
Figure 7 represents that the Random Forest classifier has predicted the classes 0, 1, and 2 accurately at 1.5 × 10², 1.4 × 10² and 1.5 × 10² times, respectively. Moreover, Table 5 illustrates the precision and recall of the classifier, i.e., (0.74, 0.80), (0.72, 0.76), and (0.83, 0.76) for classes 0, 1, and 2, respectively, with an overall accuracy of Random Forest is 76%. Figure 8 represents that the Decision Tree classifier has predicted the classes 0, 1, and 2 accurately at 1.2 × 10², 1.3 × 10², and 1.2 × 10² times, respectively. Table 6 illustrates the precision and recall of the classifier, i.e., (0.64, 0.64), (0.63, 0.69), and (0.66, 0.61) for class 0, 1, and 2, respectively. Whereas the overall accuracy of the Decision Tree is 64%.
Figure 9 represents that the Gradient Boosting classifier has predicted the classes 0, 1, and 2 accurately at 1.4 × 10² for all times, respectively. Table 7 illustrates the precision and recall of the classifier, i.e., (0.72, 0.79), (0.69, 0.75), and (0.80, 0.68) for class 0, 1, and 2, respectively.
The overall accuracy of Gradient Boosting is 74%. This result covers the major aspects of the BCI and its analysis. Figure 10 represents the correlation of electrode “F4” placed on the right side of the brain with six other electrodes placed on different sides of the brain. The decreasing order of maximum density of the left movement represented as 0 class is achieved by the “F4” electrode correlated to FC5, F7, FC6, F3, and F8, respectively. Electrode “F4” correlated to “F4” forms a linear scatter plot, because of the overlapping data point. Hence it is proved that the precise data points for the left movement are gained by the placement of the F4 electrode with the highest correlated electrodes, as discussed above. Figure 10 displays that the “F4” electrode is mapped with other electrodes to represent the classifications of the features in the specified bandwidth; therefore, this study shows that the movement of the left arm is generated in this region of bandwidth, which can be further observed in Figure 10. This result shows that different human brains use different neuronic algorithms. Different people have different activation bandwidths; therefore, the dominant frequencies for each individual may differ. However, the position of the electrodes from which the data is acquired is always the same.
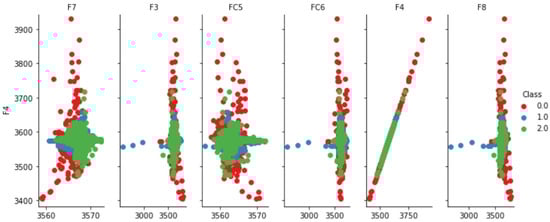
Figure 10.
F4-Electrode correlation with each electrode and they are scattered plots based on labelled classes.
To demonstrate the movement of the right hand using an electrode known as “F7” placed on the left side of the brain that is presented in Figure 5. The “F7” electrode, which is correlated to FC5, F4, FC6, F3, and F8, achieves the decreasing order of maximal density of the right movement depicted as class 1, respectively. On the other hand, because of the overlapping data points, electrode “F7” correlates to electrode “F7”, forming a linear scatter plot.
Figure 11 shows that the location of the F7 electrode with the highest correlated electrodes, as mentioned above, results in the precise data points for the right movement. An electrode placed on the left side of the brain controls the right arm with different activation bandwidth levels and vice versa.
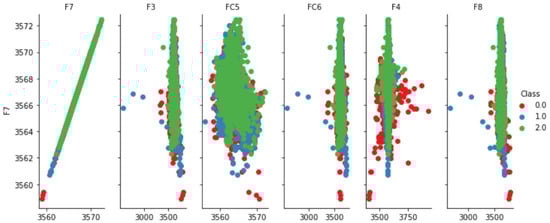
Figure 11.
F7-Electrode correlation with each electrode and they are scattered plots based on labeled classes.
3.2. Working of Actuators Based on Predictions
The robotic arm named “Stacy” tends to move in a unidirectional manner. The system acquires data from the dataset and feeds it to the machine learning algorithm. The qualitative values of moving left, right, and no movement are derived by quantitative values of the classes (through Pyfirmata and Python programming), i.e., if the prediction is 0, the servo motor moves 90 degrees to the left from the reset position whereas if the prediction is 1, the servo moves 90 degrees to the right from the resetting position. Figure 12 is the representation of the working actuator driving code that resets the robotic arm and translates the predicted output to the controller readable commands that eventually run the system with a delay of some milliseconds provided by the programming.
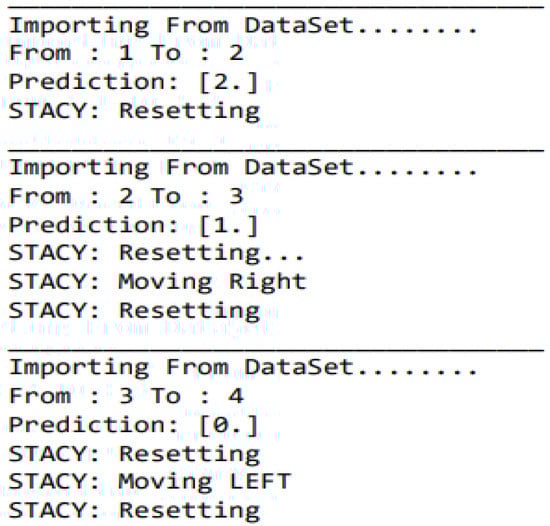
Figure 12.
Screenshot of Robotic Arm movement.
4. Conclusions
This work implements machine learning techniques to control the movement of a robotic arm by using EEG signal information gathered through EEG electrodes. Further, different classifiers are applied to the extracted data to train the system and compute the accuracy. The EEG data has been extracted from four users to apply the best fit classification algorithms for precise and accurate predictions. The proposed non-invasive has predicted a reliable bandwidth through the entire BCI process that provides an exact placement of EEG electrodes to verify different arm moments. In this study, we have used classifiers, i.e., Random Forest, KNN, Gradient Boosting, Logistic Regression, SVM, and Decision Tree. It can be concluded from the results of the novel deployment that the accuracy for Random Forest shows the best accuracy, 76%, while Decision Tree gives the lowest at 64%. The proposed prototype has great potential as it can be further extended for criminal investigations, autonomous vehicle control systems, the education of disabled students, and prosthetics.
Author Contributions
Conceptualization, J.A., A.Q., A.-U.R., M.K.N., M.S., A.U.R., E.T.E., N.A.G. and H.H.; methodology, J.A., A.Q., A.-U.R., M.K.N. and A.U.R.; software, A.Q., A.-U.R. and M.K.N.; validation, J.A., N.A.G., M.S. and A.-U.R.; formal analysis, A.Q., A.-U.R. and M.K.N.; investigation, J.A., A.Q., A.-U.R. and M.K.N.; resources, J.A., M.S. and A.-U.R.; data curation, J.A. and A.U.R.; writing—original draft preparation, J.A., A.Q., N.A.G., A.-U.R. and M.K.N.; writing—review and editing, J.A., A.Q., A.-U.R., M.K.N., M.S., A.U.R., E.T.E. and H.H.; visualization, A.-U.R. and M.K.N.; supervision, J.A. and M.S.; project administration, M.S., E.T.E. and H.H.; funding acquisition, E.T.E. All authors have read and agreed to the published version of the manuscript.
Funding
This research was supported by the Future University Researchers Supporting Project Number FUESP-2020/48 at Future University in Egypt, New Cairo 11845, Egypt.
Institutional Review Board Statement
Not Applicable.
Informed Consent Statement
Not Applicable.
Data Availability Statement
Not Applicable.
Conflicts of Interest
The authors declare no conflict of interest.
Appendix A
Table A1.
Data acquired by Kaggle in numerical format.
Table A1.
Data acquired by Kaggle in numerical format.
| Class | AF3 | AF3.1 | AF3.2 | AF3.3 | AF3.4 | AF3.5 | AF3.6 | AF3.7 | F7 | F7.1 | F7.2 | F7.3 | F7.4 | |
|---|---|---|---|---|---|---|---|---|---|---|---|---|---|---|
| 0 | 1 | 0 | 0 | 1.67373 | 4.44474 | 0.52621 | 3.00209 | 1.425 | 3.30274 | 0 | 0 | 1.4041 | 2.2794 | 1.2974 |
| 1 | 1 | 0 | 0 | 1.89779 | 3.72882 | 1.30419 | 1.85435 | 1.3666 | 2.54646 | 0 | 0 | 0.6942 | 1.9711 | 0.7564 |
| 2 | 1 | 0 | 0 | 2.79801 | 2.5745 | 1.12054 | 1.95882 | 0.9824 | 2.25862 | 0 | 0 | 0.4937 | 1.2228 | 0.9555 |
| 3 | 1 | 0 | 0 | 2.18178 | 3.61051 | 0.62961 | 2.15588 | 0.8563 | 2.23371 | 0 | 0 | 0.5093 | 1.4788 | 0.8486 |
Appendix B
Table A2.
Parameters used in modelling the classifiers.
Table A2.
Parameters used in modelling the classifiers.
| Classifier | Parameters |
|---|---|
| rf | n_estimators = 130 |
| gb | n_estimators = 130 |
| SVM | probability = True, gamma = ‘auto’, kernel = ‘linear’ |
| knn | n_neighbors = 3, weights = ‘uniform’, algorithm = ‘auto’, leaf_size = 30, p = 2, metric = ‘minkowski’, metric_params = None, n_jobs = None |
| lr | penalty = ‘l2′, dual = False, tol = 0.0001, C = 1.0, fit_intercept = True, intercept_scaling = 1, class_weight = None, random_state = None, solver = ‘lbfgs’, max_iter = 100, multi_class = ‘auto’, verbose = 0, warm_start = False, n_jobs = None, l1_ratio = None |
| Tree | criterion = ‘gini’, splitter = ‘best’, max_depth = None, min_samples_split = 2, min_samples_leaf = 1, min_weight_fraction_leaf = 0.0, max_features = None, random_state = None, max_leaf_nodes = None, min_impurity_decrease = 0.0, class_weight = None, ccp_alpha = 0.0 |
| Nb | priors = None, var_smoothing = 1 × 10⁻⁹ |
References
- Martini, M.L.; Oermann, E.K.; Opie, N.L.; Panov, F.; Oxley, T.; Yaeger, K. Sensor Modalities for Brain-Computer Interface Technology. Neurosurgery 2020, 86, E108–E117. [Google Scholar] [CrossRef] [PubMed]
- Bamdad, M.; Zarshenas, H.; Auais, M.A. Application of BCI systems in neurorehabilitation: A scoping review. Disabil. Rehabil. Assist. Technol. 2015, 10, 355–364. [Google Scholar] [CrossRef] [PubMed]
- Mao, X.; Li, M.; Li, W.; Niu, L.; Xian, B.; Zeng, M.; Chen, G. Progress in EEG-based brain robot interaction systems. Comput. Intell. Neurosci. 2017, 2017, 1742862. [Google Scholar] [CrossRef] [PubMed]
- Tanwani, A.K.; Billard, A. Rewards-Driven Control of Robot Arm by Decoding EEG Signals. In Proceedings of the 2014 36th Annual International Conference of the IEEE Engineering in Medicine and Biology Society, Chicago, IL, USA, 26–30 August 2014; IEEE: Piscataway, NJ, USA, 2014; pp. 1658–1661. [Google Scholar]
- Sunny, T.; Aparna, T.; Neethu, P.; Venkateswaran, J.; Vishnupriya, V.; Vyas, P. Robotic Arm with Brain—Computer Interfacing. Procedia Technol. 2016, 24, 1089–1096. [Google Scholar] [CrossRef][Green Version]
- Sadiq, M.T.; Suily, S.; Rehman, A.U. Chapter 4—Evaluation of Power Spectral and Machine Learning Techniques for the Development of Subject-Specific BCI. In Artificial Intelligence-Based Brain-Computer Interface (BCI); Elsevier: Amsterdam, The Netherlands, 2022; pp. 99–120. [Google Scholar] [CrossRef]
- Sundas, A.; Badotra, S.; Bharany, S.; Almogren, A.; Tag-ElDin, E.M.; Rehman, A.U. HealthGuard: An Intelligent Healthcare System Security Framework Based on Machine Learning. Sustainability 2022, 14, 11934. [Google Scholar] [CrossRef]
- Sadiq, M.T.; Aziz, M.Z.; Almogren, A.; Yousaf, A.; Siuly, S.; Rehman, A.U. Exploiting Pretrained CNN Models for the Development of an EEG-Based Robust BCI Framework. In Computers in Biology and Medicine; Elsevier: Amsterdam, The Netherlands, 2022; Volume 143, p. 105242. [Google Scholar] [CrossRef]
- Sadiq, M.T.; Yu, X.; Yuan, Z.; Fan, Z.; Rehman, A.U.; Li, G.; Xiao, G. Motor Imagery EEG Signals Classification Based on Mode Amplitude and Frequency Components Using Empirical Wavelet Transform. IEEE Access 2019, 7, 127678–127692. [Google Scholar] [CrossRef]
- Dai, M.; Zheng, D.; Na, R.; Wang, S.; Zhang, S. EEG classification of motor imagery using a novel deep learning framework. Sensors 2019, 19, 551. [Google Scholar] [CrossRef]
- Cecotti, H.; Graser, A. Convolutional Neural Networks for P300 Detection with Application to Brain-Computer Interfaces. IEEE Trans. Pattern Anal. Mach. Intell. 2010, 33, 433–445. [Google Scholar] [CrossRef]
- Sadiq, M.T.; Yu, X.; Yuan, Z.; Zeming, F.; Rehman, A.U.; Ullah, I.; Li, G.; Xiao, G. Motor Imagery EEG Signals Decoding by Multivariate Empirical Wavelet Transform-Based Framework for Robust Brain–Computer Interfaces. IEEE Access 2019, 7, 171431–171451. [Google Scholar] [CrossRef]
- Universitatea de Medicina și Farmacie “Gr.T. Popa” Iași; Institute of Electrical and Electronics Engineers; IEEE Engineering in Medicine and Biology Society. Romania Chapter. In Proceedings of the 2019 E-Health and Bioengineering Conference (EHB): EHB 2019, Iasi, Romania, 21–23 November 2019; 7th ed. IEEE: Piscataway, NJ, USA, 2019. [Google Scholar]
- Zhang, K.; Xu, G.; Zheng, X.; Li, H.; Zhang, S.; Yu, Y.; Liang, R. Application of Transfer Learning in EEG Decoding Based on Brain-Computer Interfaces: A Review. Sensors 2020, 20, 6321. [Google Scholar] [CrossRef]
- Kim, K.-T.; Suk, H.-I.; Lee, S.-W. Commanding a Brain-Controlled Wheelchair Using Steady-State Somatosensory Evoked Potentials. IEEE Trans. Neural Syst. Rehabil. Eng. 2018, 26, 654–665. [Google Scholar] [CrossRef]
- Meng, J.; Zhang, S.; Bekyo, A.; Olsoe, J.; Baxter, B.; He, B. Non-invasive electroencephalogram based control of a robotic arm for reach and grasp tasks. Sci. Rep. 2016, 6, 38565. [Google Scholar] [CrossRef]
- Ramirez-Noriega, A.; Martinez-Ramirez, Y.; Jimenez, S.; Carrillo, E.G.; Garcia, J.E.S. An Application Programming Interface for a Brain-Computer Interface using Two Neuroskymindwave Devices. In Proceedings of the 2020 8th Edition of the International Conference in Software Engineering Research and Innovation, CONISOFT 2020, Chetumal, Mexico, 4–6 November 2020; pp. 140–146. [Google Scholar] [CrossRef]
- Jeong, J.-H.; Shim, K.-H.; Kim, D.-J.; Lee, S.-W. Brain-Controlled Robotic Arm System Based on Multi-Directional CNN-BiLSTM Network Using EEG Signals. IEEE Trans. Neural Syst. Rehabil. Eng. 2020, 28, 1226–1238. [Google Scholar] [CrossRef]
- Sadiq, M.T.; Akbari, H.; Siuly, S.; Yousaf, A.; Rehman, A.U. A Novel Computer-Aided Diagnosis Framework for EEG-Based Identification of Neural Diseases. In Computers in Biology and Medicine; Elsevier: Amsterdam, The Netherlands, 2021; Volume 138, p. 104922. [Google Scholar] [CrossRef]
- Sadiq, M.T.; Akbari, H.; Rehman, A.U.; Nishtar, Z.; Masood, B.; Ghazvini, M.; Too, J.; Hamedi, N.; Kaabar, M.K.A. Exploiting Feature Selection and Neural Network Techniques for Identification of Focal and Nonfocal EEG Signals in TQWT Domain. J. Healthc. Eng. 2021, 2021, 6283900. [Google Scholar] [CrossRef]
- Jeong, J.-H.; Lee, B.-H.; Lee, D.-H.; Yun, Y.-D.; Leeb, S.-W. EEG Classification of Forearm Movement Imagery Using a Hierarchical Flow Convolutional Neural Network. IEEE Access 2020, 8, 66941–66950. [Google Scholar] [CrossRef]
- Akbari, H.; Sadiq, M.T.; Rehman, A.U. Classification of normal and depressed EEG signals based on centered correntropy of rhythms in empirical wavelet transform domain. Health Inf. Sci. Syst. 2021, 9, 9. [Google Scholar] [CrossRef]
- Jiao, Z.; Gao, X.; Wang, Y.; Li, J.; Xu, H. Deep convolutional neuralnetworks for mental load classification based on EEG data. Pattern Recognit. 2018, 76, 582–595. [Google Scholar] [CrossRef]
- Zhang, P.; Wang, X.; Zhang, W.; Chen, J. Learning spatial–spectral–temporal EEG features with recurrent 3D convolutional neural networksfor cross-task mental workload assessment. IEEE Trans. Neural Syst. Rehabil. Eng. 2019, 27, 31–42. [Google Scholar] [CrossRef]
- Alhagry, S.; Fahmy, A.A.; El-Khoribi, R.A. Emotion recognitionbased on EEG using LSTM recurrent neural network. Emotion 2017, 8, 355–358. [Google Scholar]
- Salama, E.S.; El-Khoribi, R.A.; Shoman, M.E.; Wahby, M.A. EEGbased emotion recognition using 3D convolutional neural networks. Int. J. Adv. Comput. Sci. Appl. 2018, 9, 329–337. [Google Scholar]
- Li, J.; Yu, Z.L.; Gu, Z.; Wu, W.; Li, Y.; Jin, L. A hybrid network forERP detection and analysis based on restricted Boltzmann machine. IEEE Trans. Neural Syst. Rehabil. Eng. 2018, 26, 563–572. [Google Scholar] [CrossRef]
- Ditthapron, A.; Banluesombatkul, N.; Ketrat, S.; Chuangsuwanich, E.; Wilaiprasitporn, T. Universal joint feature extraction for P300EEG classification using multi-task autoencoder. IEEE Access 2019, 7, 68415–68428. [Google Scholar] [CrossRef]
- Tabar, Y.R.; Halici, U. A novel deep learning approach for classification of EEG motor imagery signals. J. Neural Eng. 2017, 14, 016003. [Google Scholar] [CrossRef]
- Lu, N.; Li, T.; Ren, X.; Miao, H. A deep learning scheme formotor imagery classification based on restricted Boltzmann machines. IEEE Trans. Neural Syst. Rehabil. Eng. 2017, 25, 566–576. [Google Scholar] [CrossRef]
- Zhang, Z.; Duan, F.; Sole-Casals, J.; Dinares-Ferran, J.; Cichocki, A.; Yang, Z.; Sun, Z. A novel deep learning approach with data augmentation toclassify motor imagery signals. IEEE Access 2019, 7, 15945–15954. [Google Scholar] [CrossRef]
- Wang, P.; Jiang, A.; Liu, X.; Shang, J.; Zhang, L. LSTM-based EEGclassification in motor imagery tasks. IEEE Trans. Neural Syst. Rehabil. Eng. 2018, 26, 2086–2095. [Google Scholar] [CrossRef]
- Schirrmeister, R.T.; Springenberg, J.T.; Fiederer, L.D.J.; Glasstetter, M.; Eggensperger, K.; Tangermann, M.; Hutter, F.; Burgard, W.; Ball, T. Deep learning with convolutional neural networks for EEG decoding andvisualization. Hum. Brain Mapp. 2017, 38, 5391–5420. [Google Scholar] [CrossRef]
- Swee, S.K.; Kiang, K.D.T.; You, L.Z. EEG controlled wheelchair. MATEC Web Conf. 2016, 51, 02011. [Google Scholar] [CrossRef]
- Kim, H.-S.; Yoshimura, N.; Koike, Y. Classification of movementintention using independent components of premovement EEG. Front. Hum. Neurosci. 2019, 13, 63. [Google Scholar] [CrossRef]
- Daud, S.N.S.S.; Sudirman, R. Artifact removal and brain rhythm decomposition for eeg signal using wavelet approach. J. Teknol. 2016, 78, 135–143. [Google Scholar] [CrossRef][Green Version]
Publisher’s Note: MDPI stays neutral with regard to jurisdictional claims in published maps and institutional affiliations. |
© 2022 by the authors. Licensee MDPI, Basel, Switzerland. This article is an open access article distributed under the terms and conditions of the Creative Commons Attribution (CC BY) license (https://creativecommons.org/licenses/by/4.0/).