Article

Multi-Input Attention Network for Dehazing of Remote Sensing Images

1
Key Laboratory of Infrared System Detection and Imaging Technologies, Shanghai Institute of Technical Physics, Chinese Academy of Sciences, Shanghai 200083, China
2
University of Chinese Academy of Sciences, Beijing 100049, China
*
Author to whom correspondence should be addressed.
Appl. Sci. 2022, 12(20), 10523; https://doi.org/10.3390/app122010523
Submission received: 14 September 2022 / Revised: 12 October 2022 / Accepted: 14 October 2022 / Published: 18 October 2022
(This article belongs to the Special Issue Remote Sensing Image Processing and Application)

Abstract

:
The non-uniform haze distribution in remote sensing images, together with the complexity of the ground information, brings many difficulties to the dehazing of remote sensing images. In this paper, we propose a multi-input convolutional neural network based on an encoder–decoder structure to effectively restore remote sensing hazy images. The proposed network can directly learn the mapping between hazy images and the corresponding haze-free images. It also effectively utilizes the strong haze penetration characteristic of the Infrared band. Our proposed network also includes the attention module and the global skip connection structure, which enables the network to effectively learn the haze-relevant features and better preserve the ground information. We build a dataset for training and testing our proposed method. The dataset consists of remote sensing images with two different resolutions and nine bands, which are captured by Sentinel-2. The experimental results demonstrate that our method outperforms traditional dehazing methods and other deep learning methods in terms of the final dehazing effect, peak signal-to-noise ratio (PSNR), structural similarity (SSIM) and feature similarity (FSIM).

1. Introduction

In recent years, the quality and quantity of satellite data have tremendously increased. However, the impact of haze has been a common issue with optical remote sensing data. Haze can severely interfere with the transmittance in all optical spectral bands, which impacts the reflected signal and hinders the observation of the underlying surface of the haze. This further results in huge data loss in both the spatial and temporal domains. Haze becomes serious interference for applications requiring time consistency (such as agricultural monitoring) and applications requiring observation of a scene at a specific time (such as disaster monitoring). Therefore, effective recovery from haze will greatly increase the usability of remote sensing data.
Early studies on the dehazing problem of remote sensing images use different methods to eliminate the influence of haze [1,2,3,4]. They use multi-source or multi-temporal images in the same area as auxiliary data, the complementary relationship between images, image fusion, pixel replacement, etc. All these methods have achieved good results. However, the need to obtain multiple sets of data from the same area as auxiliary data leads to poor applicability; especially for some remote sensing data with long collection interval, it will be more difficult to obtain available auxiliary data. Therefore, the single image dehazing method has attracted more and more attention. Some studies on single image dehazing use image enhancement methods, including processing the histogram of the image [5], and enhancing the contrast [6] and saturation [7] of the image. Additionally, some dehazing methods are based on homomorphic filtering [8] and the retinex color constancy theory [9].
Image enhancement lacks the hazy imaging mechanism, which could lead to a certain degree of distortion in the restored image. Researchers build an image dehazing method based on the Atmospheric Scattering Model (ASM). The most popular ASM model was proposed by McCartney and further improved by Narasimhan [10] and Nayar [6]. The model can usually be written as in Formula (1):
I ( x ) = J ( x ) t ( x ) + A [ 1 t ( x ) ]
where I ( x ) is the image disturbed by haze; J ( x ) is the haze-free image that needs to be restored; t ( x ) is the transmittance of light passing through the atmospheric medium; x represents the image pixel; A represents the global constant: atmospheric light. To obtain the haze-free image J ( x ) , we first need to obtain the transmittance t ( x ) and the global atmospheric light A. However, using hazy images to estimate transmittance requires prior information. At present, studies on prior information are mainly based on statistical properties of hazy images, such as contrast prior [11], dark channel prior (DCP) [12], color attenuation prior [13], etc. However, this prior information will very likely become less applicable in images of different scenes, which affects the dehazing results.
The development of deep learning brings new ideas to the dehazing research: convolutional neural network (CNN). Some earlier studies use neural networks to replace prior information to estimate the parameters of Formula (1) [14,15,16] and to obtain the dehazed image. Since the real transmittance value of the hazy image cannot be obtained, the training data can be achieved through simulated parameters, which could impact the accuracy of the estimated transmittance. Meanwhile, the transmittance model is a simplified expression for hazy imaging. The advantage of feature extraction capability of neural networks cannot be fully utilized.
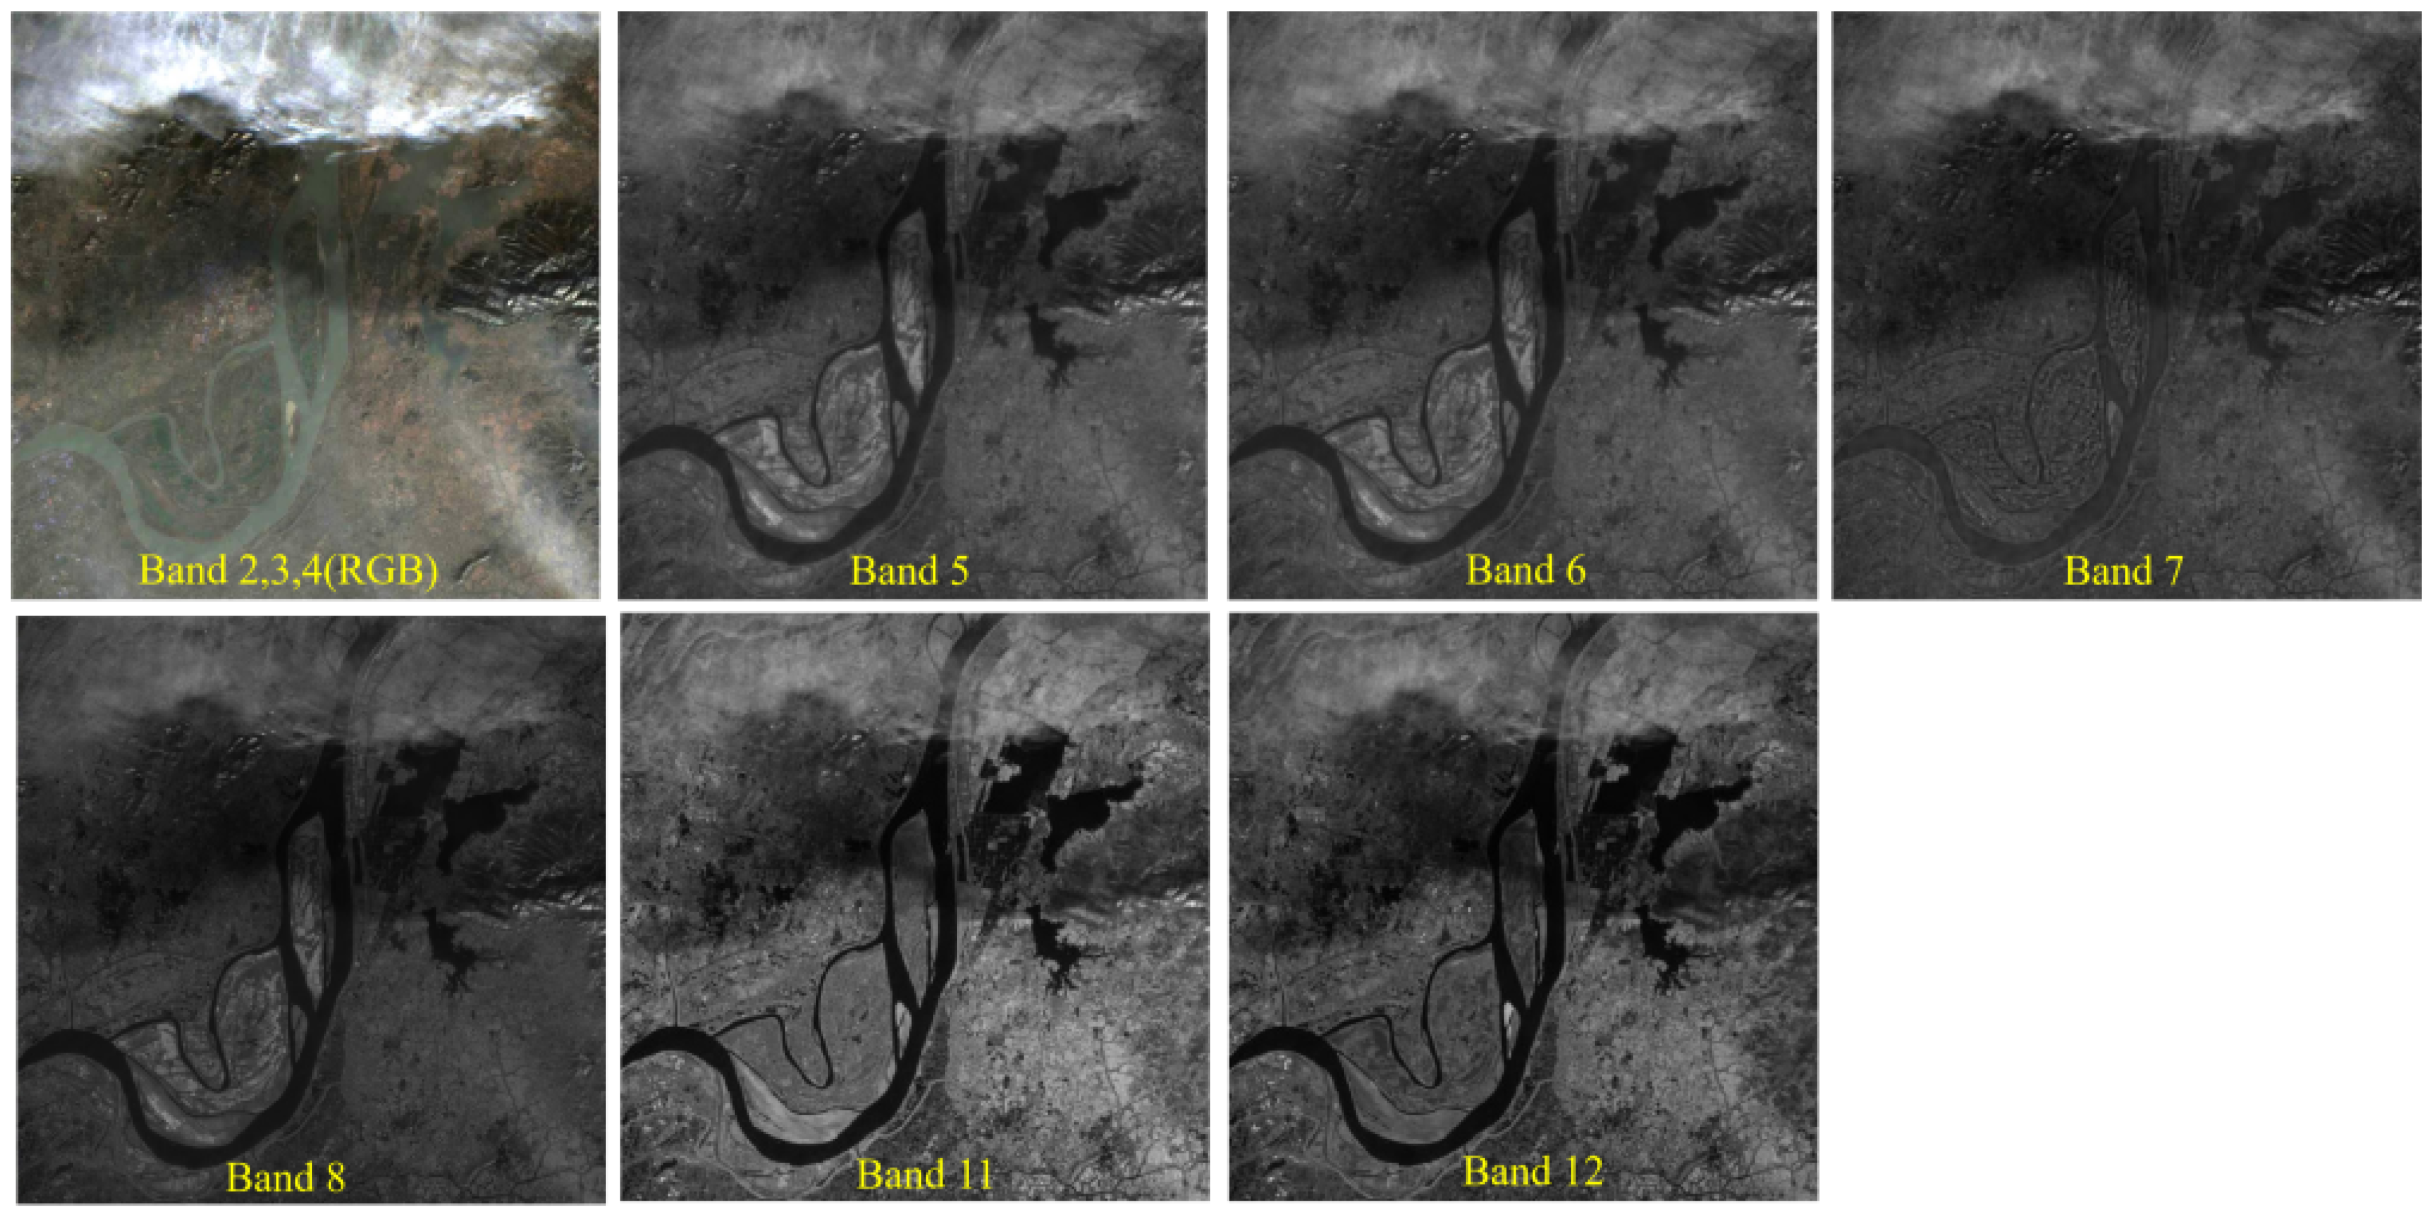
Some research uses end-to-end networks to directly explore the mapping relationship from hazy images to haze-free images and, finally, generate dehazed images [17,18,19,20]. This research obtained prominent dehazing effects. However, there are limitations. First, the dataset used in the dehazing models is usually less disturbed by haze, which is relatively uniformly distributed. In remote sensing images, the distribution of haze is often uneven, and thin clouds often exist, which makes the image more disturbed than the images studied in their research. Second, remote sensing images usually have more than three channels (RGB) as in ordinary natural images. For example, the images obtained by the Operational Land Imager (OLI) of landsat8 have nine bands. The images acquired by the Multispectral Imager (MSI) of Sentinel-2 have 13 bands. The bands beyond RGB also interfere with haze. Figure 1 shows an example of an image captured by Sentinel-2. It can be observed that the infrared bands, such as Band11 and Band12, have stronger penetrating power and are less impacted by haze.
Most of the previous dehazing methods cannot effectively remove non-uniformly distributed haze. They cannot deal with the impact on the bands beyond RGB as well. Inspired by the dehazing of natural images using convolutional neural networks (CNNs), some researchers apply CNNs to the dehazing of remote sensing images [21,22,23,24]. Meanwhile, the infrared bands and Synthetic Aperture Radar (SAR) microwave bands in multispectral remote sensing images can penetrate haze more easily compared to visible bands. They can better reserve the ground information in the area with haze. Therefore, some research uses infrared band images and SAR images as auxiliary information, which is used as input for CNNs to obtain dehazing models [25,26,27]. These methods can better handle the non-uniform distribution of haze. However, most of them focus on the RGB band or a few near-infrared bands, instead of the more abundant infrared bands. Furthermore, most of the training data are synthetic hazy images, which could be different from the actual hazy images with a lot more complexity.
To address these issues, we propose a multi-input attention network for the dehazing of a single multispectral remote sensing image. Since different bands in multispectral images have different features, we utilize the strong penetration capability of richer infrared bands and divide the multiple bands into three groups to extract features. Our proposed network consists of an encoder–decoder structure and uses head-to-tail connections and a multi-scale output structure, similar to the feature pyramid network. This structure enables the dehazing model to effectively remove haze while maintaining ground details. It can directly process bands of different resolutions. Furthermore, improved channel attention and spatial attention structure are added for extracting features from different inputs, which improves the efficiency and adaptability of training. In this research, we use real haze and haze-free multispectral remote sensing image pairs as datasets. Our dehazing model achieves very good results in restructuring a variety of cloud-contaminated multispectral images.
The main contributions of this study are as follows:
  • We propose a multi-input attention network to dehaze multispectral remote sensing images. This method does not require upsampling/downsampling on the training data. It can dehaze the images captured by Sentinel-2 with different resolutions in nine bands, effectively avoiding information loss due to upsampling/downsampling. To obtain the best recovery effect, the visible light band and the features of the infrared band are fused. It takes the advantage of the strong penetration capability of the infrared band.
  • We build an end-to-end dehazing network with an encoder–decoder structure, which directly obtains haze-free images from learning hazy images. To improve training efficiency, the structure of weighted multiplication and residual connection between different input lines are used to adjust the feature extraction.
  • We use skip connections and a multi-layer output structure in the network, which can produce multi-spectral dehazing images with different resolutions. Connecting the shallow part with the tail of the network preserves the ground details and allows the network to fully extract deep features. Meanwhile, adding an improved attention module to the connection part further improves feature extraction. Finally, the network can effectively remove the disturbances, including clouds and cloud shadows under non-uniform distribution.

2. Related Work

At present, the research on single-image dehazing falls into two categories: traditional methods and deep learning methods.

2.1. Traditional Dehazing Methods

Traditional methods can be further divided into methods based on image enhancement and methods based on atmospheric scattering models. Methods based on image enhancement restore hazy images by enhancing contrast [5,6] and suppressing low-frequency information [8,9]. Chaudhry et al. [28] combined mixed median filtering with Laplacian to dehaze images and apply it to remote sensing images. Huang et al. [29] combined the phase-consistency feature of remote sensing images with multi-scale retinex theory and used it to dehaze urban remote sensing images.
The method based on image enhancement is considered to be unstable in many cases because it lacks a foundation in physics. Therefore, the method based on the atmospheric scattering model eventually became the mainstream of traditional dehazing methods. ASM-based methods mainly use prior knowledge to estimate the parameters in Formula (1) and then obtain a haze-free image.
He et al. [12] proposed a dark channel prior (DCP) method through statistics and research on a large number of haze-free images. Studies have shown that in the non-sky area of the image without haze, there are always pixels with very low values close to 0 in the RGB bands. Therefore, the DCP-based dehazing method achieves outstanding dehazing effects and wide applicability. Many research efforts have been dedicated to the improvement of the DCP-based dehazing method. Zhu et al. [13] proposed a dehazing method based on the color decay prior. This method obtains the depth of field by modeling the relationship between scene depth and color, obtains the parameters through the supervised learning method to obtain the transmittance, and, finally, restores the hazy image effectively according to Formula (1).
Berman et. al. [30] proposed a global-based transmittance estimation method, which is different from the previous local-based transmittance estimation. The method estimates the transmittance and restores the image based on the prior knowledge that the color distribution of pixels in a hazy image will generate haze lines. The global-based estimation is more efficient and robust. Long et al. [31] refined the atmospheric veil through a low-pass filter and redefined the transmittance to reduce color distortion. The experimental results demonstrate well the preservation of ground details and effective dehazing of remote sensing images. Shen et al. [32] proposed a spatial–spectral adaptive dehazing method to effectively remove the haze effect from visible light remote sensing images. This method establishes the relationship between the image gradient and the transmittance between different wavelength bands.

2.2. Neural Networks

In recent years, increasing efforts have been dedicated to data-driven methods using deep learning. The end-to-end learning of deep neural networks can potentially solve many problems in traditional algorithms. Researchers first estimate the transmittance in the atmospheric scattering model of Equation (1) by building a neural network and then restore the hazy image according to the model.
Cai et al. [14] used a network based on multi-scale feature extraction to restore images according to the degradation model. It takes the hazy image as input and outputs the transmittance map. Ren et al. [15] used a coarse-scale network that took the hazy image as an input to estimate the rough transmittance map, then fed into the fine-scale network to obtain an optimized transmittance map, and finally obtained a more refined dehazing image. Li et al. [16] took the transmittance and atmospheric light in Equation (1) as one variable and used a neural network to estimate it. Different from the previous estimation of atmospheric light by experience, this method uses the learning ability of the network to perform the estimation. Neural networks demonstrate powerful feature extraction capability, which greatly advocates the research on end-to-end direct dehazing networks.
Chen et al. [18] proposed an end-to-end gated context aggregation network to improve the finesse of dehazing results. It combines smooth hole convolution and multi-level feature fusion techniques. Liu et al. [19] proposed an attention-based grid dehazing network (GridDehazeNet), adding a densely connected grid network to effectively alleviate the bottleneck problem of traditional multi-scale networks. The attention module enables the network to better estimate model parameters. In [20], a Domain Adaptation framework was proposed. It employs a bidirectional transformer network to bridge the gap between synthetic and real domains by transforming images from one domain to another. This method effectively reduces the gap between the synthetic hazy image and the real hazy image. In [23], a spatial attention-based adversarial generative network was proposed to dehaze remote sensing images. The model is separately trained based on haze and small-scale cloud, and, finally, effectively removes both interferences. In [15], SkyGAN was proposed for haze removal in aerial images. The network reconstructs multispectral data from RGB bands in aerial images and then uses a conditional generative network to train these reconstructed data. This method can effectively expand multispectral datasets.
Overall, there are many issues in applying the natural image dehazing methods to remote sensing images. Most research on the dehazing of remote sensing images focuses on the visible light band. The recovery from hazy images is also limited. In this paper, we propose a multi-input multi-spectral remote sensing image dehazing network. It can effectively remove haze in multi-spectral remote sensing images.

3. Materials and Methods

3.1. Dataset

For natural image dehazing, there are some datasets for training the dehazing network models, for example, FRIDA [33], Hazy Cityscapes datasets [34], D-Hazy [35] and RESIDE [36]. The RESIDE dataset includes a large amount of indoor and outdoor clear images and synthetic hazy images. It has been widely accepted as a benchmark dataset for natural image dehazing research in recent years. Due to the huge difference between remote sensing images and natural images, these datasets cannot be directly applied to dehazing remote sensing images. At present, datasets for remote sensing image dehazing mainly include the haze detection and removal dataset [37], Haze1K [27] and RICE [38]. These datasets include some non-uniform haze but are limited to the visible light band and have no multispectral data. In this research, we build our dataset by collecting Sentinel-2 images from January 2021 to January 2022, from 112° E, 36° N in central China to 120° E and 29° N in eastern China. The band information of Sentinel-2 is shown in Table 1.
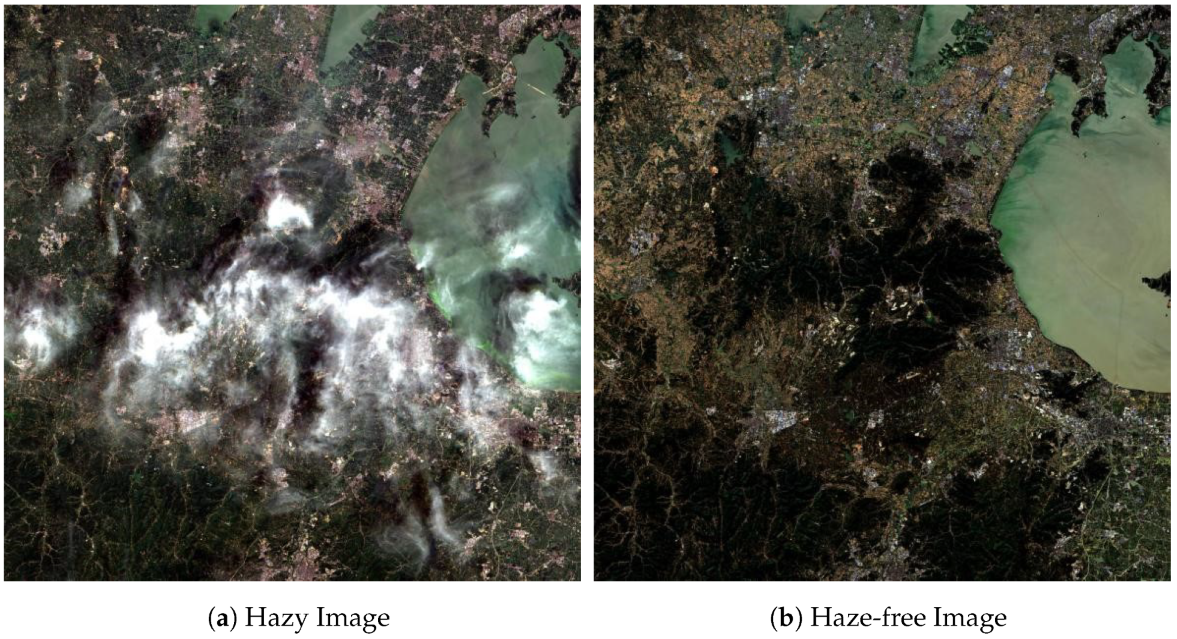
We chose 9 bands of 10 m and 20 m, which are commonly used in earth observation, including Band 2, Band 3, Band 4, Band 5, Band 6, Band 7, Band 8, Band 11 and Band 12 for research. We also selected 30 sets of hazy and haze-free image pairs as experimental data. Figure 2 shows an example of those image pairs.
The image size of 10 m resolution images is 10,980 × 10,980, while the image size of 20 m resolution is 5490 × 5490 . We first chose the hazy areas of the collected images and the corresponding areas of the haze-free images. We then resized the image size of the 10 m resolution training data to be 1024 × 1024 and resized the 20 m resolution training data to be 512 × 512 . The selected area was randomly cropped. We finally obtained 1500 sets of 9-band hazy and haze-free data pairs as the training data set for this research.

3.2. Network Architecture

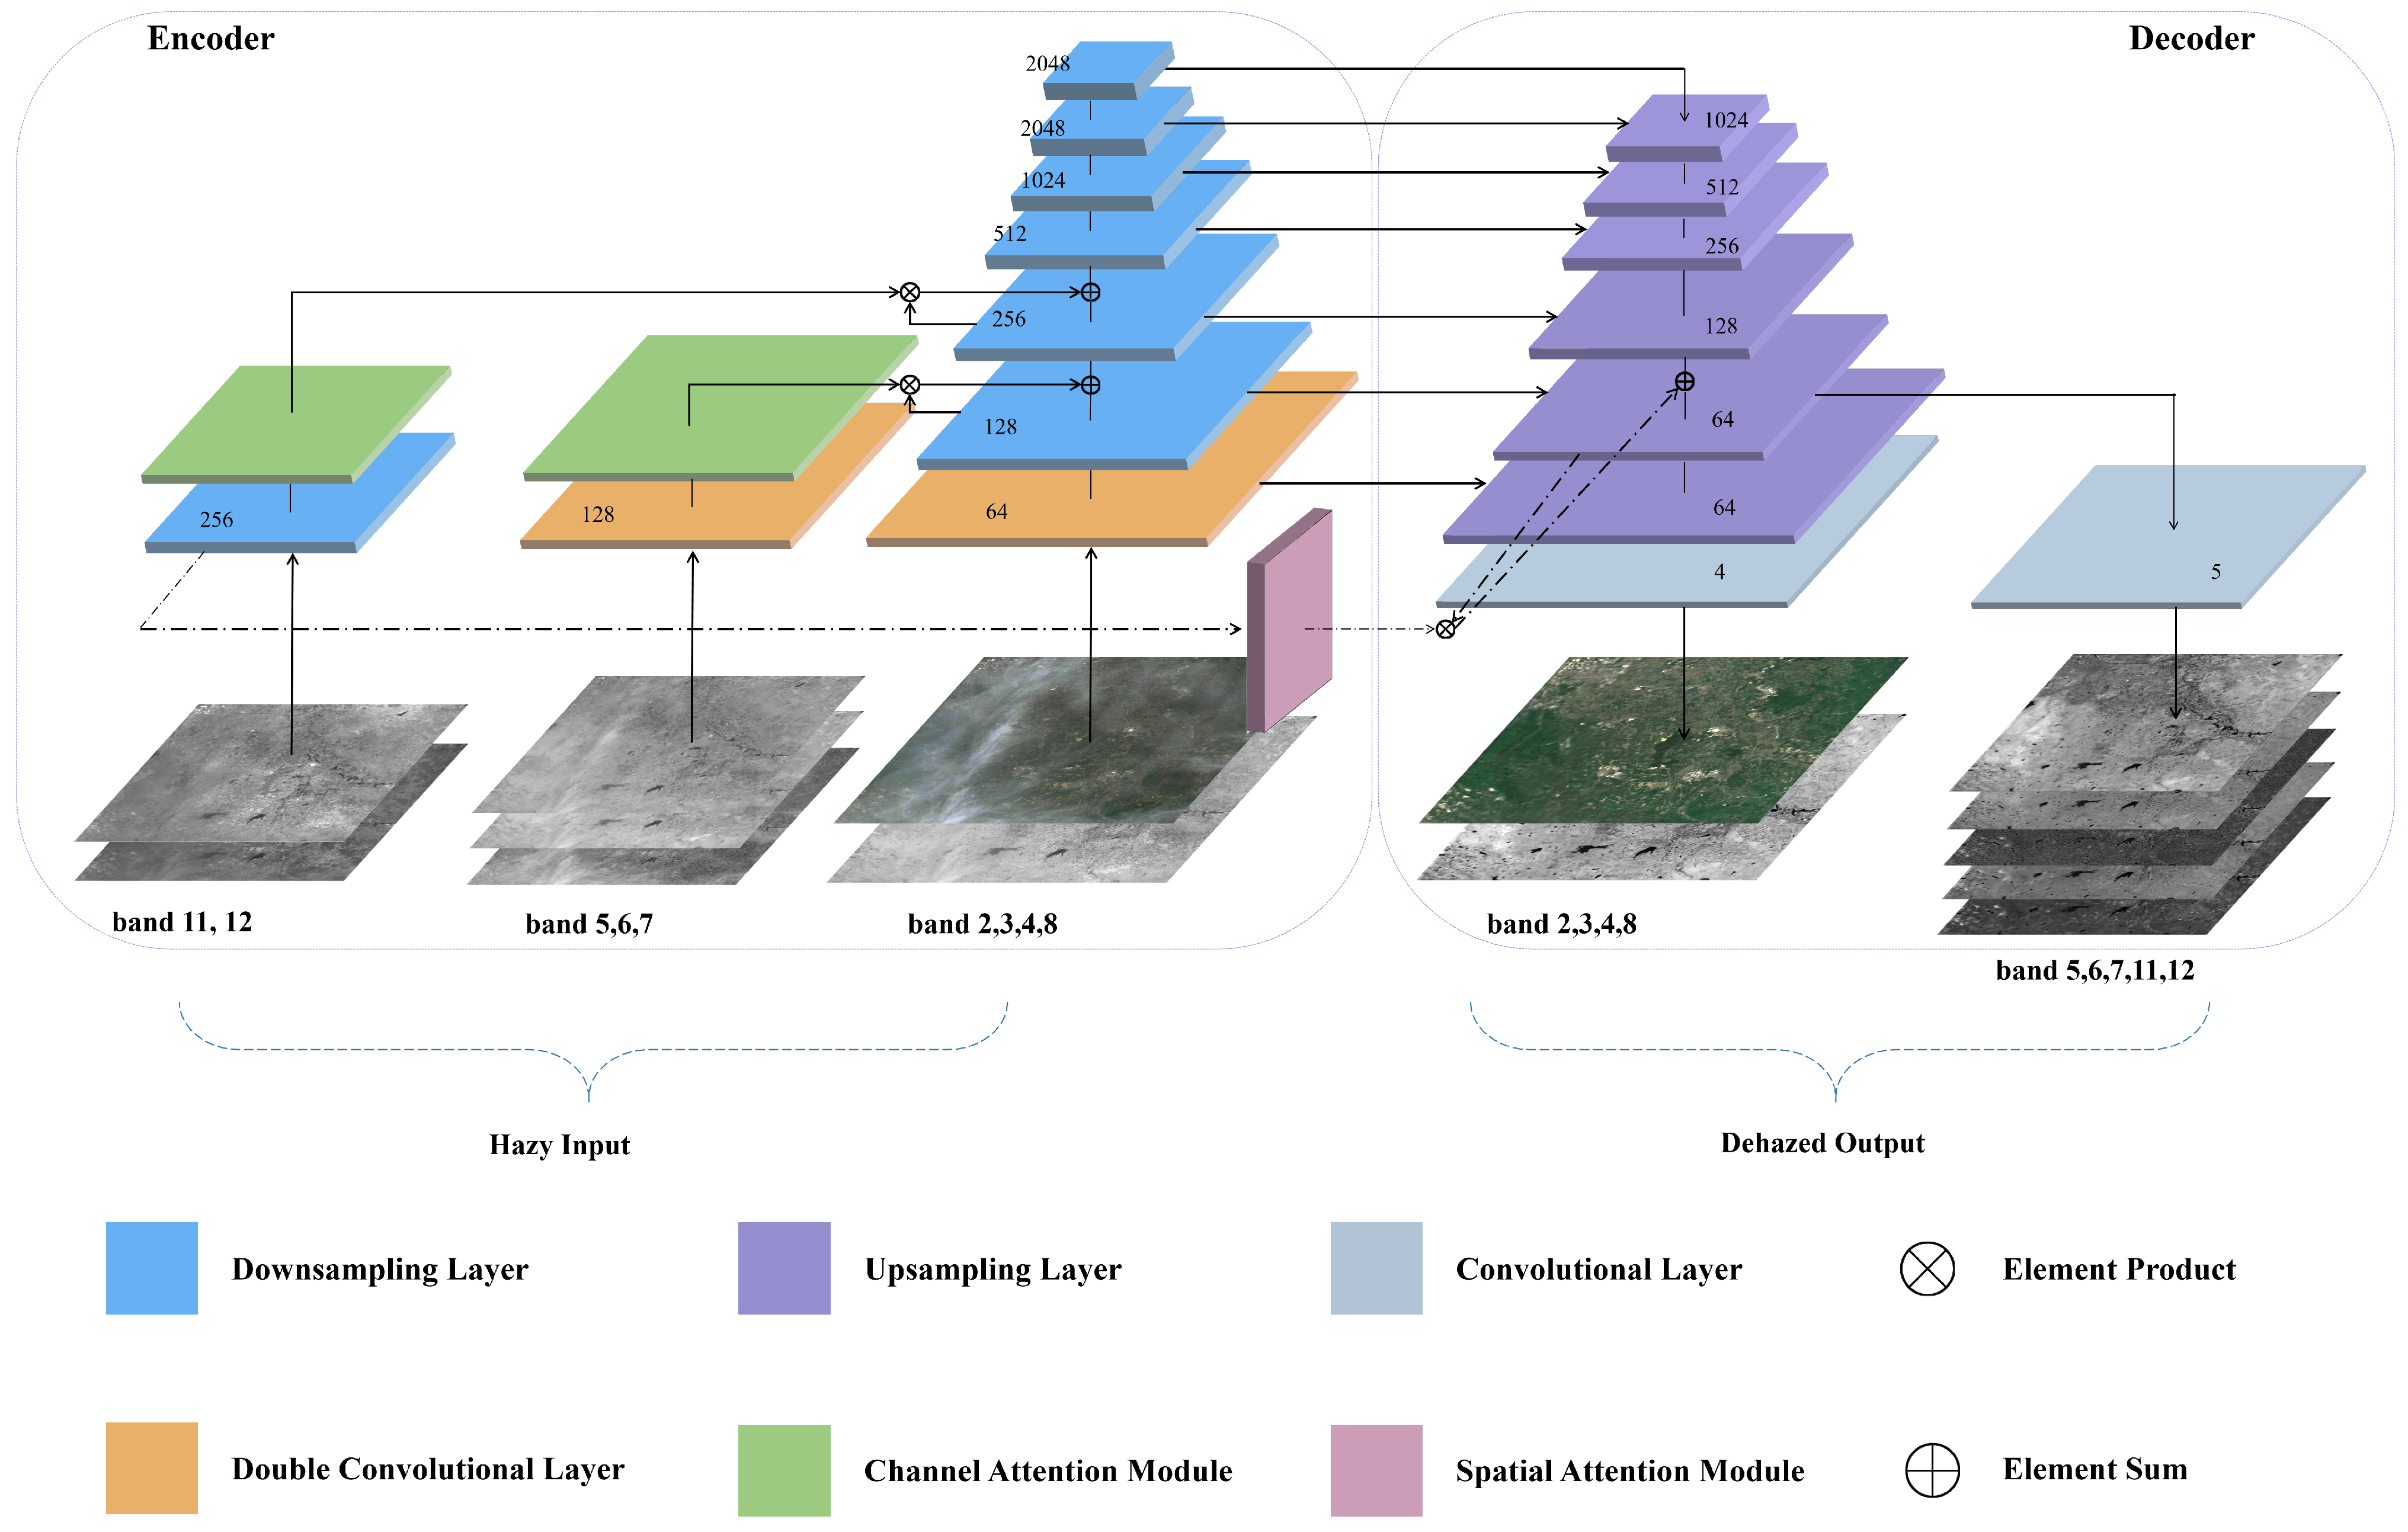
Figure 3 shows the network architecture in this paper. Inspired by U-Net [39] and Feature Pyramid [40], we designed a multi-input network based on an encoder–decoder structure. It takes multi-spectral remote sensing images of two resolutions as the input and outputs the corresponding haze-free image.

3.2.1. Encoder

As shown in Figure 3, the encoder consists of three inputs, two double convolution layers, two channel attention modules and seven downsampling layers. The numbers in the figure are the number of channels after the feature map passes through the network layer.
On the input side, the 9 bands with different features are categorized into three parts as the input to the network. The visible light bands (Band 2, Band 3 and Band 4) with a resolution of 10 m and the near-infrared band (Band 8) have richer ground detail information. They are the main parts for feature extraction. All other five bands have a resolution of 20 m. The ground detail information in clear cases is relatively poor.
Band 5, Band 6 and Band 7 are Red Edge bands, which are mainly used to observe the mutation properties of vegetation reflectance in remote sensing applications. From Table 1, it can be observed that the wavelengths of Band 5, Band 6 and Band 7 have a small difference from the wavelengths of Band 8, as well as a small difference in the penetrating capability. Therefore, the features extracted from Band 5, Band 6 and Band 7 are fused with the shallow features of the main network to standardize and correct the features extracted by the main network.
Band 11 and Band 12 have relatively longer wavelengths and stronger penetration power (as shown in Figure 1). The features extracted from Band 11 and Band 12 are fused with the deeper downsampling features. Meanwhile, the features extracted from Band 11 and Band 12 are fused with the features of the upsampling stage in the decoder. The feature extracted from the infrared band (less interfered with haze), together with the learning of deep high-order features and the learning of shallow spatial detail features, make the final restored results closer to the real situation.
For feature extraction, the double convolution network group is used for initial feature extraction for the input image. As illustrated in Figure 4a, it includes two sets of 3 × 3 convolutions. The double convolution layer can be formulated as Formula (2)
F c = δ ( B N ( C o n v ( δ ( B N ( C o n v ( F i ) ) ) ) ) )
where F i is the input image data or feature map. F c is the feature map after feature extraction from double convolution. C o n v and B N are 3 × 3 convolution and Batch Normalization. δ is the Leaky ReLU function. In the downsampling module, as shown in Figure 4b, the input features are subjected to maximum pooling of stride = 2. Then, downsampling and feature extraction are implemented through the double convolutional network.

3.2.2. Decoder

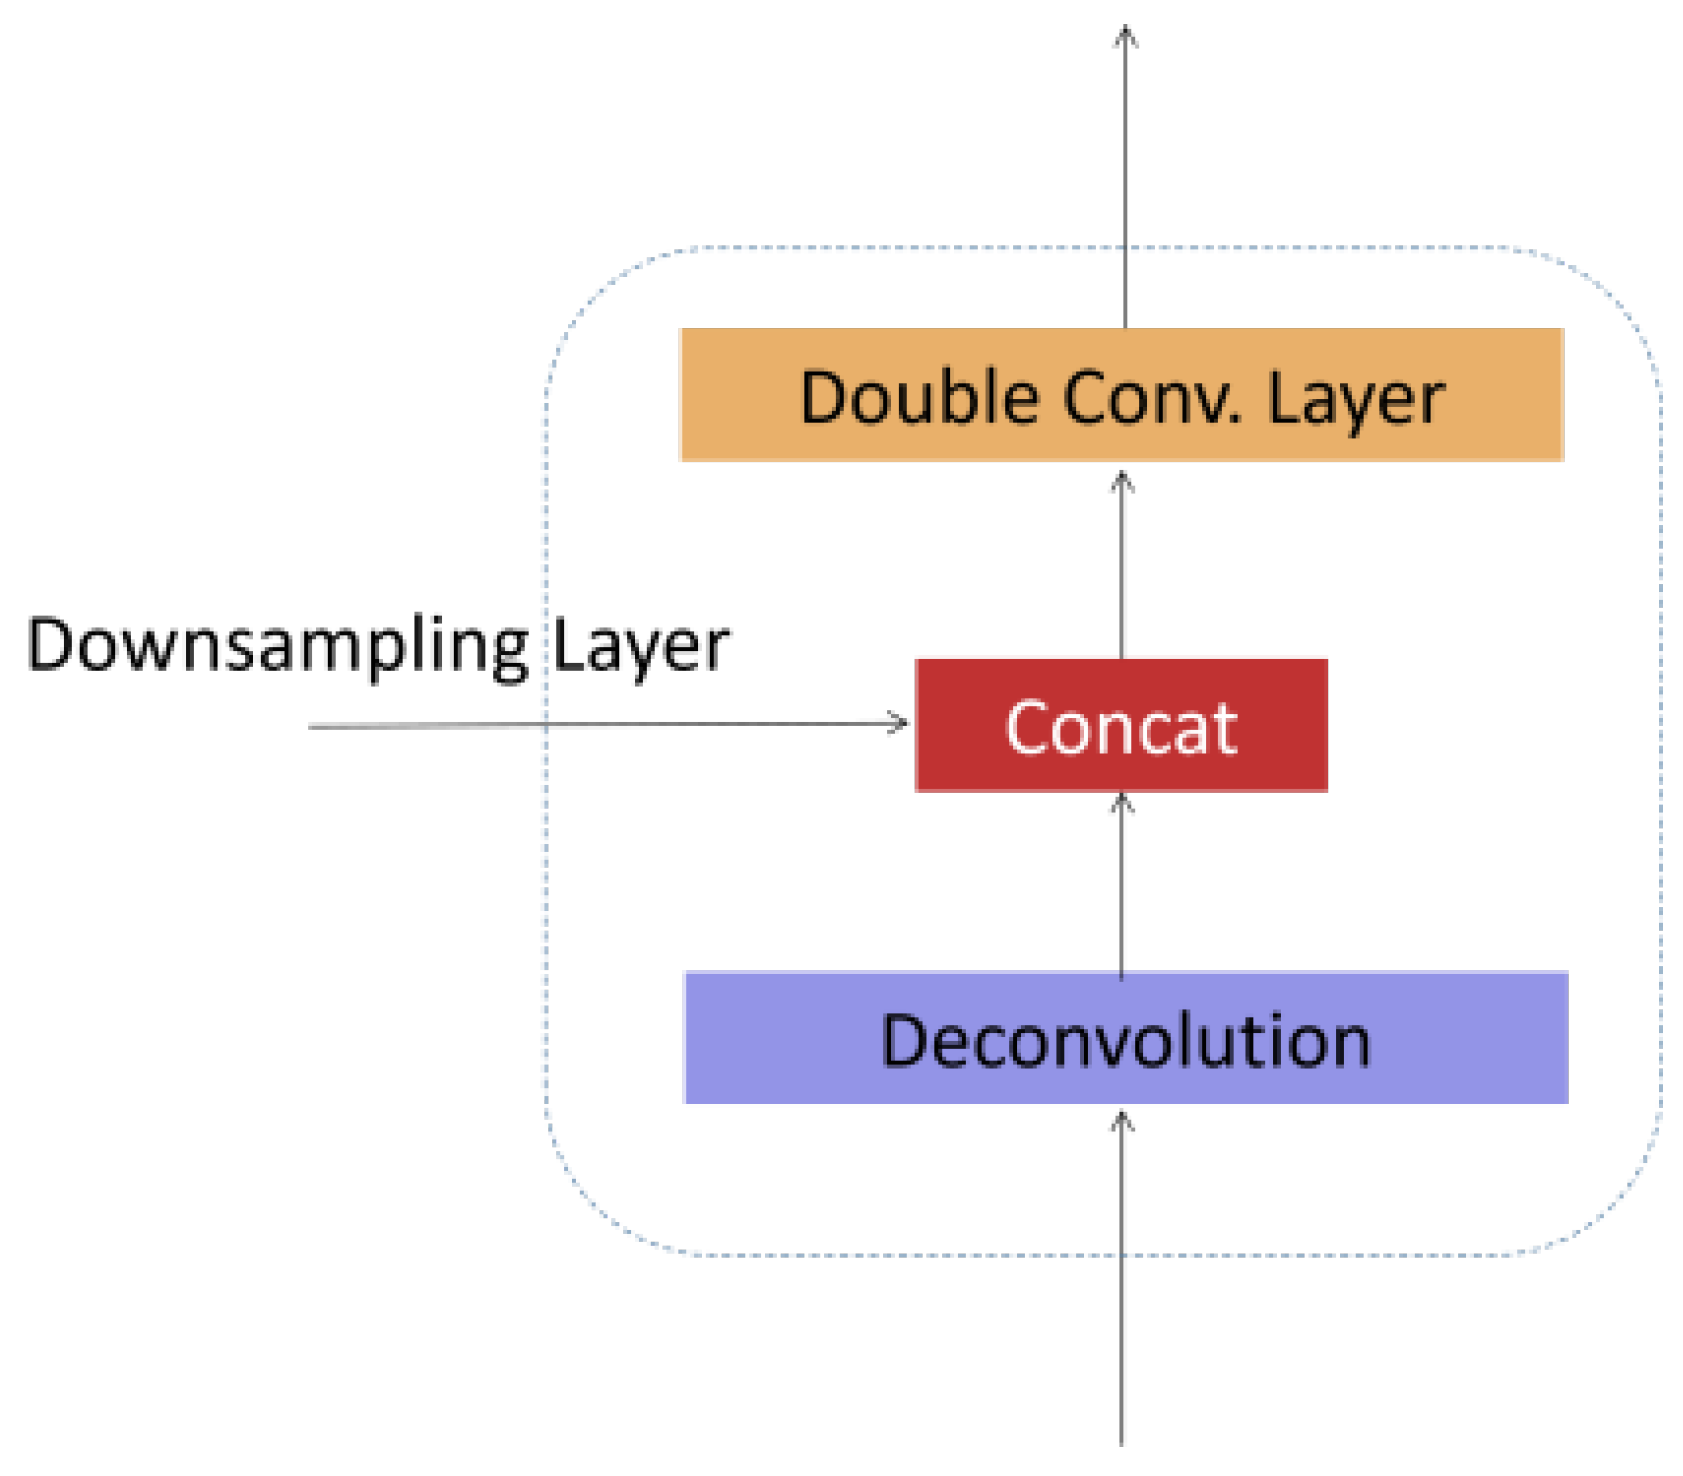
The decoder consists of six upsampling layers, one spatial attention layer, two convolutional layers and an output. The decoder upsamples high-level features from the encoder and finally restores the image to a dehazed image. It uses different upsampling layers to output a multi-band image with the same two resolutions as the input. Figure 5 explains the structure of the upsampling layer. It starts with the upsampling of the upper layer features by Deconvolution with scale = 2, which, next, will be concatenated with the same-size downsampling feature map. After that, the double convolutional layer will restore the channel layer by layer. The “Concat” operation on the upsampling feature and downsampling feature enriches the information in the network, which contains both detailed information in shallow feature maps and the haze feature information in deep feature maps.

3.2.3. Attention Module

Inspired by the attention mechanisms widely applied in the field of image vision [41,42], we introduce the attention module in the feature extraction of the input data. The attention module can reinforce the focusing capability of the model. It enables the system to emphasize important information and suppress relatively irrelevant information so that the system can effectively extract non-uniform haze features. For the feature maps of Band 11 and Band 12 after Double Convolutional Layer and Band 5, Band 6 and Band 7 after the Downsampling Layer, the attention module infers the attention of the image along two independent dimensions of channel and space in turn. Then, the attention map is multiplied with the feature map after Downsampling and Upsampling in the backbone network, which is then fused with the feature map of the backbone network. The process is formulated in Formula (3).
F * = μ m ( A i F ) + F
where A i is the attention map generated after different attention modules. F is the feature map of the backbone network with size C × H × W . F * is the output feature map after the fusion with the attention modules, and μ m is the correction coefficient. Different bands impact the final haze removal in different ways. Therefore, different bands have different correction coefficients for feature fusion. The feature extraction correction coefficient for Band 11 and Band 12 is μ m = 0.5 , while the correction coefficient for Band 5, Band 6 and Band 7 is μ m = 0.3 .
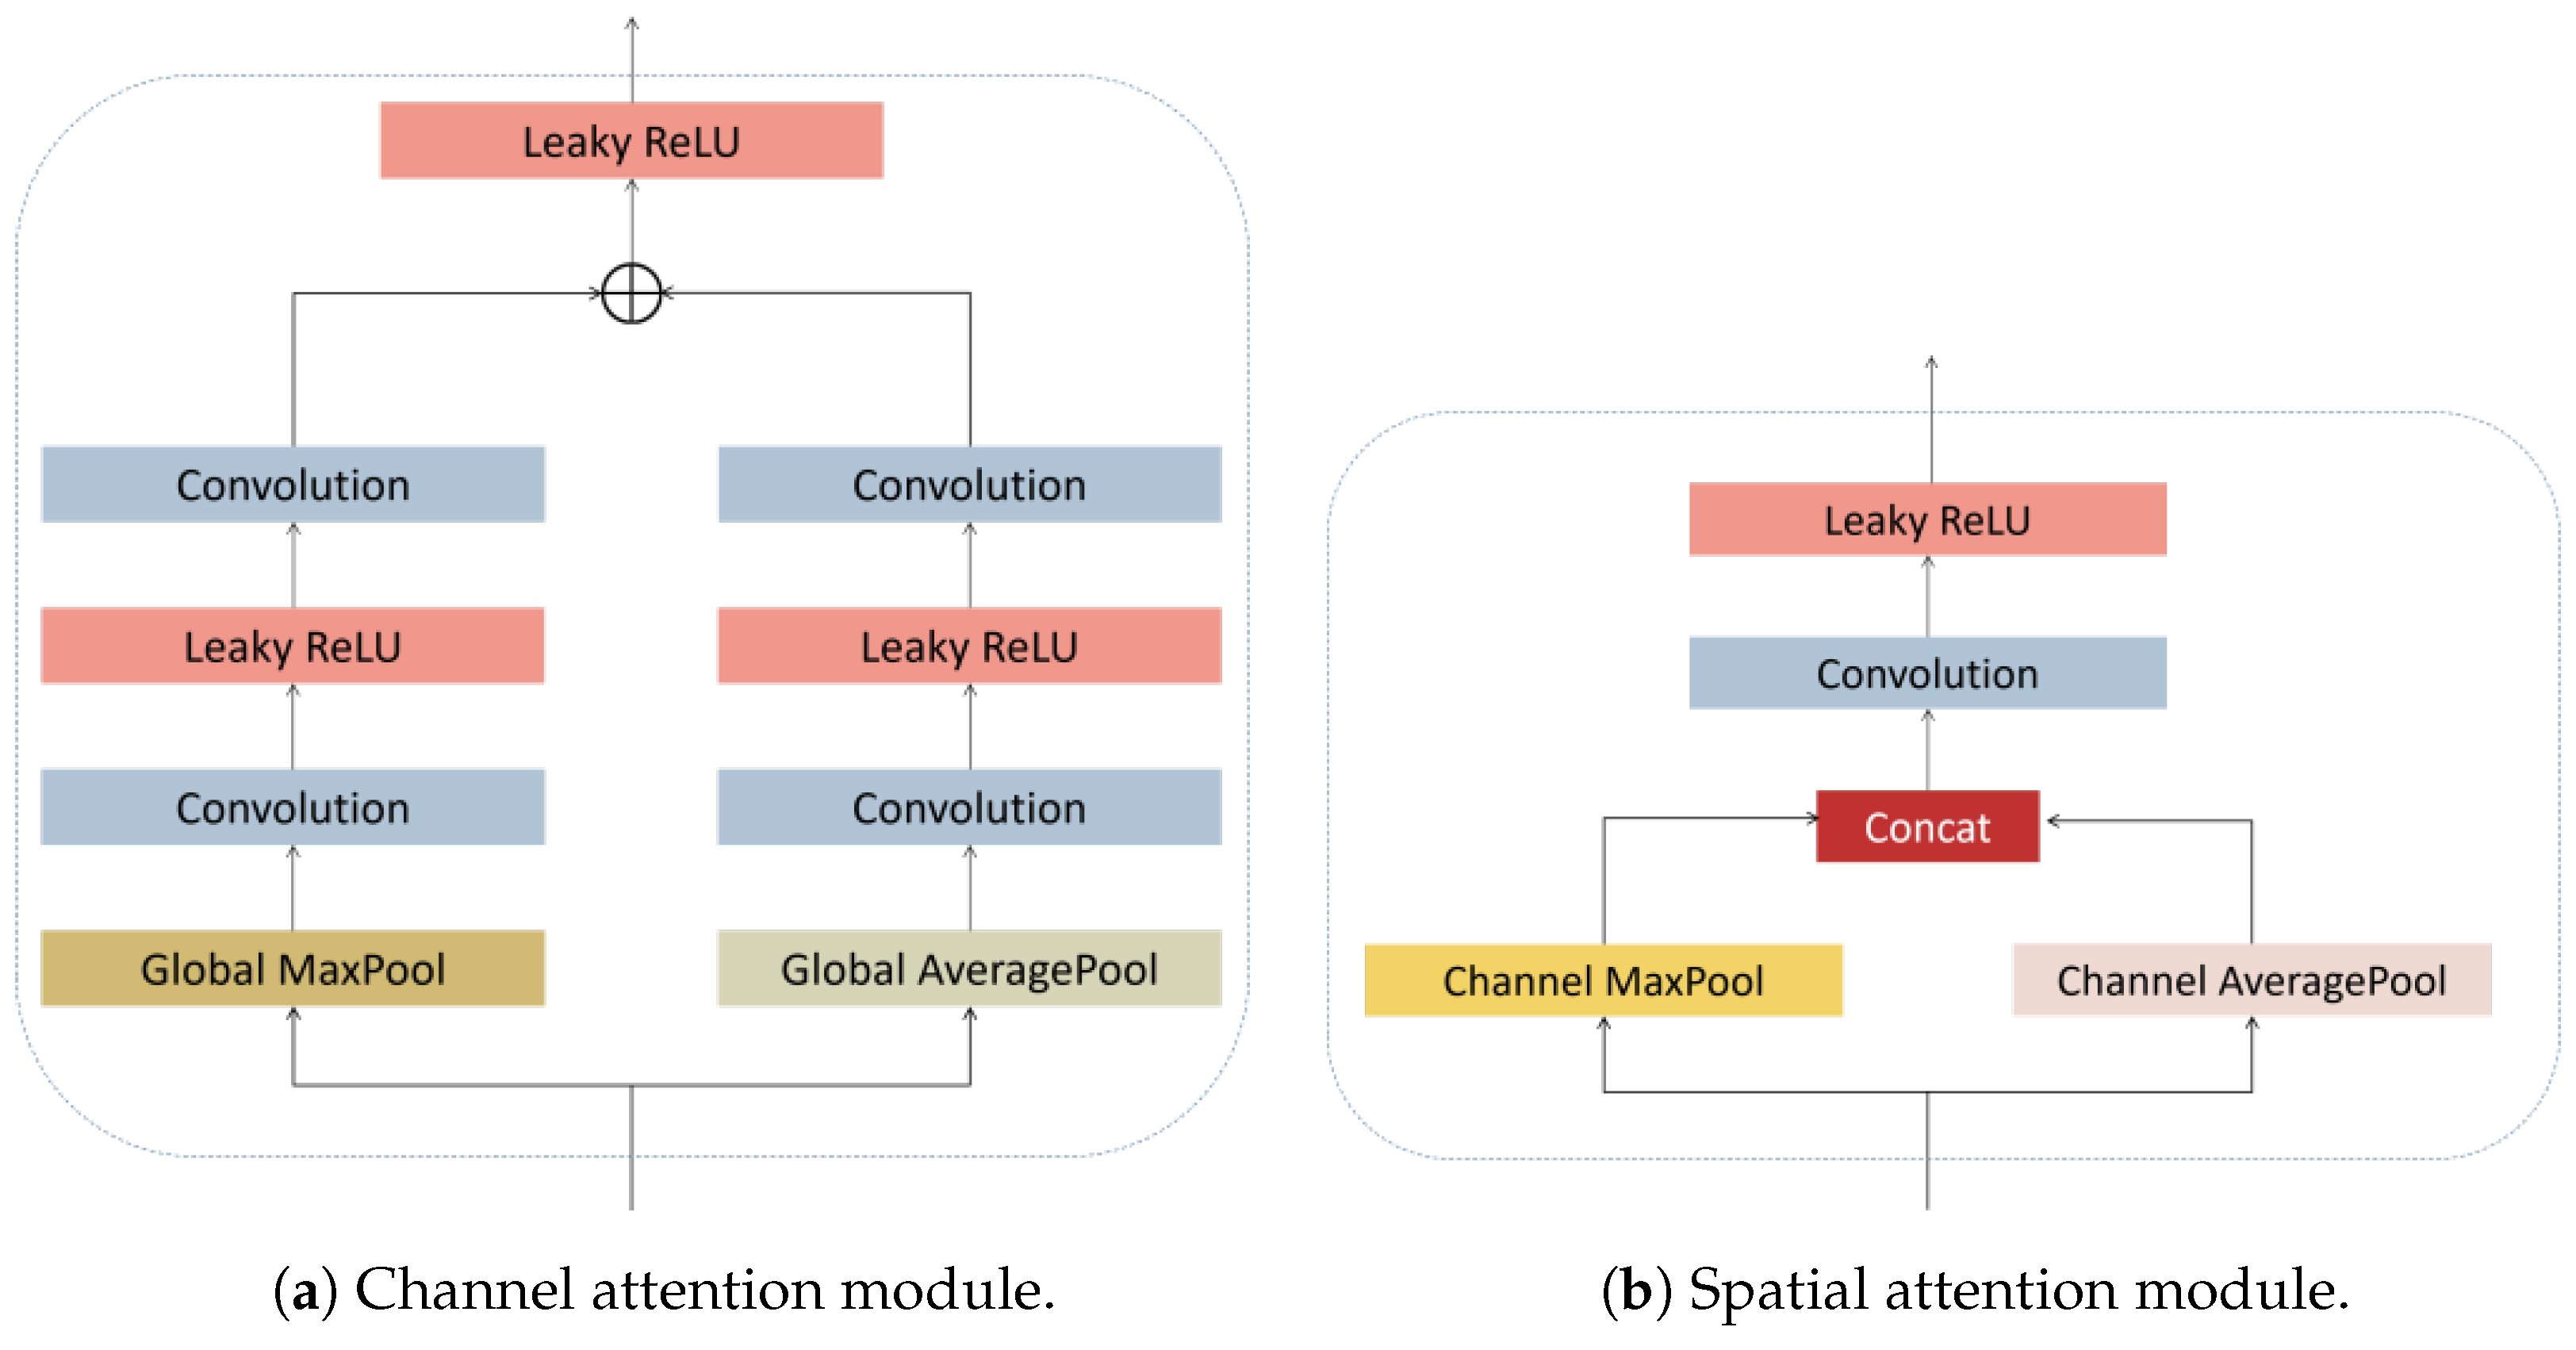
The channel attention module generates channel attention maps using the channel relationship between features. Each feature map is achieved by a feature detector, which focuses on meaningful features. The structure of the channel attention module is shown in Figure 6a. Global max pooling and global average pooling are used to compress the spatial dimension of feature maps. The global max pooling and global average pooling can be expressed by Formulas (4) and (5).
g m = H m p ( F C ) = max ( i , j ) X C X C ( i , j )
g a = H a p ( F C ) 1 H × W i = 1 H j = 1 W X C ( i , j )
H m p and H a p perform global max pooling and global average pooling for input feature map F C of size H × W . X C ( i , j ) is the value of channel C at ( i , j ) . The size of the feature maps after compression is C × 1 × 1 . Since the feature map contains rich information, we chose Leaky ReLU as the activation function instead of Sigmoid, which is widely used in the attention structure to suppress gradient vanishing. The process of channel attention module is formulated in Formula (6).
A C = δ ( C o n v ( δ ( C o n v ( g m ) ) ) + C o n v ( δ ( C o n v ( g a ) ) ) )
where A C is the channel weight of the output. δ is Leaky ReLU function, and Conv is 1 × 1 convolution.
The spatial attention module generates the spatial attention feature map by using the internal spatial relationship between features. It focuses on different spatial information within a feature map. The structure of the spatial attention module is shown in Figure 6b. In the channel dimension, MaxPool and AveragePool are used to aggregate the channel information of the feature map. The processes of MaxPool and AveragePool are formulated in Formulas (7) and (8).
F m a x = max C X ( i , j )
F a v g = a v g C X ( i , j )
After obtaining the maximum and average values of each pixel of the input feature map X ( i , j ) on the C channels, two cross-channel feature maps of size 1 × H × W ( F m a x and F a v g ) are generated. Finally, they are concatenated through a convolutional layer into a 2D spatial attention feature map output. The process of spatial attention module is formulated in Formula (9).
A S = δ ( C o n v ( [ M a x P o o l ( F S ) ; A v g P o o l ( F S ) ] ) )
where A S is the spatial weight of the output. δ is Leaky ReLU function, and Conv is 7 × 7 convolution.

3.3. Loss Function

In this research, there are many parameters of the haze restoration network model. We chose the loss L 2 to effectively train the network. The loss L 2 is the mean square loss, which has a relatively stable solution and can converge more effectively. Formula (10) explains the calculation.
L 2 = 1 N x = 1 N i ( J i ^ ( x ) J i ( x ) ) 2 , ( i = 2 , 3 , 4 , 5 , 6 , 7 , 8 , 11 , 12 )
J i ^ ( x ) and J i ( x ) represent the dehazing image and the real haze-free image, respectively, i represents the band and N represents the number of image pixels.

4. Experiment and Results

4.1. Model Training

Our experiments were performed on PyTorch. The training of the model was conducted on NVIDIA A100 GPU. The batch size was 4 and ADAMW was the optimizer for model training, where the range of betas was set to be (0.5, 0.999). The initial learning rate of the model was 0.0001. At the same time, CosineAnnealingLR with T m a x = 60 and e t a m i n = 1 × 10 7 were used to adjust the learning rate. During training, 80% of the dataset was used as the training set and 20% as the test set. In addition, we took the two sets of haze and haze-free Sentinel II images outside the data set and used them to produce 150 data pairs as a validation set using the approach in Section 3.1.
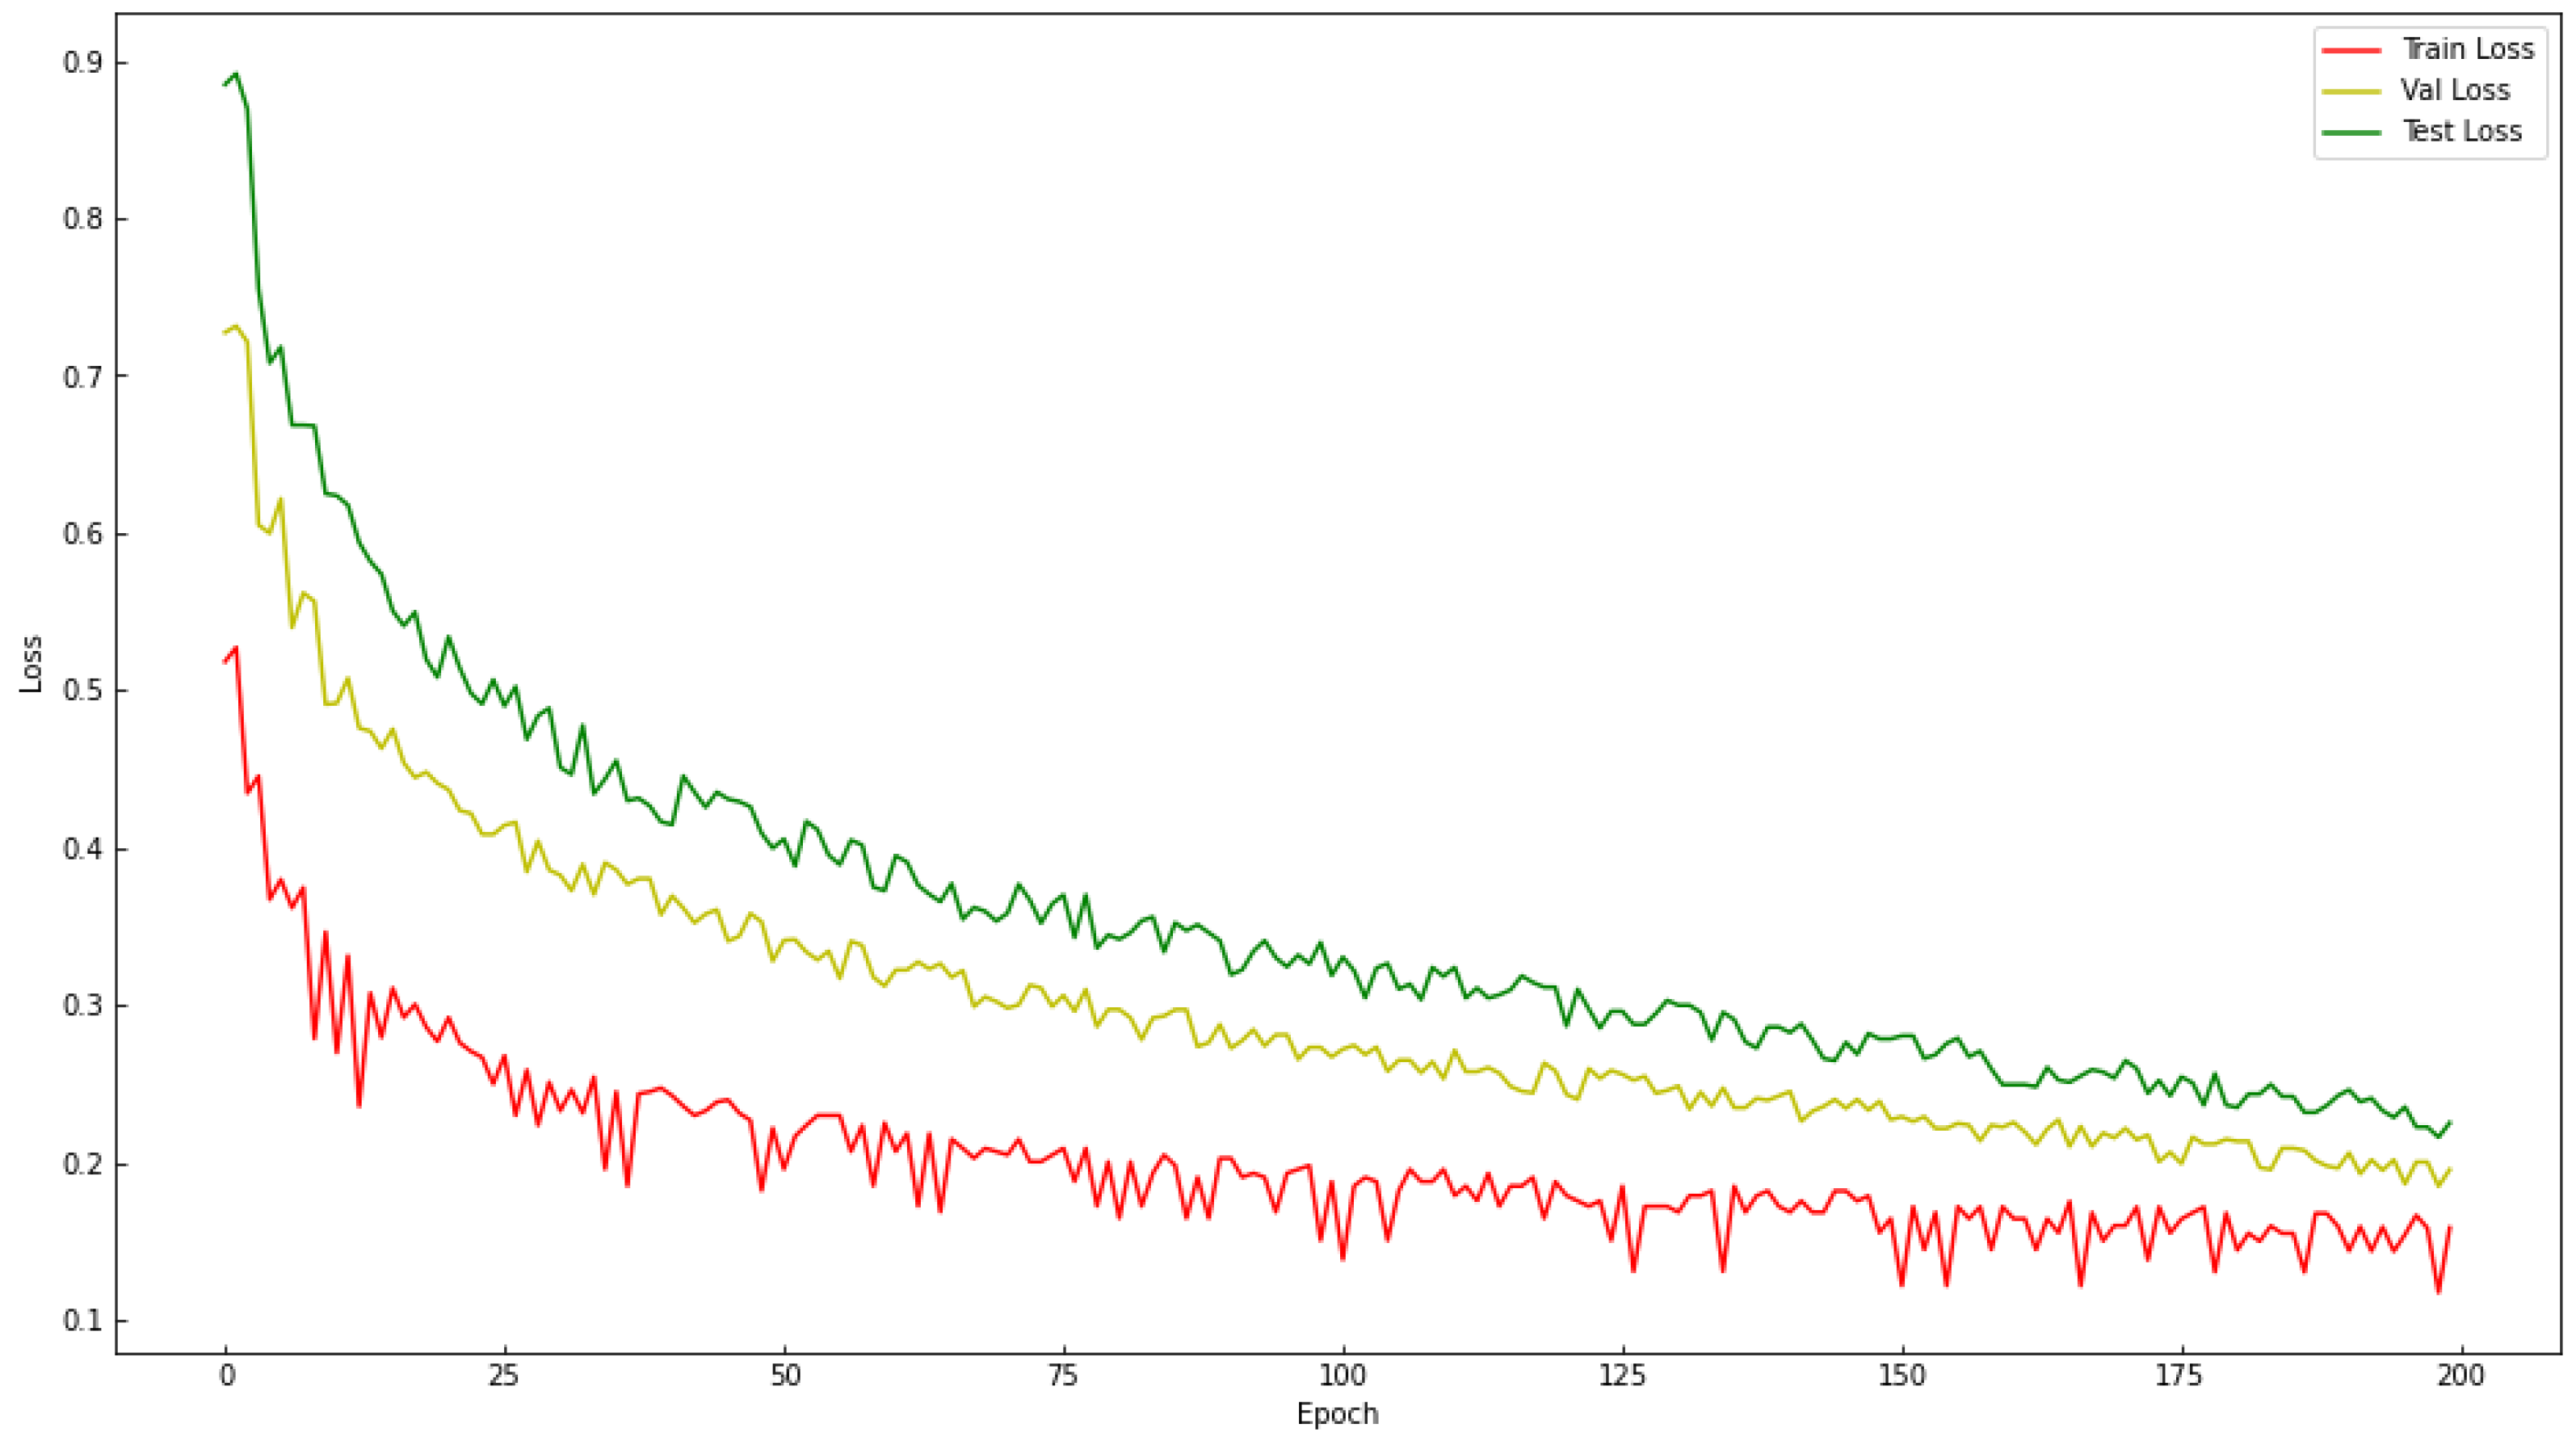
Training was performed for a total of 200 Epochs, and the model preservation rule was to preserve only the best model of the validation set results. The loss was recorded during training, as shown in Figure 7. It can be seen that after 200 epochs of training, the loss curve tends to a lower and flatter value, and the training curve of the training set is clearly split from the validation set and the test set, indicating that the model has been adequately trained.

4.2. Metrics

We used peak signal-to-noise ratio (PSNR), structural similarity (SSIM) and feature similarity (FSIM) as the metrics to evaluate the performance of our models. PSNR is commonly used in image fusion tasks. It measures the ratio between the effective information of the image and the noise, which can reflect whether the image is distorted. The larger the value, the better the quality of the final dehazed image. SSIM describes structural similarity. The closer it is to 1, the higher the similarity with the haze-free image, which indicates a better dehazing effect. FSIM is a variant of SSIM that uses phase coherence to focus more on the contribution of different local features to the overall structure of the image. Still, the closer the value is to 1, the higher the similarity is.

4.3. Experimental Results

In this section, we apply the dehazing model to the hazy multispectral images captured by Sentinel-2. We also compare our model with the traditional method DCP [12] and four neural network methods, DehazeNet [14], AOD-Net [16], GridDehazeNet [19] and MSBDN [43]. For each hazy image used in the experiment, the corresponding clear sky image within a week was collected and used as the haze-free image for reference.
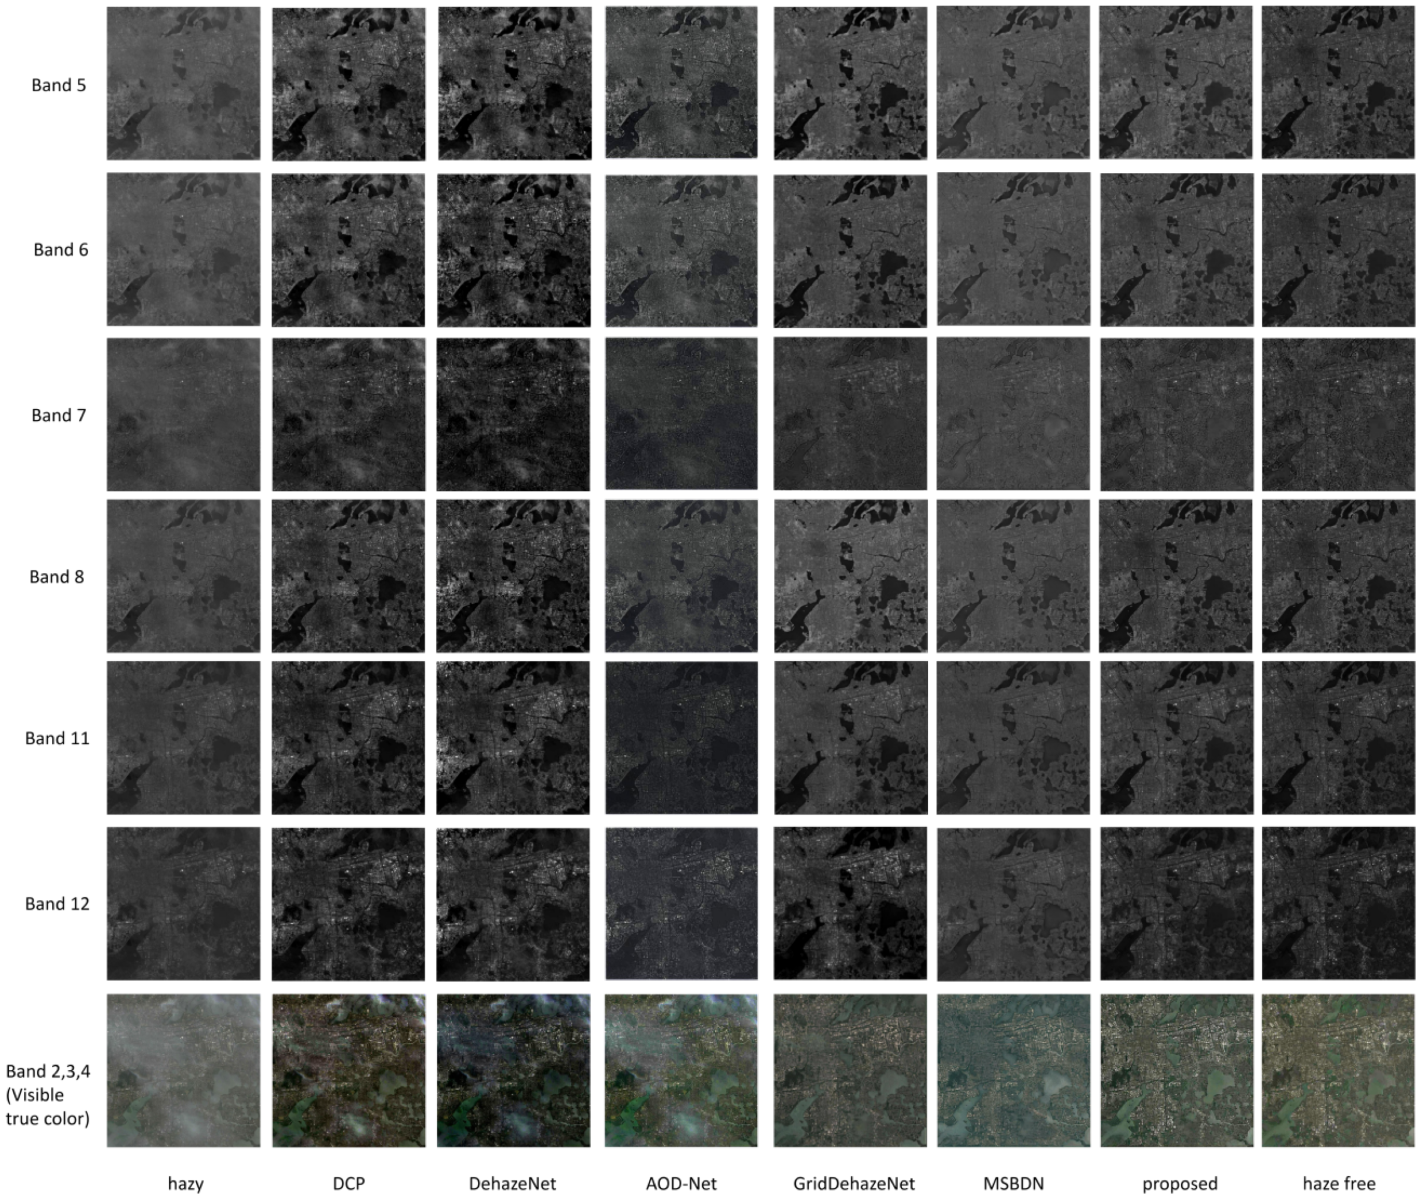
Figure 8 demonstrates the dehazing results of nine bands. It can be observed that the visible light as well as Band 5, Band 6 and Band 7 have highly interfered with haze. The restoration results of DCP, DehazeNet and AOD-Net have haze residues. GridDehazeNet, MSBDN and our proposed method have no haze residue after dehazing. MSBDN has a certain color distortion. Infrared bands (Band 8, Band 11 and Band 12) are less interfered with haze. All of the methods achieve great recovery effects visually. For the visible light bands, the most interfered bands, the dehazing effect of DCP, DehazeNet and AOD-Net is relatively poor. MSBDN has a certain color distortion, while GridDehazeNet and our proposed method have better fidelity.
Table 2, Table 3 and Table 4 demonstrate the performance evaluation using PSNR, SSIM and FSIM. It can be observed that the results are basically consistent with the visual effects. Meanwhile, our proposed method significantly outperforms GridDehazeNet and MSBDN, which have better dehazing effects. It indicates that the method in this paper can better maintain ground details and color fidelity.
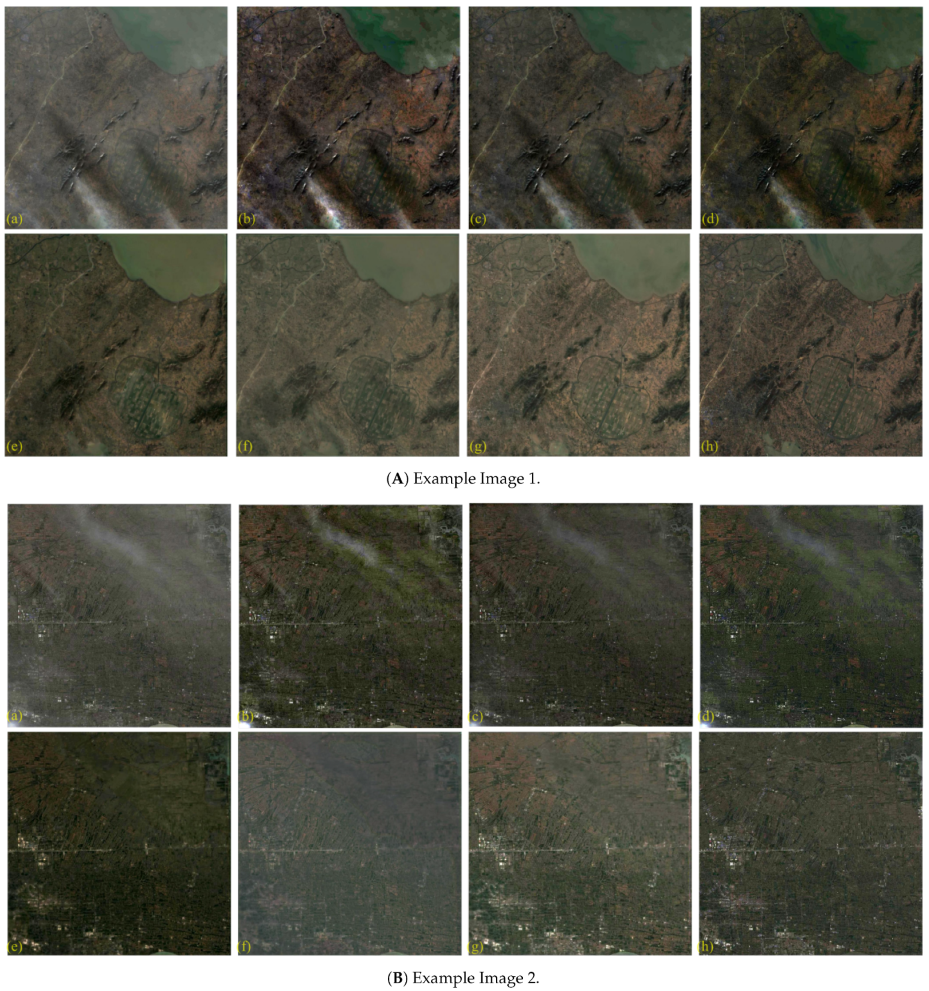
In this study, we conducted dehazing experiments on different cases of hazy images. Figure 9 shows the case of slightly hazy images. The results are the dehazing of visible true colors (Band 2, Band 3 and Band 4). It can be observed that haze is unevenly distributed, while haze shadows also exist in Figure 9A(a). The traditional method DCP works effectively in the area with a uniform haze distribution but not in the non-uniform part nor the haze shadow area. DehazeNet and AOD-NET also have the same problem with DCP. GridDehazeNet and MSBDN can effectively remove the haze effect, but MSBDN has a certain color distortion after restoration. Compared with these two methods, our proposed method shows outstanding performance in maintaining color and ground details.
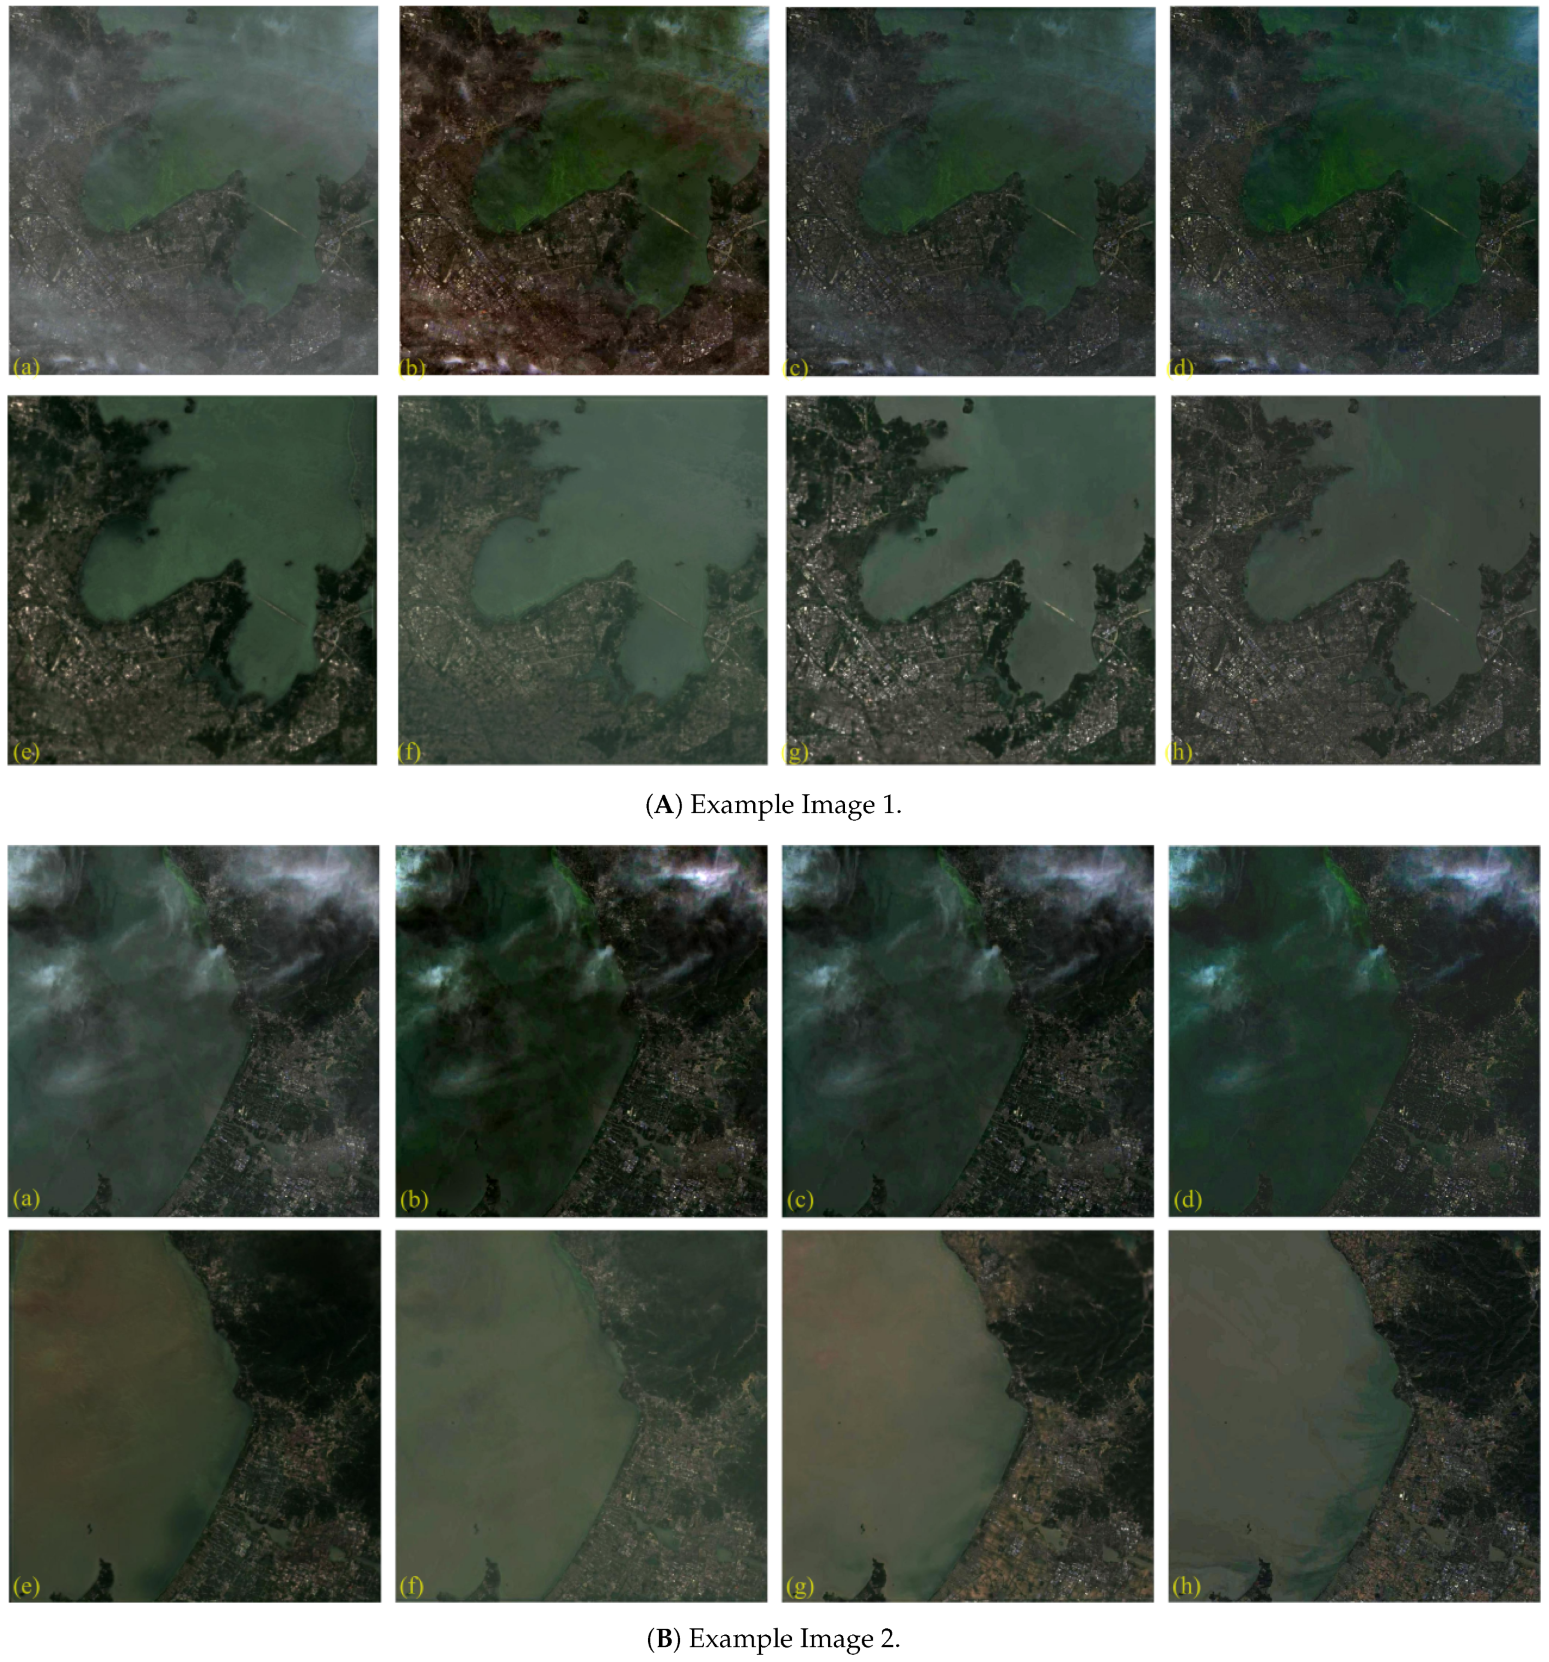
Figure 10 shows the visible true color dehazing result for an image with moderate haze interference. It can be observed that the results are similar to Figure 8. GridDehazeNet and MSBDN have removed haze, but they have also lost ground details to a certain extent. The method we propose maintains the ground details in a better way.
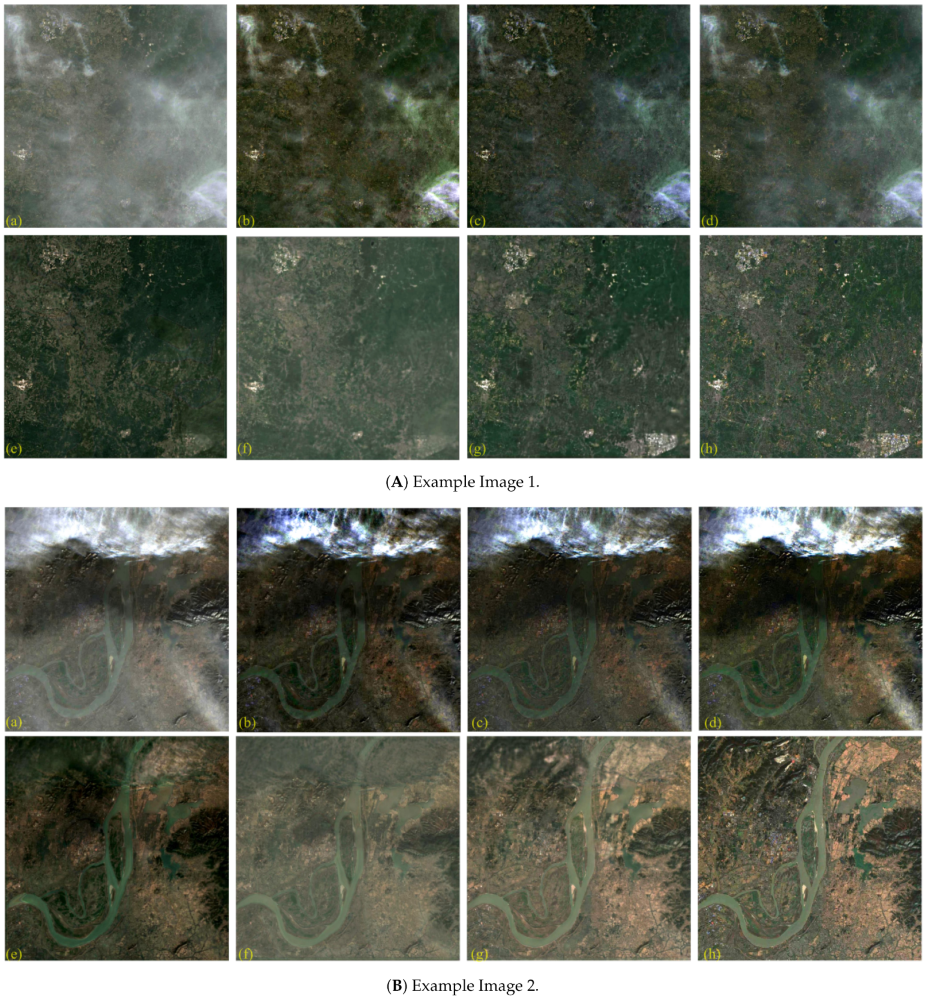
Figure 11 shows the visible true color dehazing results of an image with heavy haze. DCP, DehazeNet and AOD-NET demonstrate poor restoration. MSBDN has a poor effect on maintaining the details of ground objects in Figure 11A(f), and there is still residual haze in the upper part in Figure 11B(f). GridDehazeNet shows great restoration, but there is still a certain loss in the ground details in Figure 11A(e). There are also some haze residues in Figure 11A(e), and there is some color distortion. Our proposed method has demonstrated outstanding performance in haze removal and ground detail preservation.
Table 5, Table 6 and Table 7 list the PSNR, SSIM and FSIM of the above experiments. It can be seen that for the images with slight haze interference, the PSNR and FSIM values are close. DCP, DehazeNet and AOD-Net achieve relatively close results. MSBDN is slightly better and DehazeNet is even better. Our proposed method outperforms all these methods.
For moderate and heavy hazy images, the dehazing effect of the first three methods drops sharply. The results of GridDehazeNet and MSBDN have a slight drop. Our proposed method maintains a stable and good recovery effect, which, again, outperforms all other methods.

4.4. Ablation Experiment

In order to validate the role of different structures in our network, we performed ablation experiments. We are concerned with the multi-input feature fusion structure and the attention module. First, we only kept the main input/output structures corresponding to Band 2, Band 3, Band 4 and Band 8 in the network. We then upsampled the remaining five bands of the training data with 20 m resolution and set the size of input/output images to be 1024 × 1024 . At the same time, we removed the spatial attention and channel attention modules. We used this version as the baseline. After that, we added the structural modules one by one as Model-1 to Model-6. We used the hazy images (outside the training set) as the verification dataset and calculated the average PSNR, SSIM and FSIM of 100 verification images for quantitative evaluation purposes. Table 8 lists the results. It can be observed that with the multi-input structure, the dehazing effect is greatly improved. The results are also improved by adding the attention module.

5. Conclusions

Traditional dehazing methods rely on prior features and are less versatile, which makes them not applicable, especially for remote sensing images with widespread non-uniform haze. In recent years, deep learning methods have been applied for automatic feature extraction. However, the structure of remote sensing images with haze is relatively complex. It is difficult for general neural networks to effectively extract features. Meanwhile, there are very few network models targeting muti-band remote sensing images. In this research, we propose a multi-input, multi-spectral remote sensing image dehazing network, which effectively utilizes the penetrating capability of the infrared band to haze. We used global skip connections and attention modules to achieve effective feature extraction and maintain ground details in the meantime. Finally, we designed experiments to test the performance of the proposed method on multispectral images captured by Sentinel-2, which have different degrees of haze effects. Our method can effectively restore the images. It outperforms the traditional dark channel method and several neural network methods, such as DehazeNet, AOD-Net, MSBDN and GridDehazeNet, in terms of haze residues and quantitative evaluation metrics.
Meanwhile, there are some limits in this research. First, the training dataset is not categorized based on the types of haze, which could impact the effectiveness of the proposed model. Second, even though the ground details are well maintained in the restored images, there is still some loss compared to haze-free images. As for our future work, we will formulate an indicator to describe the degree of the haze effect, which will be used to classify the images in the training dataset. At the same time, we will improve the model by referring to the method that can effectively improve the detail resolution in super-resolution research.
Author Contributions

Conceptualization, Z.H.; Data curation, Z.H.; Software, Z.H. and F.Z.; Writing—original draft preparation, Z.H.; Supervision, C.G.; Methodology, Y.H.; Resources, Y.H.; Validation, F.Z. and L.L.; Writing—review and editing, C.G. and L.L. All authors have read and agreed to the published version of the manuscript.

Funding

This research was funded by National Natural Science Foundation of China (Grant No. 31970378), Science and Technology Commission of Shanghai, Shanghai 2021 “Science and Technology Innovation Action Plan” social development science and technology research project (Grant No. 21DZ1202500). Shanghai Water Authority Science and Technology Project (Grant No. 2021-10). Jiangsu Provincial Water Resources Department, Jiangsu Province Water Conservancy Science and Technology Project (Grant No. 2020068).

Institutional Review Board Statement

Not applicable.

Informed Consent Statement

Not applicable.

Data Availability Statement

Not applicable.

Conflicts of Interest

The authors declare no conflict of interest.

References

  1. Qi, Q.; Zhang, C.; Yuan, Q.; Li, H.; Shen, H.; Cheng, Q. An Adaptive Haze Removal Method for Single Remotely Sensed Image Considering the Spatial and Spectral Varieties. Geomat. Inf. Sci. Wuhan Univ. 2019, 44, 1369–1376. [Google Scholar]
  2. Pyongsop, R.I.; Zhangbao, M.A.; Qingwen, Q.I.; Gaohuan, L. Cloud and shadow removal from Landsat TM data. J. Remote Sens. 2010, 14, 534–545. [Google Scholar]
  3. Melgani, F. Contextual reconstruction of cloud-contaminated multitemporal multispectral images. IEEE Trans. Geofence Remote Sens. 2006, 44, 442–455. [Google Scholar] [CrossRef]
  4. Li, X.; Shen, H.; Zhang, L.; Zhang, H.; Yuan, Q.; Yang, G. Recovering Quantitative Remote Sensing Products Contaminated by Thick Clouds and Shadows Using Multitemporal Dictionary Learning. IEEE Trans. Geoence Remote Sens. 2014, 52, 7086–7098. [Google Scholar]
  5. Xu, Z.; Liu, X.; Ji, N. Fog Removal from Color Images using Contrast Limited Adaptive Histogram Equalization. In Proceedings of the 2009 2nd International Congress on Image and Signal Processing, Tianjin, China, 17–19 October 2009; pp. 1–5. [Google Scholar] [CrossRef]
  6. Narasimhan, S.G.; Nayar, S.K. Contrast restoration of weather degraded images. IEEE Trans. Pattern Anal. Mach. Intell. 2003, 25, 713–724. [Google Scholar] [CrossRef] [Green Version]
  7. McDonald, J.E. The Saturation Adjustment in Numerical Modelling of Fog. J. Atmos. Ences 2010, 20, 476–478. [Google Scholar] [CrossRef]
  8. Yu, L.; Liu, X.; Liu, G. A new dehazing algorithm based on overlapped sub-block homomorphic filtering. In Proceedings of the Eighth International Conference on Machine Vision, Barcelona, Spain, 19–20 November 2015. [Google Scholar]
  9. Jobson, D.J.; Rahman, Z.; Woodell, G.A. A multiscale retinex for bridging the gap between color images and the human observation of scenes. IEEE Trans. Image Process. 2002, 6, 965–976. [Google Scholar] [CrossRef] [Green Version]
  10. Nayar, S.K.; Narasimhan, S.G. Vision in bad weather. In Proceedings of the Seventh IEEE International Conference on Computer Vision, Kerkyra, Greece, 20–27 September 1999. [Google Scholar]
  11. Tan, R.T. Visibility in bad weather from a single image. In Proceedings of the IEEE Conference on Computer Vision and Pattern Recognition, Anchorage, AK, USA, 24–26 June 2008; pp. 1–8. [Google Scholar]
  12. He, K.; Sun, J.; Tang, X. Single image haze removal using dark channel prior. IEEE Trans. Pattern Anal. Mach. Intell. 2010, 33, 2341–2353. [Google Scholar]
  13. Zhu, Q.; Mai, J.; Shao, L. A fast single image haze removal algorithm using color attenuation prior. IEEE Trans. Image Process. 2015, 24, 3522–3533. [Google Scholar]
  14. Cai, B.; Xu, X.; Jia, K.; Qing, C.; Tao, D. Dehazenet: An end-to-end system for single image haze removal. IEEE Trans. Image Process. 2016, 25, 5187–5198. [Google Scholar] [CrossRef] [Green Version]
  15. Ren, W.; Liu, S.; Zhang, H.; Pan, J.; Cao, X.; Yang, M. Single image dehazing via multi-scale convolutional neural networks. In Proceedings of the European Conference on Computer Vision, Amsterdam, The Netherlands, 11–14 October 2016; Springer: Cham, Switzerland, 2016; pp. 154–169. [Google Scholar]
  16. Li, B.; Peng, X.; Wang, Z.; Xu, J.; Feng, D. Aod-net: All-in-one dehazing network. In Proceedings of the IEEE International Conference on Computer Vision, Venice, Italy, 22–29 October 2017; pp. 4770–4778. [Google Scholar]
  17. Li, R.; Pan, J.; Li, Z.; Tang, J. Single image dehazing via conditional generative adversarial network. In Proceedings of the IEEE Conference on Computer Vision and Pattern Recognition, Salt Lake City, UT, USA, 18–22 June 2018; pp. 8202–8211. [Google Scholar]
  18. Chen, D.; He, M.; Fan, Q.; Liao, J.; Zhang, L.; Hou, D.; Yuan, L.; Hua, G. Gated context aggregation network for image dehazing and deraining. In Proceedings of the 2019 IEEE Winter Conference on Applications of Computer Vision (WACV), Waikoloa Village, HI, USA, 7–11 January 2019; pp. 1375–1383. [Google Scholar]
  19. Liu, X.; Ma, Y.; Shi, Z.; Chen, J. Griddehazenet: Attention-based multi-scale network for image dehazing. In Proceedings of the IEEE/CVF International Conference on Computer Vision, Seoul, Korea, 27 October–2 November 2019; pp. 7314–7323. [Google Scholar]
  20. Shao, Y.; Li, L.; Ren, W.; Gao, C.; Sang, N. Domain adaptation for image dehazing. In Proceedings of the IEEE/CVF Conference on Computer Vision and Pattern Recognition, Seattle, WA, USA, 13–19 June 2020; pp. 2805–2814. [Google Scholar]
  21. Jiang, H.; Lu, N. Multi-Scale Residual Convolutional Neural Network for Haze Removal of Remote Sensing Images. Remote Sens. 2018, 10, 945. [Google Scholar] [CrossRef] [Green Version]
  22. Qin, M.; Xie, F.; Li, W.; Shi, Z.; Zhang, H. Dehazing for multispectral remote sensing images based on a convolutional neural network with the residual architecture. IEEE J. Sel. Top. Appl. Earth Obs. Remote Sens. 2018, 11, 1645–1655. [Google Scholar] [CrossRef]
  23. Pan, H. Cloud removal for remote sensing imagery via spatial attention generative adversarial network. arXiv 2020, arXiv:2009.13015. [Google Scholar]
  24. Mehta, A.; Sinha, H.; Mandal, M.; Narang, P. Domain-aware unsupervised hyperspectral reconstruction for aerial image dehazing. In Proceedings of the IEEE/CVF Winter Conference on Applications of Computer Vision, Waikoloa, HI, USA, 3–8 January 2021; pp. 413–422. [Google Scholar]
  25. Enomoto, K.; Sakurada, K.; Wang, W.; Fukui, H.; Matsuoka, M.; Nakamura, R.; Kawaguchi, N. Filmy cloud removal on satellite imagery with multispectral conditional generative adversarial nets. In Proceedings of the IEEE Conference on Computer Vision and Pattern Recognition Workshops, Honolulu, HI, USA, 21–26 July 2017; pp. 48–56. [Google Scholar]
  26. Grohnfeldt, C.; Schmitt, M.; Zhu, X. A conditional generative adversarial network to fuse SAR and multispectral optical data for cloud removal from Sentinel-2 images. In Proceedings of the 2018 IEEE International Geoscience and Remote Sensing Symposium, Valencia, Spain, 22–27 July 2018; pp. 1726–1729. [Google Scholar]
  27. Huang, B.; Li, Z.; Yang, C.; Sun, F.; Song, Y. Single satellite optical imagery dehazing using sar image prior based on conditional generative adversarial networks. In Proceedings of the IEEE/CVF Winter Conference on Applications of Computer Vision, Snowmass Village, CO, USA, 1–5 March 2020; pp. 1806–1813. [Google Scholar]
  28. Chaudhry, A.M.; Riaz, M.M.; Ghafoor, A. A framework for outdoor RGB image enhancement and dehazing. IEEE Geosci. Remote Sens. Lett. 2018, 15, 932–936. [Google Scholar] [CrossRef]
  29. Huang, S.; Liu, Y.; Wang, Y.; Wang, Z.; Guo, J. A New Haze Removal Algorithm for Single Urban Remote Sensing Image. IEEE Access 2020, 8, 100870–100889. [Google Scholar] [CrossRef]
  30. Berman, D.; Avidan, S. Non-local image dehazing. In Proceedings of the IEEE Conference on Computer Vision and Pattern Recognition, Las Vegas, NV, USA, 27–30 June 2016; pp. 1674–1682. [Google Scholar]
  31. Long, J.; Shi, Z.; Tang, W.; Zhang, C. Single remote sensing image dehazing. IEEE Geosci. Remote Sens. Lett. 2013, 11, 59–63. [Google Scholar] [CrossRef]
  32. Shen, H.; Zhang, C.; Li, H.; Yuan, Q.; Zhang, L. A Spatial–Spectral Adaptive Haze Removal Method for Visible Remote Sensing Images. IEEE Trans. Geosci. Remote Sens. 2020, 58, 6168–6180. [Google Scholar] [CrossRef]
  33. Tarel, J.; Hautière, N.; Cord, A.; Gruyer, D.; Halmaoui, H. Improved visibility of road scene images under heterogeneous fog. In Proceedings of the IEEE Intelligent Vehicles Symposium, La Jolla, CA, USA, 21–24 June 2010; pp. 478–485. [Google Scholar]
  34. Sakaridis, C.; Dai, D.; Van Gool, L. Semantic foggy scene understanding with synthetic data. Int. J. Comput. Vis. 2018, 126, 973–992. [Google Scholar] [CrossRef] [Green Version]
  35. Ancuti, C.; Ancuti, C.O.; De Vleeschouwer, C. D-hazy: A dataset to evaluate quantitatively dehazing algorithms. In Proceedings of the IEEE International Conference on Image Processing (ICIP), Phoenix, AZ, USA, 25–28 September 2016; pp. 2226–2230. [Google Scholar]
  36. Li, B.; Ren, W.; Fu, D.; Tao, D.; Feng, D.; Zeng, W.; Wang, Z. Benchmarking single-image dehazing and beyond. IEEE Trans. Image Process. 2018, 28, 492–505. [Google Scholar] [CrossRef] [Green Version]
  37. Ji, S.; Dai, P.; Lu, M.; Zhang, Y. Simultaneous cloud detection and removal from bitemporal remote sensing images using cascade convolutional neural networks. IEEE Trans. Geosci. Remote Sens. 2020, 59, 732–748. [Google Scholar] [CrossRef]
  38. Lin, D.; Xu, G.; Wang, X.; Wang, Y.; Sun, X.; Fu, K. A remote sensing image dataset for cloud removal. arXiv 2019, arXiv:1901.00600. [Google Scholar]
  39. Ronneberger, O.; Fischer, P.; Brox, T. U-net: Convolutional networks for biomedical image segmentation. In Proceedings of the International Conference on Medical Image Computing and Computer-Assisted Intervention, Munich, Germany, 5–9 October 2015; Springer: Cham, Switzerland, 2015; pp. 234–241. [Google Scholar]
  40. Lin, T.; Dollár, P.; Girshick, R.B.; He, K.; Hariharan, B.; Belongie, S.J. Feature pyramid networks for object detection. In Proceedings of the IEEE Conference on Computer Vision and Pattern Recognition, Honolulu, HI, USA, 21–26 July 2017; pp. 2117–2125. [Google Scholar]
  41. Hu, J.; Shen, L.; Sun, G. Squeeze-and-excitation networks. In Proceedings of the IEEE Conference on Computer Vision and Pattern Recognition, Salt Lake City, UT, USA, 18–22 June 2018; pp. 7132–7141. [Google Scholar]
  42. Woo, S.; Park, J.; Lee, J.; Kweon, I.S. Cbam: Convolutional block attention module. In Proceedings of the European Conference on Computer Vision (ECCV), Munich, Germany, 8–14 September 2018; pp. 3–19. [Google Scholar]
  43. Dong, H.; Pan, J.; Xiang, L.; Hu, Z.; Zhang, X.; Wang, F.; Yang, M.H. Multi-scale boosted dehazing network with dense feature fusion. In Proceedings of the IEEE/CVF Conference on Computer Vision and Pattern Recognition, Seattle, WA, USA, 13–19 June 2020; pp. 2157–2167. [Google Scholar]
Figure 1. The visible (RGB) band and the infrared bands in the image captured by Sentinel-2.
Applsci 12 10523 g001
Figure 2. A Sentinel-2 foggy and fog-free image pair.
Applsci 12 10523 g002
Figure 3. The architecture of the proposed network.
Applsci 12 10523 g003
Figure 4. The architecture of the convolution layer in encoder.
Applsci 12 10523 g004
Figure 5. The architecture of the upsampling layer.
Applsci 12 10523 g005
Figure 6. The architecture of the attention module.
Applsci 12 10523 g006
Figure 7. Training loss curve.
Applsci 12 10523 g007
Figure 8. The dehazing effect on the hazy multi-spectral images captured by Sentinel-2.
Applsci 12 10523 g008
Figure 9. Dehazing results on images with slight haze interference. (a) Hazy image; (b) DCP; (c) DehazeNet; (d) AOD-NET; (e) GridDehazeNet; (f) MSBDN; (g) proposed method; (h) haze-free image.
Applsci 12 10523 g009
Figure 10. Dehazing results on images with moderate haze interference. (a) Hazy image; (b) DCP; (c) DehazeNet; (d) AOD-NET; (e) GridDehazeNet; (f) MSBDN; (g) proposed method; (h) haze-free image.
Applsci 12 10523 g010
Figure 11. Dehazing results on images with heavy haze interference. (a) Hazy image; (b) DCP; (c) DehazeNet; (d) AOD-NET; (e) GridDehazeNet; (f) MSBDN; (g) proposed method; (h) haze-free image.
Applsci 12 10523 g011
Table 1. Sentinel-2 bands.
Sentinel-2 BandsCentral Wavelength ( μ m)Resolution (m)
Band 1—Coastal Aerosol0.44360
Band 2—Blue0.49010
Band 3—Green0.56010
Band 4—Red0.66510
Band 5—Vegetable Red Edge0.70520
Band 6—Vegetable Red Edge0.74020
Band 7—Vegetable Red Edge0.78320
Band 8—Near Infrared0.84210
Band 8A—Vegetable Red Edge0.86520
Band 9—Water Vapor0.94560
Band 10—Shortwave Infrared—Cirrus1.37560
Band 11—Shortwave Infrared1.61020
Band 12—Shortwave Infrared2.19020
Table 2. Experimental results on different bands: PSNR.
ImageDCPDehazeNetAOD-NetGridDehazeNetMSBDNProposed
Band 517.31617.28319.23325.31120.10329.651
Band 618.67318.07420.20625.68222.57228.304
Band 719.32518.79221.46126.10424.30527.342
Band 821.35320.38622.71825.93326.43831.541
Band 1122.17620.85021.64826.45224.34929.072
Band 1221.98121.09820.05226.93925.40627.508
Visible true color15.68314.53219.79724.26123.82130.106
Table 3. Experimental results on different bands: SSIM.
ImageDCPDehazeNetAOD-NetGridDehazeNetMSBDNProposed
Band 50.4360.4740.6370.7370.6770.853
Band 60.4740.4680.6230.7220.6650.878
Band 70.3510.3320.5930.6930.6210.817
Band 80.4520.4220.6850.7490.7340.906
Band 110.5760.5320.7230.8050.7560.874
Band 120.5090.5020.6290.7230.6920.825
Visible true color0.3790.4610.5820.7180.6650.867
Table 4. Experimental results on different bands: FSIM.
ImageDCPDehazeNetAOD-NetGridDehazeNetMSBDNProposed
Band 50.7440.7320.7920.8560.8270.922
Band 60.7660.7820.8120.8660.8340.903
Band 70.7130.7220.7750.8230.8020.887
Band 80.8130.8210.8430.8970.8570.944
Band 110.7780.7910.8130.8850.8660.939
Band 120.7710.7820.8290.8630.8550.911
Visible true color0.7550.7620.8350.8650.8470.896
Table 5. Experimental results on different images: PSNR.
ImageDCPDehazeNetAOD-NetGridDehazeNetMSBDNProposed
Slight hazy Image 121.60022.49222.25525.51623.81126.541
Slight hazy Image 221.00222.19922.87123.21222.90627.840
Moderate hazy Image 118.97320.61221.29124.22823.38727.838
Moderate hazy Image 215.73917.61418.04423.64922.29928.591
Heavy hazy Image 116.84317.05118.41122.35322.64525.596
Heavy hazy Image 211.56612.49711.50521.37620.69426.100
Table 6. Experimental results on different images: SSIM.
ImageDCPDehazeNetAOD-NetGridDehazeNetMSBDNProposed
Slight hazy Image 10.5670.5330.6730.7550.6990.824
Slight hazy Image 20.5980.5470.5780.6830.6420.818
Moderate hazy Image 10.5060.6210.7140.7500.7420.836
Moderate hazy Image 20.4690.5530.6430.7280.7340.821
Heavy hazy Image 10.4050.4110.5350.6970.6530.787
Heavy hazy Image 20.2920.3190.4780.6320.6040.778
Table 7. Experimental results on different images: FSIM.
ImageDCPDehazeNetAOD-NetGridDehazeNetMSBDNProposed
Slight hazy Image 10.8330.8280.8440.8780.8540.893
Slight hazy Image 20.8420.8510.8660.8920.8730.932
Moderate hazy Image 10.7560.7640.7780.8590.8380.910
Moderate hazy Image 20.7440.7610.7910.8430.8220.898
Heavy hazy Image 10.7020.7110.7670.8130.8240.877
Heavy hazy Image 20.6810.6930.7550.8330.7910.874
Table 8. Experimental results of different structural models.
MethodComponents
Multi-InputSACAPSNRSSIMFSIM
Baseline 24.5730.7250.818
Model-1 24.8610.7330.806
Model-2 25.0610.7440.832
Model-3 25.2240.7610.840
Model-4 26.6410.8090.858
Model-5 27.0210.8310.889
Model-6 26.8910.8130.894
Proposed27.8660.8580.908
Publisher’s Note: MDPI stays neutral with regard to jurisdictional claims in published maps and institutional affiliations.