1. Introduction
In the productive agricultural sector, new technological innovations are continuously developed and integrated to improve and facilitate the farmer’s work. The broiler industry is no exception and the producers are interested in availing every opportunity to add efficiencies into their production systems. Modern technologies, together with precision engineering, can achieve real-time information on animal health. This new management system is called Precision Livestock Farming (PLF) and is now used to monitor animals, ensuring their excellent health and well-being [
1]. Through the electronic collection of data, their processing and application, precision farming has the objective and potential of improving production efficiency, reducing costs, and safeguarding animal health [
2]. An animal showing excellent health can be the guarantee of product quality, which is why the PLF is based on the assumption that the continuous and direct monitoring or observation of the animals allows the farmers to detect and control their health status at any given time.
Different technologies are currently available to the farmer to measure different parameters on the farm, such as ventilation rate, feed supply and temperature. The introduction of equipment such as microphones, cameras and sensors (for example, body temperature sensors or skin conductivity sensors), has managed to focus the attention on the core of the production process, the animal [
3].
Recent studies have focused on animal’s vocalisations. This parameter can provide information on their sex, age, mother and offspring’s relationship, emotional state and growth rate [
1]. This study is centred precisely on this parameter, and its aim is to verify how the levels of carbon dioxide (CO
) within a farm can influence the vocalisations of broilers. CO
is naturally emitted by the animals, as a result of their metabolism and their litter, and it is therefore used as a tracer gas in order to determine the ventilation rates in animal houses [
4]. CO
is an anaesthetic acid gas, which causes unpleasant pain sensations in animals [
5]. Its increase inside the farm due to poor ventilation is directly related to the increase of other noxious gases, which together can cause the chicken to rapidly lose brain functions, leading to convulsions and death [
6].
Therefore, it is important to accurately study the acoustical features of the farm sounds to understand and describe how they are related with the CO
concentration. These indicators, obtained in a near real-time environment, can be used as a warning signal for the farmer about the need or not to increase the ventilation rate inside the farm in order to reduce greenhouse gas concentration, that can cause, among others, chronic respiratory disease, which affect the growth rate of broilers. Production meat quality is affected by high gas concentration and for other stress sources as for example acute external noise exposure [
7]. Forecasting gas values and applying proper ventilation, higher animal well-being an production quality can be ensured.
This paper is structured as follows. The related work used as baseline of this project is detailed in
Section 2. The specifications of the farm deployment, the carbon dioxide concentration and acoustical features measurements are detailed in
Section 3. The filtered features, the acoustical feature importance and correlations of the data and the representation of the most important ones can be found in
Section 4. Discussion of the acoustical features analysis behaviours linked with the gas concentration found in this work are detailed in
Section 5 and the conclusion, as well as future work, is detailed in
Section 6.
2. Related Work
Nowadays, research on farm animal welfare has become an important topic for many societies concerned about the well-being of animals raised for consumption. The automatic monitoring of their vocalisations has been one of the main targets, due to the fact that it is a technology that does not interfere with the farm process.
2.1. Welfare and Vocalisation Analysis
Taking into account that in the last years animal welfare has become a central issue for the scientific community and society, the demand for more well-being for farm-raised animals [
8,
9] has increased substantially. Administrations have adopted several directives to improve the welfare of farm animals [
10], assuming that they depend on the public concern existing in every country, influencing the politicians to deepen the actions for that purpose. UK and Germany are more on track than Italy or Spain [
11], just to mention some examples. Animal vocalisations are considered an expression of the state of the animal that generates them spontaneously, or maybe also motivated by external events [
12]. The study of emotions in animals presents complex structures including a variate set of acoustic elements, and several studies have analysed them to disambiguate this complexity [
13]. Briefer et al. [
14] conducts a good synthesis of the current state of knowledge on vocal correlations in humans and mammals, while other authors [
15] deploy several types of sensors in the farms in order to monitor the emotions of the animals, taking into account facial expression and sound analysis, focusing the latter on vocalisations.
Bioacoustics has been extensively tested on farms, especially by means of recorders that automatically collect audio data [
16]. By developing automated methods that analyse animals’ vocalisations, their welfare can be greatly improved. In [
12], there is a wide state of the art about vocalisations of different farm-raised animals. Vocalisations, such as screams, should be identified since they are usually due to pain or stressful situations [
17], but the general structure and behaviour of farm-raised animals should also be known (e.g., cattle [
18], chickens [
19], among others). Recently, several research groups have started working on the development of vocalisation identification algorithms, which integrate feature extraction together with machine learning algorithms [
20], in order to identify in real-time the vocalisations in a real operating environment, such as a farm.
2.2. Acoustic Analysis of Vocalisations for Animal Well-Being
This study is focused on the acoustic analysis and feature identification in the framework of poultry farms. Several studies have been conducted in this area, as the one in [
19], where mean duration, number of call repetitions and range peak frequency describe chicken vocalisations to find some patterns depending on the age of the birds, and also considering whether the birds are alone or in a group. Other researchers have worked with the distinction of healthy from infected chickens using sparse decomposition of audio spectrograms [
21], and ref [
22] have analysed the following features: root mean square, power, energy, absolute extremum, intensity, shimmer, jiter, harmonic to noise ratio, pitch, formant F1–F4 and power spectral density 1–39 to automatically detect stress in laying hens. Other factors can be taken into account when evaluating the behaviour of birds, like temperature [
23] together with sound pressure level and pitch.
Another type of approach is to define a set of acoustic markers related to the physical, behavioural and emotional welfare of birds, called
iceberg indicator, which is obtained after cleaning the spectral frequencies that are especially involved in farm machinery. With the iceberg indicator, ref. [
24] managed to predict low weight gain and mortality for the first days of birds. In [
25], the authors use a deep learning approach using log-Mel spectrograms to identify distress calls, which are mostly identified by manual annotations, in a labour-intensive and time-consuming task. A recent study [
26] widen the approach in multiple species (e.g., horses, cows, goats, chickens), even relating the distribution of frequencies to positive or negative emotions in farm-raised animals; in the case of chickens, food calls and fast clucks may be linked to positive emotions.
For this purpose, in [
27] the authors present the description of the acoustic characterisation of vocalisations and their similarities and differences, depending on factors that negatively affect the welfare of cows, such as feed availability (hunger), parturition (pain) or others, in order to develop artificial intelligence algorithms as future work to identify automatically these situations. Also in [
28], several analysis of the raw acoustic data gathered by means of a professional phonendoscope are depicted, as the previous stage uses these short pieces of audio to train a machine learning algorithm to automatise the process. Even in very young chickens, the vocalisations can be a step to determine the welfare of the early stages of broilers’ life. In [
29], several analysis are conducted with two different groups at the same time, comparing the vocalisations when the birds are fed and when they are not, focusing on the food dependency previously mentioned. Finally, in [
30], the authors detail the acoustic analysis of the farm acoustic environment to obtain the Equivalent Level (
), the mean Peak Frequency (PF), and the PF variation, every 30 min, in order to evaluate other iterations of the growing process in the future and compare its measurements at every stage of the growing process.
3. Material and Methods
Data were collected from two commercial broiler farms located in the same area, with similar weather conditions in the northwest of Spain, from May to December of 2021. The animal houses used for this study are characterised by a high level of automation of the routine management practices, thus reducing the noise emitted by workers.
Farm A has a livestock production of 42,000 animals and three production cycles have been recorded there; additionally, Farm B has a capacity of 40,000 chicken birds and one production cycle has been examined. Both houses had similar flock management and diets according to the industrial requirements and each cycle lasted between 42 and 44 days depending on the final animal weight and the needs of the supplement. For this study, the first 40 days of the animals’ life were studied, during which the chicks had unlimited access to feed, water supply and free mobility.
3.1. Data Acquisition
The sensors used in this study for data acquisition are a carbon dioxide sensor and a measurement microphone.
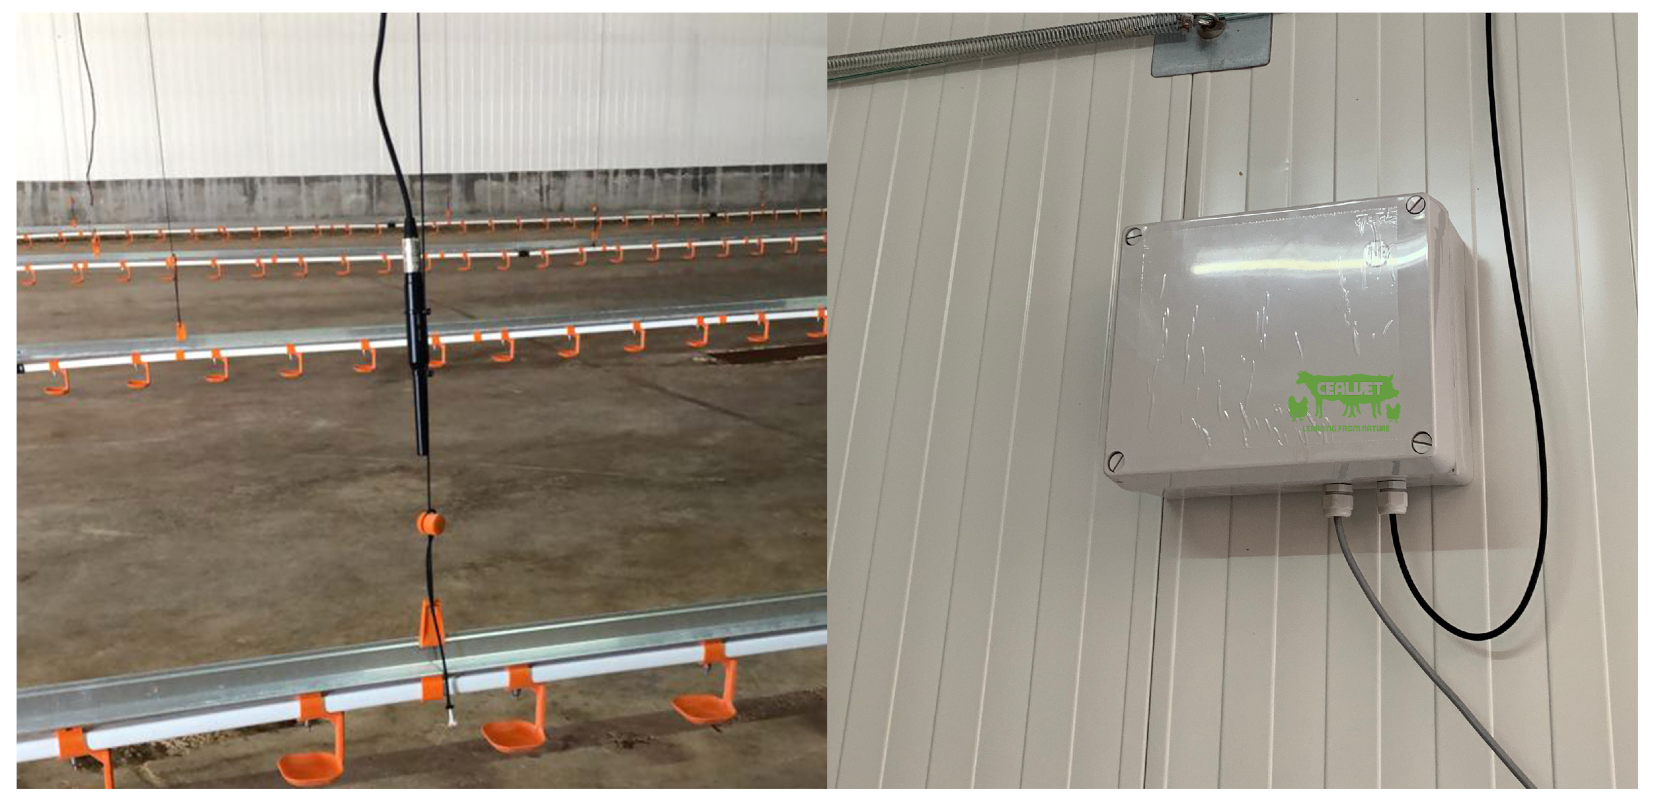
Acoustic data from each animal breeding cycle has been uninterruptedly collected with a measurement condenser microphone Superlux ECM999 [
31] centrally located in the animal house, at a height of 0.7 m. By means of a 20 m cable, the analogical signal was digitalized with a digital audio interface Behringer U-Phoria UM2 [
32] and recorded in a mini computer using a python script [
33]. Recording hardware has been placed in an IP 65 junction box hanging on a wall close to the sensor, as shown in
Figure 1. The system recorded for 40 days with a sampling frequency of 22.05 kHz and 8 bits resolution splitting data into 10 min files with a flac compression [
34]. Similar previous deployments have been implemented by the authors in [
30,
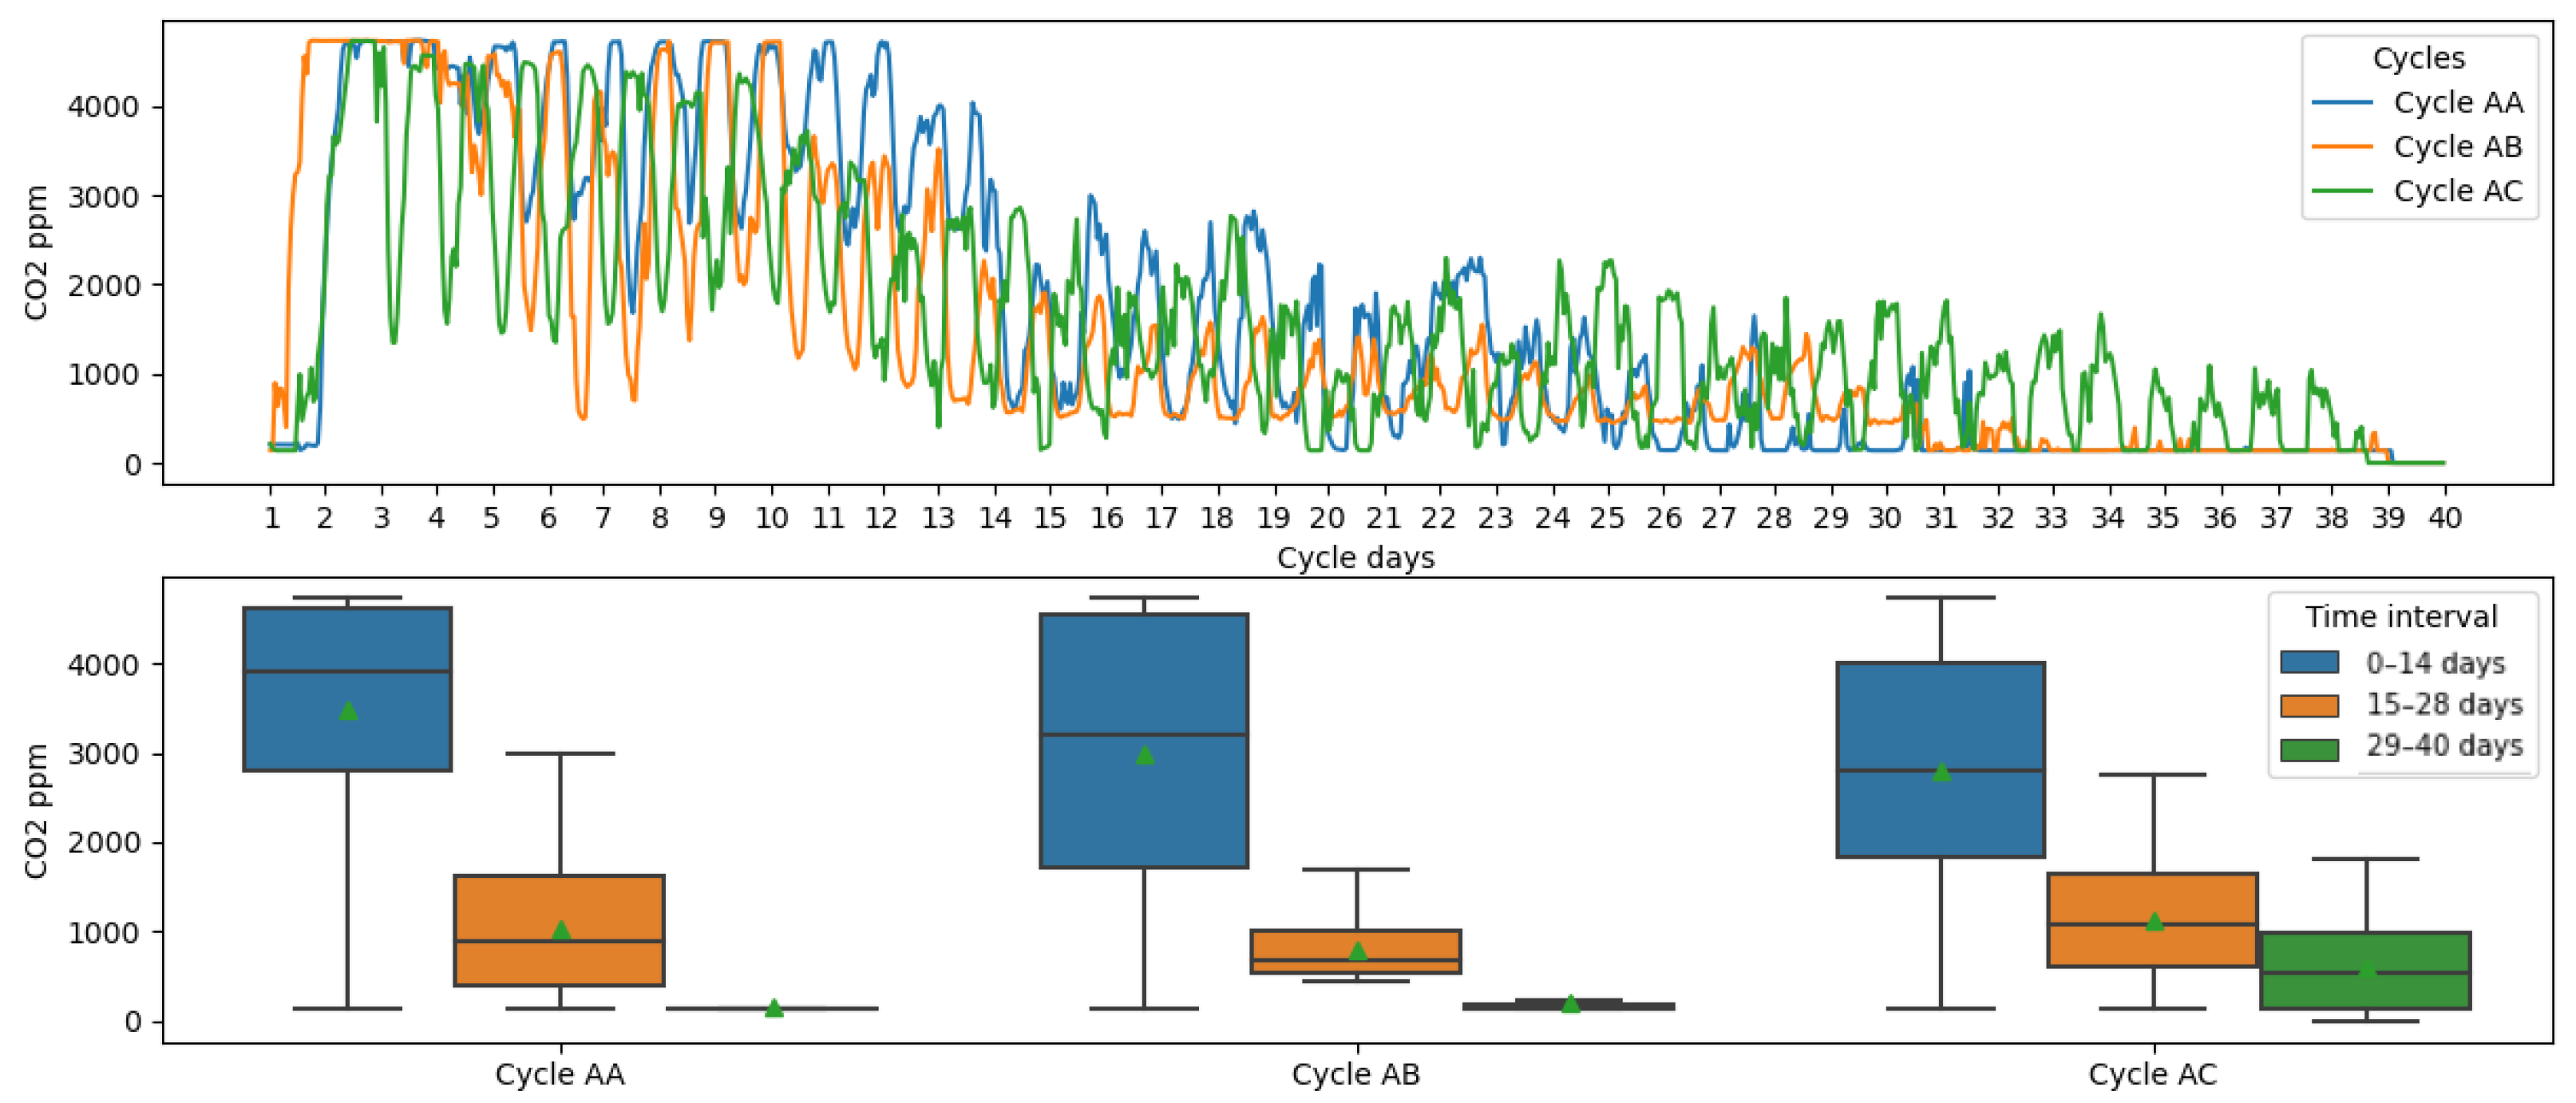
35] Simultaneously, a carbon dioxide sensor was located at the center of farm A at 0.8 m from the ground and samples were obtained at intervals of 15 min.
Figure 2 shows the CO
values measured in this study.
3.2. Carbon Dioxide Indicator
Carbon dioxide (CO
) is an acidic colourless gas mostly emitted by birds and litter. The gas production capacity of the animals depends on their weight and performance as a result of animal metabolism. It is important to measure and control CO
levels as it acts as a tracer gas to determine house ventilation rates [
4] and reduce high concentrations of particles breathed by birds.
The top of
Figure 2 shows CO
concentration in ppm of three consecutive winter production cycles. At the bottom of the same figure data is observed with box plots in three time intervals. Periods reference used in this study represent the Starter (0–14 days), Grower (15–28 days) and Finisher (29–40 days) periods which are typical zoo-technical performance intervals, also used by [
36].
(i) 0–14 days: interval with the highest mean value (3000–2800 ppm) and variation
(ii) 15-28 days: considerable reduction of gas concentration (900–1100 ppm) and variation respect the fist interval the mean value
(iii) 29–40 days: minimum gas presence in comparison with the other intervals. The observed decreasing curve is typical of the winter season, and is due to farm management practices where, at the beginning of the cycle, the house must be constantly kept at a temperature of 29 ºC to keep the chicks warm; less ventilation can be performed when outside temperatures are between 5–15 ºC because the house would become cooler. Reduced ventilation increases gas concentration.
3.3. Acoustical Features
Continuous farm recording contains the raw acoustical information related to all the sound sources of the farm emissions from animals, machinery and human handling of animals [
35]. Different audio features are extracted once processing the data using software Python 3.8 [
33] to study the relation with CO
. The features extracted and analysed in this study are classified and detailed below and, for more detail, readers are referred to the cited literature.
3.3.1. Temporal Feature
Temporal repetitions of birds’ vocalisations (VocalNum) is an acoustical feature that counts the number of birds’ calls per time unit, for this analysis the period set is 15 min. According to Curtis et al. [
37], this feature is an indicator of stress, so the high number of call repetitions (from 160 to 250 vocalisations in 45 min) can indicate a stressful condition.
3.3.2. Frequency Features
Poultry birds are part of a very vocal species that express some of its health conditions through calls. The frequency analysis of calls can be useful to find different patterns. For this study, the animal pitch and Mel-Frequency Cepstral Coefficients (MFCC) [
38] were extracted.
The pitch feature indicates the fundamental frequency on which the birds vocalise and it is extracted using a method based on auto-correlation [
39].
The MFCC is a widely used frequency feature that indicates the amount of energy compressed in a frequency region using a Mel filter bank. The first 12 coefficients will be used in this study and cover a range from 0–20 kHz resulting by filtering data with Mel filters, the logarithm of the sub-bands and finally applying discrete cosine transform [
40]. Same indicators are used in similar analysis [
41,
42,
43].
4. Experiments and Results
4.1. Filtered Audio and Features
Acoustic features extracted from raw data at intervals of 15 min during the entire cycle showed a considerable deviation among the samples of the same day, and some of these samples are very noisy due to the farmer management routine practices and the noise of the machinery previously studied in [
35]. Two filters are applied to the data for noise reduction.
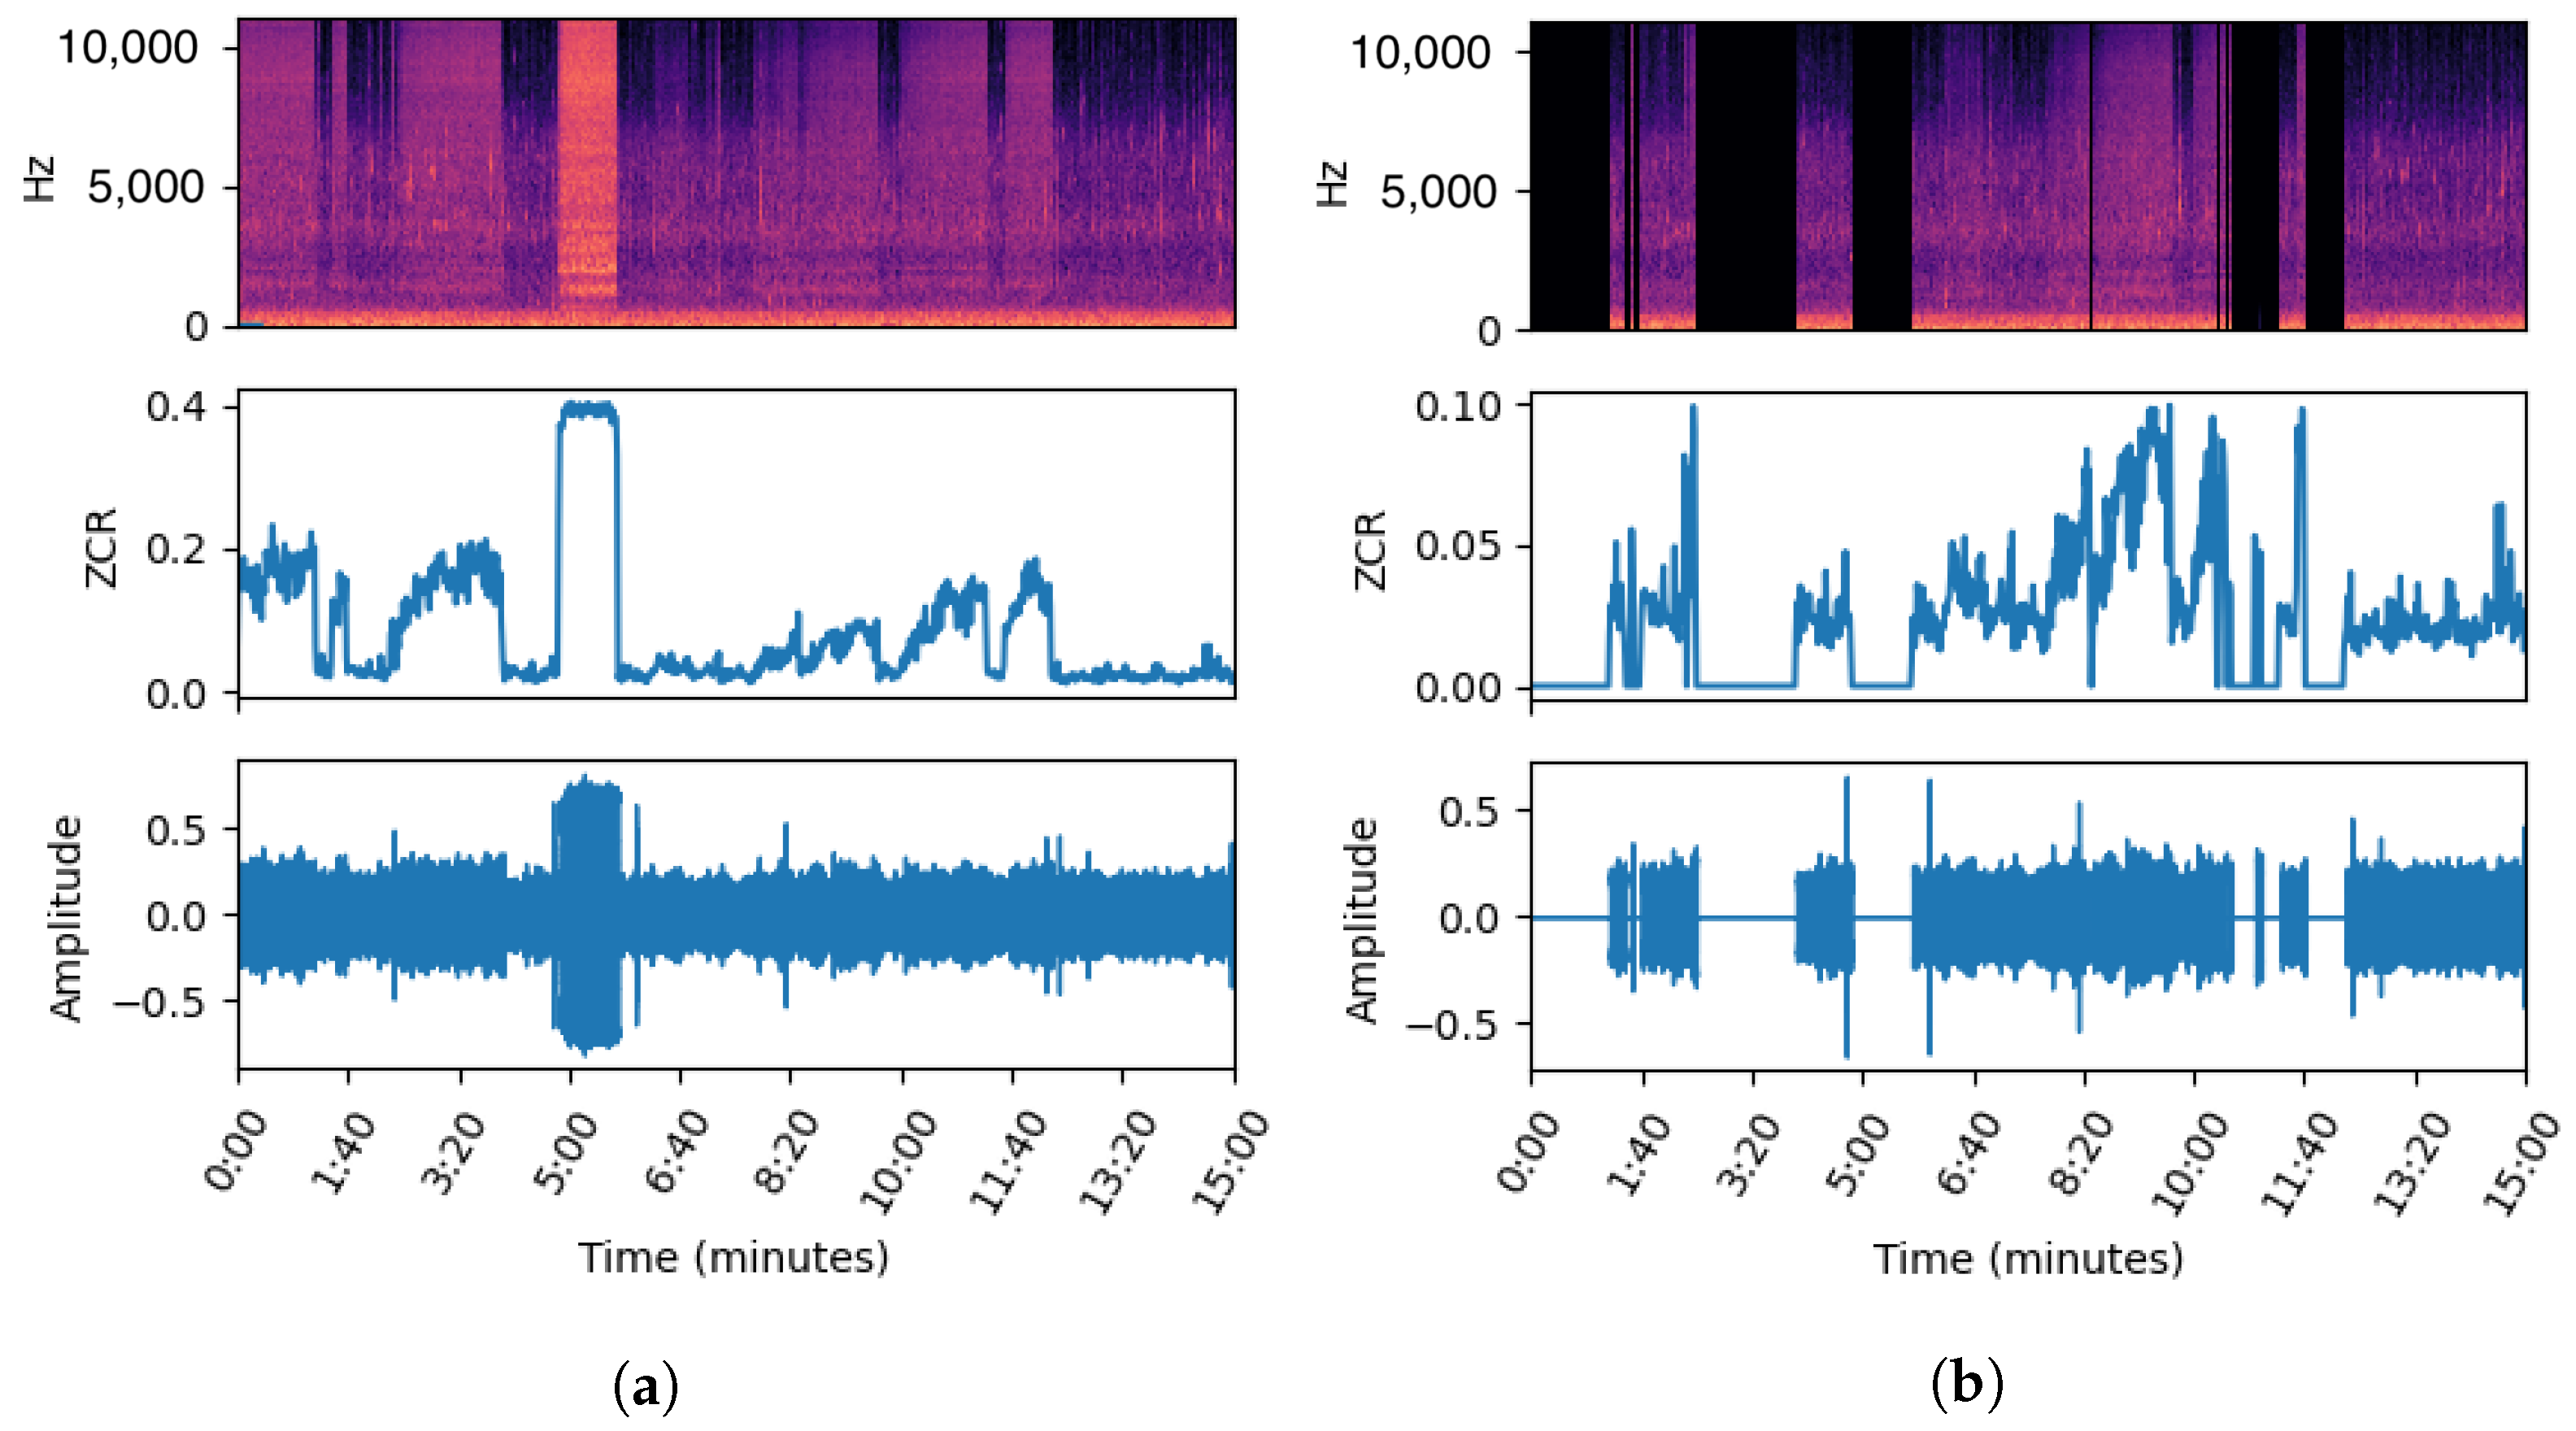
An automatic filter based in a threshold of the parameter Zero Crossing Rate (ZCR) has been implemented to discriminate audio samples containing machinery sounds.
Figure 3a shows the spectrum, ZCR and temporal waveform of an audio file with external noise where it is clear identified the machinery spectrum pattern, with energy in almost all frequencies and a ZCR superior to 0.10.
Figure 3b shows post-filtering audio data.
Acoustical features obtained from each filtered audio file are still too noisy to observe tendencies. Some filters selected from the Python Library [
44] were tested to find the one that could reduce wrong values of features produced by management practices noise in order to obtain more invariant descriptors of bird’s vocalisations between each day and each cycle.
The optimal feature filter considered for this study is the one that achieves the minimum Euclidean pitch distance [
45] with respect to the same moment of two cycles of the same farm. Having three cycles, the distance is calculated as the sum of distances, as described in the formula (
1). According to the
Table 1, the minimum distance is obtained by applying the exponential filter that smoothes time series data using the exponential window function.
Formula (
1) calculates the sum of euclidean distance between three cycles of farm
A where
P is the filtered pitch value of the corresponding instance
i of cycle
AA,
AB or
AC indicated as a sub index, and
N is the length of P vector.
4.2. Feature Importance and Correlation
The feature importance algorithm [
46] gives an idea of how relevant each attribute is in indicating the level of contribution to a model that extracts some information from the features. This tool is used in the frame of a predictive model and gives, for each used feature, a value from zero to one, which is called the importance factor, and that allows knowing how useful it is for the model.
Combined importance calculated as a mean of the importance of each predictor has been obtained through different models that predict the gasses levels. These models have been extracted from Scikit-learn [
47] and, among them, there are:
(i) logistic regression,
(ii) decision tree regressor,
(iii) random forest classifier,
(iv) extra trees classifier.
The
Table 2 shows the combined importance factors relating the acoustical features with CO
by cycle and aggregated of the three cycles. Analysing the set of cycles, the most important descriptor with a difference of 0.18 points, is the MFCC 6. After this attribute, MFCC 9, 4, 3 are the most relevant ones. All the above named features accumulate an importance of 0.5814 and will be discussed in more detail in the following subsection.
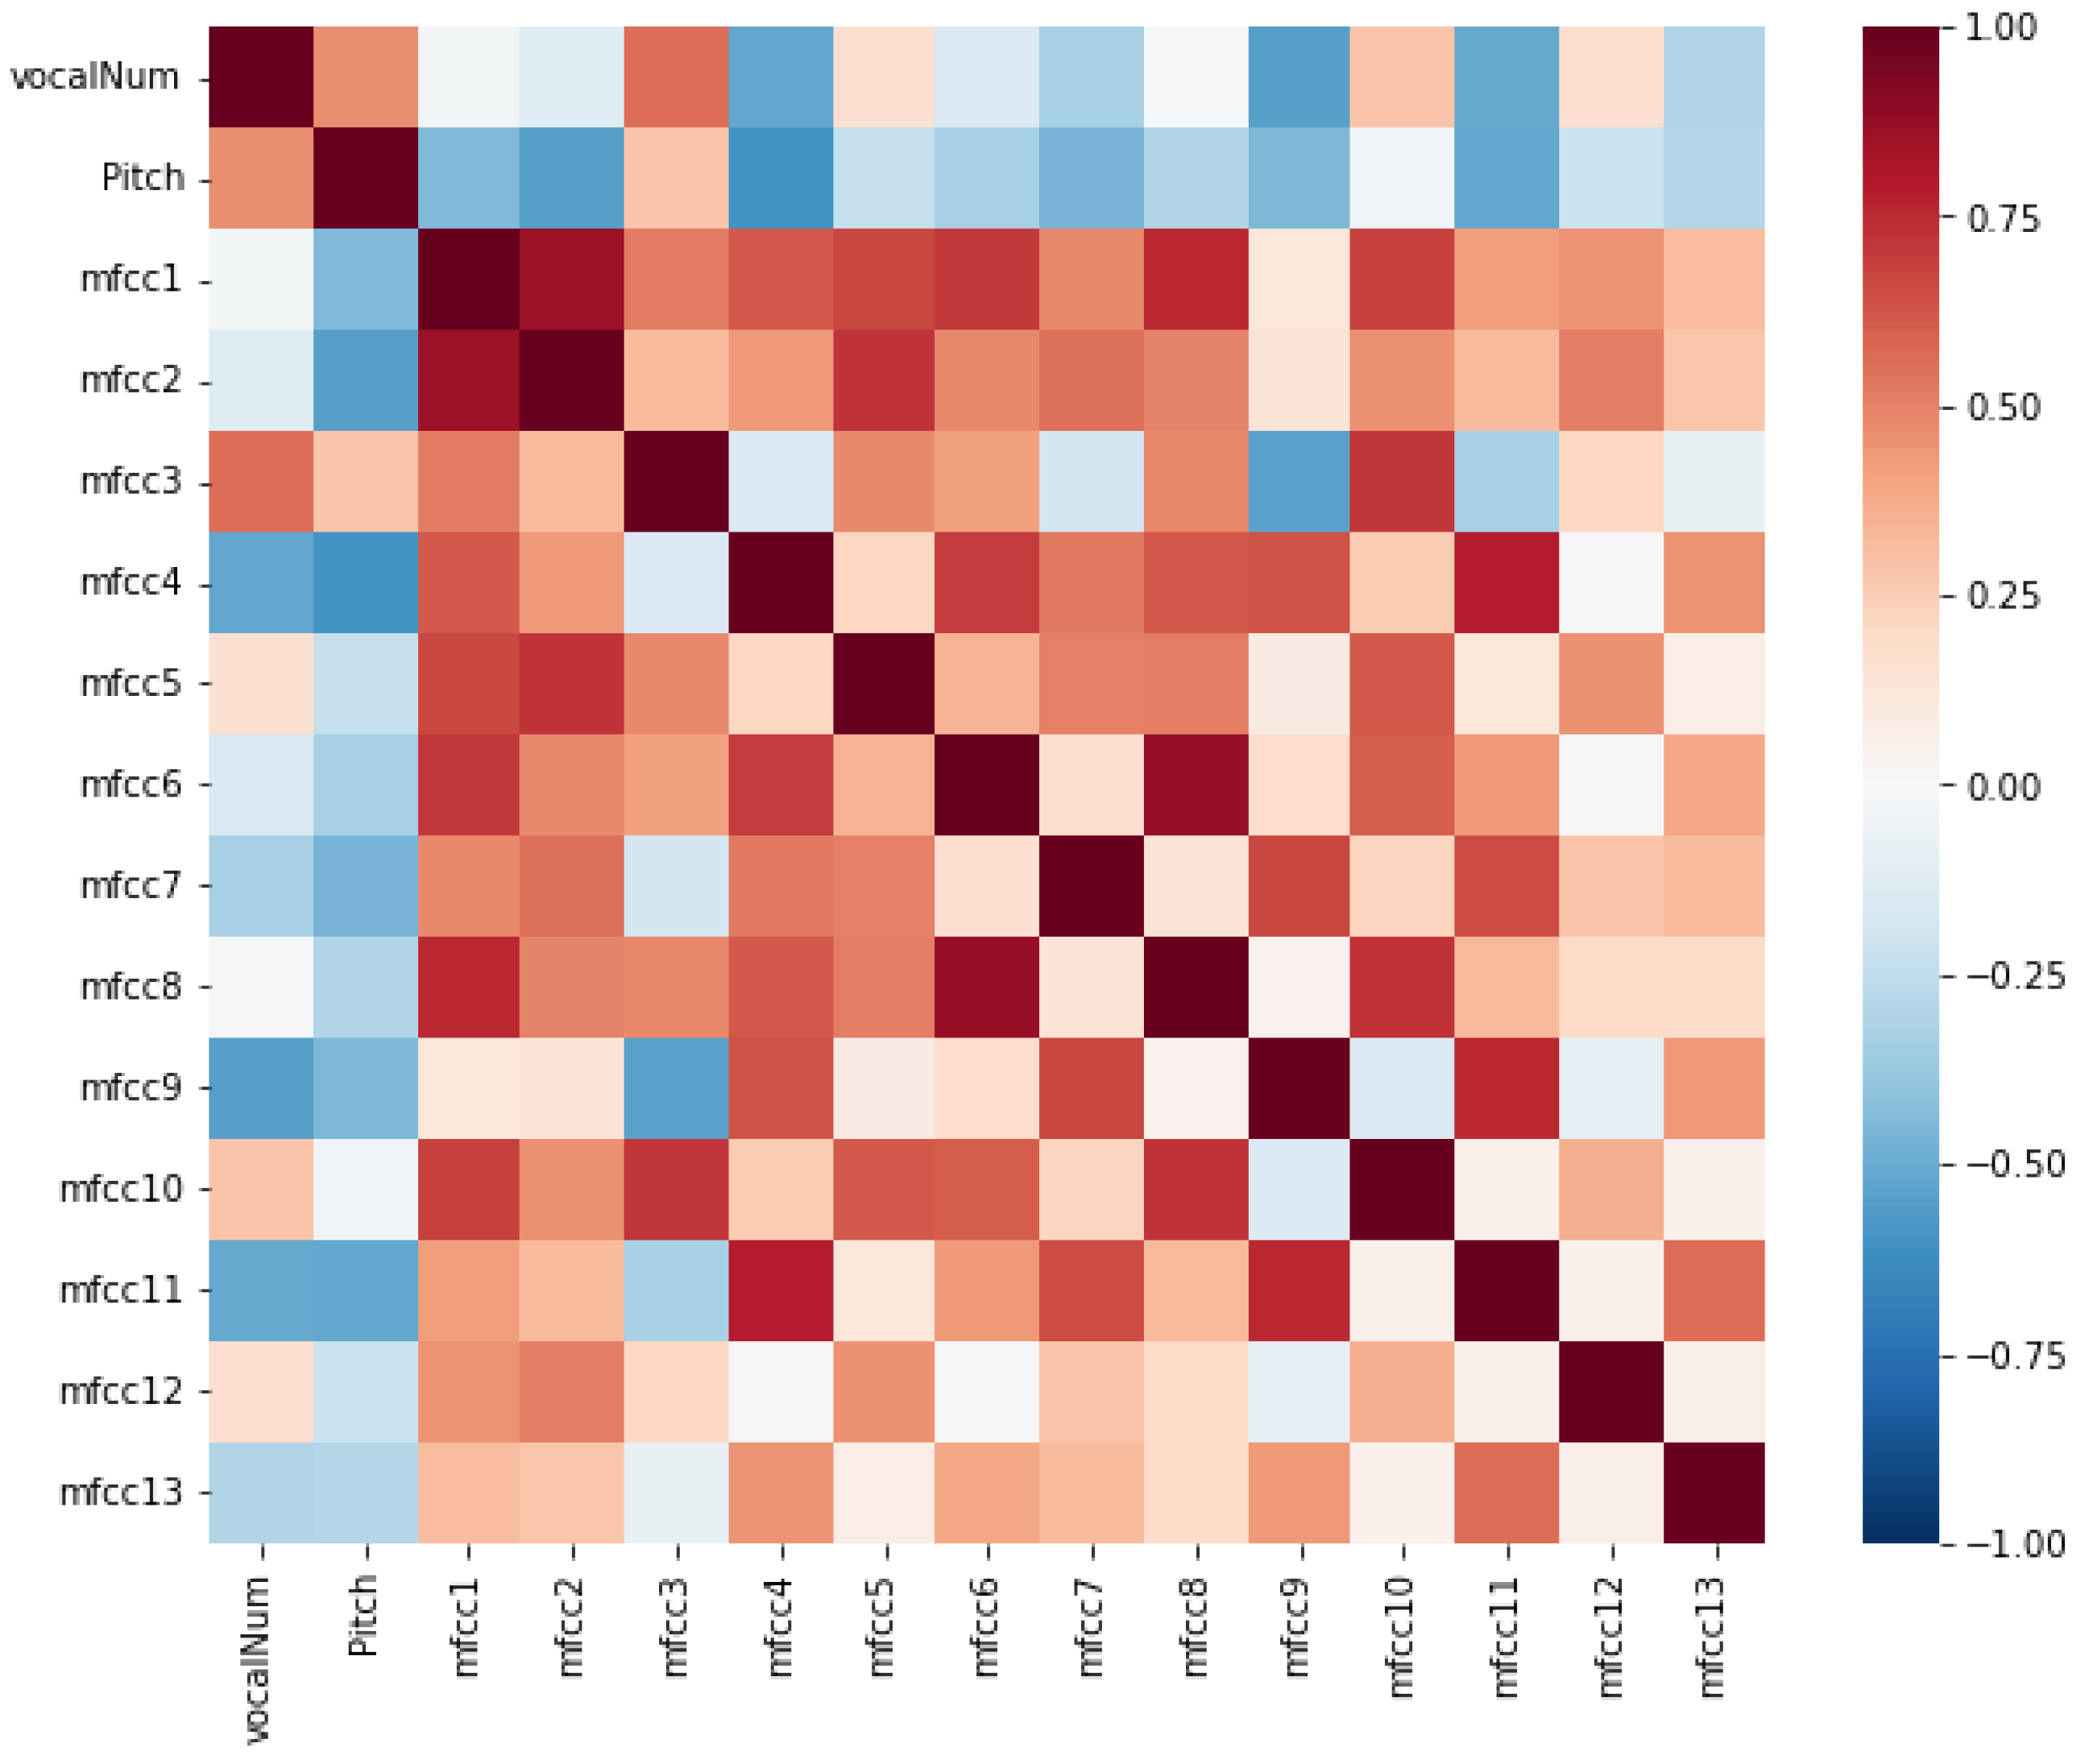
Another interesting aspect to consider is the way how each descriptor relates to the others. The correlations among descriptors indicate redundancies and shared information. For this study, a matrix of correlations was calculated and it is shown in
Figure 4.
In previous studies, authors found that, when chicks are stressed, higher values of vocalNum and Pitch are found [
29]; this slight positive correlation can be observed in this analysis. Also, it is observed that this two features are mainly inverse correlated with the MFCC except from the MFCC 3. Some of the most outstanding correlations are the positive ones between MFCCs. MFCC 1 is the feature with highest correlations. As seen in
Table 2, it is the less important feature for detecting gas concentration, which could be related to the redundant information in similar descriptors. It is noteworthy that correlations among two consecutive MFCCs are always close to zero with the only exception of 1st and 2nd, whereas there is a notable positive correlation among MFCC n and MFCC ± 2 for every n from 1 to 10.
4.3. Trend of Acoustic Features
Having a sound data-set of three consecutive poultry production cycles of the same animal house managed, personal and routines can be analysed simultaneously to find a tendency on the most related features to CO
concentration in
Figure 5,
Figure 6,
Figure 7 and
Figure 8. Data representation can be seen per day in the first row or by intervals shown in box plots in the second-row figure.
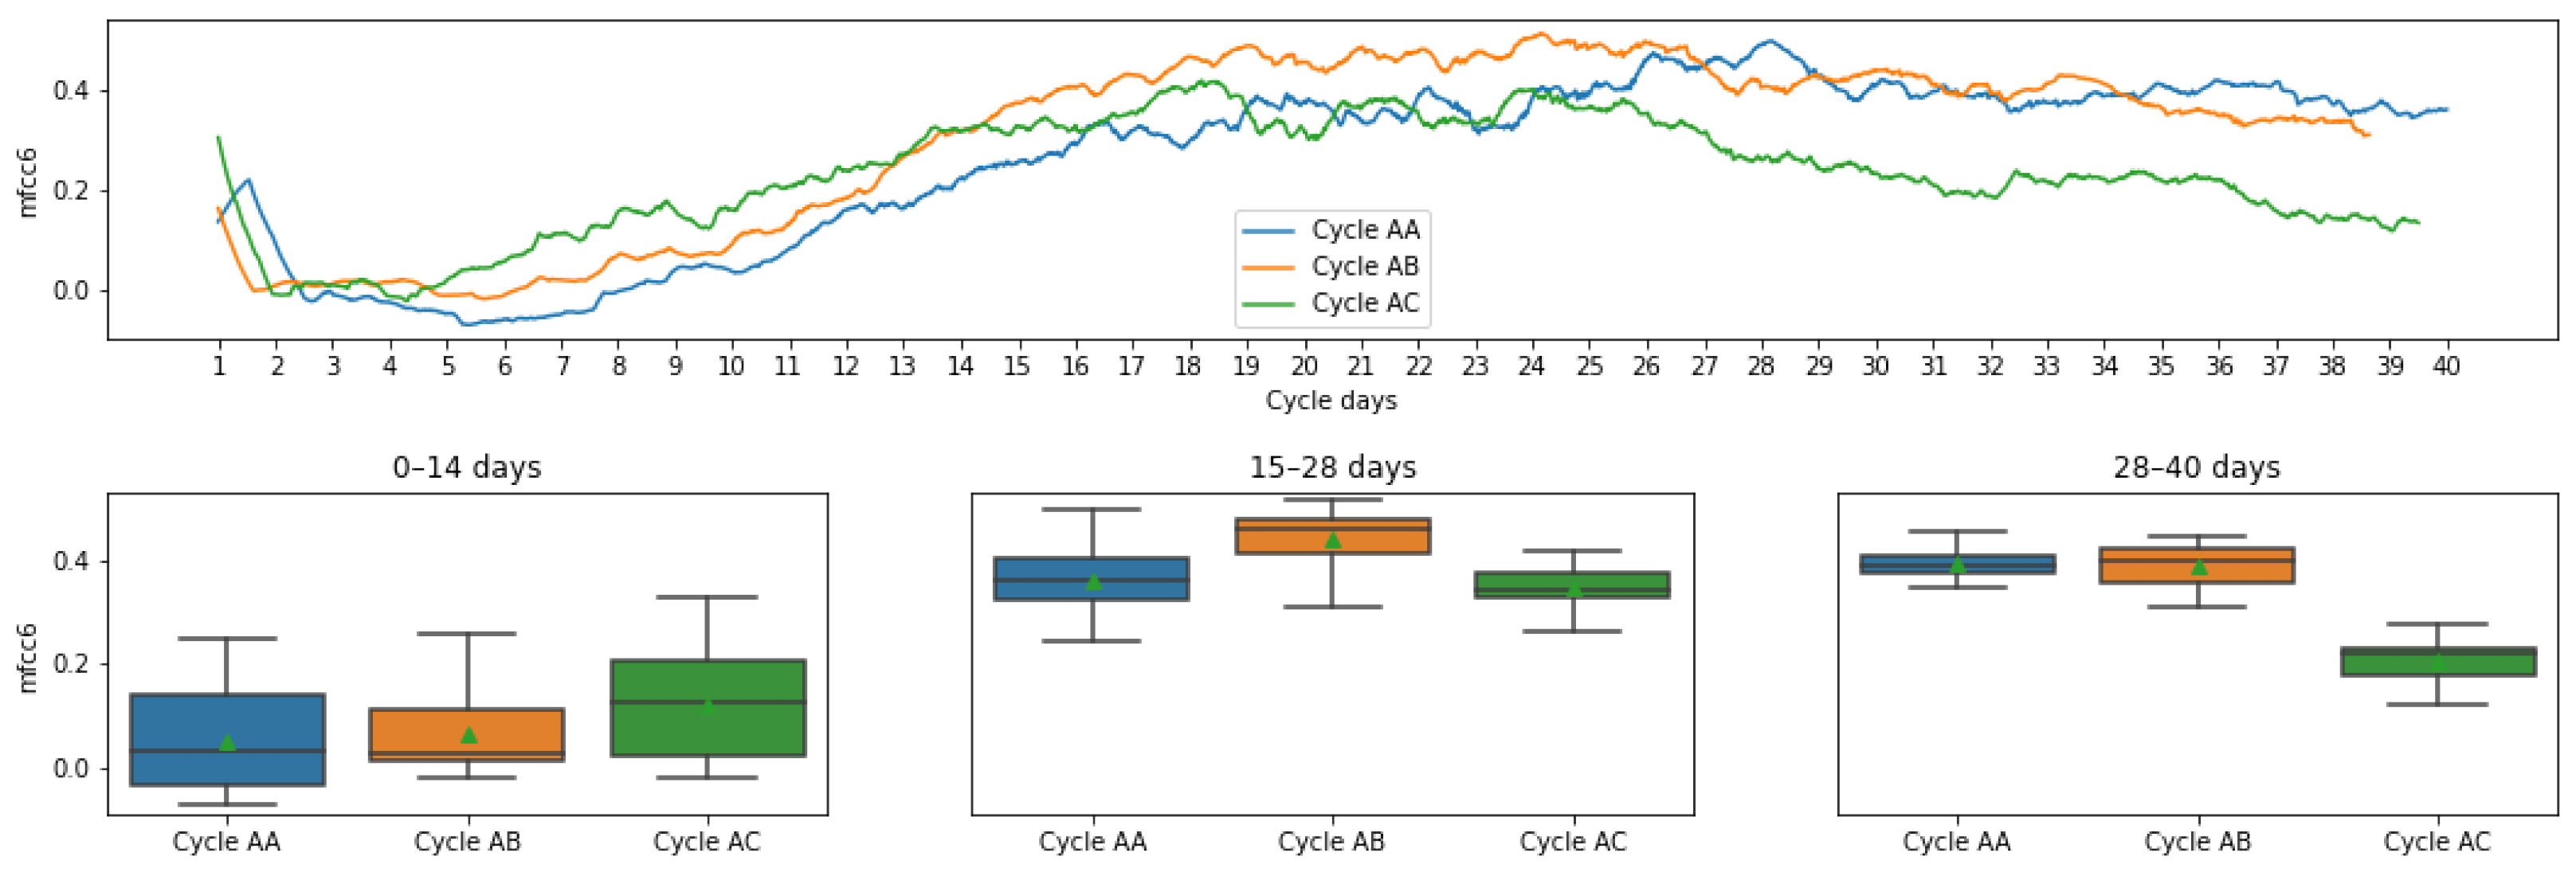
Figure 5 shows in the first row the MFCC 6 values every 15 min with tendency of a increasing curve after day two until twenty fourth day when it is stable. Second row contains data plotted in box-plots per cycle and interval. The Cycle AC has the lowest values with respect to the other cycles in 28–40 days interval. Cycle AB and AC have similar means and deviation especially in period 0–14 and 28–40.
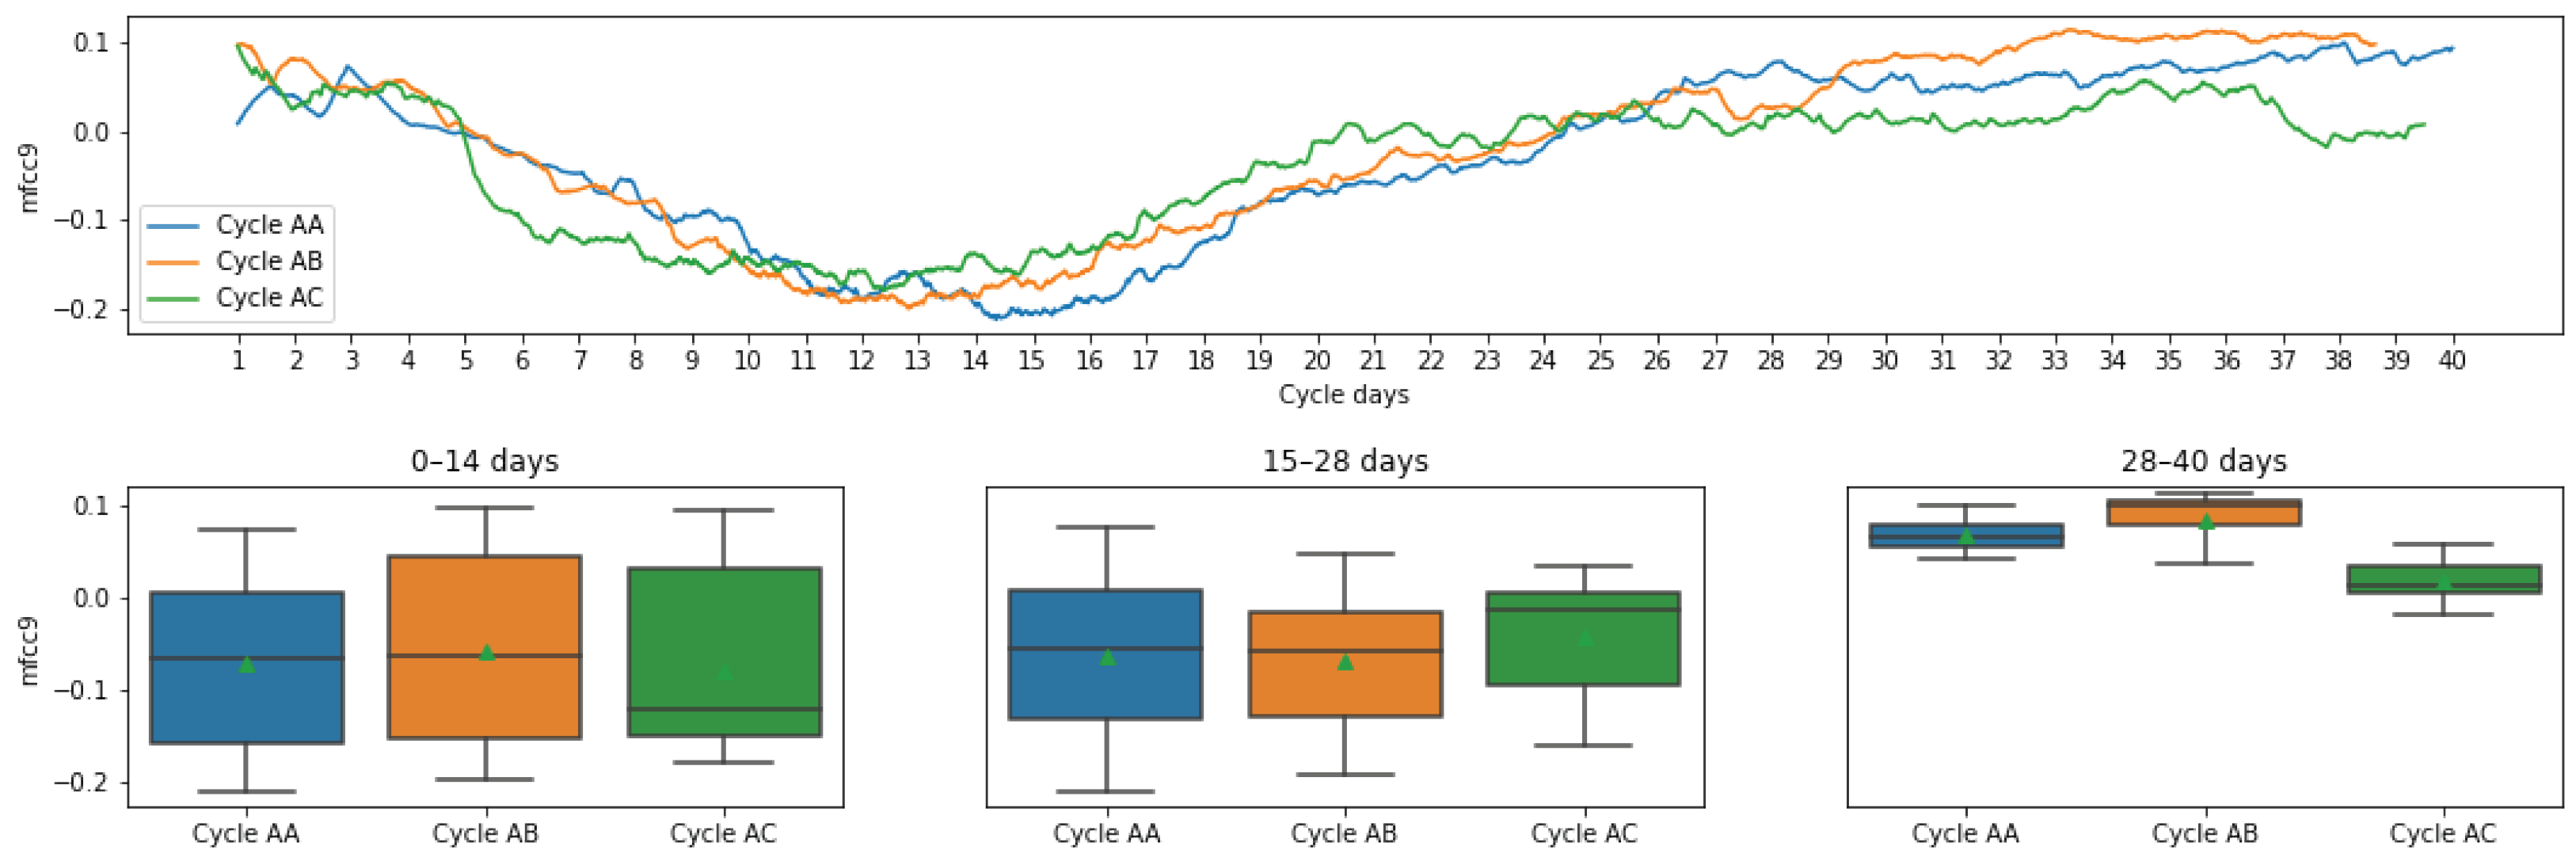
Figure 6 shows the behaviour of MFCC 9 in the three cycles. The studied feature starts to slowly decrease until day 13, from where it starts to increase for the rest of the cycle. The results show similar tendencies during all the three cycles. From the box-plots, it can be clearly seen that the first two life’s interval have similar means among the cycles and a higher deviation compared to the last interval.
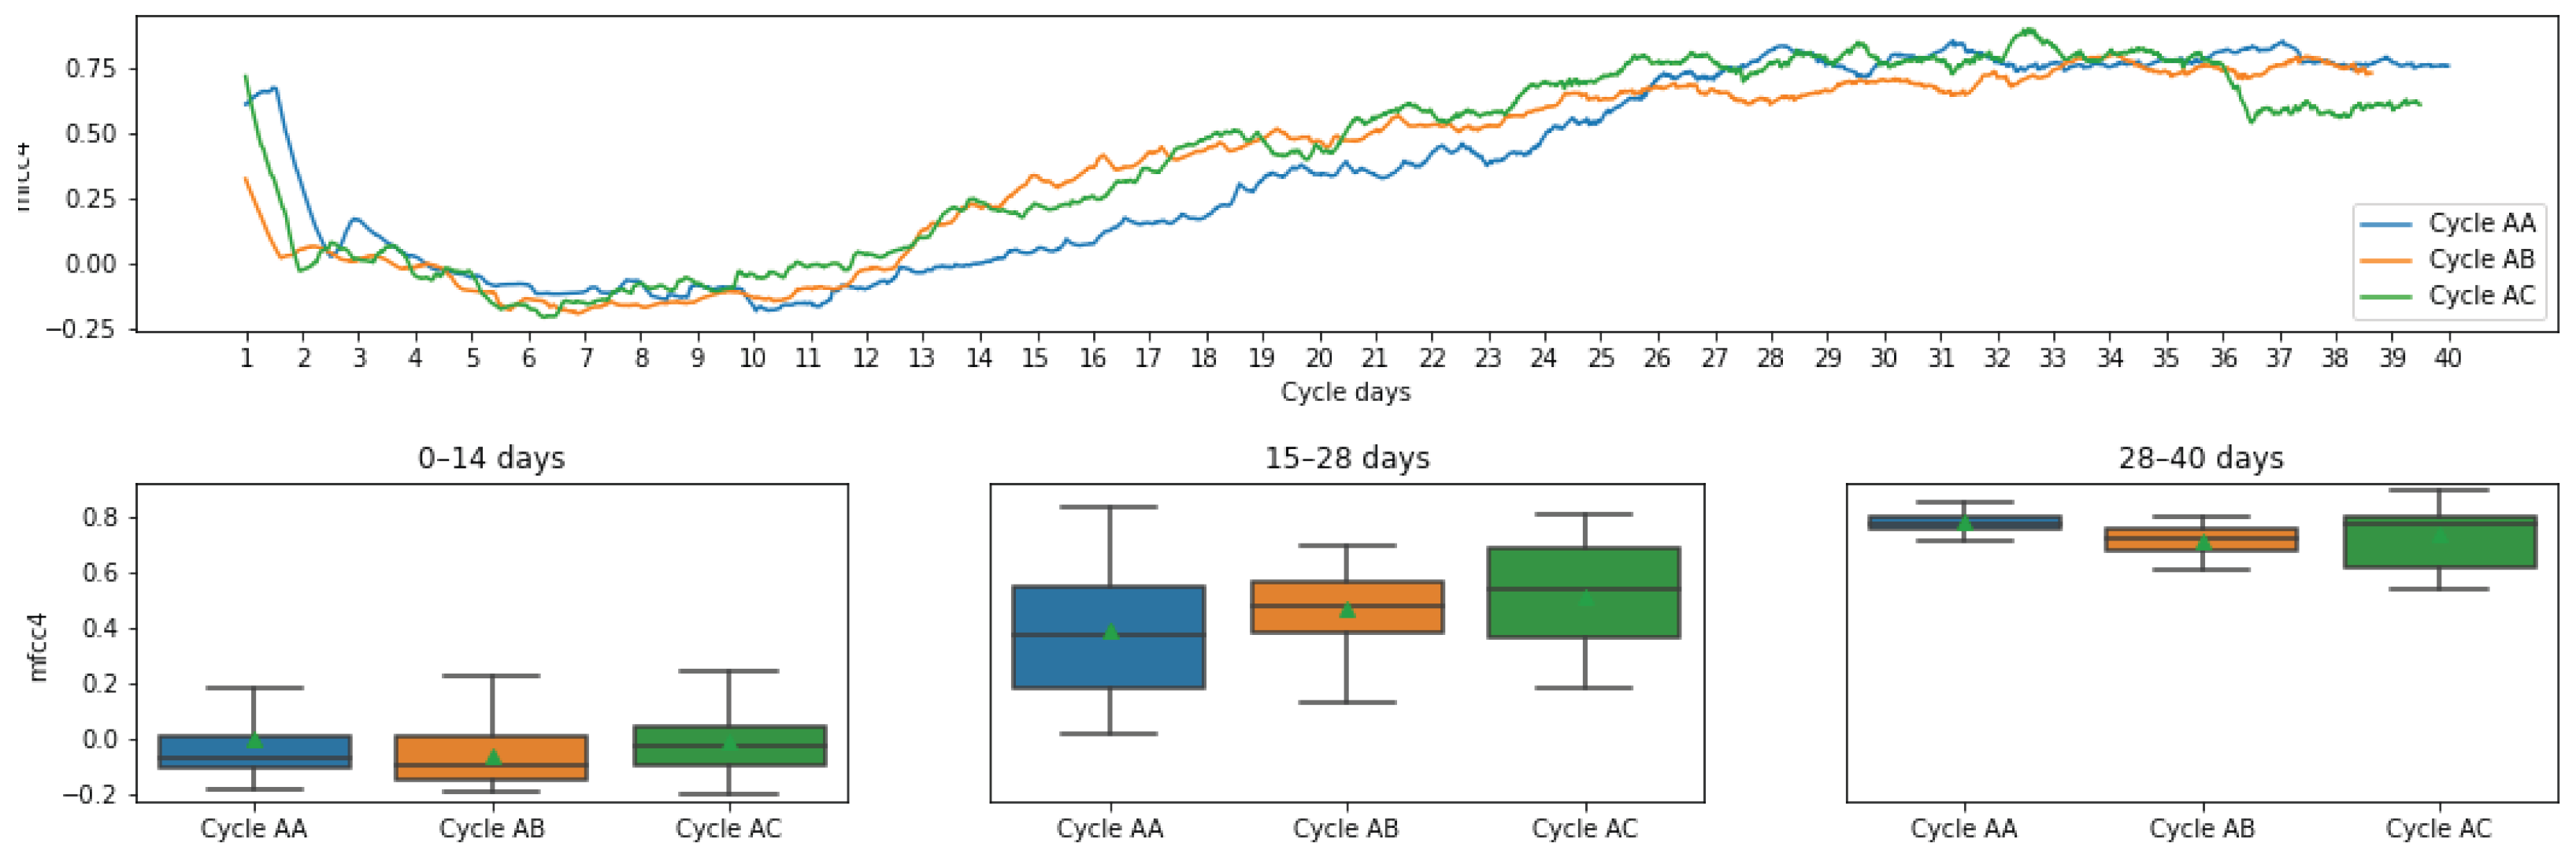
Figure 7 shows MFCC 4 values in the three different cycles. Curve starts decreasing the first two days and then it starts to increase for the rest of the cycle. The results show similar tendencies in the three cycles, being the cycle AA slightly different in the interval from day 15 to day 28. The box-plots clearly show that the first and the last life’s interval have similar means between cycles and less deviation compared with 15–28 days period.
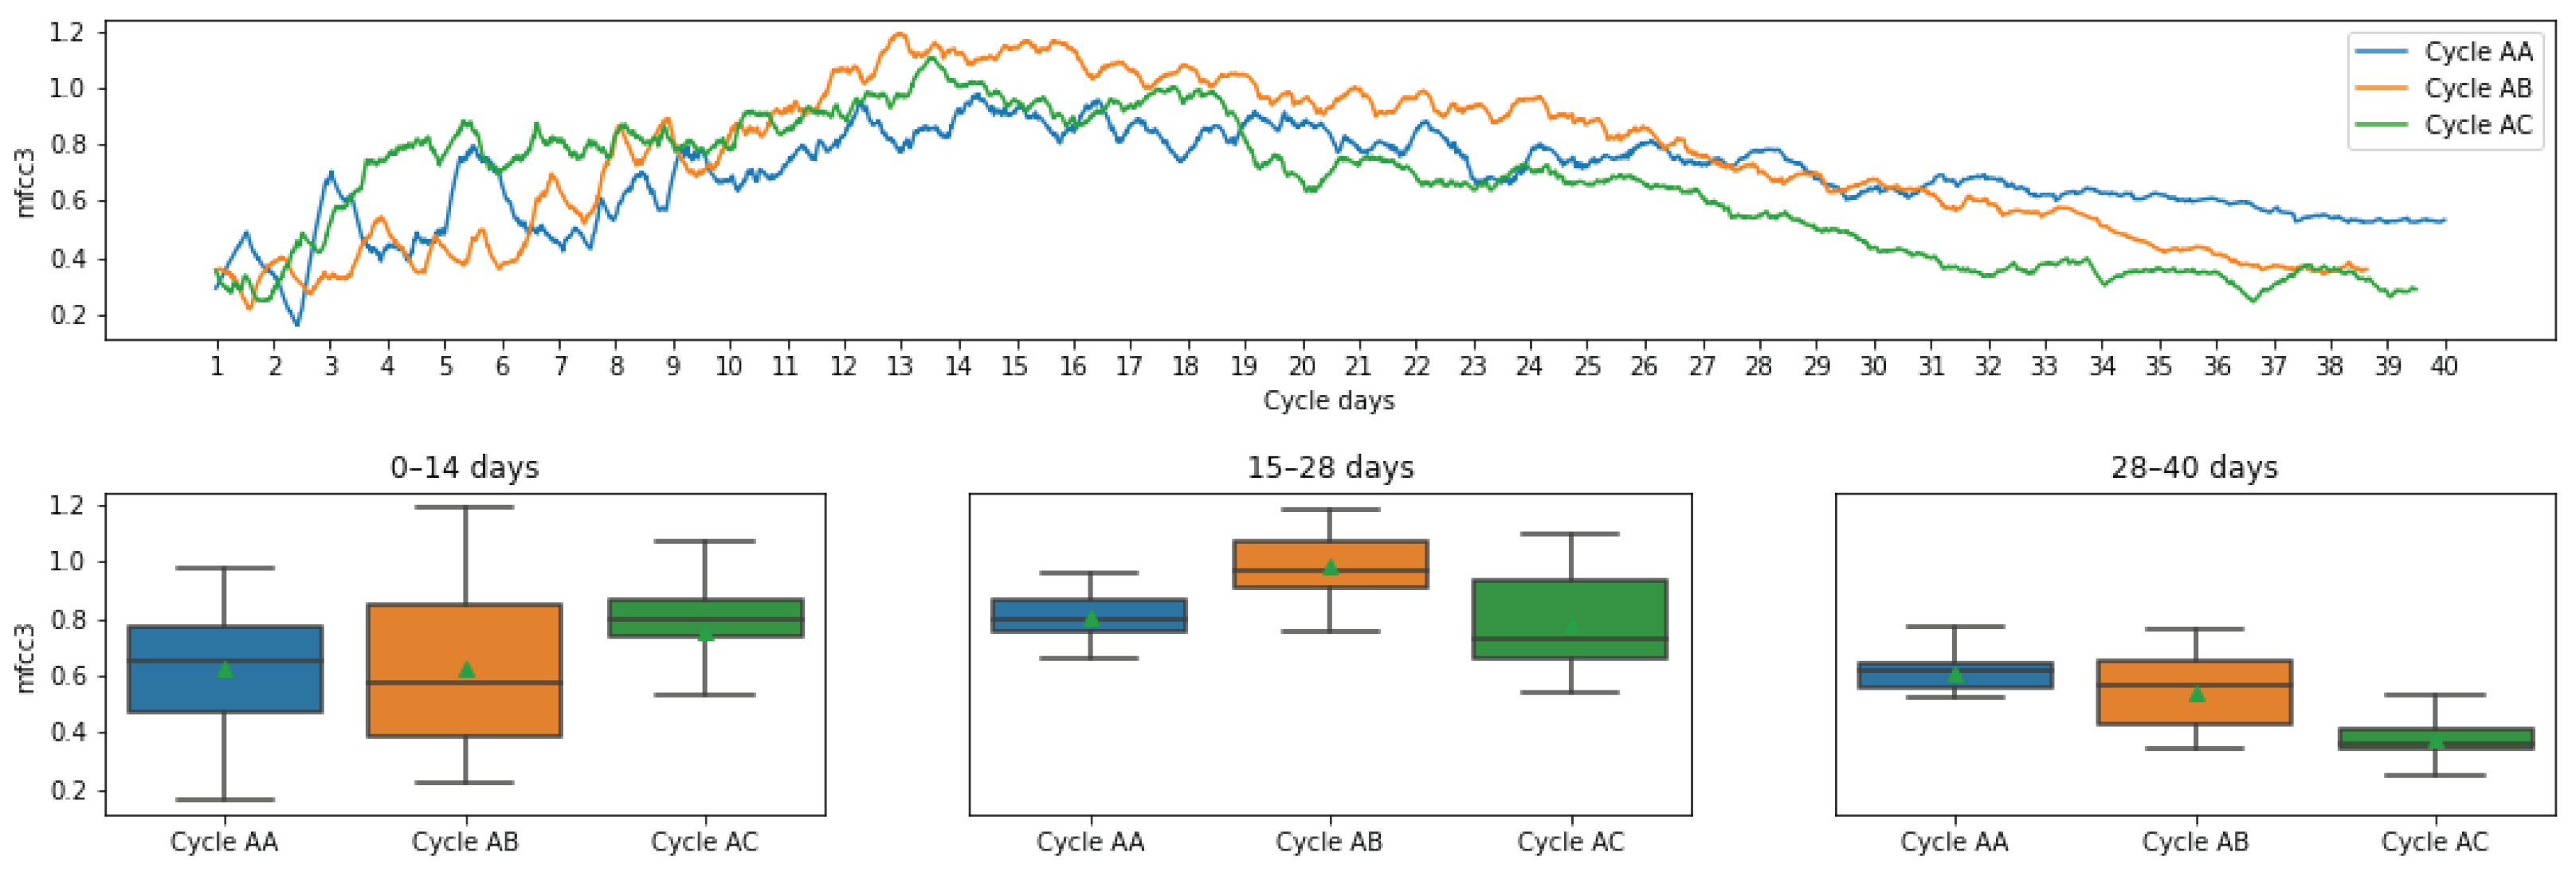
Figure 8 shows how MFCC 3 behaves in the different cycles. The descriptor has an initial increase in the first fourteen days and then it begins to slowly decrease.
4.4. Comparative of Features between Farms
Farm A and B, with different animal density, management routines and machinery, have deployed an identical acquisition system. The acoustic data obtained in both houses can be compared and a semblance analysis of characteristics can be performed regardless of ambient and management practices noises. For this study, farm A has the data of the three cycles.
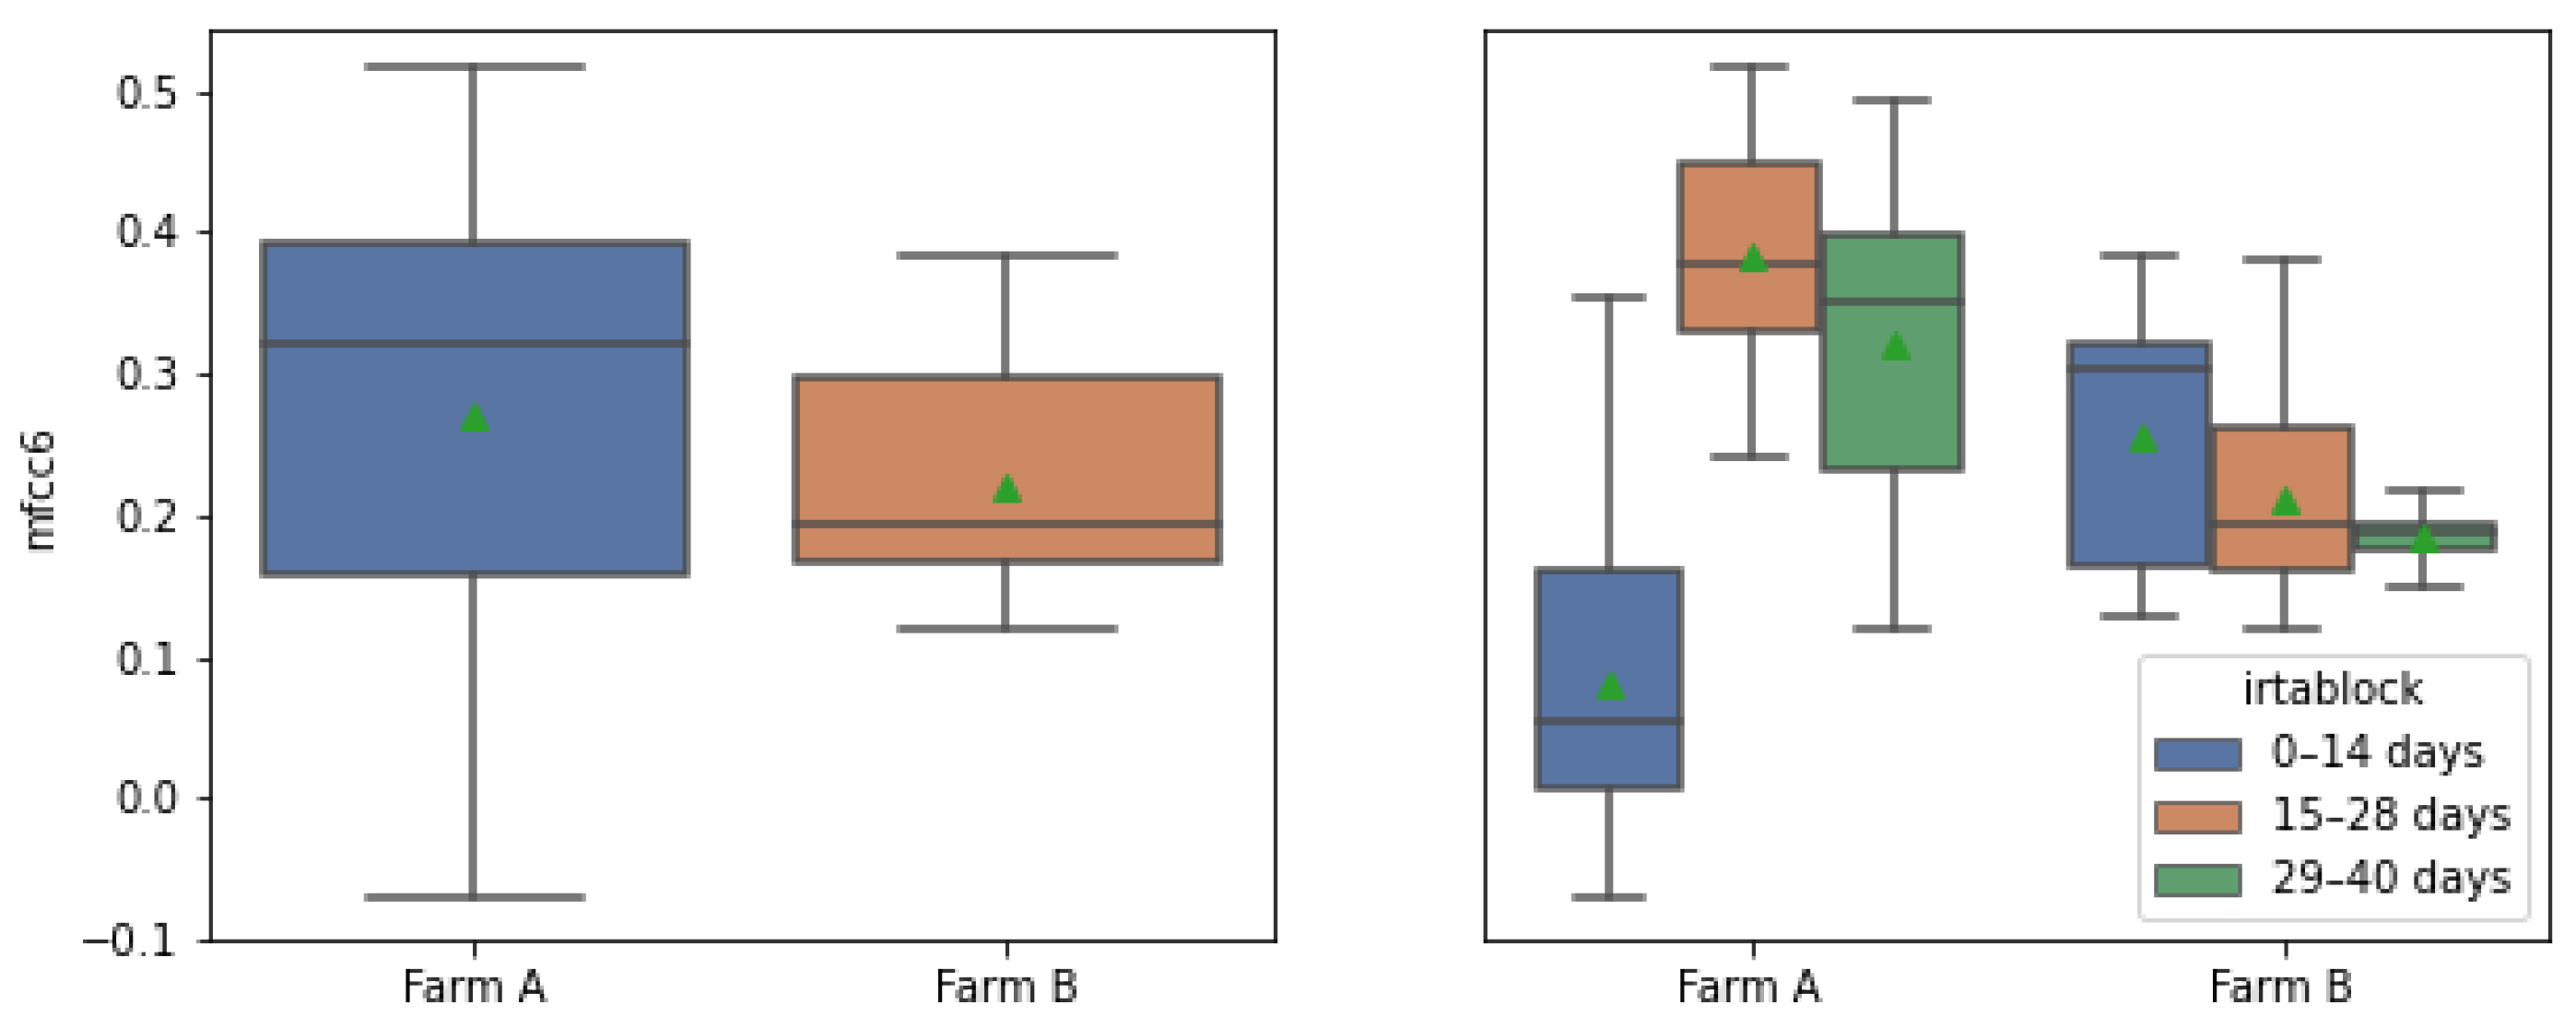
Figure 9 shows the comparative with the feature MFCC 6. Farm A has higher mean and median values. Moreover, the tendency between intervals 15–28 and 29–40 days in both farms decreased. Except from first interval with a notable value reduction in farm A.
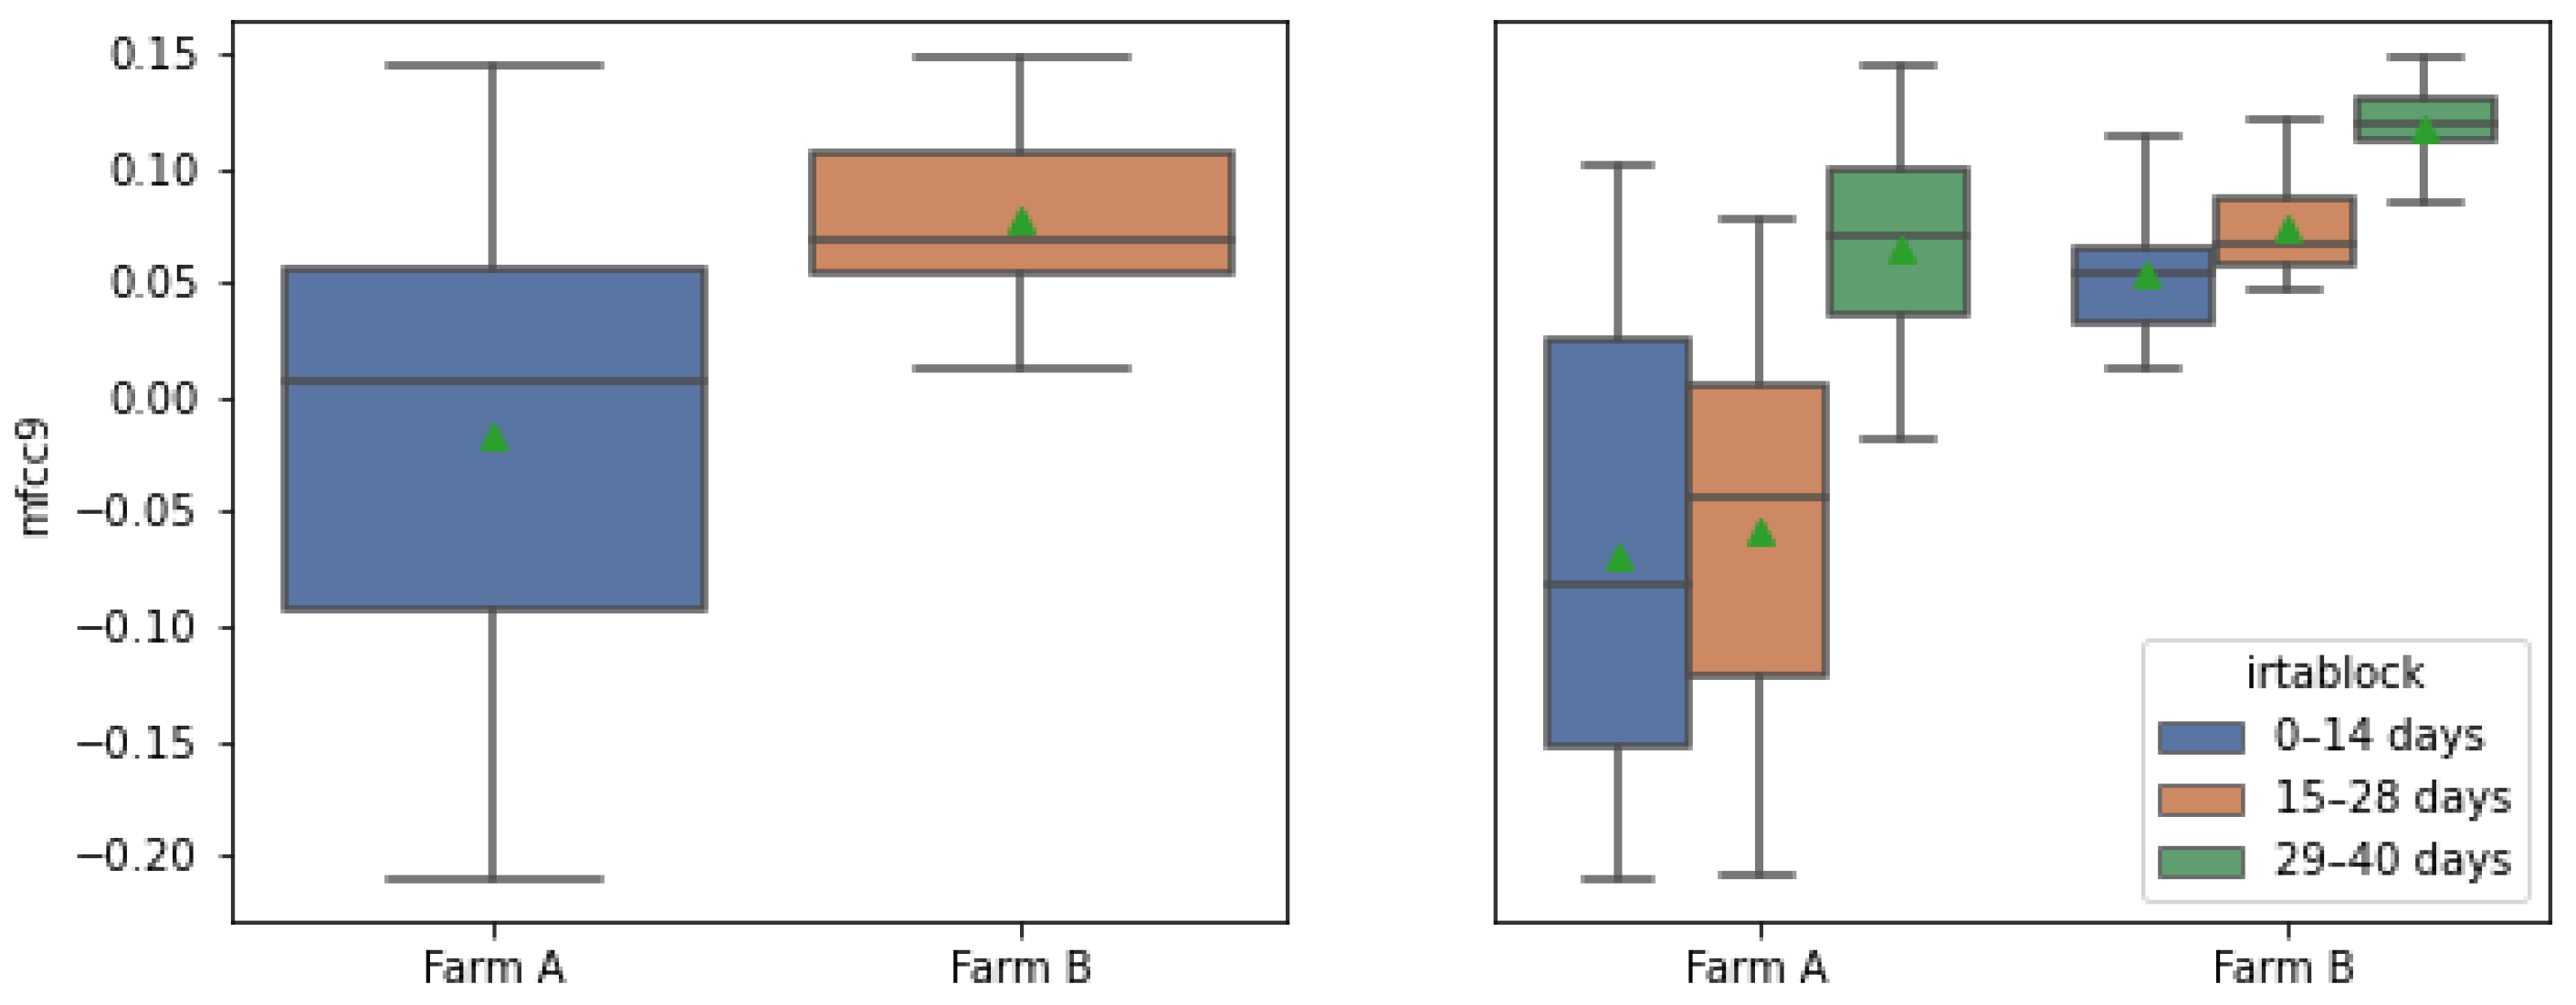
Figure 10 shows the comparative with the feature MFCC 9. Farm A has higher mean and median. On the other hand, the tendency between intervals in both farms are very similar and increasing.
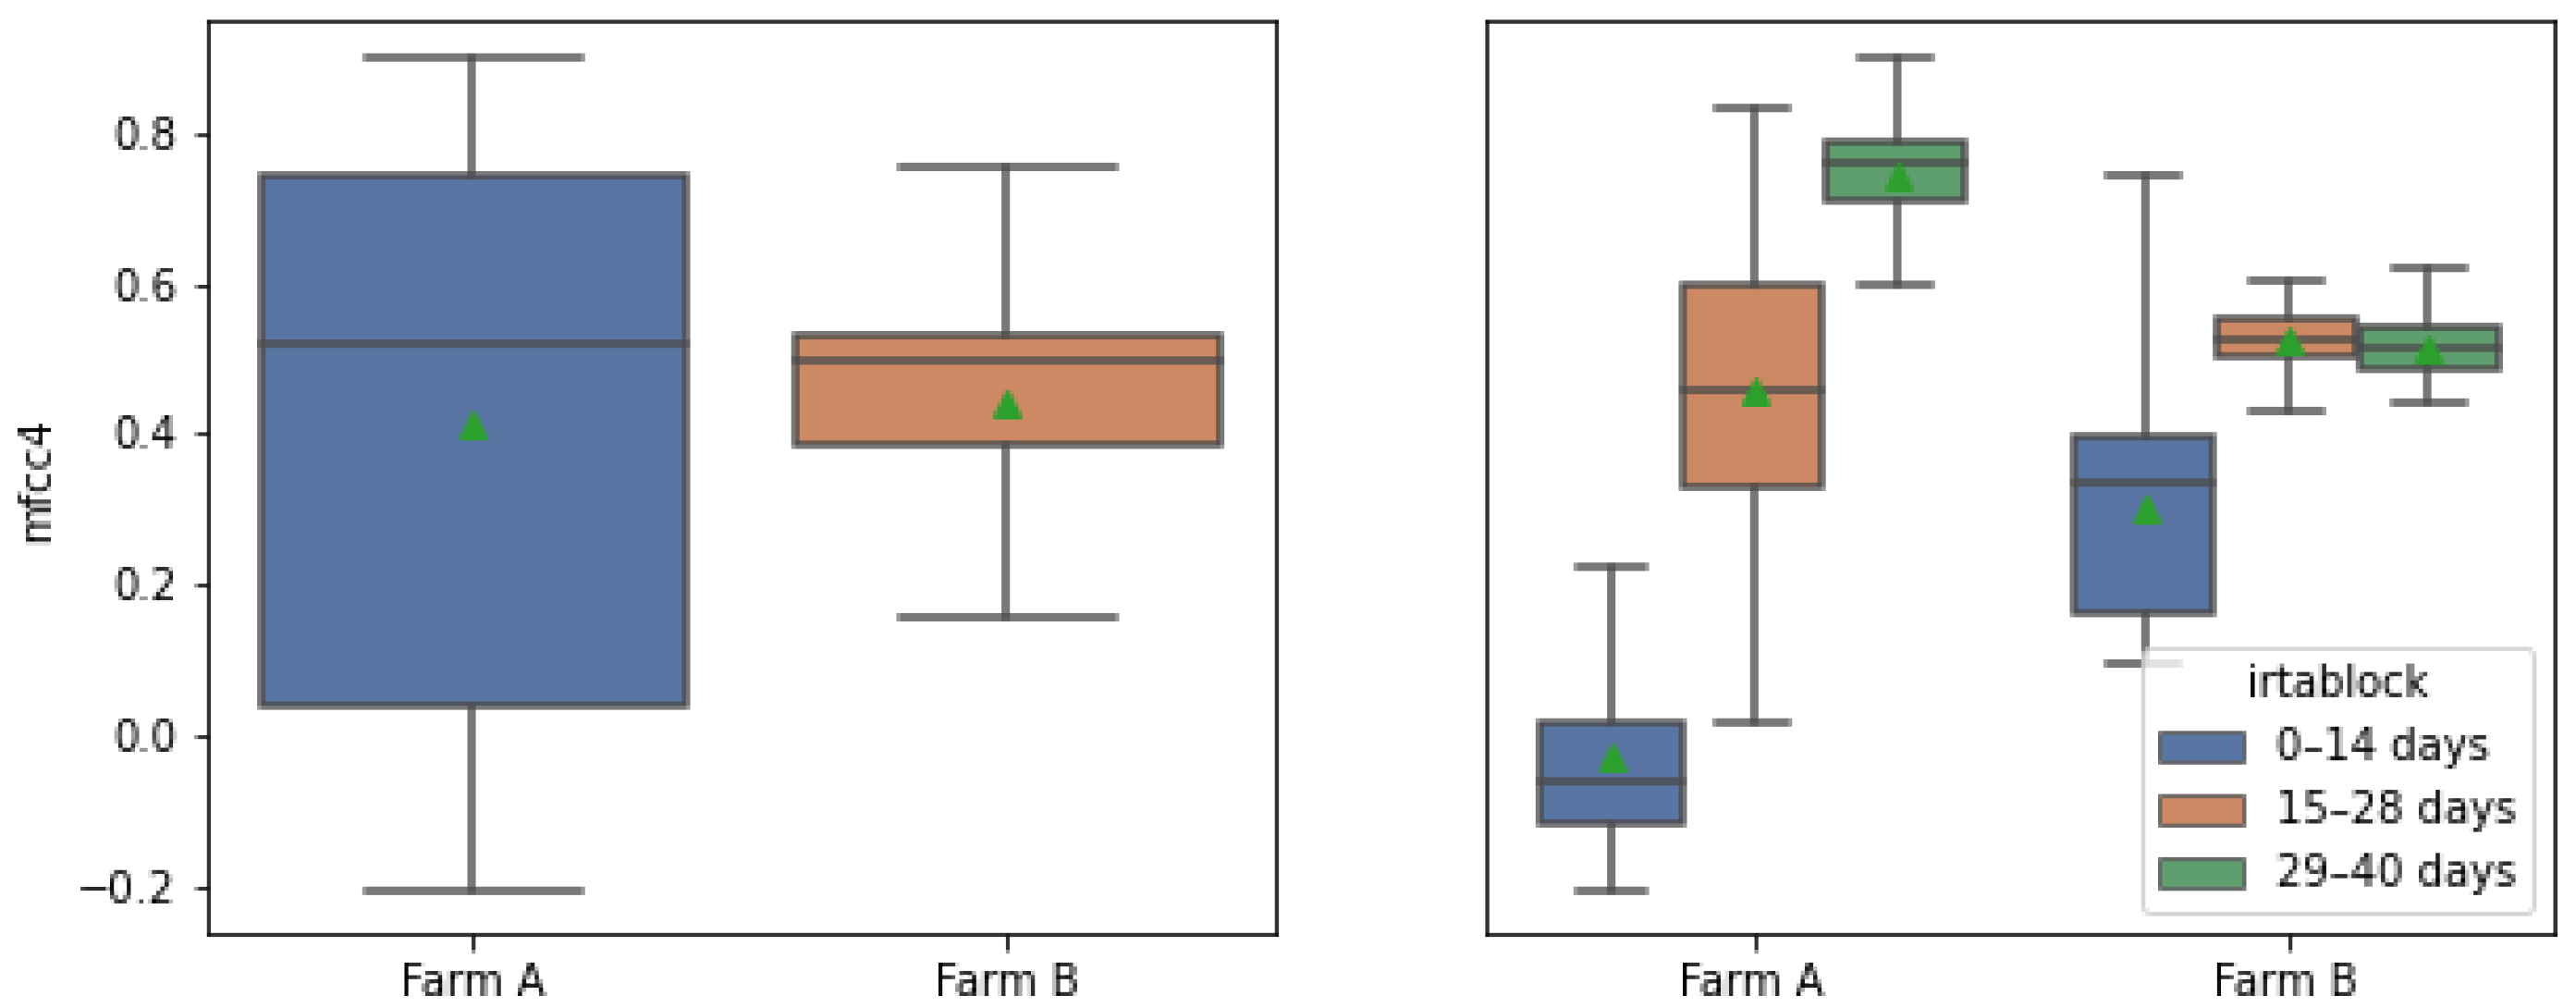
Figure 11 shows the comparative with the feature MFCC 4. Both farms have similar means and medians, but Farm B has a reduced variance. Otherwise, the tendency between intervals in both farms are different, Farm A intervals follows an increasing curve that in farm B is stable in the last two intervals.
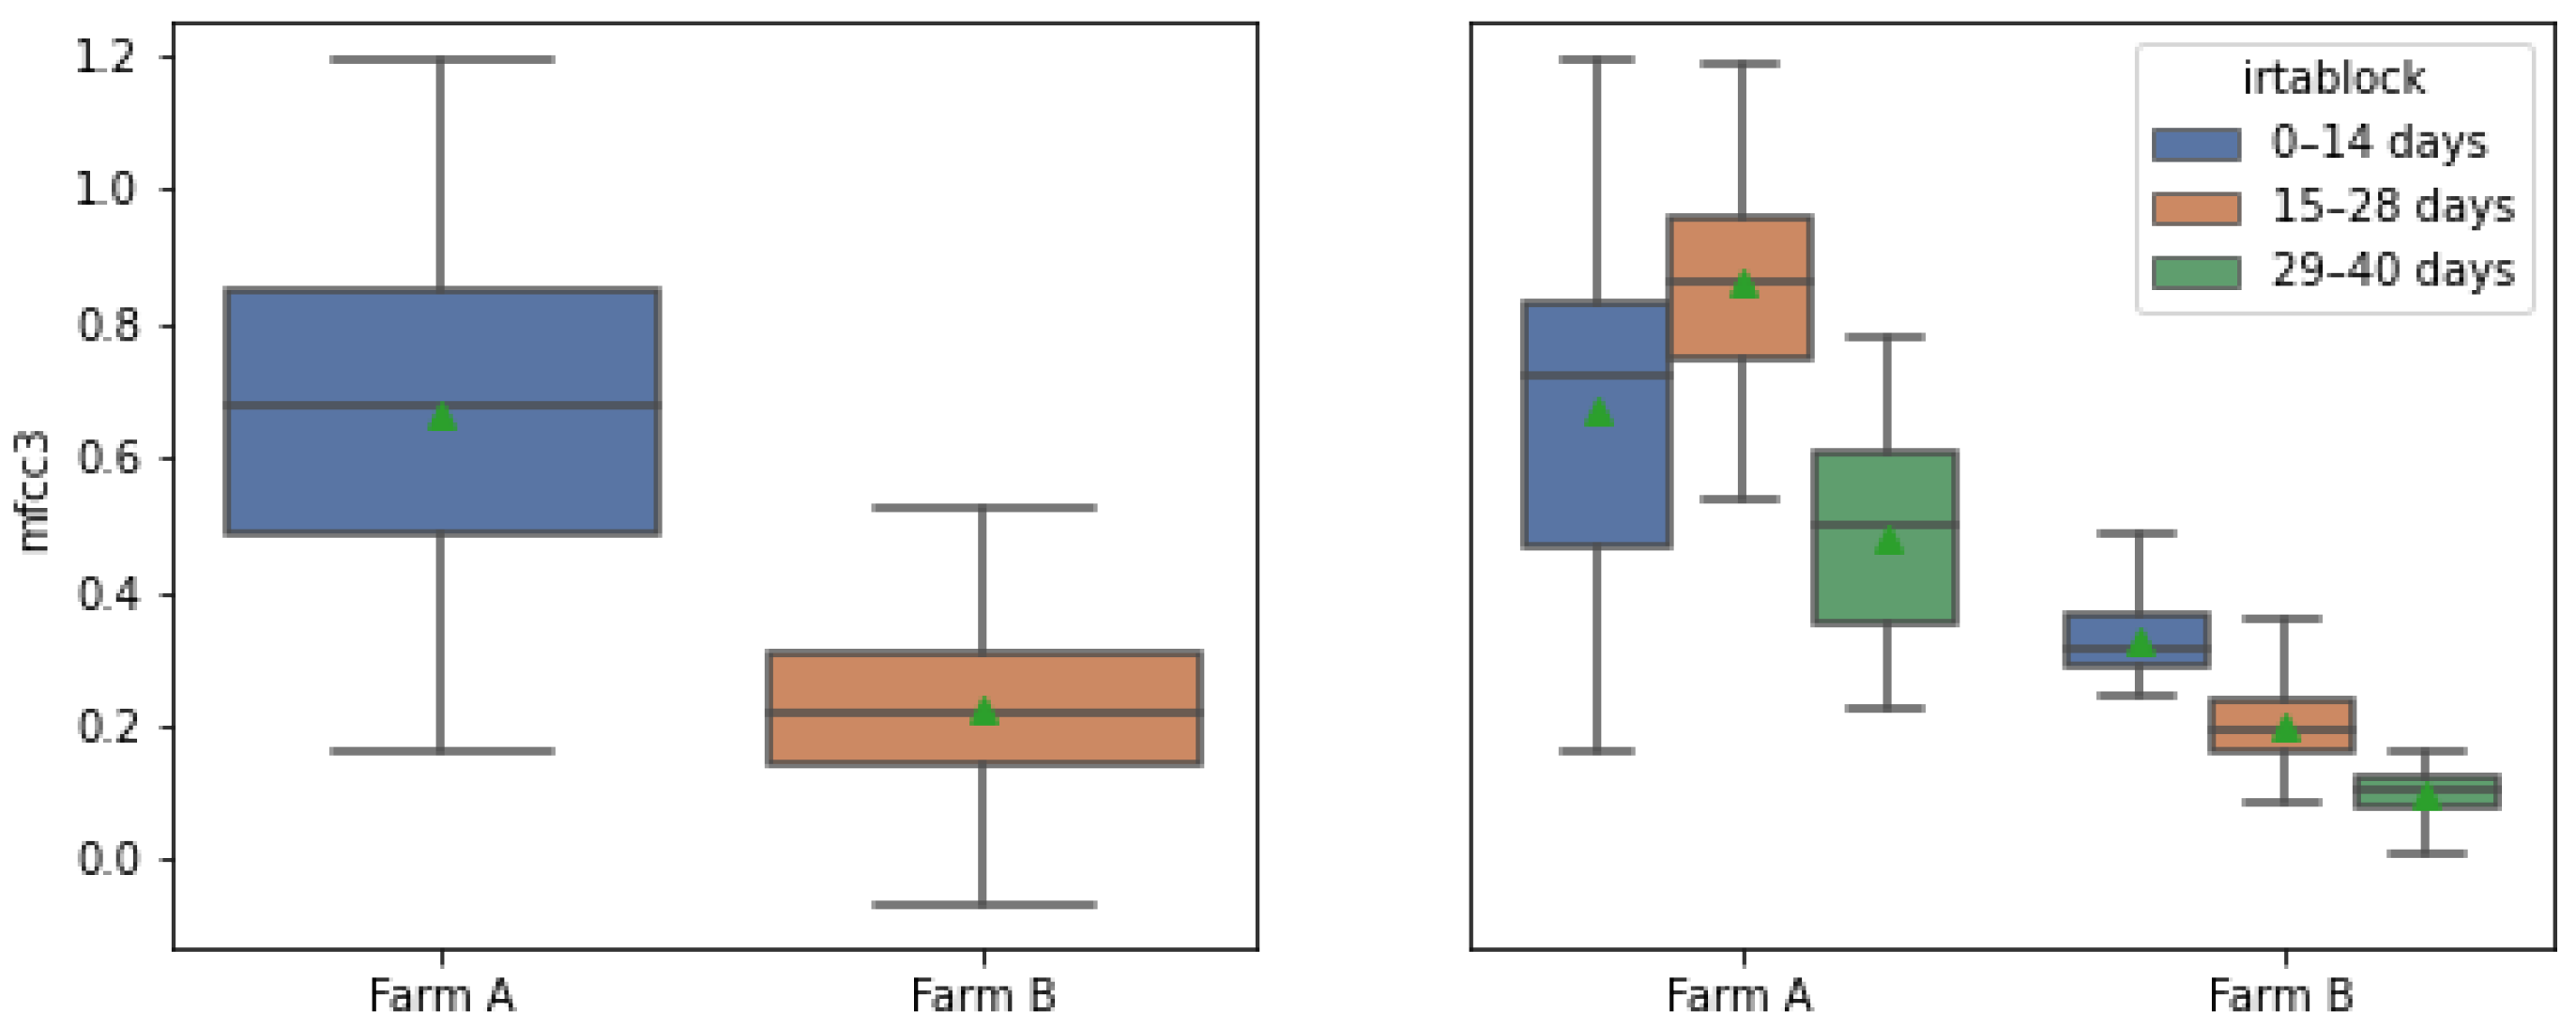
Figure 12 shows the comparative with the feature MFCC 3. Each farm has different means, and Farm B has a reduced variance. Otherwise, the tendency between intervals in both farms decrease in intervals 15–28 and 29–40 days and have similar tendency.
5. Discussion
The feature importance algorithm has ranked the attributes according to the link with the CO concentration. The analysed features with a total importance of 58% could be related to the animals’ vocalization.
CO is reduced when the fan is ventilating the environment with fresh air from outside, this link is detected by the acoustical system. Unexpectedly for the authors, the pitch and vocalNum attributes apparently do not show biological response to the gas concentration.
The most related features listed in decreasing order found in MFCC 6, 9, 4, and 3 correspond to vocal tract modulation of the chicks and compress information of their well-being and expressions. When analysing them for three consecutive production cycles on the same farm in the intervals 0–14, 15–28 and 29–40, it appears that the first two intervals have more variations in the value of the characteristics, although the daily curves are very similar.
Comparing the acoustical features between farms shows that mean and variations are different in values. It is also observed that the last two periods of the birds’ life have the same tendency, except for MFCC 4.
6. Conclusions
Filtering raw audio data by a ZCR threshold and applying an exponential smoother filter reduces the pitch frequency difference of the birds at the same instant as other cycles. This filter is used as a method to obtain smooth invariant attributes by reducing the punctual management noise sounds from humans and machines from the bird’s vocalisations.
From the acoustical features, MFCC 6, 9, 4, and 3 a feature importance algorithm has found a link with the concentration of CO with an aggregated importance of 0.5882 over 1 listed previously by importance. As observed in the analysis, the first period of a bird’s life from 0–14 has the highest variation and different feature values, while the following two intervals have more similar tendencies. Among the most significant characteristics, MFCC 9 is the most noise-independent attribute of farm management practices, with similar performance and representativeness, more accurately suggesting the behaviour of chickens with respect to the concentration of carbon dioxide in the environment. Feature data with independent behaviour from farms’ noise can help in the future to anticipate animals’ calls due to high levels of gas with bioacoustics sensors.
Author Contributions
G.J.G.-P. led the field work collecting the audio data, processing the dataset, and participated in writing the entire paper. R.M.A.-P. and I.I.S. supported the signal processing section and participated in writing and reviewing the entire paper. S.R. supported the investigation and methodology and reviewed the paper. T.G.D. supported data curation, software and participated in writing and reviewing the entire paper. T.P.M. supported the field work, reviewing the entire paper and has been the project administrator and funding acquisition. E.A.E. suggested part of the study and reviewed the paper. All authors have read and agreed to the published version of the manuscript.
Funding
This research has been cofinanced by Cealvet SLu and the Euro Founding Eurostars project E114423-ITAM.
Institutional Review Board Statement
Ethical review and approval were waived for this study due to the use of a non-invasive sound pickup method installed prior to animals being on the farm and removed after the animals have been produced. Access to the farm has always been in compliance with bio-security standards.
Informed Consent Statement
Not applicable.
Data Availability Statement
Not applicable.
Acknowledgments
The authors would like to thank Padesa company of poultry farming who offers products of the highest quality and ensuring a healthy diet, always committed to society and the local environment. We would also like to thanks Jose Manuel and Ramón Esteller for his knowledge and allowing us to study his commercial chicken farm, and for all the help during the process.
Conflicts of Interest
The authors declare no conflict of interest.
Abbreviations
The following abbreviations are used in this manuscript:
| K-NN | K-Nearest Neighbors |
| LightGBM | Light Gradient Boosting Machine |
| MAE | Mean Absolute Error |
| MAPE | Mean Absolute Percentual Error |
| ML | Machine Learning |
| PCA | Principal Component Analysis |
| PLS | Partial Least Squares |
| RF | Random Forest |
| RMSE | Root Mean Squared Error |
References
- Bachert, K.E. Measuring Behaviors in Agricultural Animals Using Technological Sensors. Ph.D. Thesis, University of California, Davis, CA, USA, 2021. [Google Scholar]
- Banhazi, T.M.; Lehr, H.; Black, J.; Crabtree, H.; Schofield, P.; Tscharke, M.; Berckmans, D. Precision livestock farming: An international review of scientific and commercial aspects. Int. J. Agric. Biol. Eng. 2012, 5, 1–9. [Google Scholar]
- Berckmans, D. Precision livestock farming technologies for welfare management in intensive livestock systems. Rev. Sci. Tech. 2014, 33, 189–196. [Google Scholar] [CrossRef] [PubMed]
- Calvet, S.; Estellés, F.; Cambra-López, M.; Torres, A.; Van den Weghe, H. The influence of broiler activity, growth rate, and litter on carbon dioxide balances for the determination of ventilation flow rates in broiler production. Poult. Sci. 2011, 90, 2449–2458. [Google Scholar] [CrossRef]
- Lambooij, E.; Gerritzen, M.; Engel, B.; Hillebrand, S.; Lankhaar, J.; Pieterse, C. Behavioural responses during exposure of broiler chickens to different gas mixtures. Appl. Anim. Behav. Sci. 1999, 62, 255–265. [Google Scholar] [CrossRef]
- Gerritzen, M.; Lambooij, B.; Reimert, H.; Stegeman, A.; Spruijt, B. On-farm euthanasia of broiler chickens: Effects of different gas mixtures on behavior and brain activity. Poult. Sci. 2004, 83, 1294–1301. [Google Scholar] [CrossRef]
- Chloupek, P.; Voslářová, E.; Chloupek, J.; Bedáňová, I.; Pištěková, V.; Večerek, V. Stress in broiler chickens due to acute noise exposure. Acta Vet. Brno 2009, 78, 93–98. [Google Scholar] [CrossRef]
- Frewer, L.; Kole, A.; Kroon, S.; Lauwere, C. Consumer Attitudes Towards the Development of Animal-Friendly Husbandry Systems. J. Agric. Environ. Ethics 2005, 18, 345–367. [Google Scholar] [CrossRef]
- Clark, B.; Stewart, G.B.; Panzone, L.A.; Kyriazakis, I.; Frewer, L.J. Citizens, consumers and farm animal welfare: A meta-analysis of willingness-to-pay studies. Food Policy 2017, 68, 112–127. [Google Scholar] [CrossRef]
- Veissier, I.; Butterworth, A.; Bock, B.; Roe, E. European approaches to ensure good animal welfare. Appl. Anim. Behav. Sci. 2008, 113, 279–297. [Google Scholar] [CrossRef]
- Starke, P. Comparative Welfare State Politics. Public Adm. 2017, 95, 286–288. [Google Scholar] [CrossRef]
- Manteuffel, G.; Puppe, B.; Schön, P.C. Vocalization of farm animals as a measure of welfare. Appl. Anim. Behav. Sci. 2004, 88, 163–182. [Google Scholar] [CrossRef]
- Fedurek, P.; Zuberbühler, K.; Dahl, C.D. Sequential information in a great ape utterance. Sci. Rep. 2016, 6, 38226. [Google Scholar] [CrossRef] [PubMed]
- Briefer, E.; Comber, S. Vocal expression of emotions in mammals: Mechanisms of production and evidence. J. Zool. 2012, 288. [Google Scholar] [CrossRef]
- Neethirajan, S.; Reimert, I.; Kemp, B. Measuring farm animal emotions—Sensor-based approaches. Sensors 2021, 21, 553. [Google Scholar] [CrossRef]
- Michael, P.; Mcloughlin, R.S.; McElligott, A.G. Automated bioacoustics: Methods in ecology and conservation and their potential for animal welfare monitoring. J. R. Soc. Interface 2019, 16. [Google Scholar] [CrossRef]
- Vandermeulen, J.; Bahr, C.; Tullo, E.; Fontana, I.; Ott, S.; Kashiha, M.; Guarino, M.; Moons, C.; Tuyttens, F.; Niewold, T.; et al. Discerning pig screams in production environments. PLoS ONE 2015, 10, e0123111. [Google Scholar] [CrossRef]
- Watts, J.; Stookey, J. Vocal behaviour in cattle: The animal’s commentary on its biological processes and welfare. Appl. Anim. Behav. Sci. 2000, 67, 15–33. [Google Scholar] [CrossRef]
- Fontana, I.; Tullo, E.; Scrase, A.; Butterworth, A. Vocalisation sound pattern identification in young broiler chickens. Animal 2016, 10, 1567–1574. [Google Scholar] [CrossRef]
- Bishop, J.C.; Falzon, G.; Trotter, M.; Kwan, P.; Meek, P.D. Livestock vocalisation classification in farm soundscapes. Comput. Electron. Agric. 2019, 162, 531–542. [Google Scholar] [CrossRef]
- Whitaker, B.M.; Carroll, B.T.; Daley, W.; Anderson, D.V. Sparse decomposition of audio spectrograms for automated disease detection in chickens. In Proceedings of the 2014 IEEE Global Conference on Signal and Information Processing (GlobalSIP), Atlanta, GA, USA, 3–5 December 2014; pp. 1122–1126. [Google Scholar]
- Lee, J.; Noh, B.; Jang, S.; Park, D.; Chung, Y.; Chang, H.H. Stress detection and classification of laying hens by sound analysis. Asian-Australas. J. Anim. Sci. 2015, 28, 592. [Google Scholar] [CrossRef]
- Moura, D.J.d.; Nääs, I.d.A.; Alves, E.C.d.S.; Carvalho, T.M.R.d.; Vale, M.M.d.; Lima, K.A.O.d. Noise analysis to evaluate chick thermal comfort. Sci. Agric. 2008, 65, 438–443. [Google Scholar] [CrossRef]
- Herborn, K.A.; McElligott, A.G.; Mitchell, M.A.; Sandilands, V.; Bradshaw, B.; Asher, L. Spectral entropy of early-life distress calls as an iceberg indicator of chicken welfare. J. R. Soc. Interface 2020, 17, 20200086. [Google Scholar] [CrossRef] [PubMed]
- Axiu, M.; Giraudet, C.; Kai, L.; Nolasco, I.D.A.; Xie, Z.; Xie, Z.; Gao, Y.; Theobald, J.; Bhatta, D.; Stewart, R.; et al. Automated identification of chicken distress vocalisations using deep learning models. bioRxiv 2021. [Google Scholar] [CrossRef]
- Laurijs, K.A.; Briefer, E.F.; Reimert, I.; Webb, L.E. Vocalisations in farm animals: A step towards positive welfare assessment. Appl. Anim. Behav. Sci. 2021, 236, 105264. [Google Scholar] [CrossRef]
- Alsina-Pagès, R.M.; Llonch, P.; Ginovart-Panisello, G.J.; Guevara, R.; Freixes, M.; Castro, M.; Duboc, L.; Mainau, E. Dairy Cattle Welfare through Acoustic Analysis: Preliminary results of acoustic environment description. In Proceedings of the EURONOISE 2021, Medeira, Portugal, 25–27 October 2021. [Google Scholar]
- Alsina-Pagès, R.M.; Llonch, P.; Ginovart-Panisello, G.J.; Guevara, R.; Freixes, M.; Castro, M.; Duboc, L.; Mainau, E. Assessment of Dairy Cattle Welfare through Acoustic Analysis: Preliminary results using a digital phonendoscope. In Proceedings of the DAGA 2021, Vienna, Austria, 15–18 August 2021. [Google Scholar]
- Ginovart-Panisello, G.J.; Riva, S.; Monjo, T.P.; Alsina-Pages, R.M. Changes in the characterization of newborn bird vocalisations during first 48-h of life-hours. In Proceedings of the EURONOISE 2021, Online, 25–27 October 2021. [Google Scholar]
- Ginovart-Panisello, G.J.; Alsina-Pagès, R.M.; Sanz, I.I.; Monjo, T.P.; Prat, M.C. Acoustic Description of the Soundscape of a Real-Life Intensive Farm and Its Impact on Animal Welfare: A Preliminary Analysis of Farm Sounds and Bird Vocalisations. Sensors 2020, 20, 4732. [Google Scholar] [CrossRef]
- Superlux ECM 999. Available online: http://www.superlux.com.tw/index.do (accessed on 21 February 2022).
- Beheringuer U-Phoria UM2. Available online: https://www.behringer.com/behringer/product?modelCode=P0AVV (accessed on 21 February 2022).
- Van Rossum, G.; Drake, F.L., Jr. Python Reference Manual; Centrum voor Wiskunde en Informatica: Amsterdam, The Netherlands, 1995. [Google Scholar]
- Xiph.Org Foundation. FLAC Format. Available online: https://xiph.org/flac/ (accessed on 20 March 2022).
- Ginovart-Panisello, G.J.; Alsina-Pagès, R.M. Preliminary Acoustic Analysis of Farm Management Noise and Its Impact on Broiler Welfare. Proceedings 2020, 42, 83. [Google Scholar] [CrossRef]
- Macelline, S.; Hyun Min, C.; Awanthika, H.; Wickramasuriya, S.; Jayasena, D.; Tharangani, R.; Zhang, J.; Heo, J.M. Determination of the Growth Performances and Meat Quality of Broilers Fed Saccharomyces cerevisiae as a Probiotic in Two Different Feeding Intervals. Korean J. Poult. Sci. 2017, 44, 161–172. [Google Scholar] [CrossRef]
- Curtin, R.R.; Daley, W.; Anderson, D.V. Classifying broiler chicken condition using audio data. In Proceedings of the 2014 IEEE Global Conference on Signal and Information Processing (GlobalSIP), Atlanta, GA, USA, 3–5 December 2014; pp. 1141–1144. [Google Scholar]
- Molau, S.; Pitz, M.; Schluter, R.; Ney, H. Computing Mel-frequency cepstral coefficients on the power spectrum. In Proceedings of the 2001 IEEE International Conference on Acoustics, Speech, and Signal Processing. Proceedings (Cat. No.01CH37221), Salt Lake City, UT, USA, 7–11 May 2001; Volume 1, pp. 73–76. [Google Scholar] [CrossRef]
- Rabiner, L. On the use of autocorrelation analysis for pitch detection. IEEE Trans. Acoust. Speech Signal Process. 1977, 25, 24–33. [Google Scholar] [CrossRef]
- Benesty, J.; Sondhi, M.M.; Huang, Y. Springer Handbook of Speech Processing; Springer: Berlin/Heidelberg, Germany, 2008; Volume 1. [Google Scholar]
- Mahdavian, A.; Minaei, S.; Marchetto, P.M.; Almasganj, F.; Rahimi, S.; Yang, C. Acoustic features of vocalization signal in poultry health monitoring. Appl. Acoust. 2021, 175, 107756. [Google Scholar] [CrossRef]
- Alsina-Pagès, R.M.; Orga, F.; Alías, F.; Socoró, J.C. A WASN-Based Suburban Dataset for Anomalous Noise Event Detection on Dynamic Road-Traffic Noise Mapping. Sensors 2019, 19, 2480. [Google Scholar] [CrossRef]
- Carroll, B.T.; Anderson, D.V.; Daley, W.; Harbert, S.; Britton, D.F.; Jackwood, M.W. Detecting symptoms of diseases in poultry through audio signal processing. In Proceedings of the 2014 IEEE Global Conference on Signal and Information Processing (GlobalSIP), Atlanta, GA, USA, 3–5 December 2014; pp. 1132–1135. [Google Scholar]
- tsmoothie 1.0.4. Available online: https://github.com/cerlymarco/tsmoothie (accessed on 1 March 2022).
- Golub, G.H.; Van Loan, C.F. Matrix Computations; JHU Press: Baltimore, MD, USA, 2013; p. 15. [Google Scholar]
- Zien, A.; Krämer, N.; Sonnenburg, S.; Rätsch, G. The Feature Importance Ranking Measure. In Proceedings of the Machine Learning and Knowledge Discovery in Databases; Buntine, W., Grobelnik, M., Mladenić, D., Shawe-Taylor, J., Eds.; Springer: Berlin/Heidelberg, Germany, 2009; pp. 694–709. [Google Scholar]
- Pedregosa, F.; Varoquaux, G.; Gramfort, A.; Michel, V.; Thirion, B.; Grisel, O.; Blondel, M.; Prettenhofer, P.; Weiss, R.; Dubourg, V.; et al. Scikit-learn: Machine Learning in Python. J. Mach. Learn. Res. 2011, 12, 2825–2830. [Google Scholar]
| Publisher’s Note: MDPI stays neutral with regard to jurisdictional claims in published maps and institutional affiliations. |
© 2022 by the authors. Licensee MDPI, Basel, Switzerland. This article is an open access article distributed under the terms and conditions of the Creative Commons Attribution (CC BY) license (https://creativecommons.org/licenses/by/4.0/).


 ,
, 


