Abstract
Clad rebars of four different base materials (20MnSiV, 35# steel, 45# steel, and 55# steel) were successfully produced by a vacuum hot rolling process. A metallographic optical microscope (OM), electron backscatter diffractometer (EBSD), electron probe micro-analyzer (EPMA), and salt spray corrosion chamber were used to investigate the clad contour, properties, and composite interface microstructure of all four rebars. The results demonstrated that the thickness of the clad layer in the 20MnSiV/316L rebar had a more uniform distribution than those in the 35#/316L rebar, 45#/316L rebar, and 55#/316L rebar because 20MnSiV was more similar to 316L stainless steel in terms of deformation tendency. As the carbon content in the base layer increased, the amount of chromium-rich carbides increased noticeably. These large amounts led to a deficiency of chromium in the rebar composite interface and reduced corrosion resistance. Furthermore, bonding performance tests revealed that the bonding strength of the rebar composite interface not only depended on the amount of chromium-rich carbides, but also on the grain size of the composite interface. The larger the grain size of the composite interface, the lower the bonding strength was.
1. Introduction
Clad rebar is a new type of composite rebar with carbon steel as the base and stainless-steel coating as the outer layer. Clad rebar not only shows strong resistance to corrosion but is also less expensive (about one-third the cost of stainless-steel rebar). It can be widely employed in areas such as the oil industry, transportation, infrastructure, and marine engineering [1,2,3].
Currently, many researchers are investigating clad rebar. For instance, the United States-based company STELAX has proposed a production process of clad rebar based on iron filings. The iron filings are first stuffed inside stainless-steel pipes, and a strong bond is formed between the iron filings and stainless-steel pipes through procedures such as compaction, heating, and thermal recompression [4]. The above process successfully recycles the iron filings and effectively reduces the production cost of clad rebar. Sawicki et al. used the Forge2007 software (Material Forming Research Center, Paris, France) to build a simulation model for the finish rolling of clad rebar and studied the influence pattern of different K2 groove forms on the clad contour. The results showed that the rebar prepared by rolling with a flat elliptical groove had the smallest range and variance in cladding thickness [5,6]. Liu et al. developed two different processes to prepare clad rebar, namely, spray deposition and electroslag remelting. Test results indicate that the properties of clad rebar rolled using these two processes satisfy the relevant regulations [7]. Feng et al. simulated the heating, rolling, cooling, and other relevant processes of clad rebar by using a thermal simulation testing machine. The optimum performance of the clad rebar was achieved at a rolling temperature of 1000 °C and a downforce level of 50% [8]. Gao et al. built a six-pass simulation model for the rough rolling of clad rebar with Mark and then optimized the process parameters. The results indicated that clad rebar rolled under micro-tension had a more uniform distribution of cladding profiles and a considerably smaller range of coating thickness [9]. Xie et al. used the rhombus–rhombus–rhombus–square–elliptical–circular groove shape to prepare Q195/304 clad rebar and analyzed the properties of the clad rebar as well as the distribution conditions of various elements. The results showed that no cracks occurred on the composite interface after the tensile deformation of the rebar [10]. Hua et al. investigated mainly the mechanical properties of clad rebar after corrosion. They first utilized an electrochemical work bench to conduct corrosion experiments on the clad rebar; they then performed tensile tests on the clad rebar after corrosion with the help of a universal testing machine, and finally, they used function fitting to construct a mathematical model depicting the relation between tensile properties and corrosion time. It was found that an increasing number of corrosion pits were formed on the surface of the rebar with increasing corrosion time. To ensure the proper functioning of rebars, the corrosion rate of clad rebars should be maintained below 13.9% [11]. Mudhaffar et al. designed 27 groups of rolling process parameters for clad rebars using an orthogonal experiment method. They tested the tensile properties of the 27 groups of clad rebars by using a universal testing machine. The results indicated that clad rebar had optimal tensile properties at a rolling temperature of 1200 °C and a downforce level of 32% [12].
The types of base and clad materials have a strong influence on the properties of the composite steel materials and the states of the composite interface [13,14,15,16,17]. For example, base materials with poor properties could result in unsatisfactory mechanical properties of the composite steel materials. However, little research has been conducted on the choice of base or cladding materials for clad rebars. Based on the selection of four different types of base materials, this paper reports the influence of base/cladding material combinations on the microstructure and properties of clad rebar, illustrates the mechanism of contour formation, and provides theoretical guidance for the selection of clad rebar materials.
2. Materials and Method
2.1. Choice of Base and Cladding Materials
The base materials of the clad rebar are 20MnSiV, 35# carbon steel (CS), 45# carbon steel, and 55# carbon steel. The cladding material is 316L stainless steel. Spectroscopy was used to measure the chemical composition of each material. Table 1 shows the chemical composition of the base and cladding materials.

Table 1.
Chemical compositions of 20MnSiV and 316L stainless steel. (wt. %).
According to Table 1, the percentages of carbon in 20MnSiV, 35# CS, 45# CS, and 55# CS are 0.22%, 0.35%, 0.46%, and 0.53%, respectively. The carbon content of the above four substrate materials differs greatly.
2.2. Production Process of Clad Rebar
The clad rebar was prepared mainly in two steps. The first step involved the assembly and preparation of composite billets, and the second step involved the rolling of composite billets.
2.2.1. Technique for Assembling Billets
To effectively clean the rust and oxide layers on the surface of the billets and to reduce the generation of inclusions during the rolling process, we descaled the rust and cleared the burr for the external surface of the carbon-steel mandrel and internal surface of the stainless-steel tube, respectively. After processing, the carbon-steel mandrel was pressed into the stainless-steel pipe by using a hydraulic device. The billet was then sealed at the ends under a vacuum. Based on the differences in the base materials, four billets were produced in this study. Table 2 shows the materials and sizes of the composite billets. Figure 1 shows the assembly forming process.
Table 2.
Materials and specifications of the composite billets.
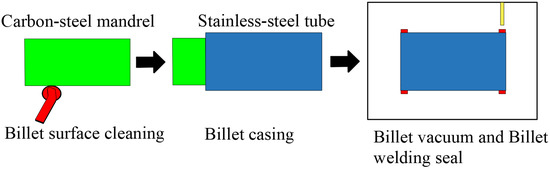
Figure 1.
Assembly forming process flow.
2.2.2. Introduction of the Rolling Technique
A rolling experiment was performed on the clad rebar in a steel factory in Guangxi, China. The entire rolling process was divided into 14 passes. The size of the finished rebar was Φ28 mm. Figure 2 illustrates the rough rolling mill.
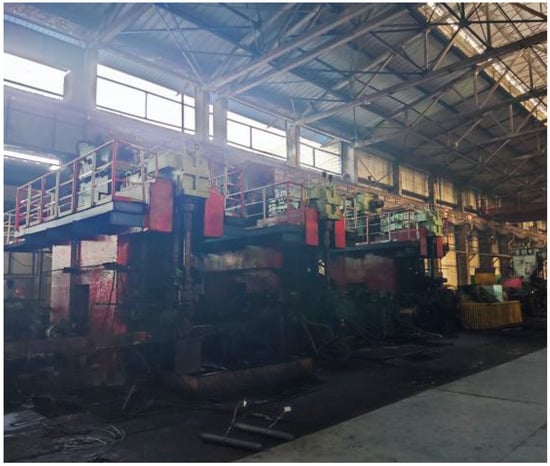
Figure 2.
Photograph of the rough rolling mill.
During rolling, the heating temperature and heating time were set to 1280 °C and 3 h, respectively. To ensure sufficient recrystallization of the billets and to obtain base and clad layers with tiny grains, cooling water was unused during the whole rolling process. Figure 3 shows the rolling pathway of the clad rebar.
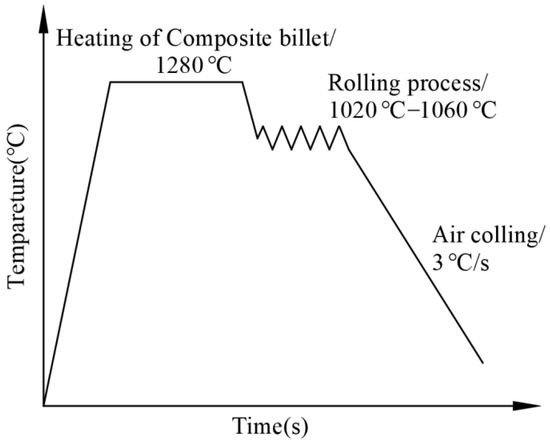
Figure 3.
Rolling pathway of the clad rebar.
2.3. Detection Method
The end surfaces of the clad rebar were photographed with an RAL 2048-48GM industrial camera (Basler, Arensburg, Holstein, Germany), and then the images were imported into the CAD 2013 (Autodesk company, San Rafael, CA, USA) software for calibration. Finally, the average value, range, and variance of the rebar cladding thickness were calculated based on Figure 4 and Formulas (1)–(3).
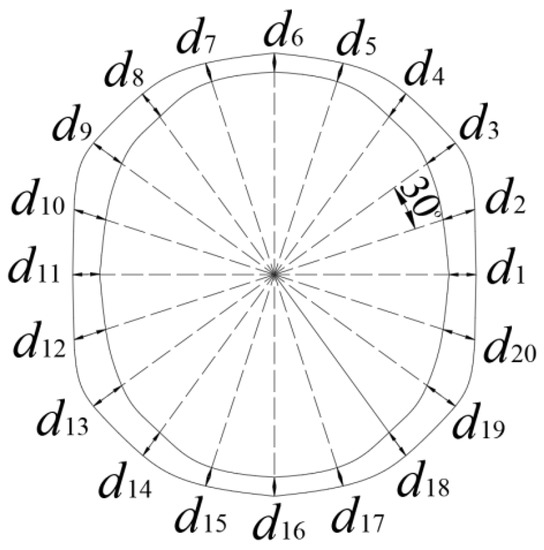
Figure 4.
Formulae for the average, range, and variance of the rebar cladding thickness.
Nitrate alcohol solution (4%) and oxalic acid solution were used separately to corrode the base and clad layers. A DM2700M optical microscope (Leica Microsystems Co., Wetzlar, Hessen, Germany) was used to observe the microstructure of the composite interface.
A DX-2700BH diffractometer (Dandong Haoyuan Instrument Co., Dandong, Jilin, China) was used to analyze the type of precipitation at the stainless-steel side of the clad rebar. The test parameters are as follows: scan range of 20°–90°, scan speed of 2°/min, and scan voltage of 40 kV.
An HKL Nordlys Max electron backscatter diffractometer (Oxford Instruments, Abindon, Oxfordshire, UK) and the Channel 5 software (Oxford Instruments Company, Oxford, UK) were used to obtain the statistics of the grain size on the composite interface. The specific steps are as follows: first, a composite interface image was obtained using the electron backscatter diffractometer. Then, the image was imported into the Channel 5 software. After that, the grain sizes of ferrite and austenite were derived from the grain statistics function of the software.
A JXA-8230 electron probe (Japan Electronics Co., Akishima-shi, Dutama region, Japan) was used to analyze the distribution conditions of elements such as C, Fe, Cr, and Ni on both sides of the composite interface.
An MTS 322 T type work bench (Meters Industrial Systems Co., Eden Prairie, MN, USA) was chosen to test the tensile properties of the clad rebar. The length of the tensile sample was 500 mm, and the tensile speed was 10 mm/min.
The method proposed in [18] was used to test the bonding properties of the clad rebar composite interface. First of all, the cladding steel bar was processed into a ladder shape and placed in a shearing fixture. Then, the trapezoidal slider was driven downward by an indenter to cut the stainless steel from the carbon-steel substrate. Finally, the bonding strength of the clad rebar could be calculated based on the shear force. A NanoSEM230 scanning electron microscope (FEI NanoPorts, Hillsboro, OR, USA) was used to observe the microscopic morphology of the shear fracture after the completion of the test.
Based on the relevant requirements of ISO 9227-2017, salt spray corrosion experiments (Shanghai Yiheng Technology Instrument Co., Fengxian, Shanghai, China) were conducted on the clad rebar. For the experiments, a 5% NaCl solution with a pH of 6.7–7.2 was used as the corrosive medium, and the temperature was set to 35 °C for the saturated air barrel. After the corrosion experiments, an aqueous solution of 20% nitric acid was chosen to submerge the rebars and remove the rust. The immersion time was 1 h. The corrosion rates of various rebars were calculated by the weight loss method.
We obtained the thermal stress strain curves of 20MnSiV, 35# steel, 45# steel, 55# steel, and 316L at different temperatures using a Gleeble-1500D thermal simulation testing machine (International, INC., St. Paul, MN, USA) with a strain rate of 10 S−1.
3. Results and Discussions
3.1. Uniformity Analysis of Clad Layer Thickness
Figure 5 shows the sizes of the end surfaces in the rebars. For all four types of rebars, the minimum cladding thickness occurred at the roots of the transverse ribs due to the existence of a sharp region at the K1 crescent groove, which obstructed the movement of the stainless steel along the groove. During the simulation of finish rolling on the clad rebar, Sawicki et al. discovered a similar pattern [19]. The minimum cladding thickness decreases in the order 20MnSiV/316L (0.35 mm) > 55#/316L rebar (0.26 mm) > 45#/316L rebar (0.22 mm) > 35#/316L rebar (0.11 mm).
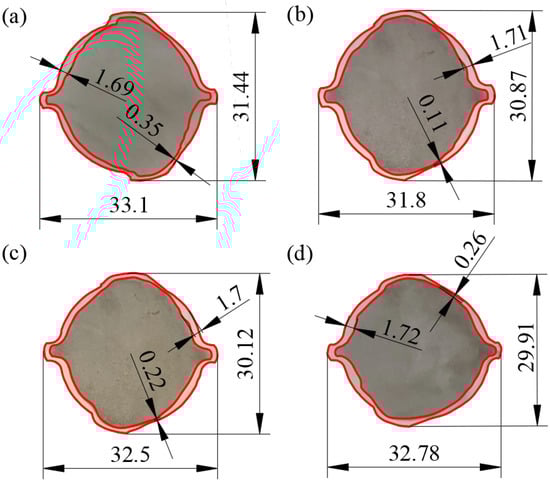
Figure 5.
Surface sizes of the ends of various rebars: (a) 20MnSiV/316L rebar; (b) 35#/316L rebar; (c) 45#/316L rebar; (d) 55#/316L rebar.
Moreover, Figure 5 shows that the distance between the two longitudinal ribs in the 20MnSiV/316L rebar was 33.1 mm, while that in the 35#/316L rebar was 31.88 mm. This indicates that the deformation in the clad rebar along the lateral spread increases with increasing strength of the base material.
Table 3 shows the average, range, and variance for the cladding thickness of various rebars. Table 3 suggests that both the range and variance of the 20MnSiV/316L rebar cladding thickness are the smallest, which are 1.34 and 0.11 mm, respectively. By contrast, 35#/316L has the largest range and variance of cladding thickness, which are 1.6 and 0.17 mm, respectively.
Table 3.
Average, range, and variance for various rebars.
Figure 6 shows the stress–strain curves of the base and clad layers. Compared to 35#, 45#, and 55# carbon steel, 20MnSiV exhibits a stress–strain curve that is closer to the stress–strain curve of 316L stainless steel. This indicates that 20MnSiV and 316L stainless steel have similar deformation trends under the same load. Therefore, the cladding thickness of 20MnSiV/316L rebar was more uniform than in the other three types of rebars. Table 3 also suggests that there is little variation in the average cladding thickness of rebars, which fluctuates between 0.98–1.04 mm. Consequently, the cladding thickness of rebars is not related to the base material.
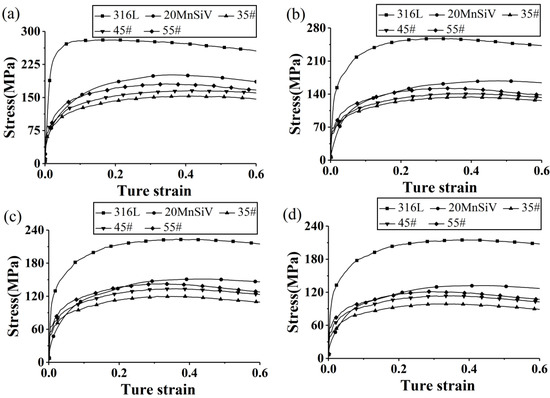
Figure 6.
Stress–strain curves of the base and clad materials at different temperatures: (a) 950 °C; (b) 1000 °C; (c) 1050 °C; (d) 1100 °C.
3.2. Metallographic Analysis of the Composite Interface
Figure 7 shows the metallographic images of the carbon-steel side of the various rebars. It can be observed from the figure that the composite interface has a proper bonding state and no visible cavities, cracks, or oxides. This can be attributed to the cleaning treatment performed on the surface of the billets before they were assembled.
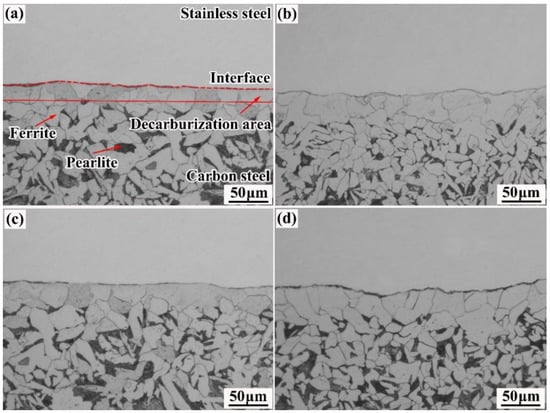
Figure 7.
Metallographic images of the carbon-steel side of various rebars: (a) 20MnSiV/316L rebar; (b) 35#/316L rebar; (c) 45#/316L rebar; (d) 55#/316L rebar.
The carbon-steel side mainly consists of pearlite and ferrite. Furthermore, a pure ferrite region can be observed at the composite interface and is called the decarbonization zone. The above phenomenon can be primarily attributed to the amounts of carbon contained in the four base materials, which are 0.22%, 0.35%, 0.46%, and 0.58%, respectively. The carbon content in clad 316L stainless steel is 0.021%. There is a relatively large difference between the concentration of carbon in the base and clad layers. Therefore, in the forming process of the rebars, carbon elements will diffuse from the base layer to the cladding layer, leading to decarburization on the carbon-steel side. As the carbon content in the base layer increases, the width of the decarbonization zone expands from 30 to ~50 µm.
Figure 8 shows the metallographic images of the stainless-steel side of various rebars. The stainless-steel side has a single austenitic structure, and some grains exhibit equiaxed crystal distribution. Figure 8c shows the metallographic image of the stainless-steel side of the 45#/316L rebar. A certain number of granular precipitates can be observed at the stainless-steel grain boundary. Figure 8d shows the metallographic image of the stainless-steel side of the 55#/316 rebar. Compared with the 45#/316L rebar, the 55#/316L rebar had a significantly increased number of precipitates at the grain boundary of the stainless-steel side and a large number of web-like precipitates with continuous distribution inside the grains.
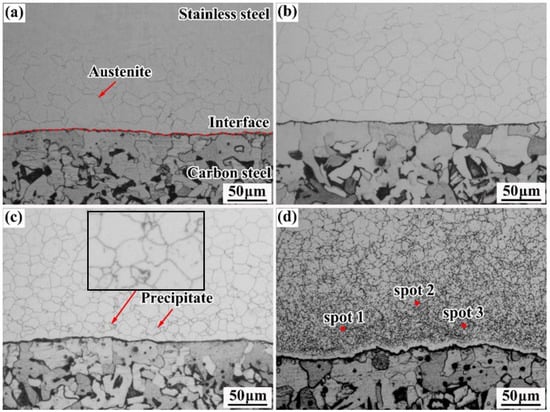
Figure 8.
Metallographic images of the stainless-steel side of various rebars: (a) 20MnSiV/316L rebar; (b) 35#/316L rebar; (c) 45#/316L rebar; (d) 55#/316L rebar.
Point scans were performed on the precipitates by energy-dispersive X-ray spectroscopy (EDS). Table 4 shows the point scan analysis of the precipitates. It is evident that the main components of the precipitates at the stainless-steel side were carbon, chromium, and iron, suggesting that the precipitates are chromium-rich carbides. The forming mechanism of chromium-rich carbides is based on the fact that carbon is interstitially diffused, while silicon and Mn are substitutionally diffused in the iron lattice, and the activation energy of interstitial diffusion is far less than that of substitutional diffusion [20]; thus, carbon will first cross the composite surface to the stainless-steel side. Compared with nickel, chromium and carbon present stronger affinity, and thus carbon preferentially reacts with chromium on the stainless-steel side to generate stable chromium-rich carbides.
Table 4.
Point scan analysis of the precipitates (wt. %).
A closer observation of Figure 8c also reveals that chromium-rich carbides continued to precipitate at the grain boundary of stainless steel because of a relatively large number of defects at the grain boundary of stainless steel. The carbon atoms experienced smaller resistance when diffusing along the grain boundary. Therefore, when carbon crosses the composite interface, it would manly diffuse along the grain boundary of stainless steel and react with chromium at the grain boundary to form chromium-rich carbides.
3.3. Phase Analysis of Carbides
To determine the phase composition of chromium carbide, XRD diffraction analysis was performed on the stainless-steel side of the 55#/316L rebar (Figure 9). In a diffraction range of 20°–90°, six peaks were observed in the scan of the stainless-steel side of the 55#/316L rebar. Comparison with the standard diffraction card suggested that the shapes of the peaks at 43.47°, 51.73°, and 74.68° coincided with the shapes of the peaks for the 316L rebar, while the shapes of peaks at 28.84°, 44.97°, and 50.82° coincided with the shapes of the peaks for C15.58Fe7.42Cr6. Therefore, the phase of the chromium-rich carbides precipitated at the side of stainless steel was C15.58Fe7.42Cr6. Cao et al. also arrived at the same conclusion when studying the interface microstructure of martensite/austenite multilayered composites [21].
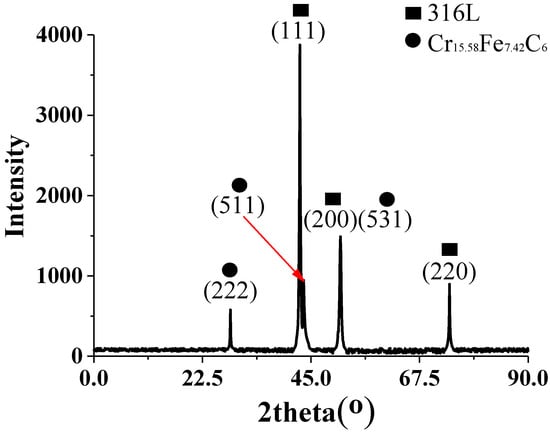
Figure 9.
Diffraction analysis of the stainless-steel side of the 55#/316L rebar.
3.4. Diffusion Analysis of Elements at the Composite Interface
Figure 10 shows the results of the EPMA analysis at the composite interface. The figure shows that when the carbon content in the base layer is 0.22%, the diffusion distance of carbon is ~30 µm. When the carbon content in the base layer is 0.53%, the diffusion distance of carbon increases to 80 µm. The diffusive capacity of carbon increases due to the increase in the carbon content of the base layer, and the diffusion distance of carbon increases accordingly. Moreover, an “uphill” phenomenon occurs in all rebars as carbon diffuses. The mechanism of the “uphill” phenomenon relies on the fact that the austenitic structure is face-centered cubic with dense alignments of atoms and that carbon has a far slower diffusion speed in austenite than in ferrite. Therefore, when carbon crosses the composite layer, it accumulates at the stainless-steel side, resulting in the “uphill” phenomenon.
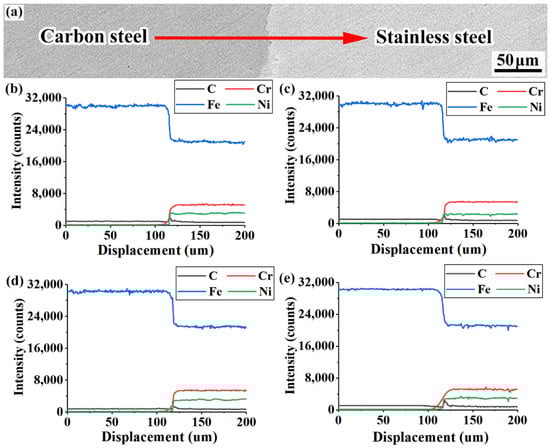
Figure 10.
Results of EMPA analysis of various rebars: (a) EPMA line-sweep position; (b) 20MnSiV/316L rebar; (c) 35#/316L rebar; (d) 45#/316L rebar; (e) 55#/316L rebar.
Figure 10e shows that the diffusion distance of chromium in the 55#/316L rebar was ~45 µm, while the diffusion distance of chromium in the 20MnSiV/316L, 35#/316L, and 45#/316L rebars was only ~25 µm. Combined with the information obtained from the metallographic images of the composite interfaces of various rebars, it is revealed that a large amount of chromium-rich carbides (C15.58Fe7.42Cr6) was formed at the composite interface of the 55#/316L rebar, which reduced the chromium content on the composite interface. Consequently, chromium far away from the composite interface continuously diffused to the composite interface, finally resulting in the increased diffusion distance of chromium. When studying the influence of the carbon content in the base on the microstructure of the stainless-steel composite interface, Wu et al. used an electron probe to analyze the contents of various elements on the composite interface. As a result, the diffusion range of chromium increased noticeably when the carbon content increased from 0.06 to 0.2% [22].
Due to the relatively weak affinity of iron, nickel, and carbon, stable iron–nickel carbides could not be formed. Therefore, no significant changes occurred in the diffusion distances of iron and nickel with increasing carbon content in the base layer. The diffusion distances of iron and nickel were approximately 30 and 10 µm, respectively.
3.5. Analysis of Tensile Properties
Figure 11 shows the macroscopic morphology at the tensile fractures of various rebars. Visible necking can be observed for the 20MnSiV/316L rebar and 35#/316L rebar after the tensile test, with the fracture being dark grey. No apparent plastic deformations occurred in the 45#/316L rebar and 55#/316L rebar before the fracture. The fracture surface was smooth and bright. Moreover, after the tensile tests, the composite interfaces of the 45#/316L rebar and 55#/316L rebar were detached.
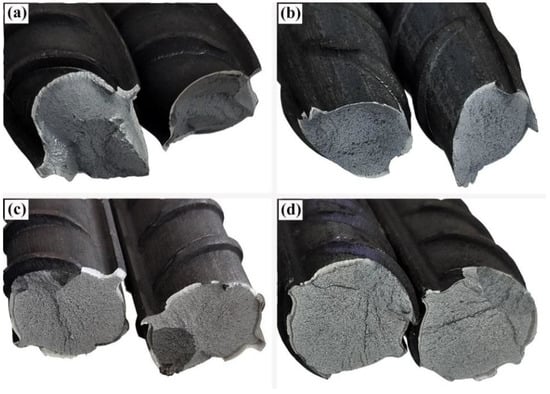
Figure 11.
Macroscopic morphology of the tensile fractures for various rebars: (a) 20MnSiV/316L rebar; (b) 35#/316L rebar; (c) 45#/316L rebar; (d) 55#/316L rebar.
Table 5 shows the results of the tensile tests on various rebars. Table 5 indicates that the 20MnSiV/316L rebar had the largest yield strength and elongation, which were 455 MPa and 26.3%, respectively. The 55#/316L rebar had the highest tensile strength of 650 MPa. The pattern of changes in the tensile strength and elongation of rebars mainly depended on the choice of the base layer material, as the base material of the 20MnSiV/316L rebar had a relatively low carbon content and contained additional alloy elements such as V, Nb, and Ti. Consequently, the rebar had a relatively large yield strength and elongation. The base material of the 55#/316L rebar had a relatively high carbon content, which caused increased precipitation inside the rebar and impeded the movement of dislocations. Therefore, the tensile strength was relatively high. When investigating the microstructure and properties of Fe-17Mn-(05/07/09)C, Song et al. discovered that the tensile strength and elongation of Fe-17Mn-(05/07/09)C increased with increasing carbon content in the base material, which is in agreement with the results of this study [23].
Table 5.
Results of tensile experiments on various rebars.
3.6. Analysis of the Bonding Performance of the Composite Interface
Table 6 shows the test results regarding the bonding performance of various rebar composite interfaces (the test was repeated 10 times). From the table, it is clear that the bonding strength of the 20MnSiV/316L rebar composite interface (384 MPa) is higher than those of the 45#/316L rebar and 55#/316L rebar. As the carbon content in the base layer increases, the amount of carbon–chromium compounds in the composite interface increases. However, during shearing, the carbon–chromium compounds can easily develop concentrated stress, leading to the premature initiation of fractures on the interface and a decrease in the bonding strength.
Table 6.
Test results of bonding performance of various rebar composite interfaces.
Interestingly, although the carbon content of the 35#/316L rebar composite interface is significantly lower than those of the 45#/316L and 55#/316L rebars, the bonding strength of the 35#/316L rebar is not higher than the above two kinds of rebars. Analysis of the metallographic images of the rebar composite interfaces suggests that the grain size of the 35#/316L rebar composite interface is larger than those of the 45#/316L and 55#/316L rebars, leading to a relatively smaller area of the grain boundary, reduced deformation resistance of the metal, and lower bonding strength of the interface. To confirm this, EBSD examination was performed on the rebar composite interface to obtain quantitative statistics on the grain size of all the composite interface microstructures.
Because the composite interface consists mainly of austenite and ferrite, this study only considers the grain sizes of austenite and ferrite. Figure 11 shows the EBSD images and the distributions of grain size for all the rebars. Calculations revealed that the ferritic and austenite grains of the 35#/316L rebar composite interface had the largest average sizes of 5.35 and 14.25 µm, respectively. Therefore, it can be concluded that the bonding strength of the rebar composite interface depends not only on the amount of carbide, but also on the grain sizes of the various microstructures of the interface. The larger the grain sizes at the interface, the lower the bonding strength is.
Figure 12 also indicates that although the rolling procedure of every rebar was exactly the same as that of the cladding material (316L stainless steel), certain differences in the average austenitic grain size existed. Among the four types of materials studied, the average austenitic grain size in the 55#/316L rebar (6.67 µm) was notably smaller than those in the others due to the high carbon content in the base layer of the 55#/316L rebar, which led to the extensive diffusion of carbon to the side of stainless steel and its reaction with chromium to form a large number of carbon–chromium compounds. Carbon–chromium compounds could easily form a series of nucleus droplets during the dynamic recrystallization process of stainless steel, leading to an increase in the number of austenitic nuclei and improved grain refinement. Moreover, when studying a stainless-steel composite plate, Liu et al. discovered that carbides could act as anchors during the formation of the composite interface and inhibit the movement of the grain boundary, leading to slow growth of grains [24].
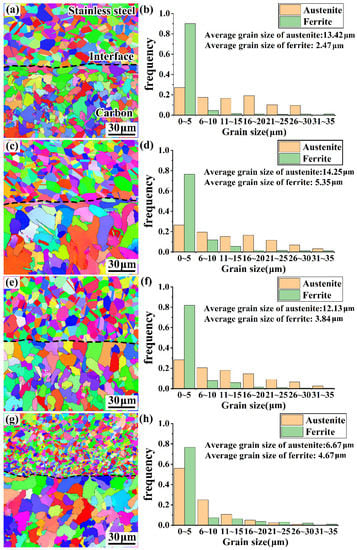
Figure 12.
EBSD images and grain distributions for various rebar composite interfaces: (a,b) 20MnSiV/316L rebar; (c,d) 35#/316L rebar; (e,f) 45#/316L rebar; (g,h) 55#/316L rebar.
Most importantly, though the formation of carbon–chromium compounds could refine the grains to some extent and increase the bonding strength of the composite interface, during shearing, the compounds could develop concentrated stress and thereby cracks, which would decrease the bonding strength of the composite interface. Consequently, during the actual productions of clad rebars, the formation of carbon–chromium compounds should be avoided as much as possible.
Figure 13 shows shear fracture profiles of all rebars. According to Figure 13a, the shear fracture of the 20MnSiV/316L rebar has numerous equiaxed dimples (size: approx. 4~6 μm), which were densely distributed. Therefore, it is a typical plastic fracture. Figure 13b shows the microscopic morphology of the shear fracture in the 35#/316L rebar. Compared with the 20MnSiV/316L rebar, the shear fracture of the 35#/316L rebar had a small and shallow fossa that showed that the fracture toughness of the interface of the 35#/316L rebar was lower than that of the 20MnSiV/316L rebar. Figure 13c shows the microscopic morphology of the shear fracture of the 45#/316L rebar. This rebar had fewer dimples and a certain number of slip surfaces. Figure 13d shows the microscopic morphology of the shear fracture of the 55#/316L rebar. A large number of cleavages and local shear bands were observed, indicating a typical brittle fracture.
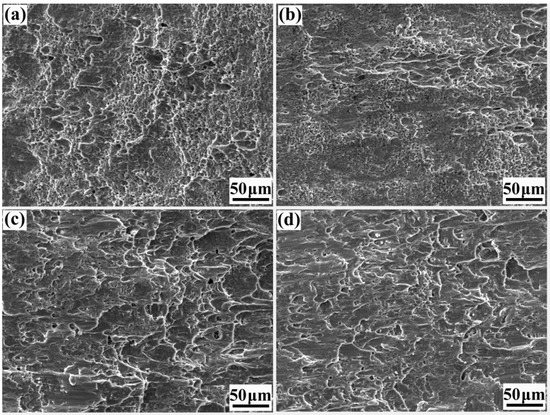
Figure 13.
Shear fracture profiles of clad rebars: (a) 20MnSiV/316L rebar; (b) 35#/316L rebar; (c) 45#/316L rebar; (d) 55#/316L rebar.
3.7. Analysis on Corrosion Resistance
To compare the corrosion resistance of the four types of rebars horizontally, salt spray corrosion experiments were performed on all the rebars. The sample specification was Φ28 × 80 mm, and the corrosion time was 30 d.
Figure 14 illustrates the end and axial morphologies of various rebars after rust removal. The figure suggests that no corrosion or cracks occurred on the axial faces of the four types of rebars, which can be attributed to the high corrosion resistance of the clad layer of 316L. The end faces of the four rebars were severely corroded due to the absence of cladding, and their composite interfaces also appeared to be detached.
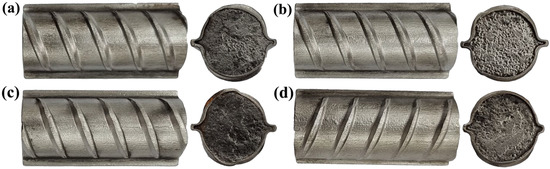
Figure 14.
Surface morphologies of various rebars after rust removal: (a) 20MnSiV/316L rebar; (b) 35#/316L rebar; (c) 45#/316L rebar; (d) 55#/316L rebar.
Figure 15 illustrates the corrosion depth in the composite interfaces of all the rebars. The figure suggests that the corrosion depth in the composite interfaces was remarkably higher than that in the carbon-steel bases. This was attributed to the existence of a certain potential difference between carbon steel and stainless steel due to their different properties. Consequently, under salt spray, electrochemical corrosion occurred in the composite interface of each rebar (with the stainless steel as the cathode and carbon steel as the anode). Because the carbon-steel base had no contact with the stainless steel, chemical corrosion occurred. In their research of corrosion behavior on a composite plate, Gunen et al. found that the corrosion resistance can be greatly reduced by cracking and spalling the high chromium alloy protective layer, even exceeding the untreated sample in the study concerning the corrosion behavior of 304 austenitic stainless steel [25,26].
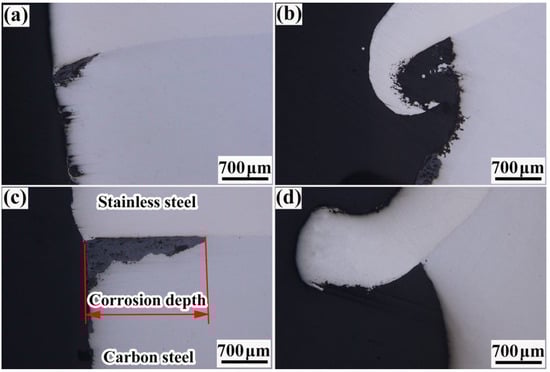
Figure 15.
Illustration of corrosion depths in composite interfaces of various rebars: (a) 20MnSiV/316L rebar; (b) 35#/316L rebar; (c) 45#/316L rebar; (d) 55#/316L rebar.
Li et al. found that the electrochemical corrosion rate of a composite plate (0.728 g/m2) was several times that of its chemical corrosion [25].
Moreover, Figure 15 suggests the existence of obvious differences among the corrosion depths in the composite interfaces of the four rebars. The corrosion depth of the 20MnSiV/316L rebar composite interface was ~0.75 mm, while that of the 55#/316L rebar was ~2.3 mm (nearly three times higher). The corrosion depth of each composite interface was related to the chromium content in the base. As carbon–chromium compounds were formed in large amounts, the chromium content in the composite interface decreased sharply, resulting in lower corrosion resistance of the interface and a larger corrosion depth.
Table 7 shows the corrosion rates of the various rebars. The corrosion rates of the 20MnSiV/316L, 35#/316L, 45#/316L, and 55#/316L rebars were 0.61, 0.75, 0.92, and 1.15 g/(m2·h), respectively. Thus, the 55#/316L rebar has the highest corrosion rate, which is approximately twice the corrosion rate of the 20MnSiV/316L rebar. The high corrosion rate of the 55#/316L rebar can be attributed to its severely corroded composite interface.
Table 7.
Calculated corrosion rates of the various rebars.
4. Conclusions
- (1)
- The minimum cladding thickness in the four types of rebars occurred at the root of the transverse rib. The 20MnSiV/316L rebar had the smallest range and variance of cladding thickness, which were 1.34 and 0.11 mm, respectively. This was because 20MnSiV and 316L have similar stress–strain curves.
- (2)
- As the carbon content in the base layer increased from 0.22% to 0.53%, the amount of chromium carbide (C15.58Fe7.42Cr6) at the stainless-steel side increased notably, and the morphology transformed from disconnected grains to continuous flakes. The diffusion distances of carbon and chromium increased from 35 and 25 µm to 80 and 40 µm, respectively.
- (3)
- The bonding strength of the rebar composite interface depended on not only the amount of chromium-rich carbides, but also on the grain size in all the microstructures of the composite interface. The lower the amount of chromium-rich carbides in the interface, the higher the bonding strength is. The larger the grain size in the interface, the lower the bonding strength in the interface is.
- (4)
- After the salt spray corrosion experiments, the 55#/316L rebar composite interface exhibited a corrosion depth that was three times that of the 20MnSiV/316L rebar and a corrosion rate that was approximately twice that of the 20MnSiV/316L rebar. This was because of the large amount of chromium-rich carbide precipitated at the composite interface of the 55#/316L rebar, which led to a reduced chromium content in the interface and lower corrosion resistance.
- (5)
- To ensure the clad layers in the rebars were uniformly distributed in thickness and had satisfactory mechanical properties as well as corrosion resistance, materials with a low carbon content (Cwt ≤ 0.25%), high strength, and a stress–strain curve similar to that of the clad layer were chosen for the base layer of the clad rebar.
Author Contributions
Conceptualization, Z.L.; methodology, Z.L. and J.T.; software, Z.L.; validation, Z.L., L.Z. and J.T.; formal analysis, Z.L.; investigation, Z.L.; resources, Z.L. and J.T.; data curation, Z.L. and Z.Z.; writing—original draft preparation, Z.L.; writing—review and editing, Z.L. and J.T.; visualization, Z.L.; supervision, Z.L.; project administration, Z.L., J.T., Y.X. and X.Q.; funding acquisition, J.T., Y.X. and X.Q. All authors have read and agreed to the published version of the manuscript.
Funding
This research was funded by the key R & D project of Guangxi Zhuang Autonomous Region (2021AB16016) and the science and technology plan project of Liuzhou City (2021AA0101B001).
Acknowledgments
Special thanks to Liuzhou Iron and Steel Group and Hunan Santai New Materials Co.
Conflicts of Interest
The authors declare no conflict of interest.
References
- Cross, W.M.; Duke, E.F.; Kellar, J.J.; Han, K.N.; Johnston, D. Stainless Steel Clad Rebar in Bridge Decks (No. SD2000-04-F). 2001. Available online: https://trid.trb.org/view/1225425 (accessed on 12 December 2019).
- Kahl, S. Stainless and Stainless-Clad Reinforcement for Highway Bridge Use; No. RC-1560; Michigan. Dept. Of Transportation, Operations Field Services Division: Lansing, MI, USA, 2011.
- Tuominen, J.; Näkki, J.; Poutala, J.; Miettinen, J.; Peltola, T.; Vuoristo, P.; Rasehorn, I.; Alam, M.M.; Kaplan, A.F.H. Fatigue behavior of laser clad round steel bars. J. Laser Appl. 2015, 27, 012006. [Google Scholar] [CrossRef]
- Darwin, D.; Kahrs, J.T.; Locke, C.E., Jr. Evaluation of Corrosion Resistance of Type 304 Stainless Steel Clad Reinforcing Bars. Ph.D. Thesis, University of Kansas Center for Research, Inc., Lawrence, KS, USA, 2001. [Google Scholar]
- Sawicki, S.; Dyja, H. Production of Bimetallic Bars Steel-steel Resistant to Corrosion of the Method Explosive Cladding. Metall. Min. Ind. 2011, 7, 63–73. [Google Scholar]
- Sawicki, S. Properties of Bimetallic “Carbon Steel-Stainless-steel” Bars with Periodic Texture Obtained by Explosive Cladding and Rolling. Met. Sci. Heat Treat. 2012, 54, 303–308. [Google Scholar] [CrossRef]
- Liu, X.M.; Feng, G.H.; Liu, X.; Wang, B.S.; Zhang, H.L.; Ma, J. Interface Characteristics and Properties of a High-Strength Corrosion-Resistant Stainless Steel Clad Rebar. Metals 2020, 10, 373. [Google Scholar] [CrossRef]
- Feng, Y.Y.; Yu, H.; Luo, Z.A.; Misra, R.D.K.; Xie, G.M. The Impact of Process Parameters on Microstructure and Mechanical Properties of Stainless Steel/Carbon Steel Clad Rebar. Materials 2019, 12, 2968. [Google Scholar] [CrossRef] [PubMed]
- Gao, Y.N.; Zhang, Y.J.; Hao, R.C.; Xiao, H.; Zhang, G.Y. Finite Element Simulation and Experimental Study on Stainless Steel/Low Carbon Steel Clad Rebar by Thrust/Tension Rolling. Special Steel. 2013, 34, 5–9. [Google Scholar]
- Xie, H.B.; Gao, Y.N.; Wang, T.; Xiao, H. Effffect of Multipass Hot Rolling on the Property and Bonding Interface of Clad Bar. Acta Metall. Sin. 2011, 47, 1513–1519. [Google Scholar]
- Hua, J.; Wang, F.; Huang, L.; Wang, N.; Xue, X. Experimental study on mechanical properties of corroded stainless-clad bimetallic steel bars. Constr. Build. Mater. 2021, 287, 123019. [Google Scholar] [CrossRef]
- Mudhaffffar, M.A.; Saleh, N.A.; Aassy, A. Inflfluence of Hot Clad Rolling Process Parameters on Life Cycle of Reinforced Bar of Stainless Steel Carbon Steel Bars. Procedia Manuf. 2017, 8, 353–360. [Google Scholar] [CrossRef]
- Yu, C.; Fu, L.; Xiao, H.; Lv, Q.; Gao, B. Effect of carbon content on the microstructure and bonding properties of hot-rolling pure titanium clad carbon steel plates. Mater. Sci. Eng. A 2021, 820, 141527. [Google Scholar] [CrossRef]
- Xiao, F.; Wang, D.; Hu, W.; Cui, L.; Gao, Z.; Zhou, L. Effect of Interlayers on Microstructure and Properties of 2205/Q235B Duplex Stainless Steel Clad Plate. Acta Metall Sin. 2019, 33, 679–692. [Google Scholar] [CrossRef]
- Liu, X.F.; Bai, Y.L.; Li, J.K.; Qin, H.Y.; Chen, X. Influence factors of interfacial bonding strength of cold rolled titanium/steel laminated composite plates. Cailiao Gongcheng. 2020, 48, 119–126. [Google Scholar]
- Varavallo, R.; Moreira, V.D.; Paes, V.; Brito, P.; Olivas, J.; Pinto, H.C. Residual Stresses of Explosion Cladded Composite Plates of ZERON 100 Superduplex Stainless Steel and ASTM SA516-70 Carbon Steel. Adv. Mater. Res. 2014, 996, 500–505. [Google Scholar] [CrossRef]
- Ye, C.Q.; Zhai, W.G.; Lu, G.Y.; Liu, Q.S.; Ni, L.; Ye, L.; Fang, X. Microstructural evolution and mechanical integrity relationship of dissimilar metal welding between 2205 duplex stainless steel and composite bimetallic plates. Proc. Inst. Mech. Eng. Part C J. Mech. Eng. Sci. 2021, 235, 7033–7044. [Google Scholar] [CrossRef]
- Li, Z.; Tan, J.; Qian, X.; Xiang, Y.; Zeng, L.; Zhao, Y. Interfacial Microstructure and Properties of Clad Rebar Prepared by Clean-Interface Assembly and Vacuum Hot-Rolling. Applied Sciences. 2022, 12, 9519. [Google Scholar] [CrossRef]
- Sawicki, S.; Dyja, H. Theoretical and Experimental Analysis of the Bimetallic Ribbed Bars Steel—Steel Resistant to Corrosion Rolling Process. Arch Metall Mater. 2012, 57, 61–69. [Google Scholar] [CrossRef]
- Gamsjäger, E.; Svoboda, J.; Fischer, F.D. Austenite-to-ferrite phase transformation in low-alloyed steels. Comp. Mater. Sci. 2005, 32, 360–369. [Google Scholar] [CrossRef]
- Cao, R.; Ding, Y.; Yan, Y.; Zhang, X.; Chen, J. Effect of heat treatment on interface behavior of martensite/austenite multilayered composites by accumulative hot roll bonding. Compos. Interface 2019, 26, 1069–1085. [Google Scholar] [CrossRef]
- Wu, B.; Guo, K.; Yang, X.; Gao, Y.; Jin, Y.; Gao, Y.; Wang, Q.; Zhang, F. Effect of carbon content of substrate on the microstructure changes and tensile behavior of clad layer of stainless steel composites. Mater. Sci. Eng. A 2022, 831, 142201. [Google Scholar] [CrossRef]
- Song, S.W.; Kim, J.N.; Seo, H.; Lee, T.; Lee, C.S. Effects of carbon content on the tensile and fatigue properties in hydrogen-charged Fe-17Mn-xC steels: The opposing trends. Mater. Sci. Eng. A 2018, 724, 469–476. [Google Scholar] [CrossRef]
- Liu, B.X.; Wang, S.; Fang, W.; Yin, F.X.; Chen, C.X. Meso and microscale clad interface characteristics of hot-rolled stainless steel clad plate. Mater. Charact. 2019, 148, 17–25. [Google Scholar] [CrossRef]
- Gunen, A.; Kurt, B.; Orhan, N.; Kanca, E. The investigation of corrosion behavior of borided AISI 304 austenitic stainless steel with nanoboron powder. Prot. Met. Phys. Chem. Surf. 2014, 50, 104–110. [Google Scholar] [CrossRef]
- Gunen, A.; Karakas, M.S.; Kurt, B.; Calik, A. Corrosion behaviour of borided AISI 304 austenitic stainless steel. Anti-Corros. Methods Mater. 2014, 61, 112–118. [Google Scholar] [CrossRef]
Publisher’s Note: MDPI stays neutral with regard to jurisdictional claims in published maps and institutional affiliations. |
© 2022 by the authors. Licensee MDPI, Basel, Switzerland. This article is an open access article distributed under the terms and conditions of the Creative Commons Attribution (CC BY) license (https://creativecommons.org/licenses/by/4.0/).