Article

Determination of Polypropylene Fiber-Reinforced Concrete Compressive Strength and Elasticity Modulus via Ultrasonic Pulse Tests

by
Alexandre Almeida Del Savio
1,*,
Darwin La Torre Esquivel
1,
Julian Carrillo
2 and
Emilio Chi Yep
1
1
Civil Engineering Department, Universidad de Lima, Lima 15023, Peru
2
Department of Civil Engineering, Universidad Militar Nueva Granada, Bogota 110111, Colombia
*
Author to whom correspondence should be addressed.
Appl. Sci. 2022, 12(20), 10375; https://doi.org/10.3390/app122010375
Submission received: 18 September 2022 / Revised: 8 October 2022 / Accepted: 9 October 2022 / Published: 14 October 2022
(This article belongs to the Section Civil Engineering)

Abstract

:
Compressive strength and elasticity modulus are the main mechanical properties of concrete. The non-destructive ultrasound pulse test can be used to determine these properties without compromising the structure’s integrity. This study seeks to assess whether a correlation exists (1) between the Reinforcement Index (RI) and the mechanical properties, (2) between the RI and the dynamic properties, and (3) among the dynamic properties of polypropylene fiber-reinforced concrete. The RI was modified through fiber volume fraction (0, 0.4, 0.8 and 1.2%) and fiber length (40, 50 and 60 mm). The dynamic properties were assessed through dynamic elasticity modulus and ultrasonic pulse velocity (UPV), which were determined by direct, semi-direct, and indirect prospect methods. Finally, compressive strength, static elasticity modulus, and Poisson’s ratio were assessed through destructive tests. Their relationship with UPV and the dynamic elasticity modulus is also subsequently studied. The results reveal a correlation between RI and compressive strength and UPV; however, the static elasticity modulus only exhibits a correlation with UPV in one of its measurement methods. Finally, empirical models were developed for predicting compressive strength, elasticity modulus as a function of ultrasonic pulse velocity and RI, and dynamic elasticity modulus as a function of compressive strength and RI.

1. Introduction

Concrete is the most widely used material in the construction industry due to its low cost and versatility, as it can be placed or molded into virtually any shape [1]. However, concrete has a fragile behavior, and when subjected to tensile stress, its strength is less than 15% of its compressive strength, resulting in low resistance to bending [2,3,4]. Hence, the construction of modern structures has demanded the development of new types of concrete with improved properties [5]. To offset these disadvantages, several new concrete types have been developed, such as high-strength concrete (HSC), high-performance concrete (HPC), and fiber-reinforced concrete (FRC) [1,5]. The latter is produced by adding fibers (either synthetic, metallic, or natural) to the mixture. This addition improves its tensile behavior, increases its resistance to bending, helps to reduce and control cracking, and increases its ability to absorb energy [4,6,7,8,9]. There are many application fields for fiber concrete, such as tunnel and pavement construction. Moreover, its use has increased since trust levels in the material have risen as people better understand its properties.
Faced with the use of FRC, it has become necessary to develop more efficient methods to manage the quality of concrete elements on site or the quality of existing fiber structures [10]. This is because curing, compaction, and other concrete properties are different on-site than at the laboratory, and, therefore, its quality also varies [11]. Compressive or bending strength and elasticity modulus are the main indicators of concrete quality [12,13]. There are two types of tests to measure the properties of concrete laid on-site: (1) destructive testing (DT) and (2) non-destructive testing (NDT). DTs need one or several specimens that are mechanically brought to failure to measure their properties (for example, compressive or bending strength test). In the case of existing structures, specimens need to be removed from them, causing structural damage.
On the other hand, NDTs determine material properties without bringing them to failure. These tests include ultrasonic pulse, resonance, or sclerometer [13,14]. The use of NDTs is vital to determine the state of a structure without having to cause structural damage. In addition, NDTs are less expensive, require less time, are repeatable, and have a greater scope than DTs [13,14]. On the other hand, they require well-trained operators and engineers to obtain and interpret reliable results, a calibration procedure in the laboratory is mandatory, and a large number of variables can affect the test readings, so the knowledge to avoid these and the correct preparation of the specimen is fundamental, other limitations corresponding to each of the NDTs can be found in the literature [15,16]. Jones and Hassan [12,17] state that the ultrasonic pulse test is the most reliable, simple, and accessible non-destructive method for assessing material properties. The interest in this method has increased in recent years due to its use in assessing concrete structures [18]. However, this method needs a previous UPV study of the laboratory material to calibrate the results obtained in the field.
The ultrasonic pulse method was first introduced by Jones [12] in 1945 in “The non-destructive testing of concrete.” This paper presents the theory necessary to carry out the test, establishing a relationship between the velocity of wave propagation and the density and elastic properties of the material. This way, if density and velocity are known, compressive strength and static elasticity modulus can be determined [19].
Mahapatra and Barai (2018) [20] studied concrete reinforced with steel and polypropylene fibers with the addition of ashes resulting from coal burning using simple compression tests, split tests, bending tension tests, ultrasounds, and sclerometers. In this study, fiber materials and the volumes of each type of fiber in the specimens are varied. The authors evidenced a strong cubic correlation between compressive strength and ultrasonic pulse velocity. Here, ultrasonic wave values increased as compressive strength also increased. Reufi et al. (2016) [21] studied steel fiber-reinforced concrete (SFRC) with hooks on the edges and polypropylene fibers. Fibers were varied in volume fraction to assess the elasticity modulus by employing non-destructive ultrasound and resonance tests. The authors concluded that the dynamic elasticity modulus measured with the ultrasound method increases when increasing volume and slenderness ratio regardless of fiber type, while the dynamic elasticity modulus measured with resonance increases when decreasing volume and slenderness ratio for both fiber types. Finally, Reufi et al. found that the hybrid mixture of 0.5% steel fibers with 0.2% polypropylene fibers exhibited the best results. Rucka et al. (2021) [22] studied concrete reinforced with polyolefin fibers using 3-point bending tests, the visual DIC (digital image correlation) method, and ultrasound. This study modified fiber weight dosages to analyze their influence on post-fracture behavior. The objective of the research was to use a non-invasive method, ultrasound, and DIC to assess the evolution of damage in concrete and the possibility of its characterization. Rucka et al. concluded that ultrasound results made it easier to characterize the level of damage. In addition, they state that ultrasonic waves could be used in a real-time monitoring system as an autonomous damage indicator of a fracture process. Noushini et al. (2013) [23] studied high-strength concrete reinforced with polyvinyl alcohol (PVA) fibers using uniaxial compression tests, split tests, bending tensile strength, and the static elasticity modulus. Here, fiber volume fractions varied between 0.25% and 0.5%, and the length of fibers ranged from 6 to 12 mm, so their influence on the dynamic elasticity modulus may be assessed. Noushini et al. concluded that the values of dynamic and static elasticity modulus denote a high level of consistency with each other in elements at the same age, with both values following the same trend; however, the dynamic elasticity modulus was 2.6 to 6.9% higher than the static elasticity modulus.
Previous research concluded that the ultrasound method is feasible for use in concrete reinforced with steel or hybrid fibers [1,10,11,12,13,14,17,18,19,24,25]. The literature review determined that research already exists on concrete with steel and polypropylene fibers. However, the research has only used fiber volume as an independent variable for concrete with polypropylene fibers, and none discusses the effects of fiber length in determining its dynamic and mechanical properties. Therefore, to have a full picture, this research study works with the Reinforcement Index (RI), which is the product of fiber volume fraction (Vf) (that is, fiber volume divided by the total component volume) with slenderness (l/d) (that is, fiber length divided by fiber diameter). The objectives of this study are to evaluate (1) compressive strength as a function of ultrasonic pulse velocity (UPV) and Reinforcement Index (RI); (2) static elasticity modulus (Ec) as a function of UPV; and (3) dynamic elasticity modulus (Ed) as a function of compressive strength (fc) and Reinforcement Index. For this, an experimental campaign was designed where the independent variable was the Reinforcement Index of polypropylene fibers through the variation in fiber volume fraction and length. In this study, we worked with fiber volume fractions of 0, 0.4, 0.8, and 1.2% and fiber lengths of 40, 50, and 60 mm. The dependent variables of this study were the mechanical properties of concrete: compressive strength and static elasticity modulus. On the other hand, the mediating variables were UPV and dynamic elasticity modulus. Finally, three methods were used for non-destructive prospecting using the ultrasonic pulse test: direct, semi-direct, and indirect methods. The structure of this paper is as follows: first, the experimental program is explained, wherein the materials and methods used are described; then, the results from tests on concrete in the fresh and hardened state and by NDT prospecting of the ultrasonic pulse, are presented; after that, it analyzes correlations and compares them to the existing literature; next, it presents prediction equations of mechanical and dynamic properties; and, finally, our conclusions are discussed.

2. Materials and Methods

2.1. Research Design

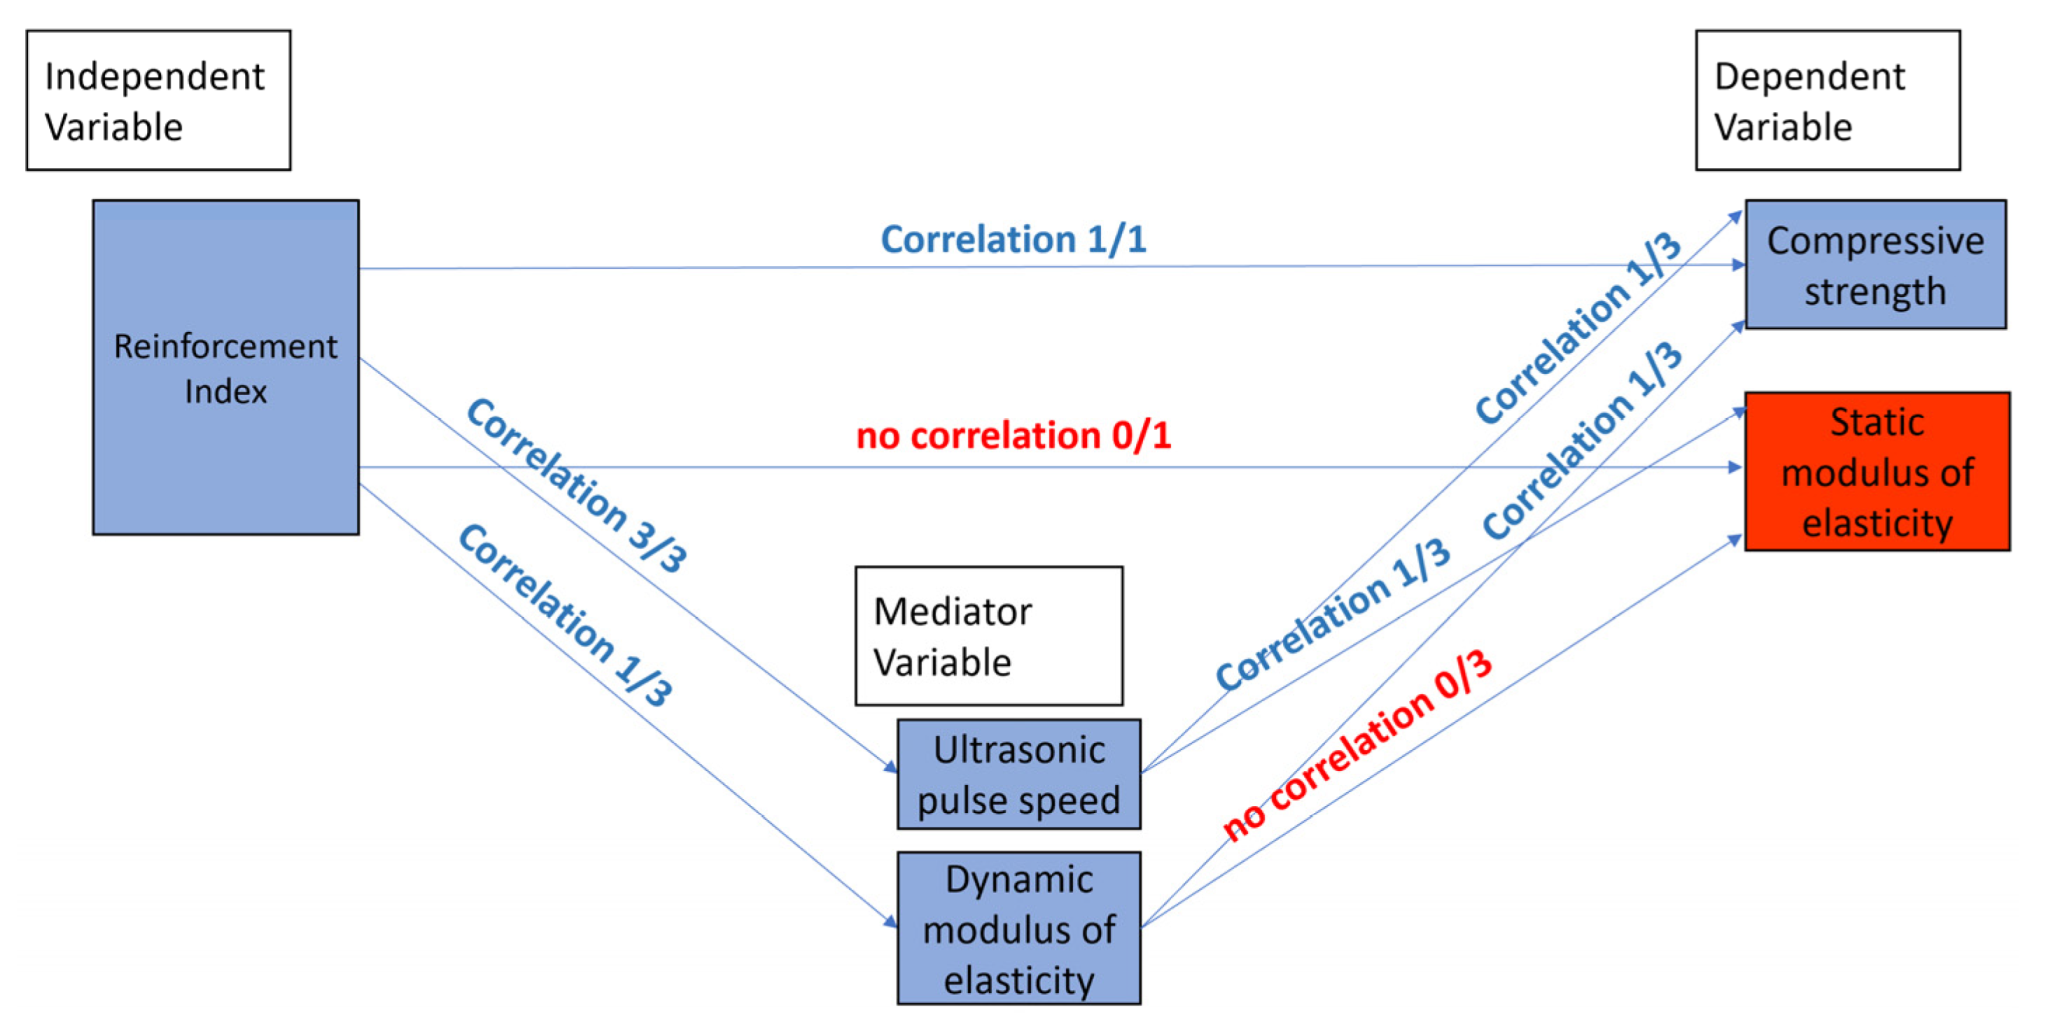
Figure 1 shows the experimental research design. The Reinforcement Index (RI) is the independent variable. The mechanical properties of concrete are the dependent variables. Finally, the dynamic properties calculated from the ultrasonic pulse are the mediating variables. Therefore, the correlation of the eight relationships shown will be analyzed in the next section.

2.2. Materials and Mixture

Water, Portland cement type I, fine aggregate, coarse aggregate, and polypropylene fibers (PP) were used to elaborate polypropylene fiber-reinforced concrete (PPFRC). Natural, fine river aggregates ranging from 0 to 4.69 mm and crushed coarse aggregates ranging from 4.69 to 25.4 mm were used from granulometric distribution number 56. Both aggregates comply with the granulometric requirements established in ASTM C-33 [22]. In addition, a super plasticizing additive (SP) “Sikament-290 N” was added to obtain good workability [3]. The fibers used are shown in Figure 2. Polypropylene macrofibers with knurled texture, rectangular section, and straight shape, with 0.86 mm diameter and 40, 50, and 60 mm lengths, were used; this resulted in slenderness values of 46, 58, and 70, respectively. The tensile strength of fibers was 540 MPa, according to the manufacturer.
The ACI method was used for the mixing design [26]. The mixture was designed to achieve an average compressive strength of 40 MPa, with a water/cement ratio of 0.45 and a slump of 100 mm. The same amount of cement, water, aggregate, and superplasticizer was used in all specimens. Fiber volume, Vf, the fraction was varied in 0.4, 0.8, and 1.2%, and fiber length, l, was varied in 40, 50, and 60 mm. In total, a standard mixture without fibers and nine blends with different fiber volume fractions were prepared. The detail for the mixtures is shown in Table 1. Finally, a normal-weight concrete of approximately 2350 kg/m3 was obtained.

2.3. Specimens

For the ultrasound test, prismatic specimens of 550 × 150 × 150 mm were prepared. A total of ten specimens were made (one for each mixture). Cylindrical specimens with a diameter of 150 mm and a height of 300 mm were also prepared to evaluate the samples’ elasticity modulus and compressive strength. In this case, three specimens were made for each mixture, for a total of 30 elements, where the same specimens were used both for the compressive strength tests and the static elasticity modulus. In total, 40 cylindrical specimens were made. All tests were performed at 28 days of curing. The specimens were mixed and cured per the ASTM C-192 standard [27]. The mixing process was as follows: first, 30% of the design water was added; then, 100% of the coarse aggregate was poured. After that, the fibers were gradually added and mixed for 30 s. Next, 100% of the fine aggregate was poured and mixed for 30 s; 100% of the cement was mixed for 10 s, and the remaining 70% water was added. Finally, it was mixed for 300 s, and the concrete was placed in molds. The mixing procedure complies with the one suggested by the supplier.

2.4. Test Procedure

2.4.1. Non-Destructive Ultrasonic Pulse Testing

The 58-E4800 UPV equipment by Controls was used for the ultrasound tests. Said equipment consists of a receiver transducer and a transmitter transducer capable of emitting frequencies ranging from 24 to 150 kHz. The recommendation of standard ASTM C-597 was followed [28], which states that frequencies equal to or greater than 50 kHz should be used to obtain greater accuracy in time measurement. The time meter is included in the equipment and has 1-microsecond accuracy as recommended by the standard [28]. Figure 3 provides images of the equipment used.
In the ultrasound test, the transducer transmits P (longitudinal) waves and S (shear) waves (plate waves) through the material in the axial direction. Additionally, edge waves (P and S) are produced but are very weak and carry little energy [11]. R (Rayleigh or surface) waves are also produced through the surface due to the boundary conditions [11,17,18]. P waves are characterized by high velocity and low amplitude, and R waves have low velocity and high amplitude [17]. The receiving transducer receives these waves; each of these waves’ arrival can be recorded with an oscilloscope’s help [17]. In this research study, no oscilloscope was used; because of this, only the arrival of the P wave was recorded. Since the test is very susceptible to interferences by external agents (such as machine vibrations), it was carried out without any type of vibration [24].
Three transmission modes were applied to all specimens: direct, semi-direct, and indirect methods. These methods were performed as per the BS-1881 standard [29]. The configurations of the three methods can be seen in Figure 3. In the direct method (Figure 3a), the transducers were placed on the ends of the beam located in the centers of the opposite faces at a distance of 545 mm from each other. For the semi-direct method (Figure 3b), the transducers were placed on adjacent perpendicular faces; one transducer in the center of the end face of the beam and another on the central face of the specimen at a distance of approximately 240 mm. Finally, for the indirect method (Figure 3c), both transducers were placed on the same side of the lateral surface of the parallelepiped at a distance of 450 mm from each other.
The test was performed three times for each specimen to eliminate possible interference factors. To do this, the center-to-center distance between transducers was measured, and the time was measured automatically with the equipment. With these results, the P-wave velocities were obtained. As a result, ASTM C-597 provides the following Equation (1) for calculating the dynamic elasticity modulus:
E d = V p 2 1 + v d 1 2 v d ρ 1 v d
where Ed is the dynamic elasticity modulus (N/m2), Vp is the P-wave velocity (m/s), ν d is the dynamic Poisson ratio, and ρ is the concrete density (kg/m3). Note that, in Equation (1), the dynamic elasticity modulus also depends on the dynamic Poisson ratio. Therefore, the velocity of two types of waves is required to calculate the Poisson ratio and the dynamic elasticity modulus. Due to this, the ASTM C-597 standard [28] recommends using the resonance test for this purpose; however, in this research, only the velocity of the P wave was measured. Accordingly, the Poisson ratio obtained from the static Poisson ratio test was used for this research. According to the results reported by Carrillo [24], there is a correlation between the static and dynamic Poisson’s ratio with an error of 39% and 14% when using the direct and indirect UPV methods, respectively, measured in concrete specimens with polypropylene fibers. Petro (2011) [18] determined a variation of ±7% in the dynamic elasticity modulus when the Poisson ratio varies between 0.15 and 0.25.

2.4.2. Destructive Testing of The Static Elasticity Modulus and the Poisson Ratio

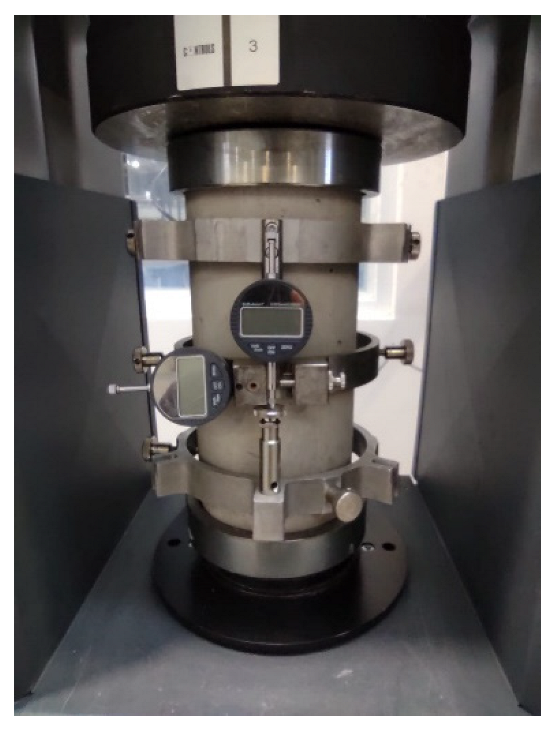
The tests were conducted as per the ASTM C-469 standard [30]. A 3000 KN capacity equipment with displacement control located in the Universidad de Lima Structural Laboratory was used. The sample was coupled to an extensometer to measure the vertical strain and another extensometer to measure the transverse strain. This configuration allowed us to determine the static elasticity modulus and the Poisson ratios. The test configuration can be seen in Figure 4.

3. Results

This section discusses the test results for fresh-state concrete, the mechanical properties of concrete calculated by destructive methods, and the dynamic properties of concrete calculated by the non-destructive ultrasonic pulse velocity method.

3.1. Fresh State Properties

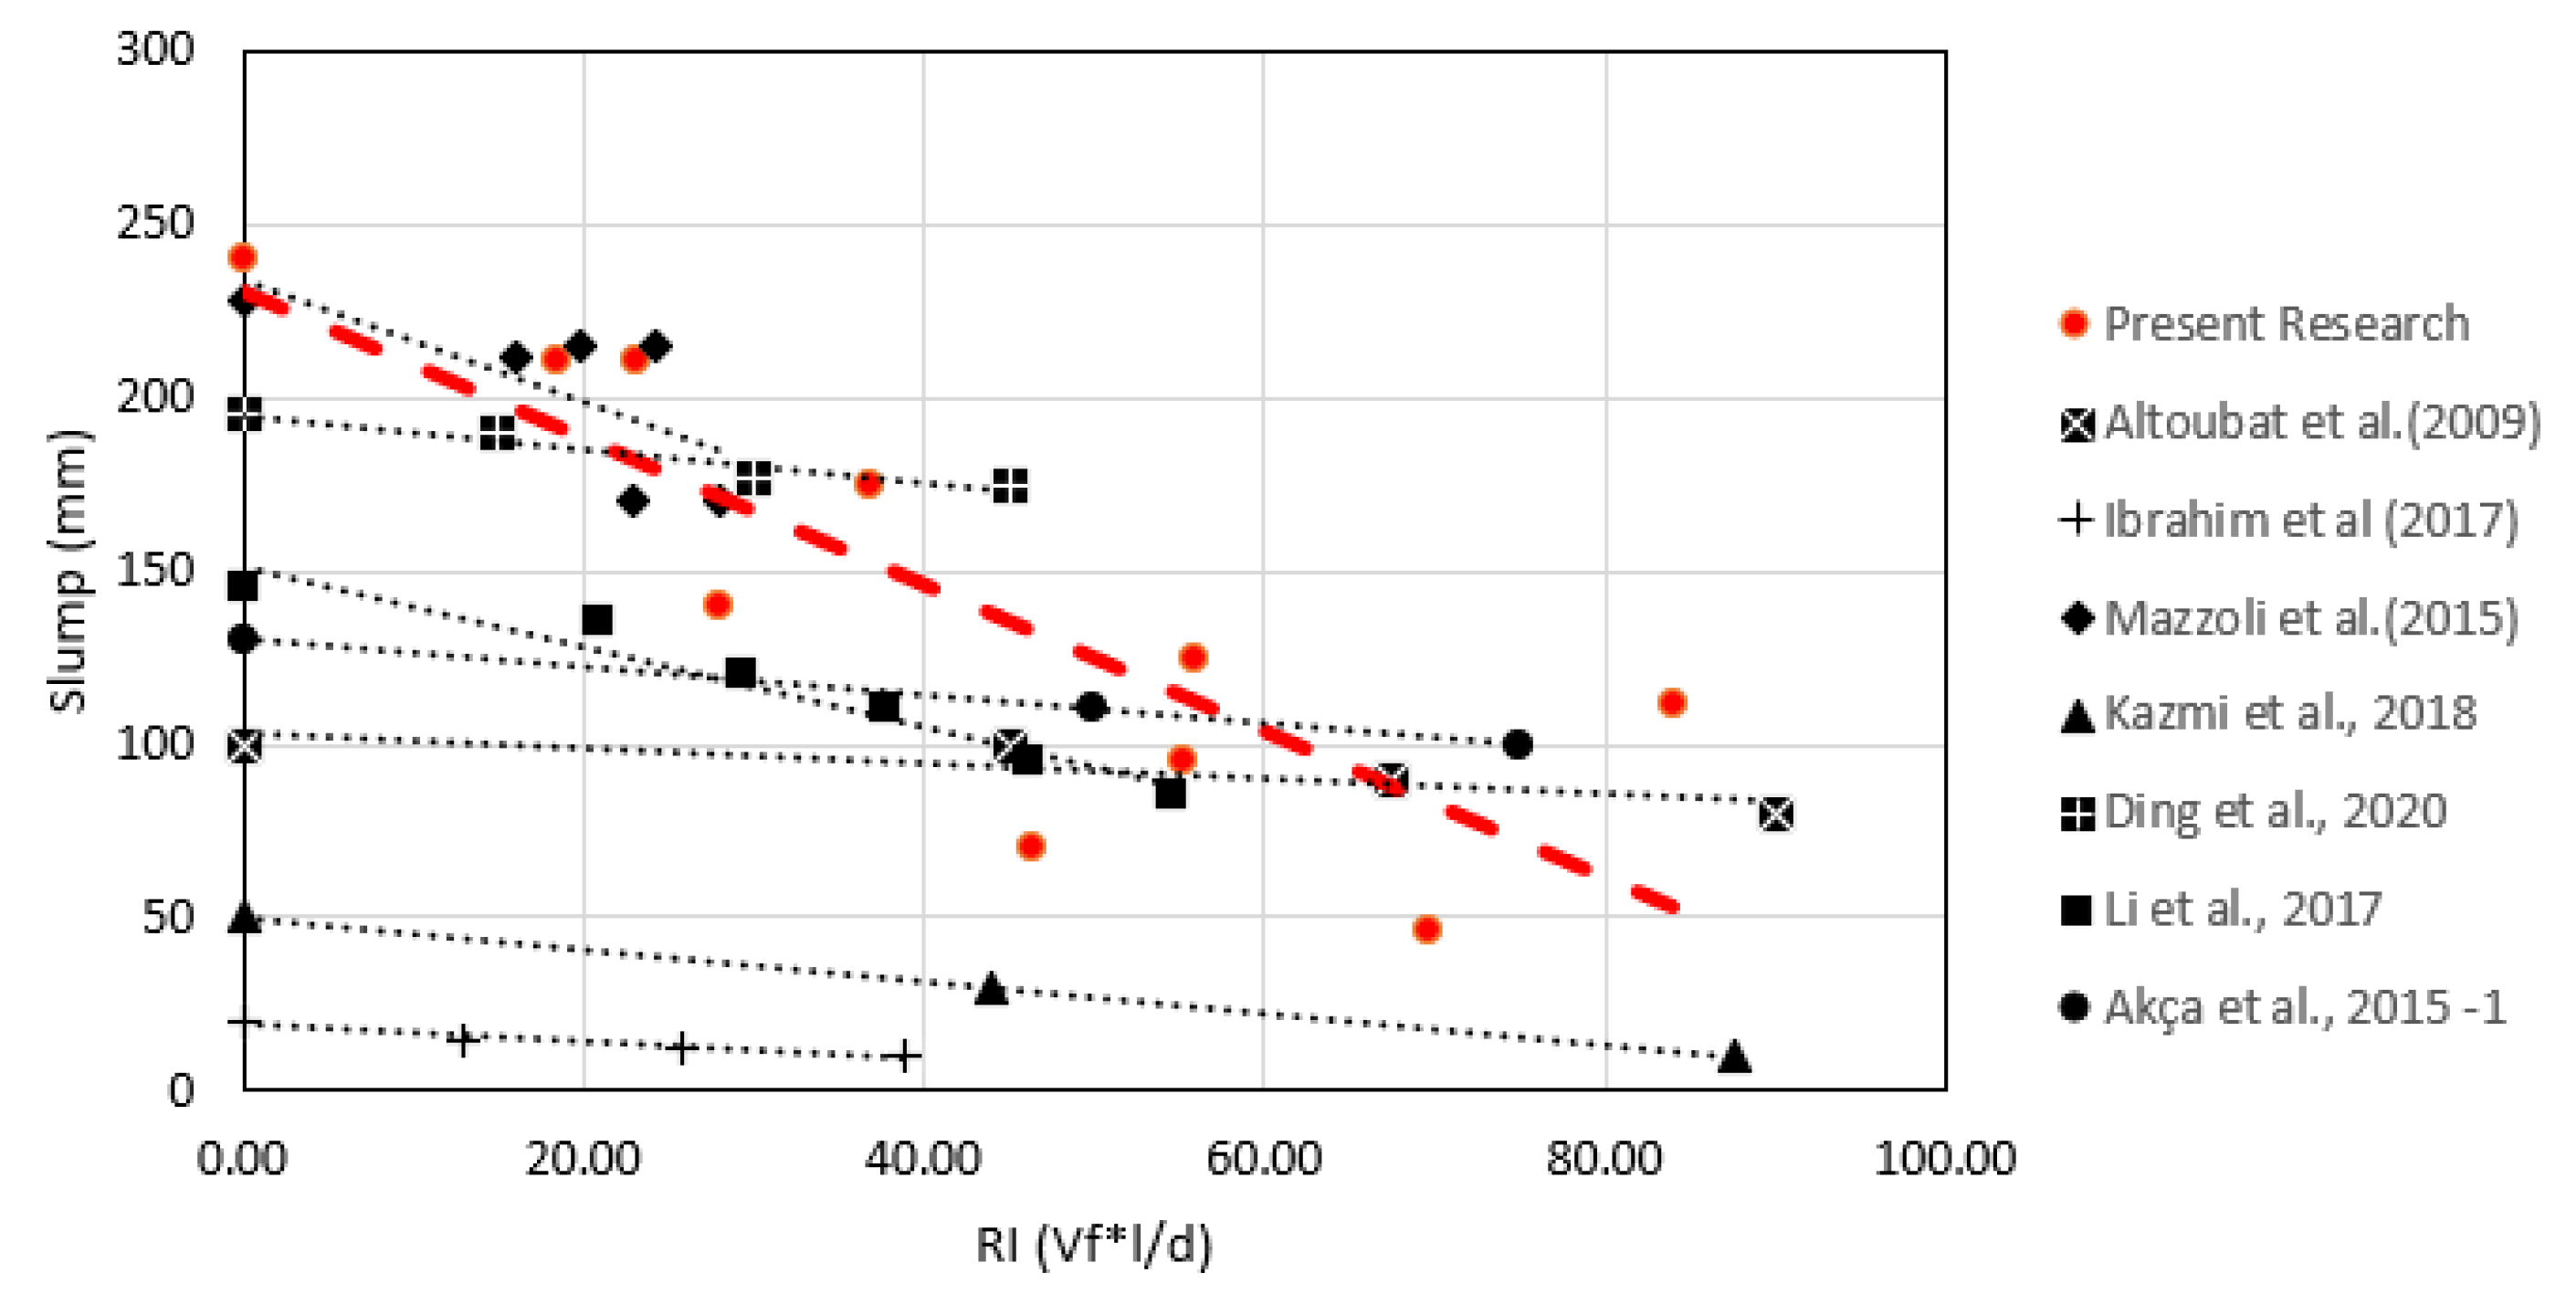
Table 2 lists the test results for fresh-state concrete: weight per unit, slump, and the percentage of air content per m3 of total volume. Note that the weight per unit of concrete varies between 2200 and 2330 kg/m3. The correlation between the slump and the RI indicates that the more fibers, the lower the resulting slump. This result is consistent with previous research because the fibers increase the viscosity of concrete in the fresh state by increasing interparticle friction. Figure 5 shows the relationship between the RI and the slump of this and other investigations [31,32,33,34,35,36,37,38]. It is noted that the same behavior is observed in all cases. Although the trend has a steeper slope than the rest, the behavior is within the expected parameters. Furthermore, the reduction in a slump with increasing RI is more pronounced in more fluid concretes. Regarding air content, Table 2 predominantly denotes that the higher the RI, the lower the air content in concrete. All air content values are above 2.8%, with an average of 3.4% when outliers are removed. In this investigation, there is not enough evidence to affirm that the air content increases or decreases with the RI. According to Wang et al. (2021) [39], the fibers make it difficult to mix, handle, transport, and vibrate the concrete, resulting in abundant voids in the hardened state. The investigations of Akca et al. (2015) and Ding et al. (2020) show that the air content is maintained or increased with the addition of fibers [37,40]. Finally, according to Zhu et al. (2011) [41], although air content affects UPV reading, these changes are less sensitive when it exceeds 2%.

3.2. Mechanical Properties of Concrete

The results for mechanical properties obtained via destructive tests are denoted in Table 3. The Poisson ratio, µ, compressive strength, fc, and static elasticity modulus, Ec, are shown in this table. The average Poisson ratio is 0.16, the average compressive strength is 40.5 MPa, and the average elasticity modulus is 30 GPa.

3.3. Ultrasonic Pulse Velocity and the Dynamic Elasticity Modulus of Concrete

The results of ultrasonic pulse velocity (UPV) using the direct, semi-direct, and indirect transmission methods are denoted in Table 4. In addition, the results of dynamic elasticity modulus, Ed, calculated for each method, according to Equation (1), are also shown in this table. Figure 6 provides a bar chart of these velocities for each mixture. The UPV resulting from the direct and semi-direct methods are similar, while the UPV resulting from the indirect method is approximately 25% higher.

4. Discussion

The structure of the analysis of the results is based on the research design illustrated in Figure 1 (see Section 2.1). First, a correlation between the Reinforcement Index and the mechanical properties of concrete (compressive strength and static elasticity modulus) was determined. Then, a correlation between the Reinforcement Index and the dynamic properties (ultrasonic pulse velocity and dynamic elasticity modulus) of concrete was identified. Finally, a correlation between the dynamic properties of concrete and its mechanical properties was established.
The test results were processed via statistical tests. First, the Grubbs outlier test was performed for each property value group. This test identifies the smallest or the largest outlier value. A significance level of 0.100 was used. Next, the identified outliers were removed from the series, as indicated in the following sections. Then, the difference in fits (DFFITS) test was performed to identify the outliers for the regression between the two variables. Again, the data pair with the highest DFFITS value and all values exceeding 0.89 were removed from the series. Finally, the Pearson test was used to determine whether there was a correlation between the variables. If the absolute value of the Pearson correlation coefficient is 0–5%, then the correlation will be “non-existent”; 5–20%, the correlation will be “very poor”; 20–40%, the correlation will be “poor”; 40–60%, it will be “medium”; 60–80%, it will be “considerable”; 80–95%, it will be “strong”; and, finally, if the value is 95–100%, the correlation level will be “perfect”.

4.1. Correlation between the Reinforcement Index and the Mechanical Properties of Concrete

4.1.1. Correlation of the Reinforcement Index and the Compressive Strength of Concrete

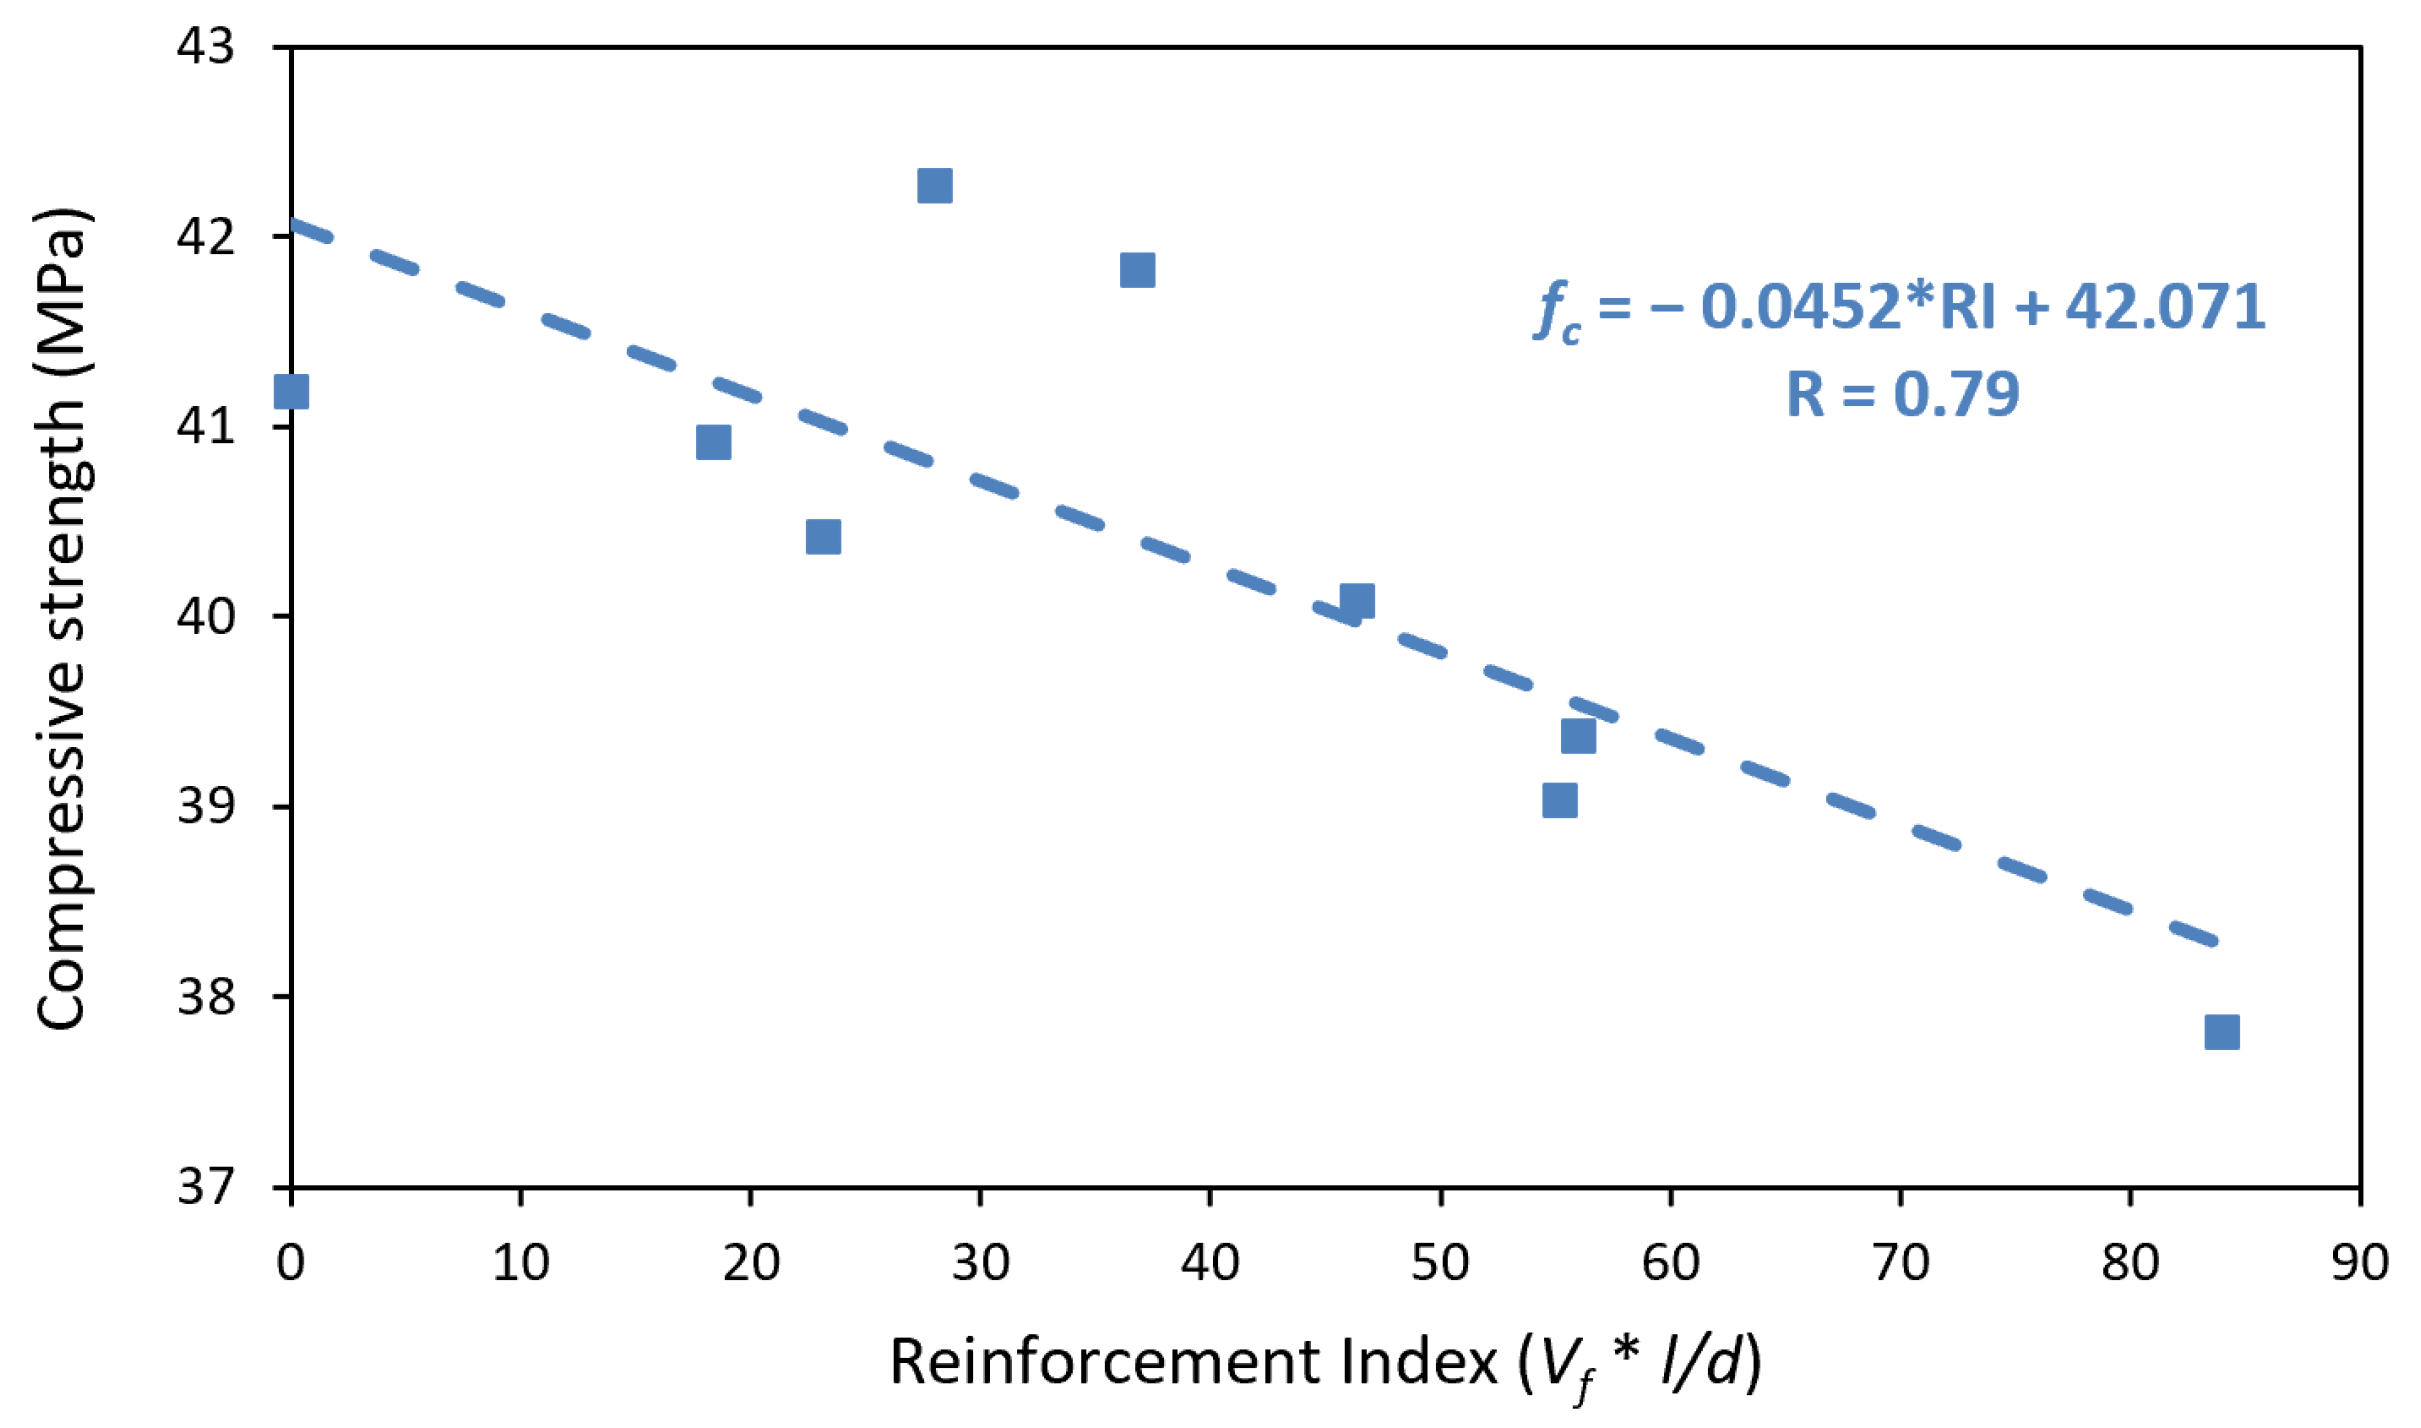
Figure 7 shows the correlation between the Reinforcement Index and the compressive strength of PPFRC. The value of fc = 42.16 MPa of mixture B-1.2%-50 was removed because the DFFITS parameter resulted in a value of 1.7 (greater than 0.89). The regression shows a Pearson correlation coefficient of −0.79, resulting in a considerable correlation. The p value for the Pearson test is 0.011, which is less than the 0.100 defined for this research. Therefore, the null hypothesis of no correlation between the variables is rejected. According to Figure 6, the higher the Reinforcement Index, the lower the compressive strength. Additionally, for each 10-unit increase in the Reinforcement Index, the compressive strength decreases by 0.45 MPa. Noushini et al. (2018) [42] and Sadeghi et al. (2013) [43] reported similar results and found a 1–7% reduction in the compressive strength of concrete due to the increment of the RI. However, different trends in this correlation were found in the literature. Li et al. (2017) [30], Hasan et al. (2011) [31], Hsie et al. (2008) [32], Aslami y Gedeon (2019) [33], Alhozaimy et al. (1996) [34], Jan and Khubaib (2018) [35], and Del Savio et al. (2022) [8] have concluded that the addition of plastic macrofibers in low volumes does not have significant effects on compressive strength because it increases less than 10%. On the other hand, Meddah and Bencheikh (2009) [44] found that adding fibers in volumes exceeding 2% generates a decrease in compressive strength. One explanation for this phenomenon is that the fibers fundamentally work in traction. Since polypropylene fibers have a low modulus of elasticity, they provide little confinement to the concrete, limiting their influence on compression loads. These fibers occupy a space that does not resist the compressive forces, subtracting a resistant area from the section, which decreases the compressive strength of the section.

4.1.2. Correlation of the Reinforcement Index and the Static Elasticity Modulus of Concrete

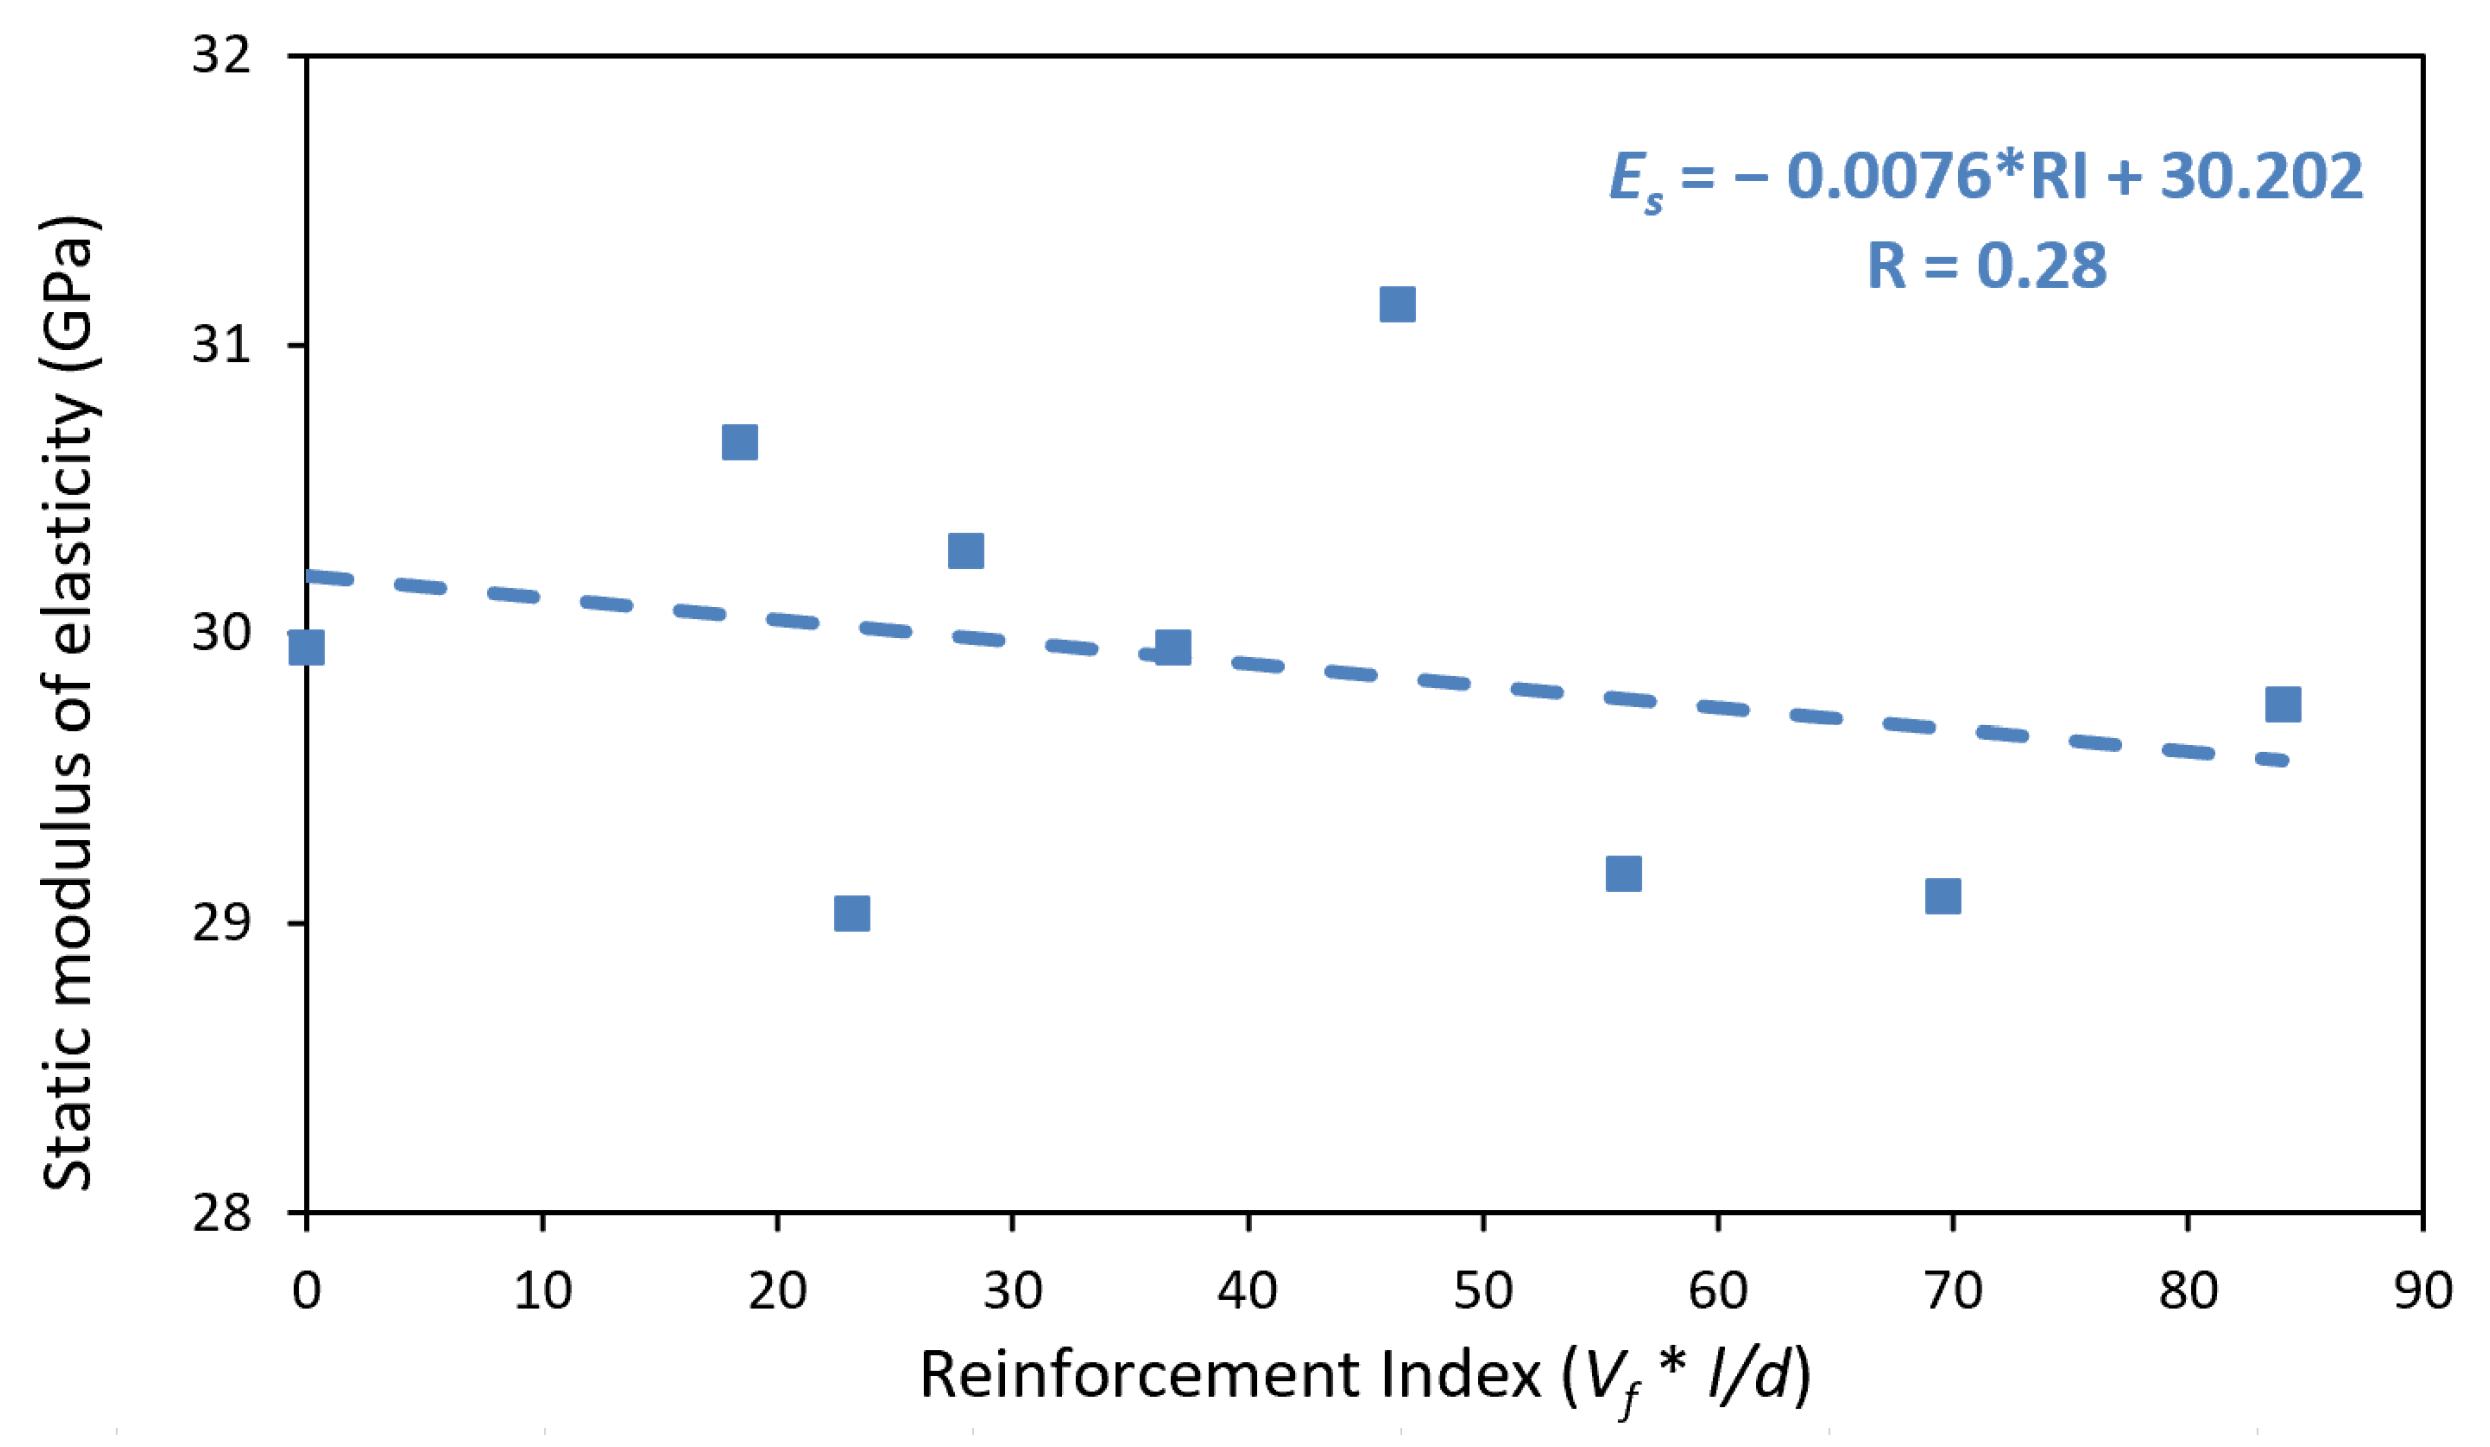
Figure 8 denotes the correlation between the Reinforcement Index and the static elasticity modulus of PPFRC. The value of Ec = 33.20 GPa of mixture B-1.2%-40 was removed because the DFFITS parameter resulted in a value of 1.52 (exceeding 0.89). The regression shows a Pearson correlation coefficient of −0.27, resulting in a mean correlation. The p value for the Pearson test is 0.470, which exceeds 0.100. Therefore, the null hypothesis that it is impossible to establish a correlation between the variables is accepted. Benaicha et al. (2015) [19] found a directly proportional positive correlation between these variables using steel fibers. On the other hand, Carrillo et al. (2019) [24] concluded that adding fibers does not significantly affect the elasticity modulus of concrete.

4.1.3. Correlation between Compressive Strength and the Static Elasticity Modulus of Concrete

Figure 9 depicts the static elasticity modulus ratio values between the root of the compressive strength. The 5314.65 value had to be removed from the B-1.2%-40 mixture (indicated in red) because it was an outlier according to the Grubbs test. Considering the data series, the average value is 4689, which is very close to the value given by the ACI Committee 318 of 4700 for normal-weight concrete. Table 5 lists Equations (2) and (3) from this research study and the ACI Committee 318.

4.2. Correlation between the Reinforcement Index and the Mechanical Properties of Concrete

4.2.1. Correlation between the Reinforcement Index and the Ultrasonic Pulse Velocity of Concrete

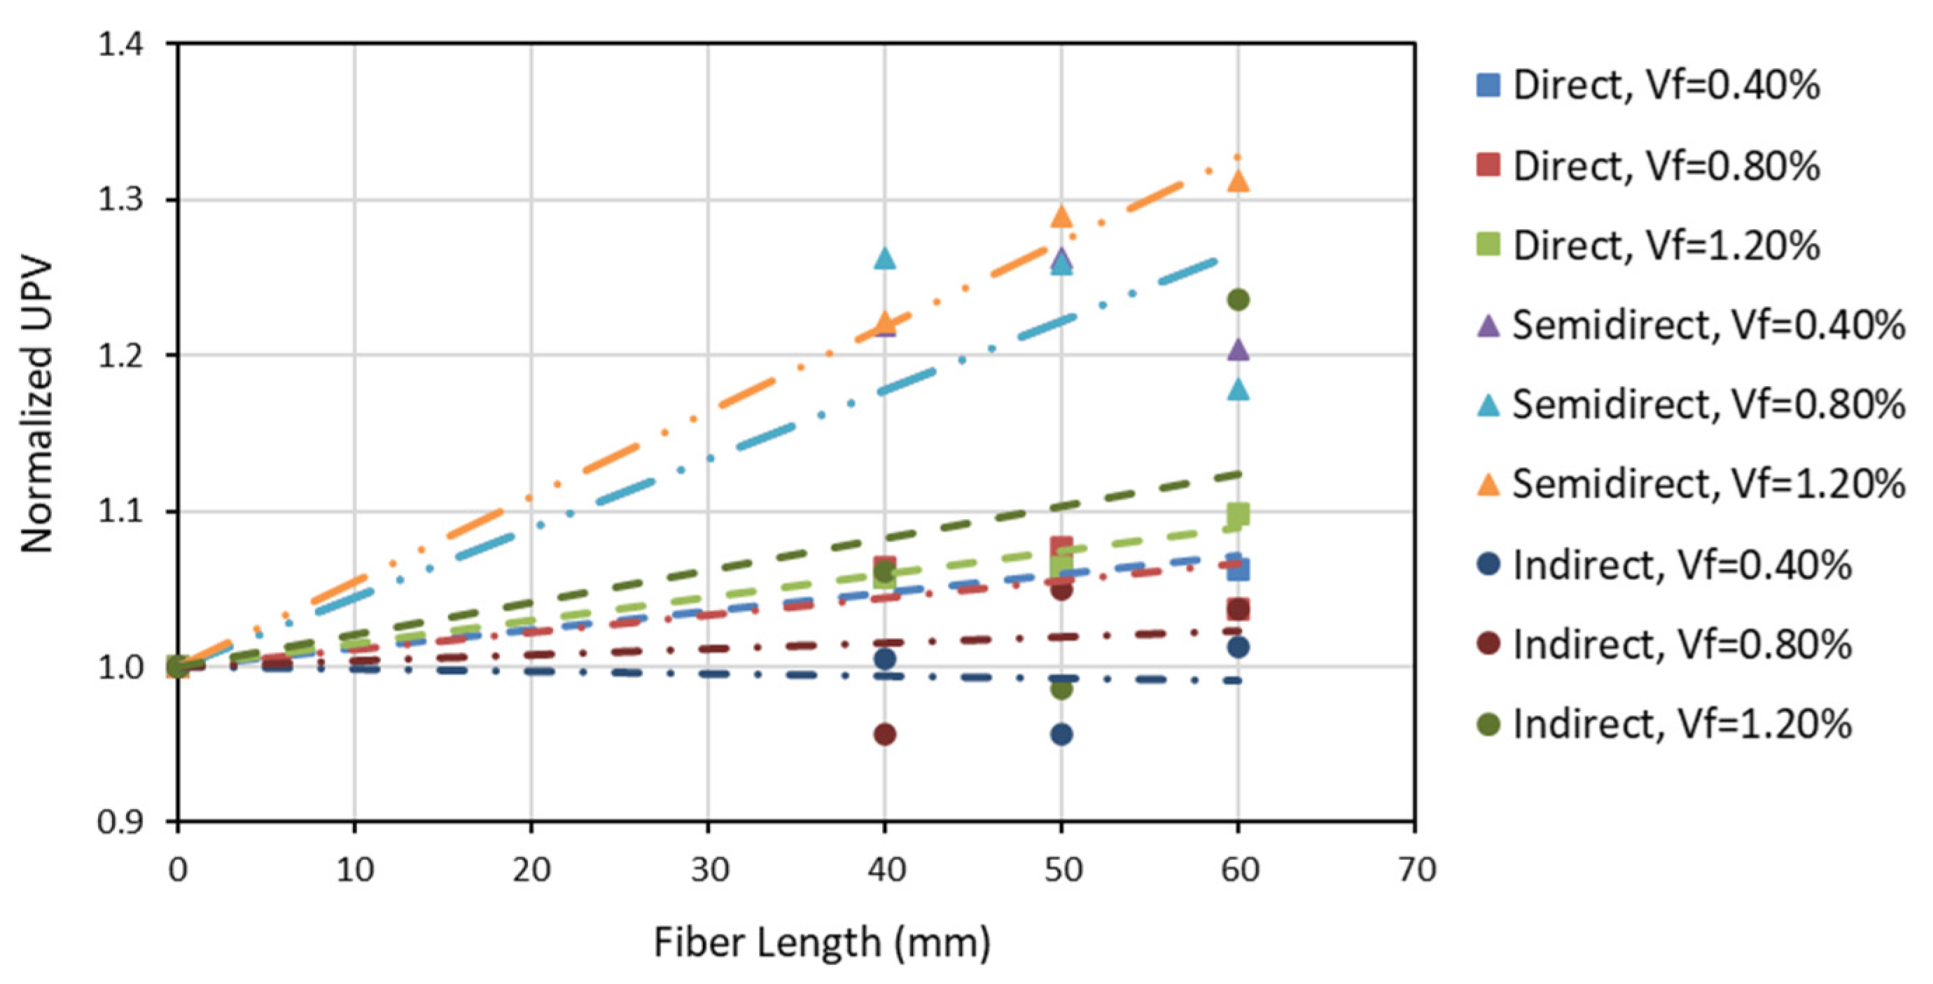
Figure 10 denotes the correlation between the Reinforcement Index and the ultrasonic pulse velocity of PPFRC. As mentioned in Section 2.4, three methods were used to evaluate ultrasonic pulse velocity: direct, semi-direct, and indirect. The value of UPV_ind = 4821.67 m/s was removed from the B-1.2%-50 mixture because it showed a DFFITS parameter of 0.97 (greater than 0.89). The regressions resulted in correlation coefficients of +0.66, +0.69, and +0.79, respectively, showing significant relations in all cases. The p values were 0.037, 0.026, and 0.011, respectively; all less than 0.100. Therefore, the null hypothesis of no correlation between variables in the three regressions is rejected. As seen in Figure 10, the indirect method shows a higher value of the Pearson correlation coefficient, and its slope is more marked. For each 10-unit increase in the Reinforcement Index, there is an increase of 26.05, 78.17, and 131.04 m/s in UPV related to the direct, semi-direct, and indirect methods, respectively. Moreover, the same image shows that the UPV results calculated via the indirect method are greater than the values calculated via the direct and semi-direct methods. These results contrast with the results of other studies. For example, Sadegui et al. (2013) [43] worked with PP fiber volume fractions of 0.10, 0.15, and 0.20%, concluding that increasing fiber volume causes a decrease in UPV. Results with the same trend are reported by Carrillo et al. (2019) [24], who worked with PP fibers (Vf = 0.42, 0.56, and 0.98%), and steel (Vf = 0.17, 0.40, 0.83%), using the method of direct and semi-direct prospecting, although hybrid fibers did not show this trend. However, the results of the current research study are consistent with those of Benaicha et al. (2015) [19], who worked with steel fibers (Vf = 0.5, 1.3, 1.5, 2.0, 2.5%) using the three prospecting methods and concluded that an increase in fiber volumes causes an increase in UPV. Note that all these studies (except this one) work only with fiber volume and not directly with the Reinforcement Index. Figure 11 denotes the influence of fiber length on wave velocity calculated by the three prospecting methods. The figure shows that the longer the fiber length, the higher the resulting wave velocity. Similarly, the influence of fiber volume fraction on UPV can be seen in Figure 12. As shown, the more fibers, the higher the resulting wave velocity.

4.2.2. Correlation of the Reinforcement Index in the Dynamic Elasticity Modulus of Concrete

Figure 13 denotes the correlation between the Reinforcement Index and the dynamic elasticity modulus of PPFRC. The UPV_ind = 4821.67 m/s value of the B-1.2%-50 mixture was removed due to its associated DFFITS parameter equal to 0.97 (greater than 0.89). This value causes an Ed_ind = 46.72 GPa, which was eliminated from the regression between the Reinforcement Index and the dynamic elasticity modulus. The regressions produced correlation coefficients of +0.22, +0.52, and +0.69 for the direct, semi-direct, and indirect methods, respectively, showing a poor relationship in the direct method, a medium relationship in the semi-direct method and a significant relationship in the indirect method. The p values were 0.523, 0.118, and 0.039, respectively; only the indirect method presented a p value below 0.100. Therefore, the null hypothesis that there is no correlation between the variables in the indirect method is rejected. The null hypothesis is accepted in the direct and semi-direct methods. The indirect method shows a higher value of the Pearson correlation coefficient, and its slope is more marked. For each 10-unit increase in the Reinforcement Index, there is an increase of 0.31, 1.10, and 2.91 GPa in the dynamic elasticity modulus related to the direct, semi-direct, and indirect methods, respectively. In addition, Figure 13 shows that the results calculated by the indirect method are greater than the values calculated by the direct and semi-direct methods.

4.3. Correlation between the Dynamic and Mechanical Properties of Concrete

4.3.1. Correlation between Ultrasonic Pulse Velocity and the Compressive Strength of Concrete

Figure 14 denotes the correlation between UPV and the compressive strength of PPFRC for the direct, semi-direct, and indirect methods. The values of UPV_dir = 4281.30 m/s (B-1.2%-60), UPV_sem = 3275.00 m/s (B-Pattern) and UPV_ind = 6049.10 m/s (B-1.2%-60) were eliminated because the calculated DFFITS parameters were 1.40, 1.87 and 3.78, respectively (all greater than 0.89). The regressions resulted in correlation coefficients of +0.065, −0.125, and −0.642 for the direct, semi-direct, and indirect methods, respectively, thus evidencing a very poor relation in the direct and semi-direct method and a significant relation in the indirect method. The p values were 0.869, 0.748 and 0.062, respectively. As only the indirect method reported a p value under 0.100, the null hypothesis that there is no correlation between variables in the indirect method is therefore rejected. Still, our null hypothesis is accepted for the direct and semi-direct methods. The indirect method exhibits a higher value for the Pearson correlation coefficient, and its slope is more marked. For every 1000-unit increase in the UPV, there is a decrease of 4.1 MPa in compressive strength. This trend differs from what was found in the literature review. Benaicha et al. (2015) [19], Tsioulou et al. (2017) [12], and Sadeghi and Lotfi (2013) [43] report that the higher the UPV, the greater the compressive strength of concrete with steel fibers.

4.3.2. Correlation between Ultrasonic Pulse Velocity and the Static Modulus of Elasticity of Concrete

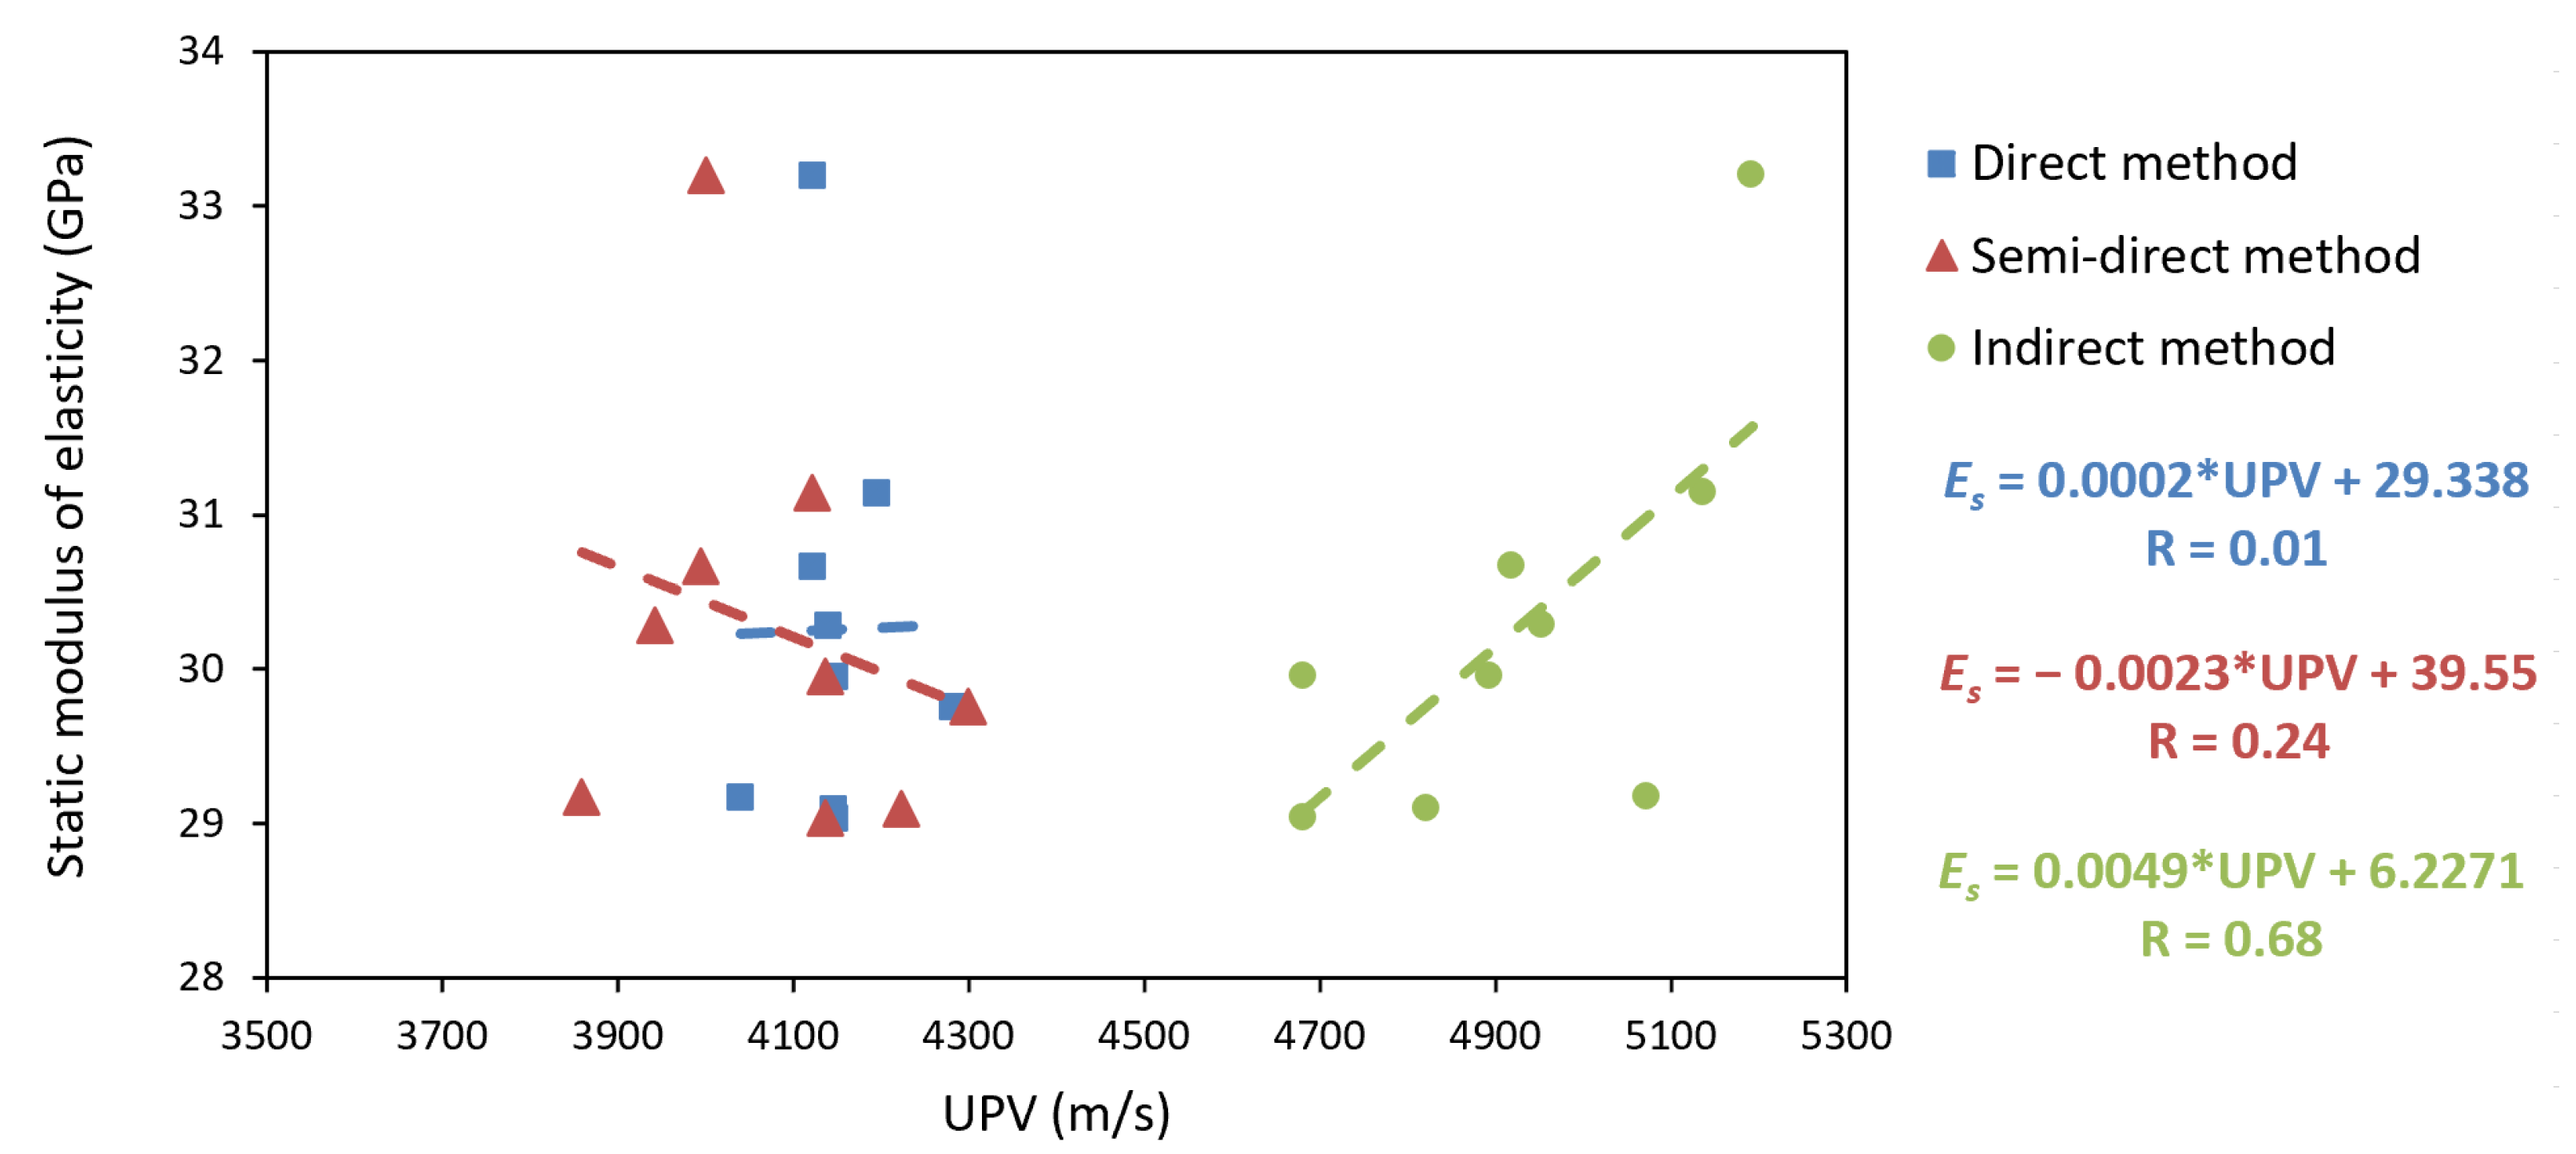
Figure 15 illustrates the correlation between UPV and the Static Modulus of Elasticity of PPFRC for the direct, semi-direct, and indirect methods. The values of UPV_dir = 3897.55 m/s (B-Pattern), UPV_sem = 3275.00 m/s (B-Pattern) and UPV_ind = 6049.10 m/s (B-1.2%-60) were eliminated because the calculated DFFITS parameters were 1.18, 1.81 and 2.77, respectively (all greater than 0.89). The regressions resulted in correlation coefficients of +0.01, −0.24, and +0.68 for the direct, semi-direct, and indirect methods, respectively, showing a non-existent relation in the direct method, a poor relation in the semi-direct method and a significant relation in the indirect method. The p values were 0.978, 0.531 and 0.044, respectively. As only the indirect method had a p value below 0.100, the null hypothesis that there is no correlation between variables in the indirect method is therefore rejected. However, our null hypothesis is accepted for the direct and semi-direct methods. The indirect method reports the highest value for the Pearson correlation coefficient. For every 1000-unit increase in UPV, there is an increase of 4.9 GPa in the Static Modulus of Elasticity. This result is consistent with the results reported by Benaicha et al. (2015) [19], who reported a similar correlation using steel fibers.

4.3.3. Correlation between the Dynamic Modulus of Elasticity and the Compressive Strength of Concrete

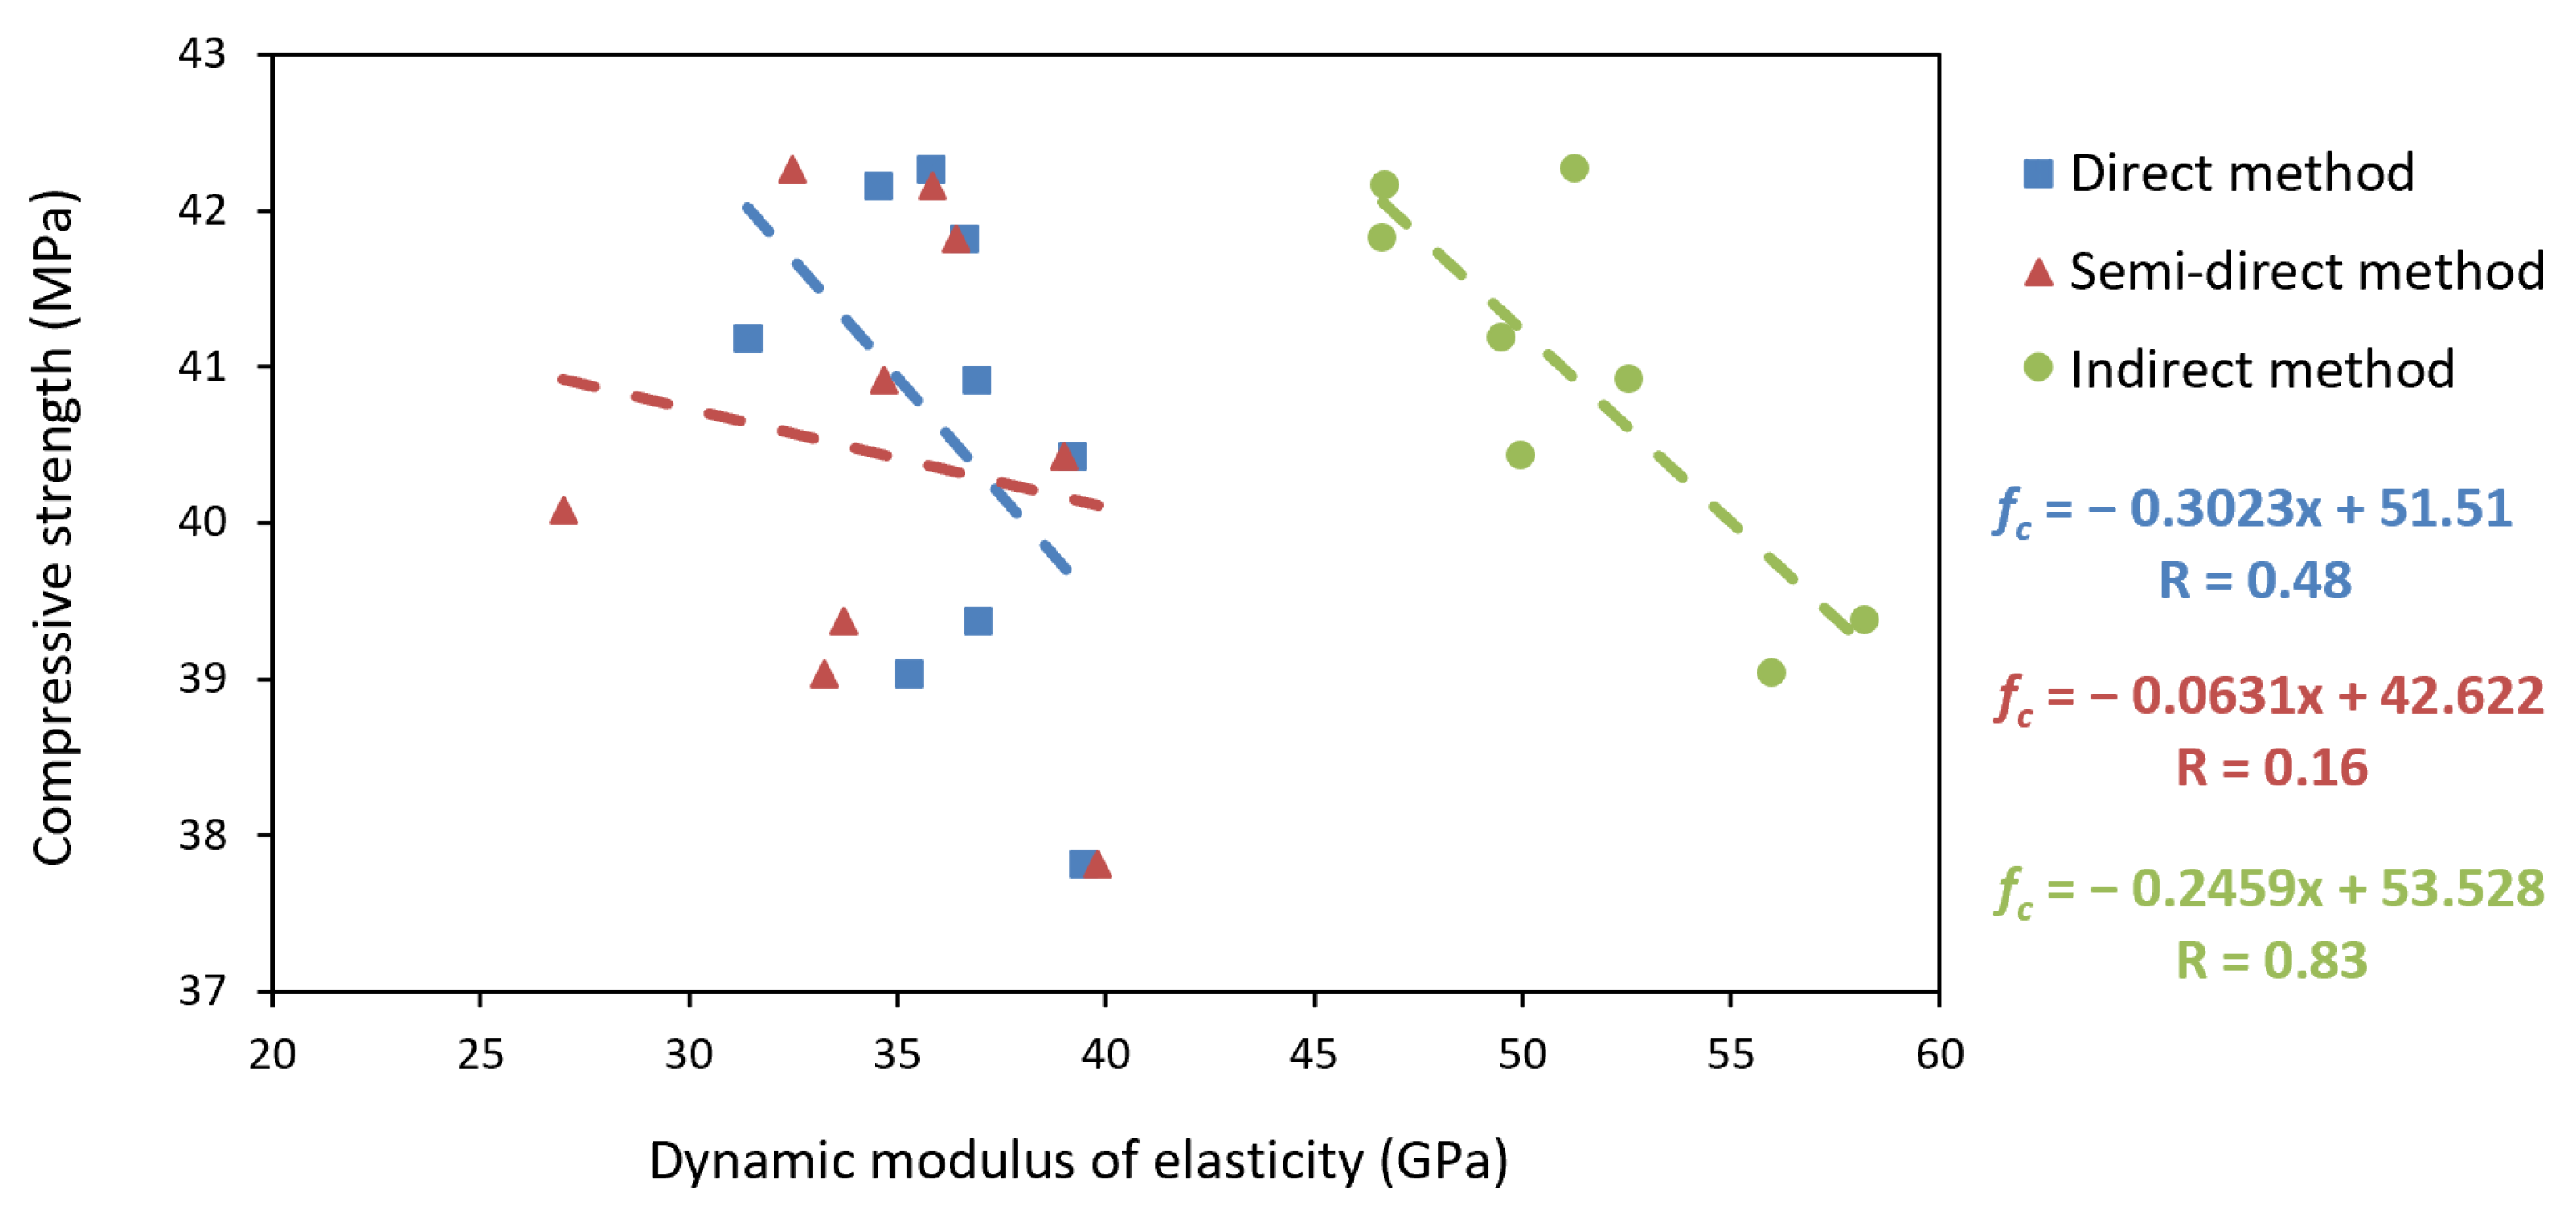
Figure 16 denotes the correlation between the Dynamic Modulus of Elasticity and the compressive strength of PPFRC for the direct, semi-direct, and indirect methods. The values of Ed_dir = 27.98 GPa (B-0.8%-50), Ed_sem = 22.17 GPa (B-Pattern), Ed_ind = 78.78 GPa (B-1.2%-60) and Ed_ind = 41.95 GPa (B-0.8%-50) were eliminated because the calculated DFFITS parameters were 1.25, 1.07, 3.32 and 0.91, respectively (all greater than 0.89). The regressions resulted in correlation coefficients of −0.48, −0.16, and −0.83 for the direct, semi-direct, and indirect methods, respectively, showing an average relation in the direct method, a very poor relation in the semi-direct method and strong relation in the indirect method. The p values were 0.191, 0.685 and 0.011, respectively. As only the indirect method presented a p value below 0.100, the null hypothesis that there is no correlation between variables in the indirect method is therefore rejected. However, our null hypothesis is accepted for the direct and semi-direct methods. The indirect method reports the highest value for the Pearson correlation coefficient. For every 10 GPa increase in the Dynamic Modulus of Elasticity, there is a 2.46 MPa decrease in compressive strength.

4.3.4. Correlation between the Dynamic and the Static Modulus of Elasticity of Concrete

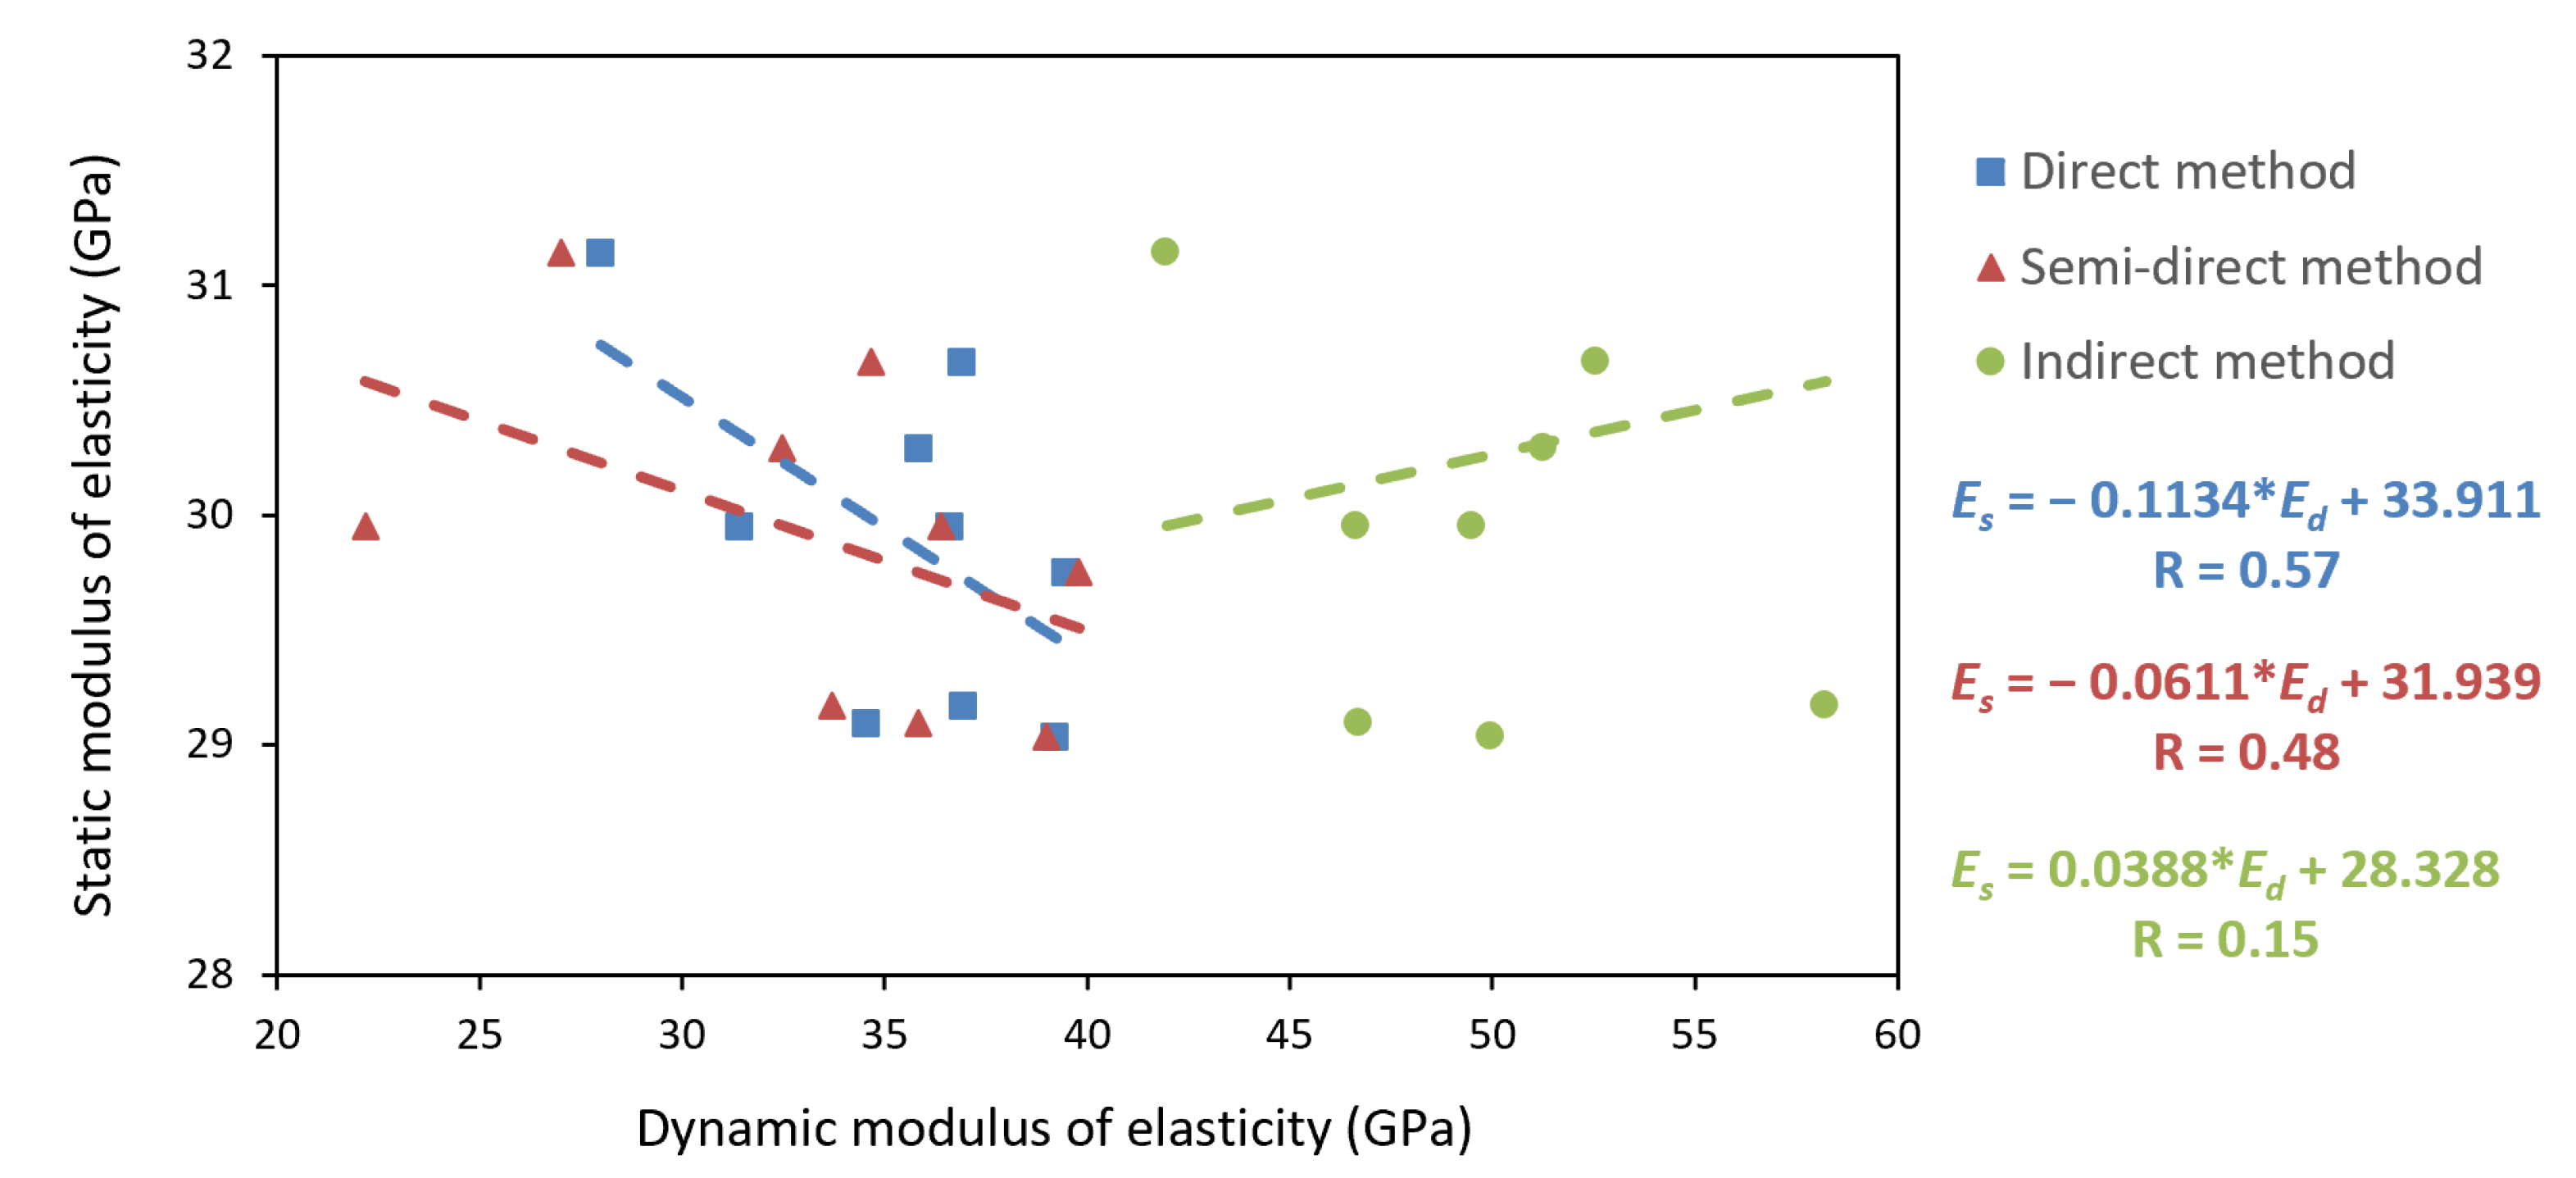
Figure 17 denotes the correlation between the dynamic and the Static Modulus of Elasticity of PPFRC for the direct, semi-direct, and indirect methods. The values of Ed_dir = 35.28 GPa (B-0.8%-60), Ed_sem = 33.23 GPa (B-0.8%-60), and Ed_ind = 78.78 GPa (B-1.2%-60) were eliminated because the calculated DFFITS parameters were 2.51, 1.98 and 1.86, respectively (all greater than 0.89). The regressions resulted in correlation coefficients of −0.58, −0.48, and +0.15 for the direct, semi-direct, and indirect methods, respectively, showing a median relation in the direct and semi-direct methods, and a very poor relation in the indirect method. The p values were 0.357, 0.447 and 0.890, respectively. As no method reported a p value under 0.100, the null hypothesis is accepted for all cases. No correlation between the two variables can be established.

4.4. Relation between Variables

Figure 18 denotes the correlations between variables of the experimental design. The fractions in each connection outline the number of relations found between variables out of the number of possible relations. According to the information in Section 4.1.1 (and as summarized in Figure 17), there is a correlation between the Reinforcement Index and the compressive strength. Concerning the descriptions of Section 4.2.1 (also summarized in Figure 17), there is a correlation between the Reinforcement Index and UPV in the three tested methods. In contrast, there is a correlation only between the Reinforcement Index and the Dynamic Modulus of Elasticity through the indirect method (see Section 4.2.2). Finally, according to the results of Section 4.3, there is a correlation between UPV and the compressive strength and the Static Modulus of Elasticity via the indirect method. At the same time, there is a correlation between the Dynamic Modulus of Elasticity and the compressive strength via the indirect method. In addition, no correlation was found between the Dynamic Modulus of Elasticity and the Static Modulus of Elasticity (see Section 4.3.4), nor between the Reinforcement Index and the Static Modulus of Elasticity (see Section 4.1.2).
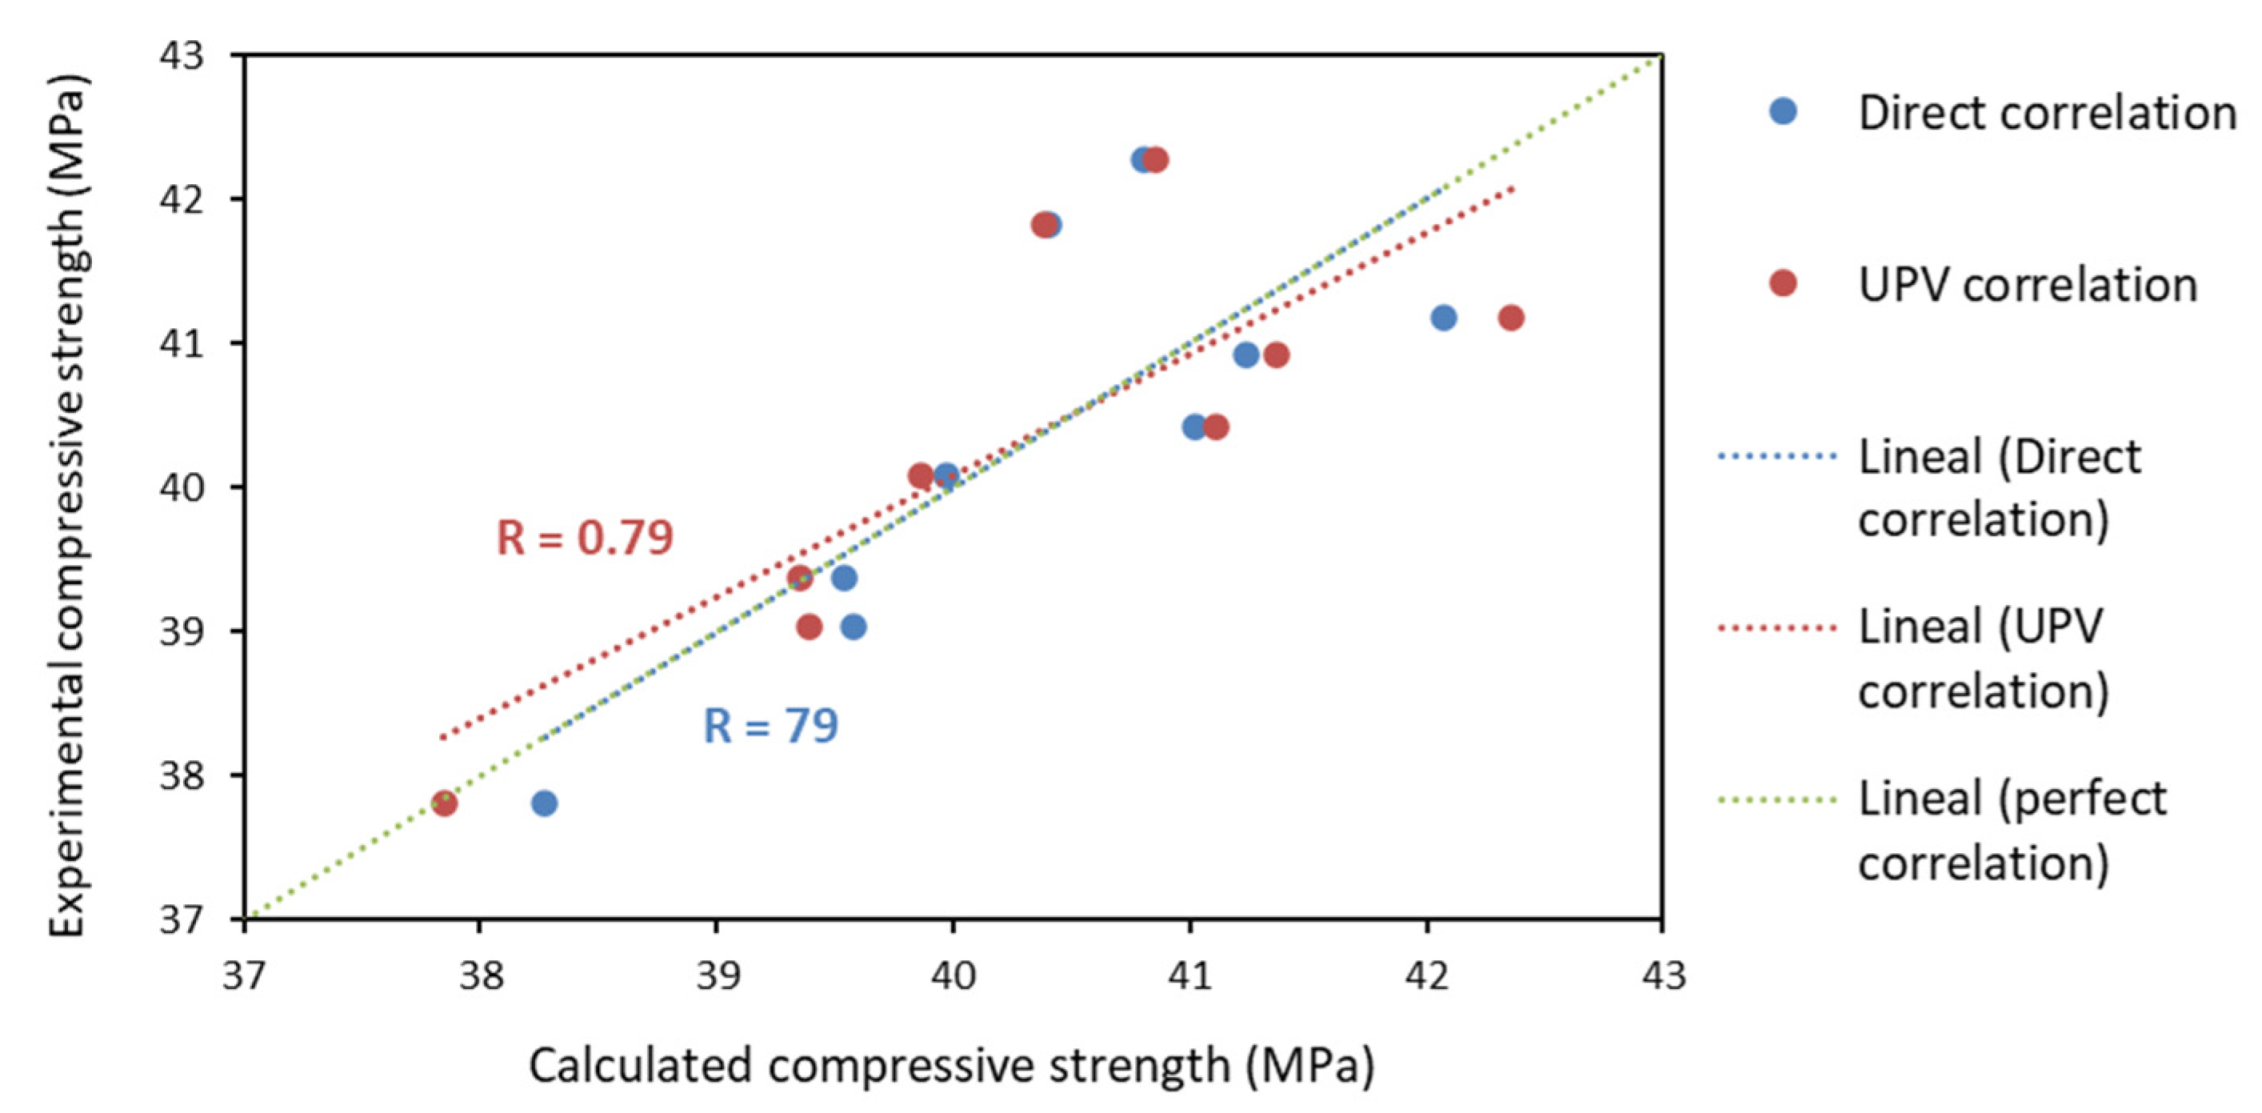
The validation of the results related to the compressive strength of PPFRC is shown in Figure 19. The Y-axis denotes the compressive strength experimental values; the X-axis denotes the values calculated in two ways: (1) via the calculated correlation formula between compressive strength and the Reinforcement Index (see Figure 7), and (2) via the combination of calculated correlation formulas between, first, the Reinforcement Index and UPV (see Figure 9, indirect method) and, second, between UPV and compressive strength (see Figure 13, also indirect method). As shown in Figure 19, both results are very close to each other, having identical coefficients of determination of 0.6299.

5. Predictive Statistical Analysis

5.1. Prediction of Compressive Strength as a function of Ultrasonic Pulse Velocity

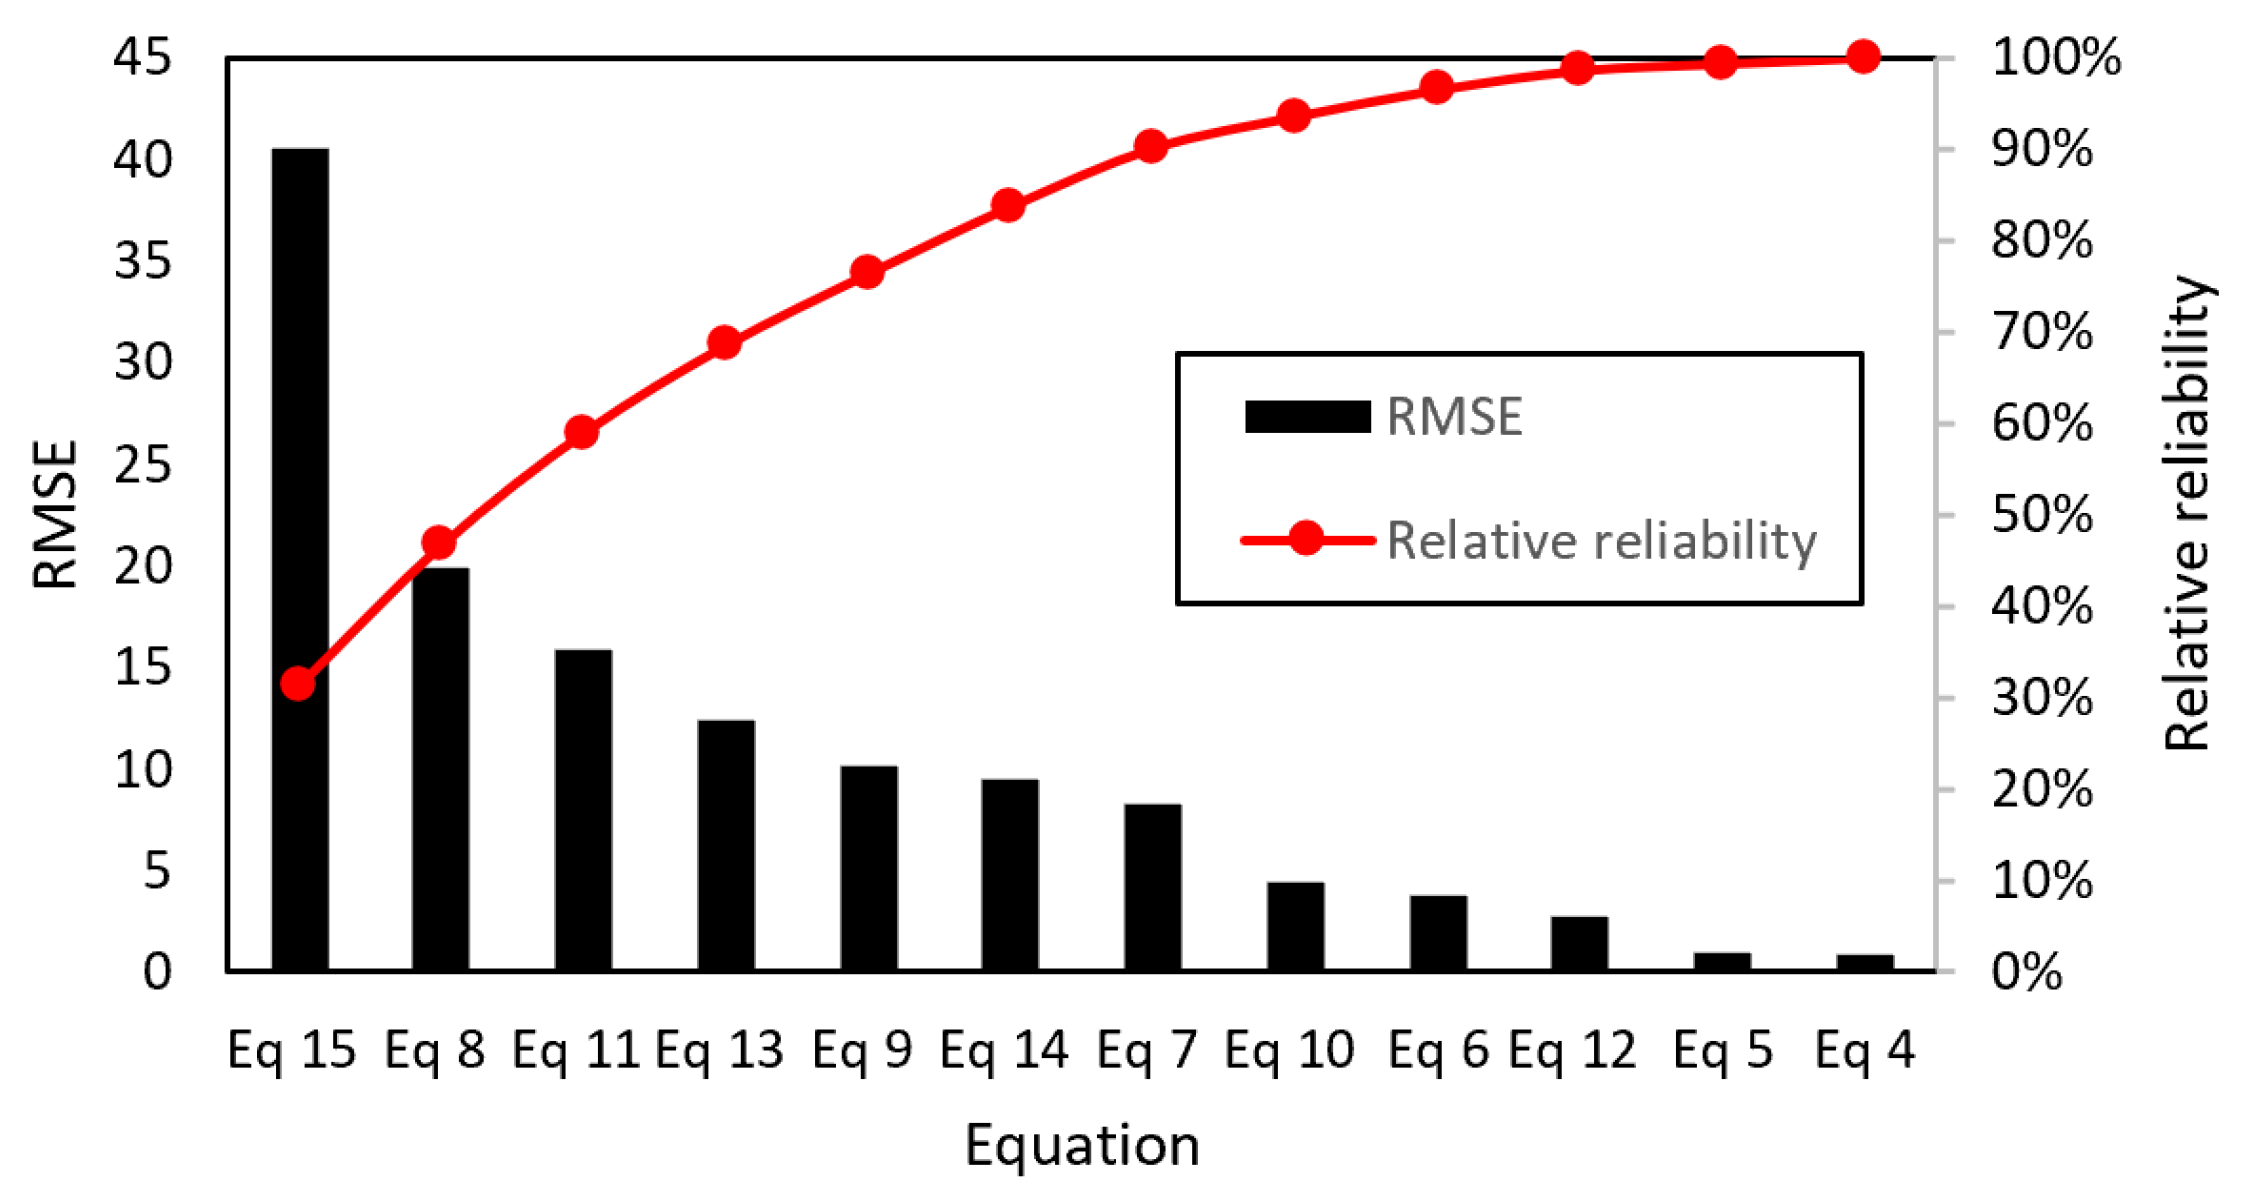
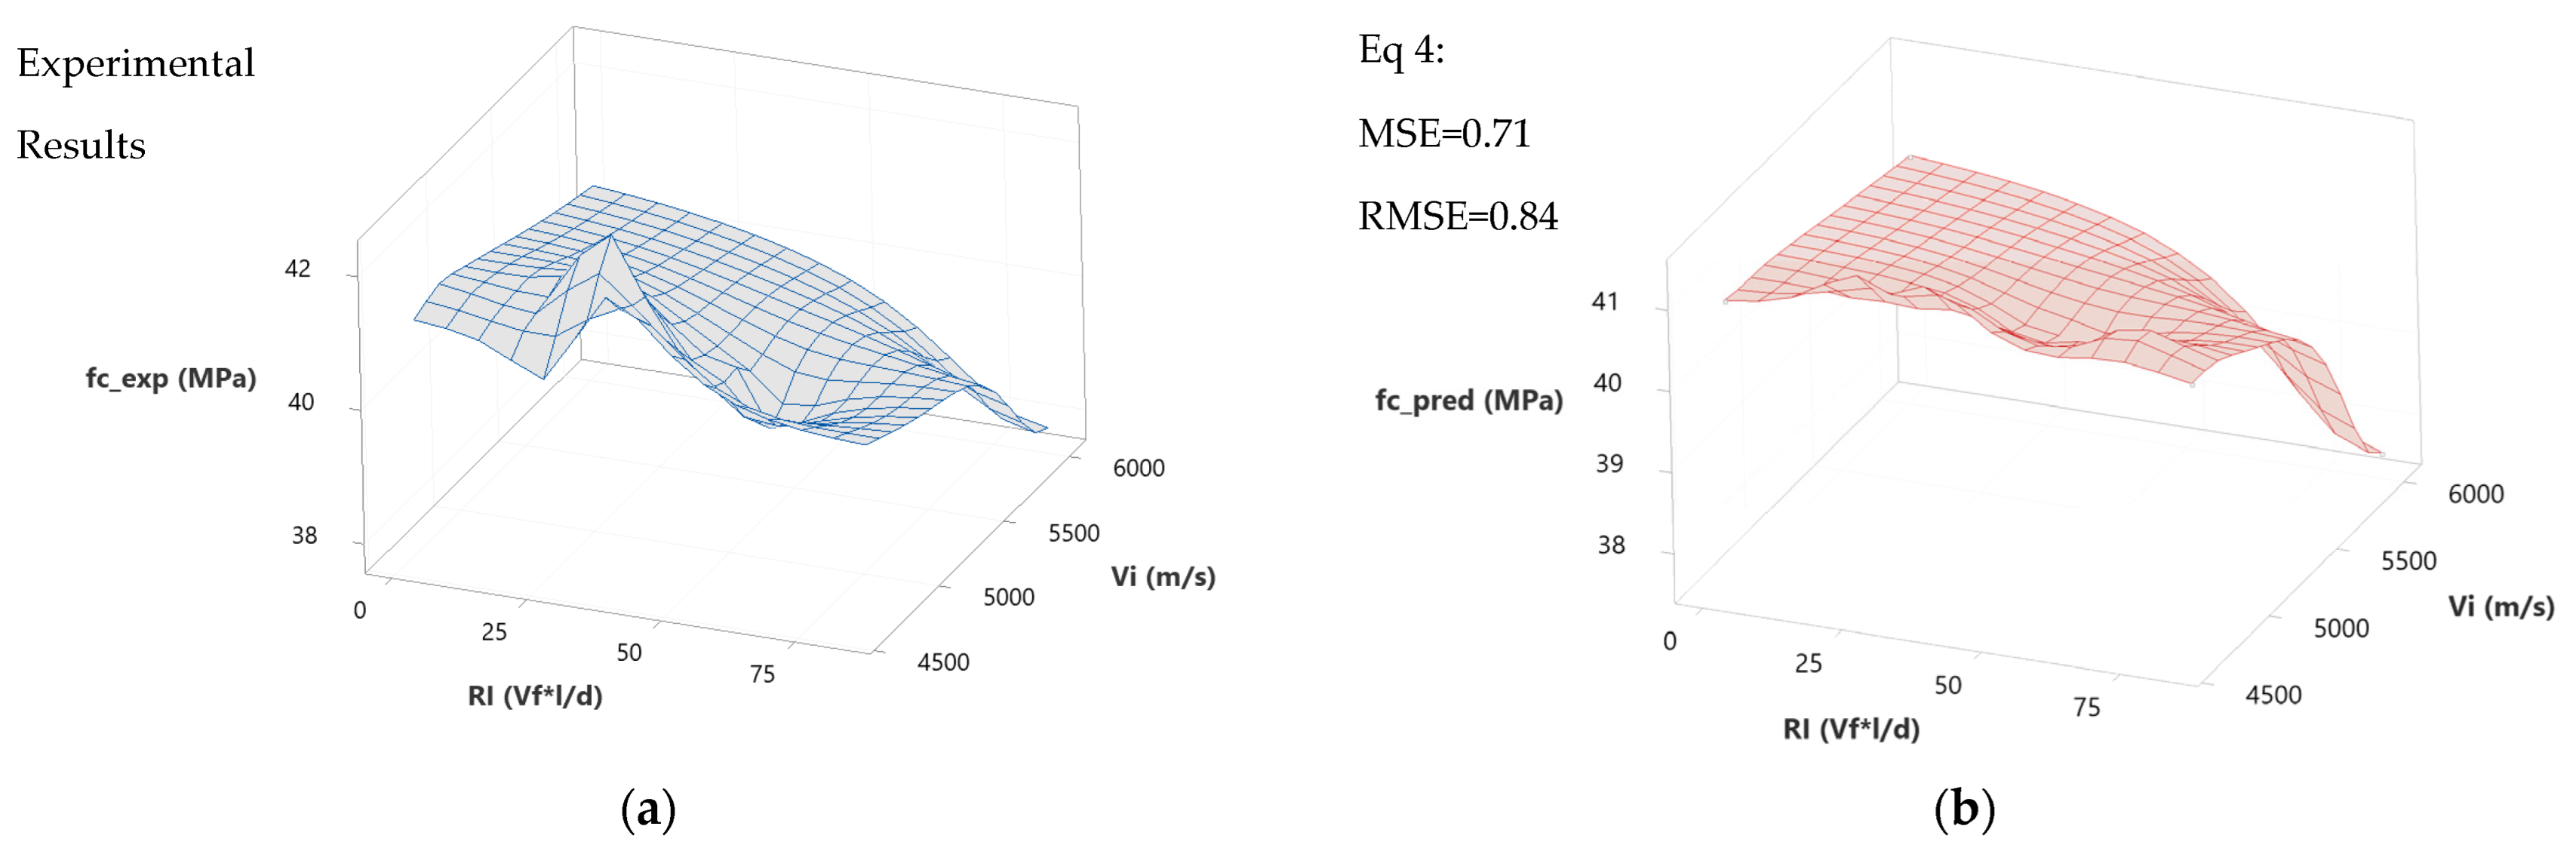
The previous section emphasized a correlation between UPV and compressive strength by indirect transmission mode. Table 6 denotes the three equations proposed in this study. The first (Equation (4)) is an exponential equation because several authors use said form to express the respective relation. The second is a linear Equation (Equation (5)), and the third is a multivariable linear Equation (Equation (6)). The latter incorporates the Reinforcement Index as a calculation variable since there is a correlation between the Reinforcement Index and compressive strength. Benaicha et al. (2015) [19] propose an exponential Equation (Equation (7)) valid for steel fibers with fiber volume fractions ranging from 0 to 2.5% [13]. Nematzadeh and Poorhosein (2017) [13,45] propose exponential expressions for steel fibers, with volume fractions of 1, 2 and 3% (Ec 8); and for PVA fibers with volume fractions of 0.25, 0.50 and 0.75% (Ec 9). Finally, Nematzadeh et al. (2018) [46] propose an Equation for polyvinyl fibers with a volume fraction of 0.5% (Ec 10). In addition, the expressions proposed by Bellaribi et al. (2016) [47] and Sadeghi Nik and Lotfi Omran (2013) [43] for concrete with steel and polypropylene fibers (Equations (1)–(15)) are shown. Figure 20 compares compressive strength predictions using the different expressions in Table 6; the x-axis is the RI, while the y-axis is the compressive strength normalized to the strength of the standard concrete in this study. All values are divided by f_c = 41.18 MPa corresponding to the B-Pattern mixture (see Table 3). Figure 21 is a combined graph showing a histogram including the values of the root-mean-square deviation (RMSE) for the different predictions and a Pareto chart showing the relative reliability of each equation compared to each other. Equation (4) is the one that offers the best approximation to the experimental data since its RMSE is the lowest of all the equations, with a value of 0.84. Figure 22 illustrates the relation between UPV and the Reinforcement Index with experimental compressive strength (Figure 22a) and predicted compressive strength (Figure 22b) with Equation (4).

5.2. Prediction of the Static Modulus of Elasticity as a function of Ultrasonic Pulse Velocity

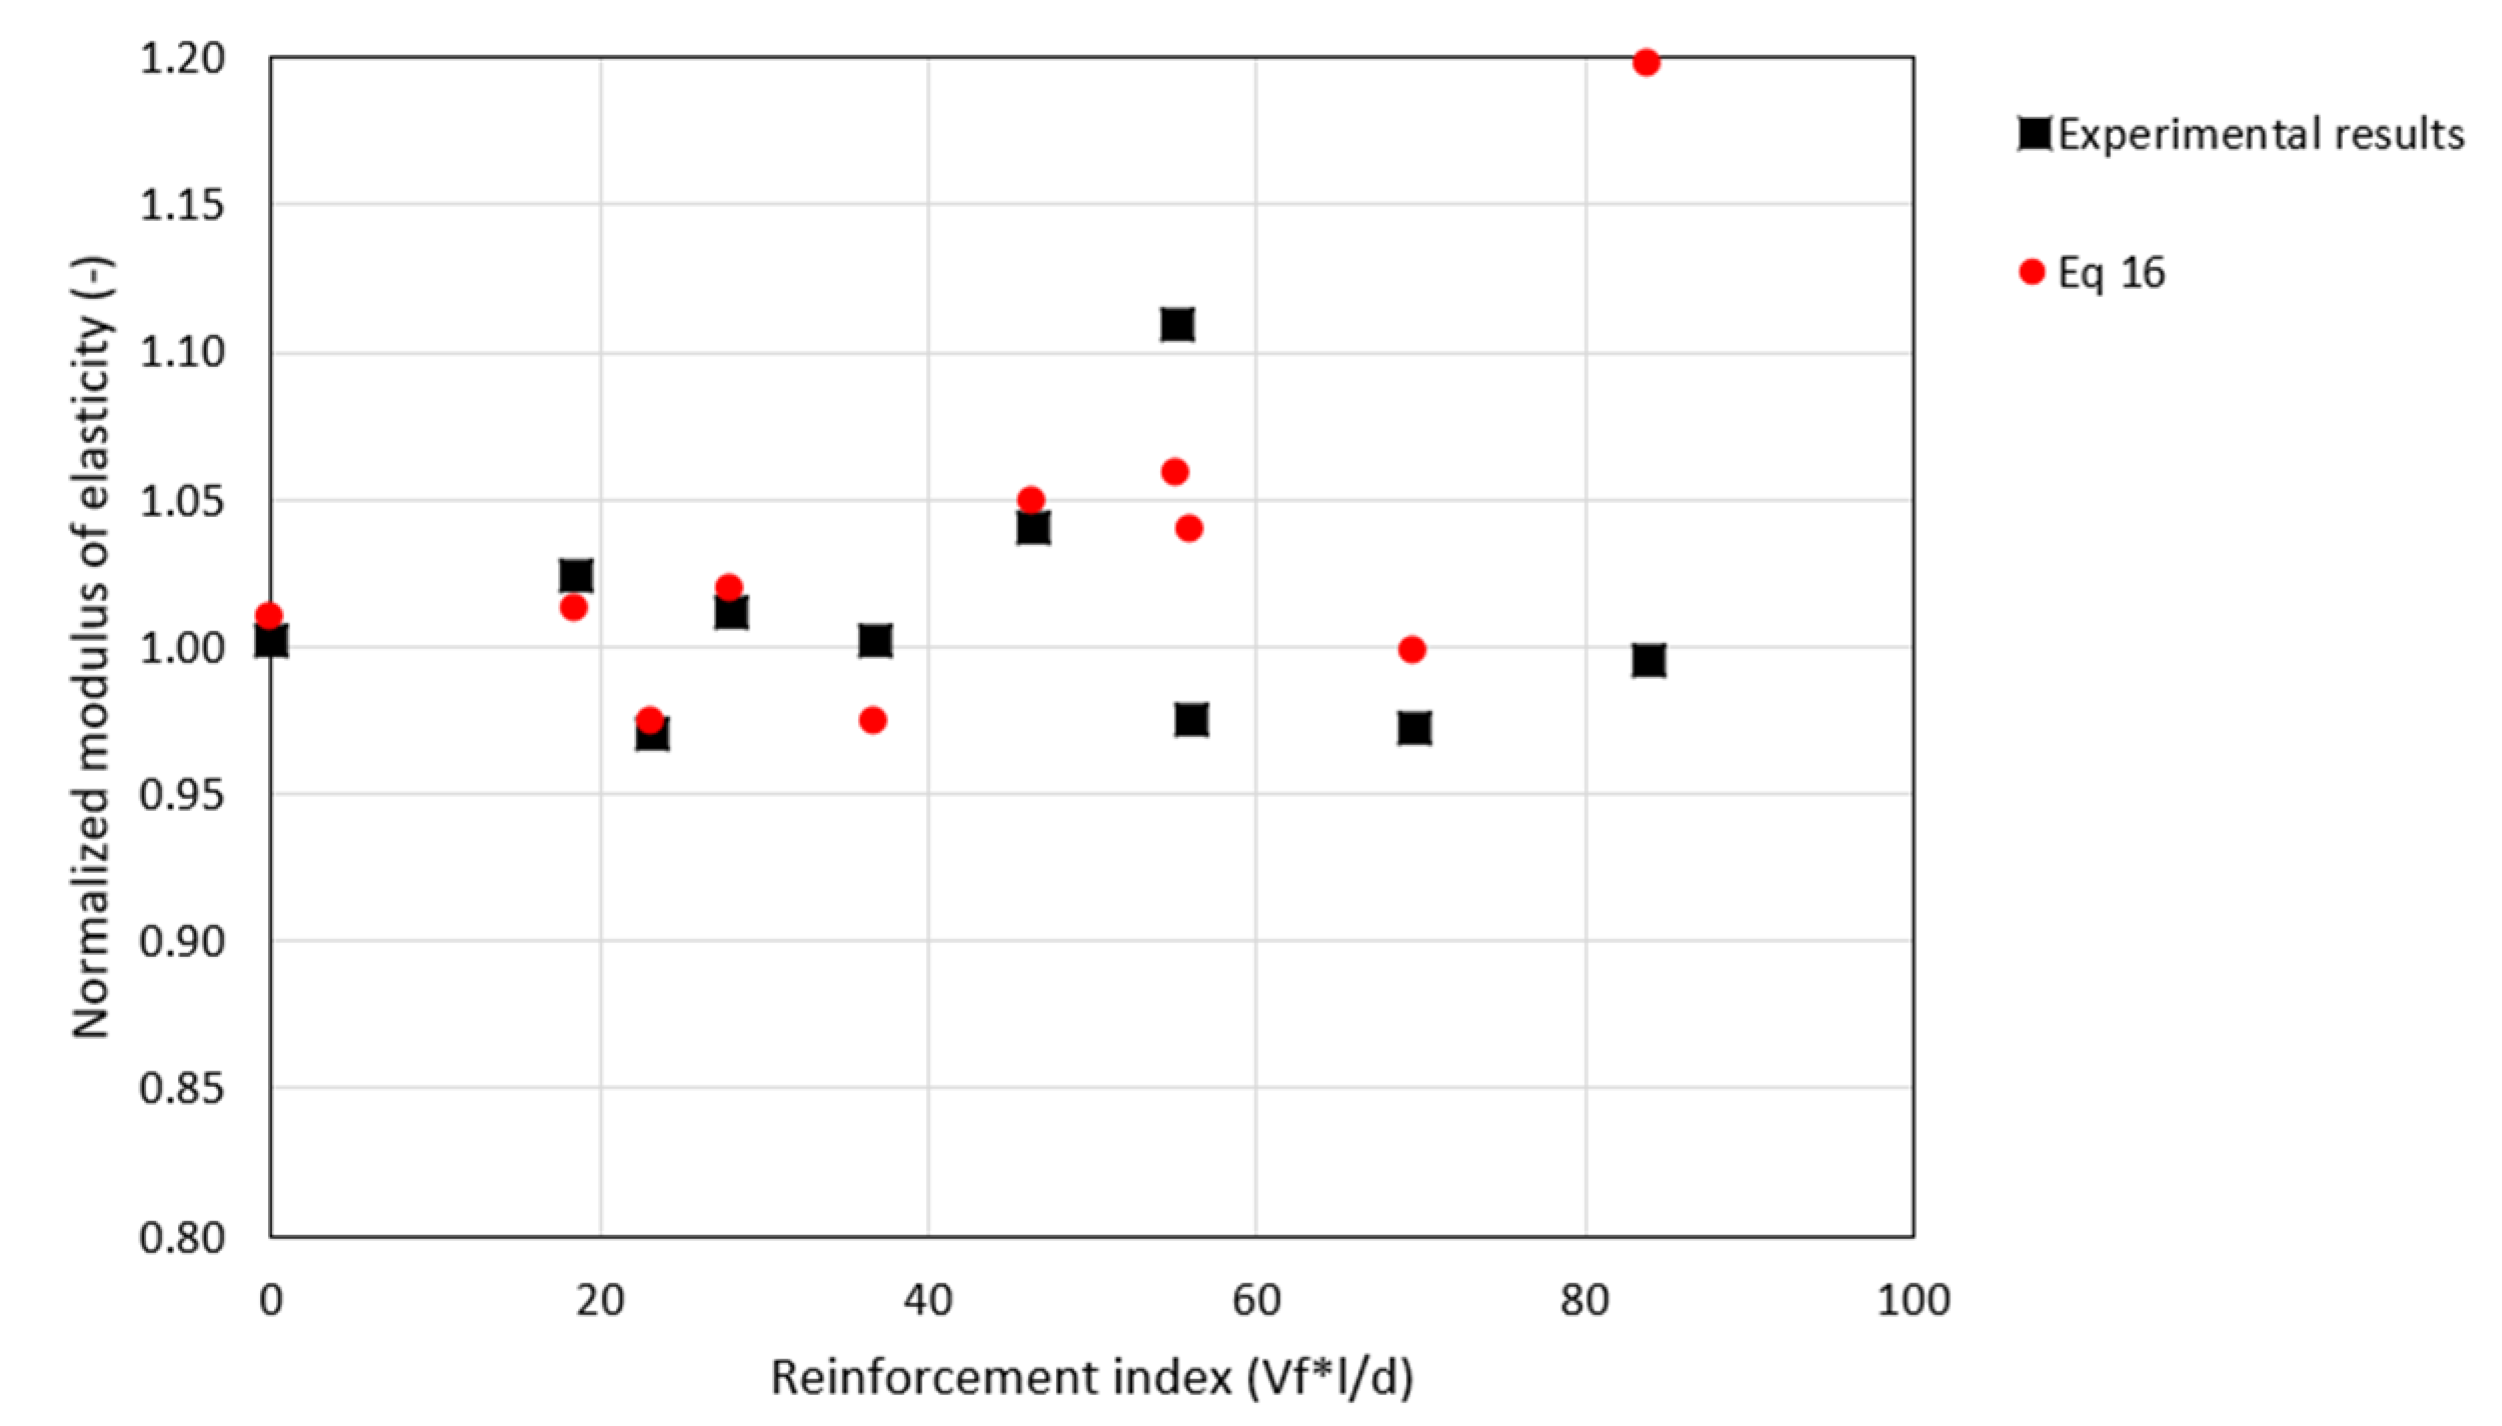
As explained in Section 4.3.2 of the discussion of the results, there is a correlation between UPV and the Static Modulus of Elasticity of concrete using the indirect method. Table 7 denotes the linear Equation (16) proposed by this study for polypropylene fibers. Equation (17), proposed by Benaicha et al. (2015), applies for the same purpose as Equation (16); however, it was proposed by testing concrete with metal fibers. Figure 23 compares the experimental and calculated values with Equation (16).

5.3. Prediction of the Dynamic Modulus of Elasticity as a function of Ultrasonic Pulse Velocity

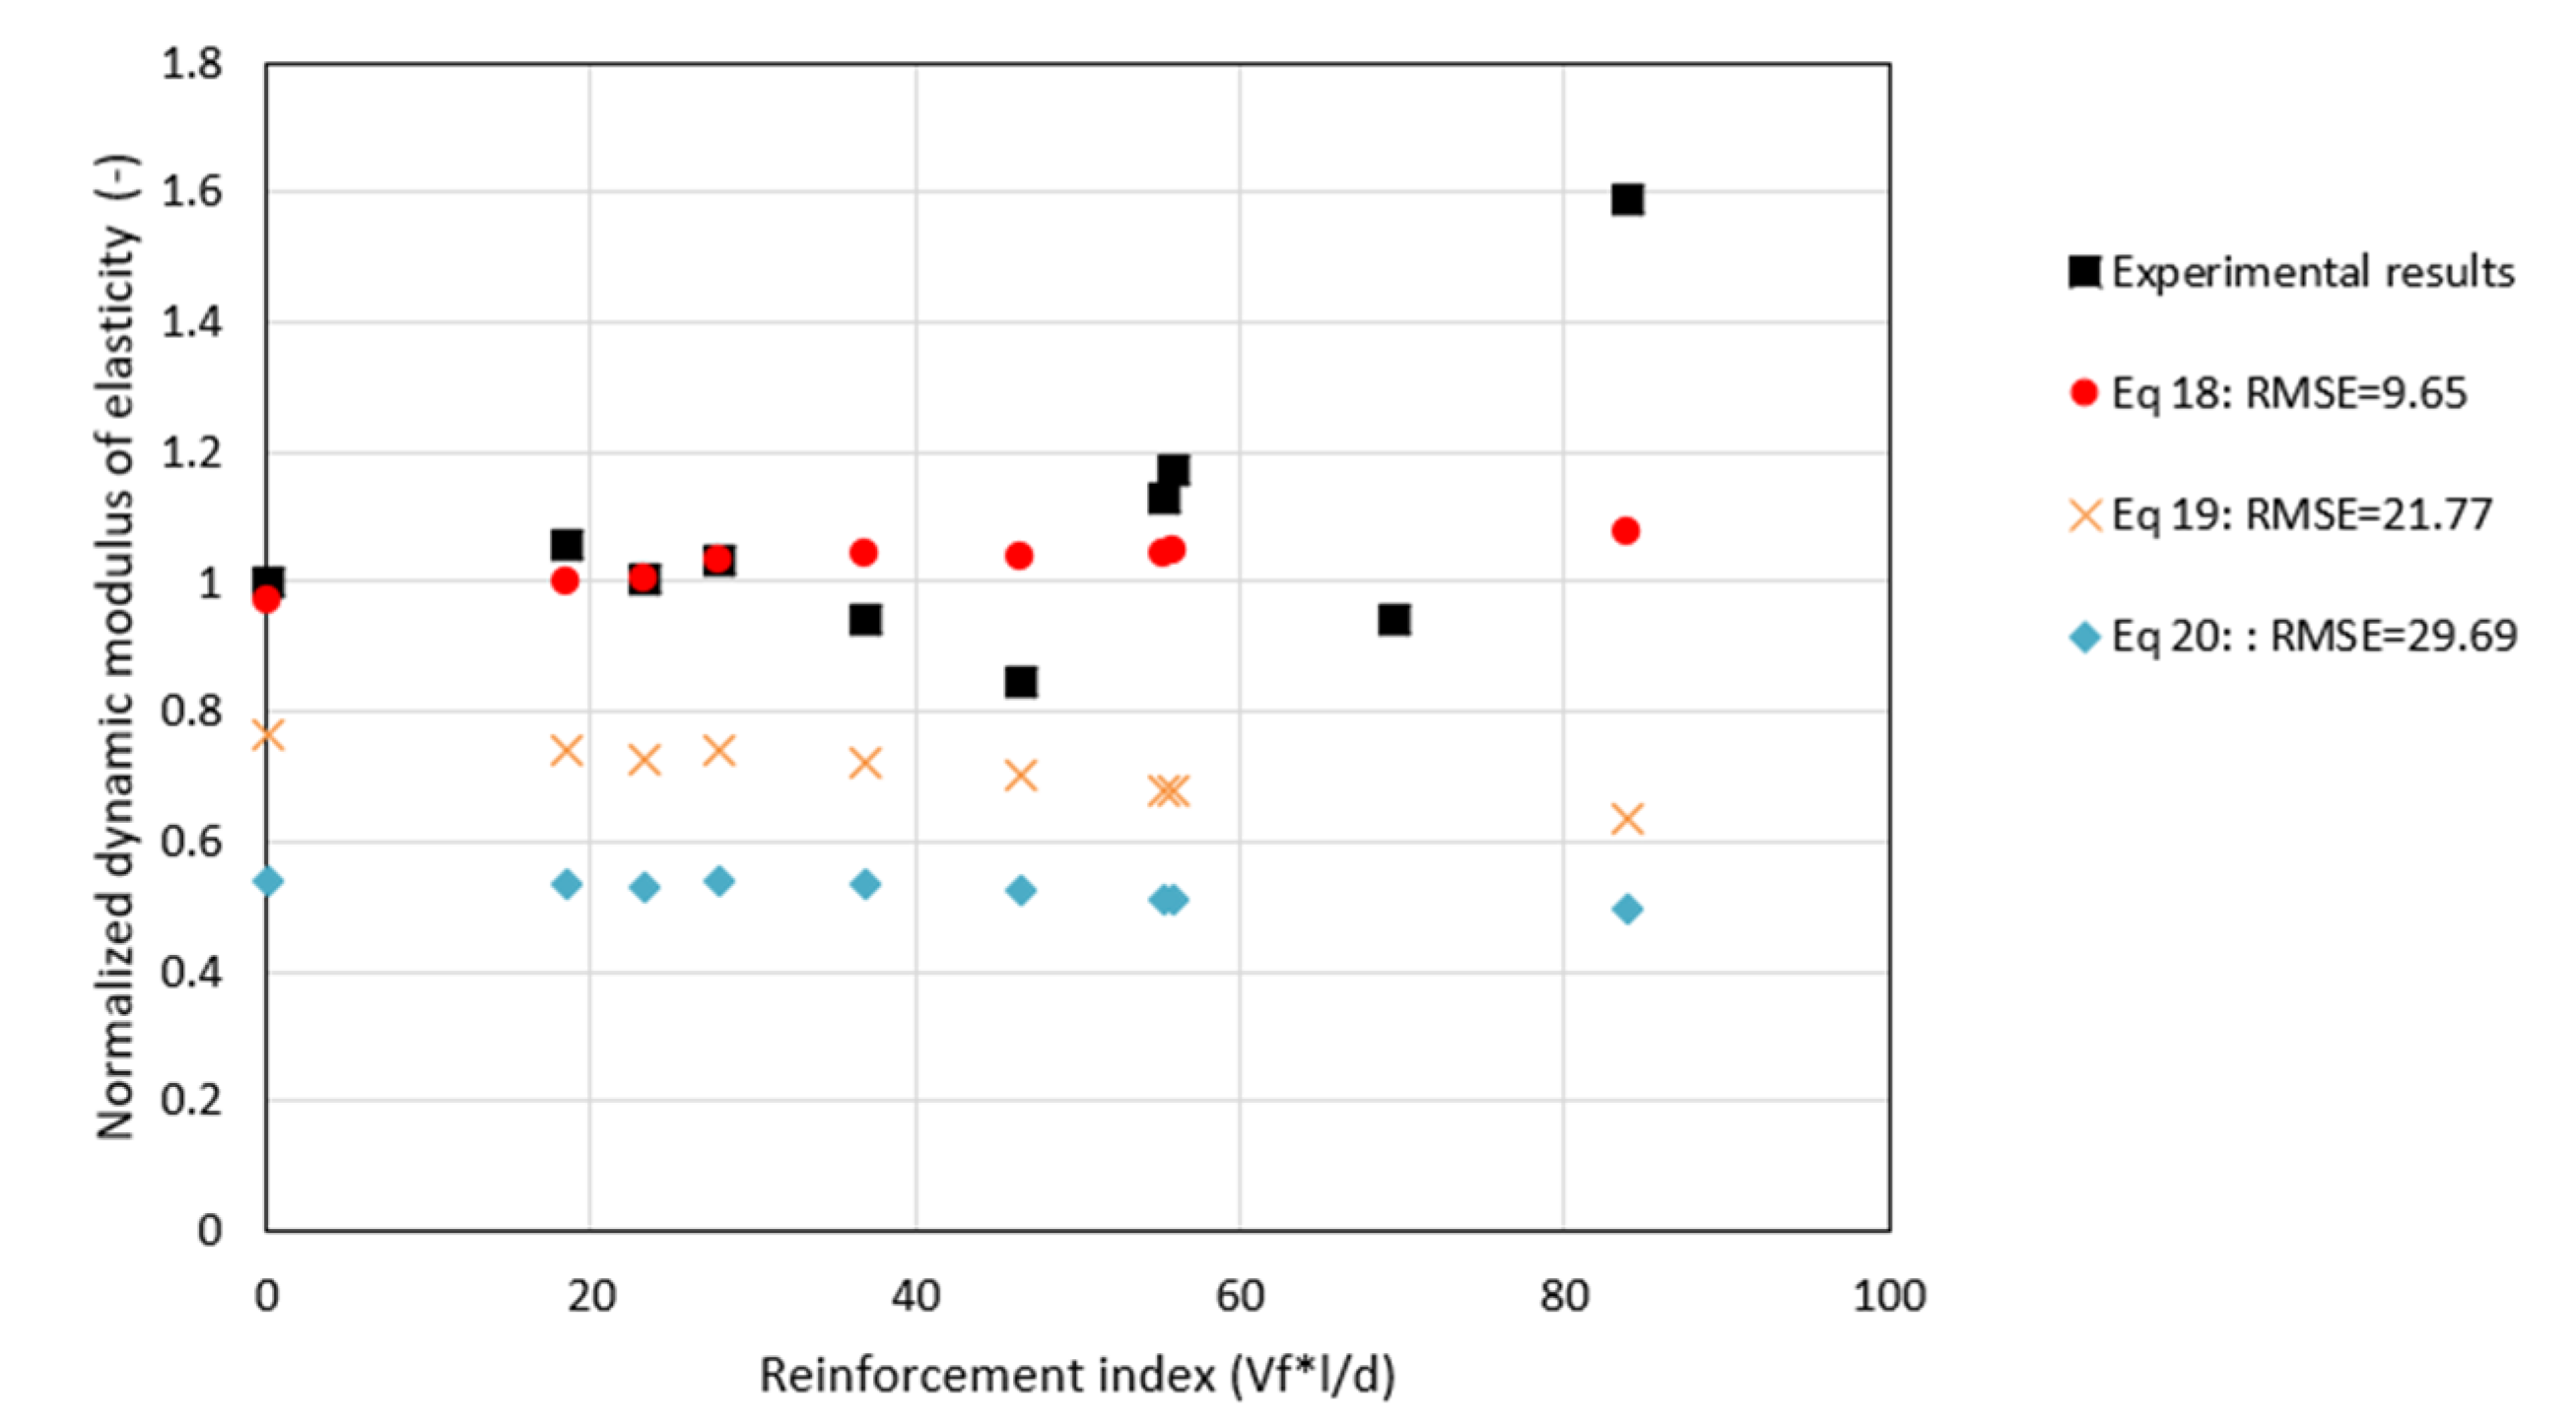
As previously discussed in Section 4.2.2 and Section 4.3.3, there is a correlation between the Reinforcement Index and the Dynamic Modulus of Elasticity and between compressive strength and the Dynamic Modulus of Elasticity. Therefore, an expression can be developed to calculate the Dynamic Modulus of Elasticity calculated by the indirect method as a function of the Reinforcement Index and the compressive strength shown in Equation (18) of Table 8. In addition, Carrillo et al. (2019) developed two expressions (Equations (19) and (20)) for concrete with steel fibers using the direct and the semi-direct methods. Figure 24 compares the calculated values of the Dynamic Modulus of Elasticity and the experimental results.

6. Conclusions

In this work, correlations between variables were statistically analyzed, and empirical equations were developed to calculate (1) compressive strength as a function of UPV and RI; (2) the static modulus of elasticity as a function of UPV; and (3) the dynamic modulus of elasticity as a function of compressive strength and RI. The results are framed for concrete with a nominal compressive strength of 40 MPa and a/c = 0.45, prepared in a 312 L mixer, and then manually molded according to the specimens detailed in Section 2.2. Based on the findings of this research, the following conclusions are drawn.
  • From the relation between the Reinforcement Index and the mechanical properties, it is concluded that there is a linear correlation between RI and compressive strength with a correlation coefficient of 0.79. The higher the RI, the lower the compressive strength. On the other hand, from the results, the non-existent correlation between IR and the Static Modulus of Elasticity cannot be ruled out, even when the correlation coefficient is 0.47. The average ratio for the modulus of elasticity between the root of compressive strength is 4690, a value that is very close to that of 4700 given by the ACI Committee 318; therefore, it can be concluded that the Static Modulus of Elasticity is not significantly affected by PP fibers, and its value can be calculated with the traditional concrete formulas without reinforcing fibers for PP fiber volume fractions of 0, 0.4, 0.8 and 1.2%.
  • From the relation between the Reinforcement Index and Ultrasonic Pulse Velocity, it is concluded that there is a correlation using the three prospecting methods. The higher the RI, the higher the UPV. However, a significant correlation was found only through the indirect method regarding the relationship between the Dynamic Modulus of Elasticity and RI.
  • The relation between dynamic and mechanical properties shows a significant correlation between UPV and compressive strength and between UPV and the Static Modulus of Elasticity. In both cases, the indirect prospecting method was the only method that had significant correlations. Therefore, empirical equations of these relations have been developed. In the first case, the higher the UPV, the lower the compressive strength, with a correlation coefficient of 0.64. In the second case, the higher the UPV, the greater the Static Modulus of Elasticity, with a correlation coefficient of 0.68. On the other hand, it was shown that there is a correlation between the Dynamic Modulus of Elasticity and compressive strength. Still, the relation is not repeated with the Static Modulus of Elasticity. Therefore, a correlation Equation of the Dynamic Modulus of Elasticity with compressive strength and RI has been developed.

Author Contributions

A.A.D.S.: conceptualization, resources, supervision, project administration, funding acquisition, writing—review and editing; D.L.T.E.: conceptualization, methodology, validation, formal analysis, investigation, data curation, writing—original draft, supervision; J.C.: methodology, validation, writing—review and editing; E.C.Y.: writing—original draft, investigation, visualization. All authors have read and agreed to the published version of the manuscript.

Funding

This article was developed as part of the “Influence of the instability of toughness tests on the post-cracking response of high-strength concrete made with micro-silica and fibers” research project, funding number AC.06.018.2022, of the Scientific Research Institute (IDIC) of Universidad de Lima.

Data Availability Statement

The data supporting the findings of this study are available within the article.

Acknowledgments

The authors would like to thank the Universidad de Lima Laboratories for its academic and technical support related to this research.

Conflicts of Interest

The authors declare no conflict of interest.

References

  1. Washer, G.; Fuchs, P.; Rezai, A.; Ghasemi, H. Ultrasonic measurement of the elastic properties of ultra-high performance concrete (UHPC). Proc. SPIE 2005, 5767. [Google Scholar] [CrossRef]
  2. Mehta, P.K.; Monteiro, P.J.M. Concrete: Microstructure, Properties, and Materials, 3rd ed.; McGraw-Hill: New York, NY, USA, 2005. [Google Scholar]
  3. Hussain, I.; Ali, B.; Akhtar, T.; Jameel, M.S.; Raza, S.S. Comparison of mechanical properties of concrete and design thickness of pavement with different types of fiber-reinforcements (steel, glass, and polypropylene). Case Stud. Constr. Mater. 2020, 13, e00429. [Google Scholar] [CrossRef]
  4. Das, C.S.; Dey, T.; Dandapat, R.; Mukharjee, B.B.; Kumar, J. Performance evaluation of polypropylene fibre reinforced recycled aggregate concrete. Constr. Build. Mater. 2018, 189, 649–659. [Google Scholar] [CrossRef]
  5. Afroughsabet, V.; Ozbakkaloglu, T. Mechanical and durability properties of high-strength concrete containing steel and polypropylene fibers. Constr. Build. Mater. 2015, 94, 73–82. [Google Scholar] [CrossRef]
  6. Nehdi, M.; Duquette, J. Fiber Synergy in Fiber-Reinforced Self-Consolidating Concrete. ACI Mater. J. 2004, 101, 508–517. [Google Scholar] [CrossRef]
  7. Corinaldesi, V.; Moriconi, G. Use of synthetic fibers in self-compacting lightweight aggregate concretes. J. Build. Eng. 2015, 4, 247–254. [Google Scholar] [CrossRef]
  8. Del Savio, A.A.; La Torre, D.; Cedrón, J.P. Experimental Volume Incidence Study and the Relationship of 2 Polypropylene Macrofiber Slenderness to the Mechanical 3 Strengths of Fiber-Reinforced Concretes. Appl. Sci. 2022, 12, 9126. [Google Scholar] [CrossRef]
  9. Boulekbache, B.; Hamrat, M.; Chemrouk, M.; Amziane, S. Failure mechanism of fibre reinforced concrete under splitting test using digital image correlation. Mater. Struct. 2015, 48, 2713–2726. [Google Scholar] [CrossRef]
  10. Washer, G.; Fuchs, P.; Rezai, A.; Ghasemi, H. Ultrasonic Testing for Quality Control of Ultra-High Performance Concrete. In Proceedings of the Structures Congress 2006, St. Louis, MO, USA, 18–21 May 2006; pp. 1–8. [Google Scholar] [CrossRef]
  11. Qixian, L.; Bungey, J.H. Using compression wave ultrasonic transducers to measure the velocity of surface waves and hence determine dynamic modulus of elasticity for concrete. Constr. Build. Mater. 1996, 10, 237–242. [Google Scholar] [CrossRef]
  12. Jones, R. The non-destructive testing of concrete. Mag. Concr. Res. 1949, 1, 67–78. [Google Scholar] [CrossRef]
  13. Tsioulou, O.; Lampropoulos, A.; Paschalis, S. Combined Non-Destructive Testing (NDT) method for the evaluation of the mechanical characteristics of Ultra High Performance Fibre Reinforced Concrete (UHPFRC). Constr. Build. Mater. 2017, 131, 66–77. [Google Scholar] [CrossRef] [Green Version]
  14. Lim, Y.Y.; Kwong, K.Z.; Liew, W.Y.H.; Soh, C.K. Non-destructive concrete strength evaluation using smart piezoelectric transducer—a comparative study. Smart Mater. Struct. 2016, 25, 085021. [Google Scholar] [CrossRef] [Green Version]
  15. Bungey, J.H.; Millard, S.G.; Grantham, M.G. Testing of Concrete in Structures, 4th ed.; Taylor & Francis: Abingdon, UK, 2006. [Google Scholar]
  16. Malhotra, V.M.; Carino, N.J. Nondestructive Testing of Concrete, 2nd ed.; ASTM Interntional: West Conshohocken, PA, USA, 2004. [Google Scholar]
  17. Hassan, M.T.; Jones, S.W. Non-destructive testing of ultra high performance fibre reinforced concrete (UHPFRC): A feasibility study for using ultrasonic and resonant frequency testing techniques. Constr. Build. Mater. 2012, 35, 361–367. [Google Scholar] [CrossRef]
  18. Petro, J.T.; Kim, J. Detection of delamination in concrete using ultrasonic pulse velocity test. Constr. Build. Mater. 2011, 26, 574–582. [Google Scholar] [CrossRef]
  19. Benaicha, M.; Jalbaud, O.; Alaoui, A.H.; Burtschell, Y. Correlation between the mechanical behavior and the ultrasonic velocity of fiber-reinforced concrete. Constr. Build. Mater. 2015, 101, 702–709. [Google Scholar] [CrossRef]
  20. Mahapatra, C.K.; Barai, S.V. Sustainable self compacting hybrid fiber reinforced concrete using waste materials. Struct. Concr. 2019, 20, 756–765. [Google Scholar] [CrossRef]
  21. Reufi, E.; Marku, J.; Bier, T. Ultrasonic Pulse Velocity Investigation of Polypropylene and Steel Fiber Reinforced Concrete. Int. J. Civ. Environ. Eng. 2016. [Google Scholar] [CrossRef]
  22. Rucka, M.; Wojtczak, E.; Knak, M.; Kurpińska, M. Characterization of fracture process in polyolefin fibre-reinforced concrete using ultrasonic waves and digital image correlation. Constr. Build. Mater. 2021, 280, 122522. [Google Scholar] [CrossRef]
  23. Noushini, A.; Samali, B.; Vessalas, K. Effect of polyvinyl alcohol (PVA) fibre on dynamic and material properties of fibre reinforced concrete. Constr. Build. Mater. 2013, 49, 374–383. [Google Scholar] [CrossRef]
  24. Carrillo, J.; Ramirez, J.; Lizarazo-Marriaga, J. Modulus of elasticity and Poisson’s ratio of fiber-reinforced concrete in Colombia from ultrasonic pulse velocities. J. Build. Eng. 2019, 23, 18–26. [Google Scholar] [CrossRef]
  25. Chakrawarthi, V.; Dharmar, B.; Avudaiappan, S.; Amran, M.; Flores, E.S.; Alam, M.A.; Fediuk, R.; Vatin, N.I.; Rashid, R.S.M. Destructive and Non-Destructive Testing of the Performance of Copper Slag Fiber-Reinforced Concrete. Materials 2022, 15, 4536. [Google Scholar] [CrossRef] [PubMed]
  26. ACI Committee 211; Standard Practice for Selecting Proportions for Normal, Heavyweight, and Mass Concrete. American Concrete Institute: Detroit, MI, USA, 1991.
  27. ASTM Standard C192/C192M-19; Standard Practice for Making and Curing Concrete Test Specimens in the Laboratory. ASTM Special Technical Publication; ASTM International: West Conshohocken, PA, USA, 2019.
  28. ASTM International. Standard Test Method for Pulse Velocity through Concrete. 2016. Available online: https://www.astm.org/c0597-16.html (accessed on 21 March 2022).
  29. British Standards Institution. Specification for Testing Concrete. Part 203. Recommendations for Measurement of Velocity of Ultrasonic Pulses in Concrete; BSI: London, UK, 1986; p. 16. [Google Scholar]
  30. ASTM Standard C469/C469M−14; Standard Test Method for Static Modulus of Elasticity and Poisson’s Ratio of Concrete in Compression. ASTM International: West Conshohocken, PA, USA, 2014; pp. 1–5. Available online: www.astm.org (accessed on 21 March 2022).
  31. Altoubat, S.; Yazdanbakhsh, A.; Rieder, K.A. Shear behavior of macro-synthetic fiber-reinforced concrete beams without stirrups. ACI Mater. J. 2009, 106, 381–389. [Google Scholar] [CrossRef]
  32. Ibrahim, M.H.W.; Mangi, S.A.; Burhanudin, M.K.; Ridzuan, M.B.; Jamaluddin, N.; Shahidan, S.; Wong, Y.; Faisal, S.; Fadzil, M.A.; Ramadhansyah, P.J.; et al. Compressive and flexural strength of concrete containing palm oil biomass clinker and polypropylene fibres. IOP Conf. Ser. Mater. Sci. Eng. 2017, 271, 012011. [Google Scholar] [CrossRef] [Green Version]
  33. Kazmi, S.M.S.; Munir, M.J.; Wu, Y.F.; Patnaikuni, I. Effect of macro-synthetic fibers on the fracture energy and mechanical behavior of recycled aggregate concrete. Constr. Build. Mater. 2018, 189, 857–868. [Google Scholar] [CrossRef]
  34. Song, H.; Ding, Y. Investigation on the spatial distribution of steel fiber in concrete matrix using barcelona test. Jianzhu Cailiao Xuebao/J. Build. Mater. 2016, 19, 381–389. [Google Scholar] [CrossRef]
  35. Ding, Y.; Li, D.; Zhang, Y.; Azevedo, C. Experimental investigation on the composite effect of steel rebars and macro fibers on the impact behavior of high performance self-compacting concrete. Constr. Build. Mater. 2017, 136, 495–505. [Google Scholar] [CrossRef] [Green Version]
  36. Li, J.; Niu, J.; Wan, C.; Liu, X.; Jin, Z. Comparison of flexural property between high performance polypropylene fiber reinforced lightweight aggregate concrete and steel fiber reinforced lightweight aggregate concrete. Constr. Build. Mater. 2017, 157, 729–736. [Google Scholar] [CrossRef]
  37. Akça, K.I.R.; Çakir, Ö.; Ipek, M. Properties of polypropylene fiber reinforced concrete using recycled aggregates. Constr. Build. Mater. 2015, 98, 620–630. [Google Scholar] [CrossRef]
  38. Mazzoli, A.; Monosi, S.; Plescia, E.S. Evaluation of the early-age-shrinkage of Fiber Reinforced Concrete (FRC) using image analysis methods. Constr. Build. Mater. 2015, 101, 596–601. [Google Scholar] [CrossRef]
  39. Wang, W.; Shen, A.; Lyu, Z.; He, Z.; Nguyen, K.T.Q. Fresh and rheological characteristics of fiber reinforced concrete—A review. Constr. Build. Mater. 2021, 296, 123734. [Google Scholar] [CrossRef]
  40. Ding, Y.; Zeng, W.; Wang, Q.; Zhang, Y. Topographical analysis of fractured surface roughness of macro fiber reinforced concrete and its correlation with flexural toughness. Constr. Build. Mater. 2020, 235, 117466. [Google Scholar] [CrossRef]
  41. Zhu, J.; Kee, S.-H.; Han, D.; Tsai, Y.-T. Effects of air voids on ultrasonic wave propagation in early age cement pastes. Cem. Concr. Res. 2011, 41, 872–881. [Google Scholar] [CrossRef]
  42. Noushini, A.; Hastings, M.; Castel, A.; Aslani, F. Mechanical and flexural performance of synthetic fibre reinforced geopolymer concrete. Constr. Build. Mater. 2018, 186, 454–475. [Google Scholar] [CrossRef]
  43. Nik, A.S.; Omran, O.L. Estimation of compressive strength of self-compacted concrete with fibers consisting nano-SiO2 using ultrasonic pulse velocity. Constr. Build. Mater. 2013, 44, 654–662. [Google Scholar] [CrossRef]
  44. Meddah, M.S.; Bencheikh, M. Properties of concrete reinforced with different kinds of industrial waste fibre materials. Constr. Build. Mater. 2009, 23, 3196–3205. [Google Scholar] [CrossRef]
  45. Nematzadeh, M.; Poorhosein, R. Estimating properties of reactive powder concrete containing hybrid fibers using UPV. Comput. Concr. 2017, 20, 491–502. [Google Scholar] [CrossRef]
  46. Nematzadeh, M.; Dashti, J.; Ganjavi, B. Optimizing compressive behavior of concrete containing fine recycled refractory brick aggregate together with calcium aluminate cement and polyvinyl alcohol fibers exposed to acidic environment. Constr. Build. Mater. 2018, 164, 837–849. [Google Scholar] [CrossRef]
  47. Belaribi, H.; Mellas, M.; Rahmani, F. The relationship between the compressive strength and ultrasonic pulse velocity concrete with fibers exposed to high temperatures. Appl. Energet. Pollut. 2016, 3, 31–36. [Google Scholar]
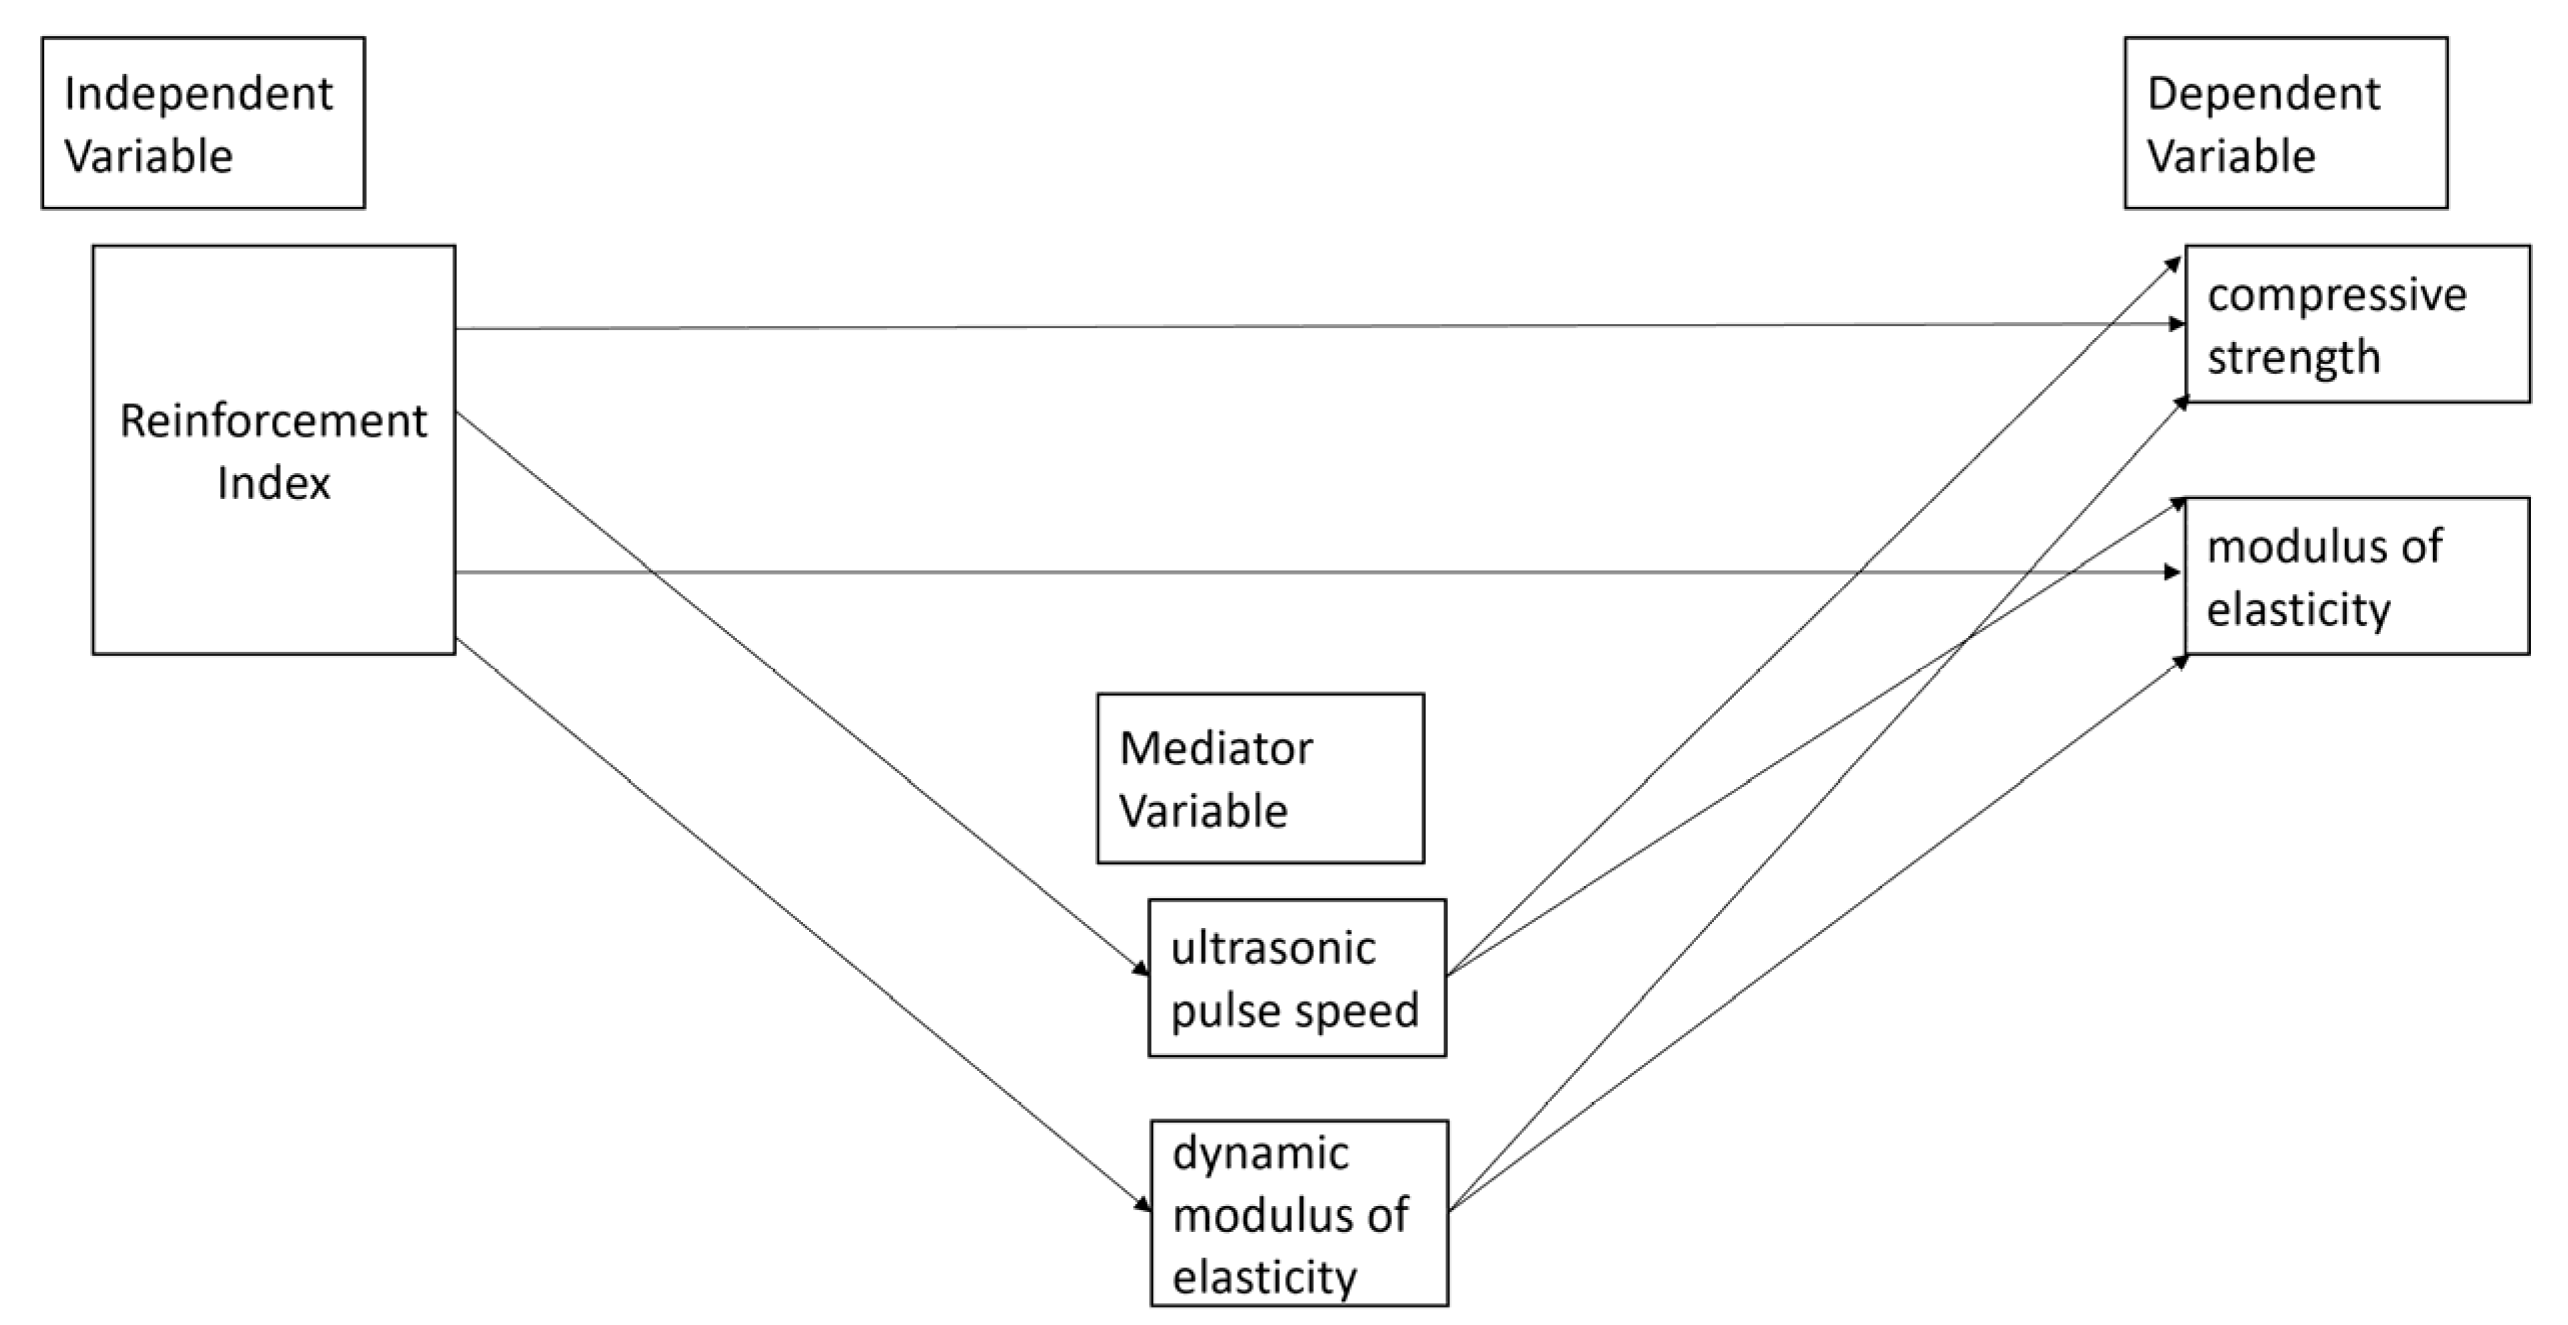
Figure 1. Experimental research design.
Applsci 12 10375 g001
Figure 2. Polypropylene fibers used in the mixture (in centimeters).
Applsci 12 10375 g002
Figure 3. Ultrasound configurations: (a) direct method, (b) semi-direct method, (c) indirect method.
Applsci 12 10375 g003
Figure 4. Equipment used for the static elasticity modulus and the static Poisson ratio testing.
Applsci 12 10375 g004
Figure 5. The slump as a function of the RI.
Applsci 12 10375 g005
Figure 6. UPV results for concrete mixtures.
Applsci 12 10375 g006
Figure 7. Correlation between the reinforcement index and compressive strength.
Applsci 12 10375 g007
Figure 8. Correlation between the Reinforcement Index and the Static Elasticity Modulus.
Applsci 12 10375 g008
Figure 9. Ratio E c / f c for concrete mixtures.
Applsci 12 10375 g009
Figure 10. Correlation between the reinforcement index and ultrasonic pulse velocity.
Applsci 12 10375 g010
Figure 11. The ratio between fiber length and the normalized ultrasonic pulse velocity.
Applsci 12 10375 g011
Figure 12. The ratio between the fiber volume fraction and the normalized ultrasonic pulse velocity.
Applsci 12 10375 g012
Figure 13. Correlation between the reinforcement index and the dynamic elasticity modulus.
Applsci 12 10375 g013
Figure 14. Correlation between ultrasonic pulse velocity and compressive strength.
Applsci 12 10375 g014
Figure 15. Correlation between ultrasonic pulse velocity and the static modulus of elasticity.
Applsci 12 10375 g015
Figure 16. Correlation between the dynamic modulus of elasticity and compressive strength.
Applsci 12 10375 g016
Figure 17. Correlation between the dynamic and the static modulus of elasticity.
Applsci 12 10375 g017
Figure 18. Correlations between experimental design variables.
Applsci 12 10375 g018
Figure 19. Relation between calculated and experimental compressive strength.
Applsci 12 10375 g019
Figure 20. Normalized comparison between compressive strength prediction equations based on UPV.
Applsci 12 10375 g020
Figure 21. Histogram of the RMSE value with Pareto diagram for each equation.
Applsci 12 10375 g021
Figure 22. Three-dimensional surface of compressive strength as a function of the reinforcement index and UPV. (a) experimental results, and (b) values calculated with Equation (4).
Applsci 12 10375 g022
Figure 23. Normalized comparison between modulus of elasticity prediction equations based on UPV.
Applsci 12 10375 g023
Figure 24. Normalized comparison between dynamic modulus of elasticity prediction equations based on the reinforcement index and compressive strength.
Applsci 12 10375 g024
Table 1. Mixture design for a cubic meter of concrete fc = 40 MPa.
BatchCement
(kg)
Water
(kg)
Sand
(kg)
Gravel
(kg)
SP
(kg)
Fibers
Vf
(%)
Diameter
(mm)
Length, l
(mm)
RI *
(Vf ∗ l/d)
B-Pattern502.8226.6721.1891.27.10.0--0.0
B-0.4%-40502.8226.6721.1891.27.10.40.864018.4
B-0.4%-50502.8226.6721.1891.27.10.40.865023.2
B-0.4%-60502.8226.6721.1891.27.10.40.866028.0
B-0.8%-40502.8226.6721.1891.27.10.80.864036.8
B-0.8%-50502.8226.6721.1891.27.10.80.865046.4
B-0.8%-60502.8226.6721.1891.27.10.80.866056.0
B-1.2%-40502.8226.6721.1891.27.11.20.864055.2
B-1.2%-50502.8226.6721.1891.27.11.20.865069.6
B-1.2%-60502.8226.6721.1891.27.11.20.866084.0
* Values rounded to the first even decimal digit for the research.
Table 2. Description of fibers and properties of fresh-state concrete.
BatchRI
(Vf ∗ l/d)
Density
(kg/m3)
Slump
(mm)
Air Content
(%)
B-Pattern0.02254.72406.2 *
B-0.4%-4018.42229.22106.0 *
B-0.4%-5023.22322.82104.0
B-0.4%-6028.02283.11403.9
B-0.8%-4036.82268.91754.0
B-0.8%-5046.42331.3702.8
B-0.8%-6056.02296.31253.5
B-1.2%-4055.22268.9952.8
B-1.2%-5069.62243.4463.0
B-1.2%-6084.02263.21113.0
* outlier.
Table 3. Mechanical properties of fiber-reinforced concrete.
BatchRI
(Vf ∗ l/d)
µfcEc
X ¯ (-)CV X ¯ (MPa)CV X ¯ (GPa)CV
B-Pattern0.00.1815.6%41.183.6%29.954.8%
B-0.4%-4018.40.110.4%40.924.0%30.670.3%
B-0.4%-5023.20.0915.9%40.423.1%29.037.7%
B-0.4%-6028.00.1916.4%42.270.3%30.290.1%
B-0.8%-4036.80.163.4%41.820.2%29.953.1%
B-0.8%-5046.40.330.3%40.088.6%31.145.4%
B-0.8%-6056.00.084.8%39.376.1%29.170.5%
B-1.2%-4055.20.194.9%39.031.5%33.201.1%
B-1.2%-5069.60.2017.1%42.161.7%29.090.7%
B-1.2%-6084.00.146.8%37.82*29.758.7%
* CV is not computed because only one specimen was tested.
Table 4. Ultrasonic pulse velocity and the dynamic modulus of elasticity of concrete.
BatchUPV (m/s)Ed (GPa)
DirectSemidirectIndirectDirectSemidirectIndirect
X ¯ CV X ¯ CV X ¯ CV X ¯ X ¯ X ¯
B-Pattern38975.0%32755.0%48935.8%31.4122.1749.50
B-0.4%-4041200.2%39940.7%49180.9%36.9134.6752.57
B-0.4%-5041460.1%41362.8%46811.1%39.2039.0049.97
B-0.4%-6041390.1%39420.7%49520.6%35.8132.4851.27
B-0.8%-4041460.1%41362.8%46811.1%36.5936.4146.64
B-0.8%-5041950.1%41210.8%51370.8%27.9827.0041.95
B-0.8%-6040400.2%38591.3%50733.0%36.9333.7058.22
B-1.2%-4041211.4%40001.3%51920.3%35.2833.2356.00
B-1.2%-5041450.2%42223.7%48220.9%34.5435.8346.72
B-1.2%-6042810.4%42991.3%60493.9%39.4639.8078.78
Table 5. Compressive strength prediction equations based on UPV.
AuthorEquationType of ConcreteID
Current Research Study E c = 4689   f c PPFRCEquation (2)
ACI Committee 318 E c = 4700   f c Normal ConcreteEquation (3)
Table 6. Compressive strength prediction equations based on UPV.
AuthorEquationMethodType of FibersVf (%)Id
**fc = 57.5079 × Exp(−0.00007 × UPV)IndirectPolypropylene0, 0.4, 0.8, 1.2%Equation (4)
**fc = 61.045 − 0.0041 × UPVIndirectPolypropylene0, 0.4, 0.8, 1.2%Equation (5)
**fc = 0.0091 × UPV − 0.155 × RIIndirectPolypropylene0, 0.4, 0.8, 1.2%Equation (6)
[19]fc = 2.080 × Exp(0.0007 × UPV)DirectSteel0, 0.5, 1.3, 1.5, 2, 2.5%Equation (7)
[45]
[45]
fc = 0.013 × Exp(1.959/1000 × UPV)
fc = 0.0016 × Exp(2.411/1000 × UPV)
Direct
Direct
Steel
PVA
1, 2, 3%
0.25, 0.50, 0.75%
Equation (8)
Equation (9)
[46]fc = 0.15 ∗ Exp(1.40/1000 × UPV)DirectPolyvinyl0.5%Equation (10)
[47]
[47]
fc = 17.476 × Exp(0.0003 × UPV)
fc = 16.312 × Exp(0.0003 × UPV)
*
*
Steel
Polypropylene
0.19, 0.25, 0.50%
0.055, 0.11, 0.16%
Equation (11)
Equation (12)
[43]
[43]
[43]
fc = 4.9428 × Exp(0.5096/1000 × UPV)
fc = 12.916 × Exp(0.3408/1000 × UPV)
fc = 10.265 × Exp(0.3822/1000 × UPV)
Direct
Direct
Direct
Polypropylene
Polypropylene
Polypropylene
2%
4%
6%
Equation (13)
Equation (14)
Equation (15)
* Not mentioned; ** Current Research Study.
Table 7. Static modulus of elasticity prediction equations based on UPV.
AuthorEquationMethodFibersVf (%)Id
*Ec = 0.0049 × UPV + 6.2271IndirectPolypropylene0, 0.4, 0.8, 1.2%Equation (16)
[19] **Ec = (1.06 × 10^(−4) × UPV^2) − 1.156 × UPV + 3210DirectSteel0, 0.5, 1.3, 1.5, 2, 2.5%Equation (17)
* Current research study; ** The equation gives values well above the typical values.
Table 8. Dynamic modulus of elasticity prediction equations based on reinforcement index and compressive strength.
AuthorEquationMethodFibersVf (%)Id
*Ed_ind = (7.5084 + 0.0137 × RI) × (fc)^0.5IndirectPolypropylene0, 0.4, 0.8, 1.2%Equation (18)
[24]
[24]
Ed_dir = (5920 − 9.4 × RI) × (fc)^0.5
Ed_sem = (4170 − 1.7 × RI) × (fc)^0.5
Direct
Semi-direct
Steel/PP
Steel/PP
Various
Various
Equation (19)
Equation (20)
* Current research study.
Publisher’s Note: MDPI stays neutral with regard to jurisdictional claims in published maps and institutional affiliations.