1. Introduction
The 2011 Tohoku-oki earthquake tsunami caused not only structural and inundation damage but also fire damage [
1]. Tsunami-related fires were also observed in Kamaishi City during the 1933 Showa Sanriku earthquake tsunami [
2] and on Okushiri Island during the 1993 Hokkaido Nansei-Oki earthquake tsunami [
3].
Because saltwater conducts electricity better than freshwater, electrical wires short-circuit when they come into contact with seawater, and the resulting sparks can ignite flammable materials, alternatively, a fire may be started when vehicle and boat fuel tanks become fractured during collisions. Subsequently, combustion is sustained and spread by flammable gases, debris, and fuel oil. Although the fire damage caused by the 2011 Tohoku-oki earthquake tsunami has been obscured by the devastation caused by the massive force of the tsunami waves, it was larger than that which occurred during the 1995 Great Hanshin-Awaji Earthquake [
4], when 330 fires occurred in 14 prefectures in Japan. Tsunami-related fires differ from fires triggered by strong ground motions. Fires triggered by strong ground motions generally start in individual buildings and their spread depends on weather conditions and land use. In contrast, tsunami-related fires, caused, for example, by drifting objects, such as cars and boats in inundated areas, may spread widely by igniting flammable oil spilled by the tsunami as well as accumulated combustible woody debris derived from destroyed buildings.
Hiroi et al. [
5] defined a tsunami-related fire as “a fire that breaks out or is spread in a tsunami inundation area, including the sea area”. Although the processes by which a tsunami fire is ignited and spread are extremely complicated and have been difficult to quantify for the hazard assessment, available records of the huge number of tsunami-related fires from the 2011 Tohoku-oki earthquake can shed light on some of these processes.
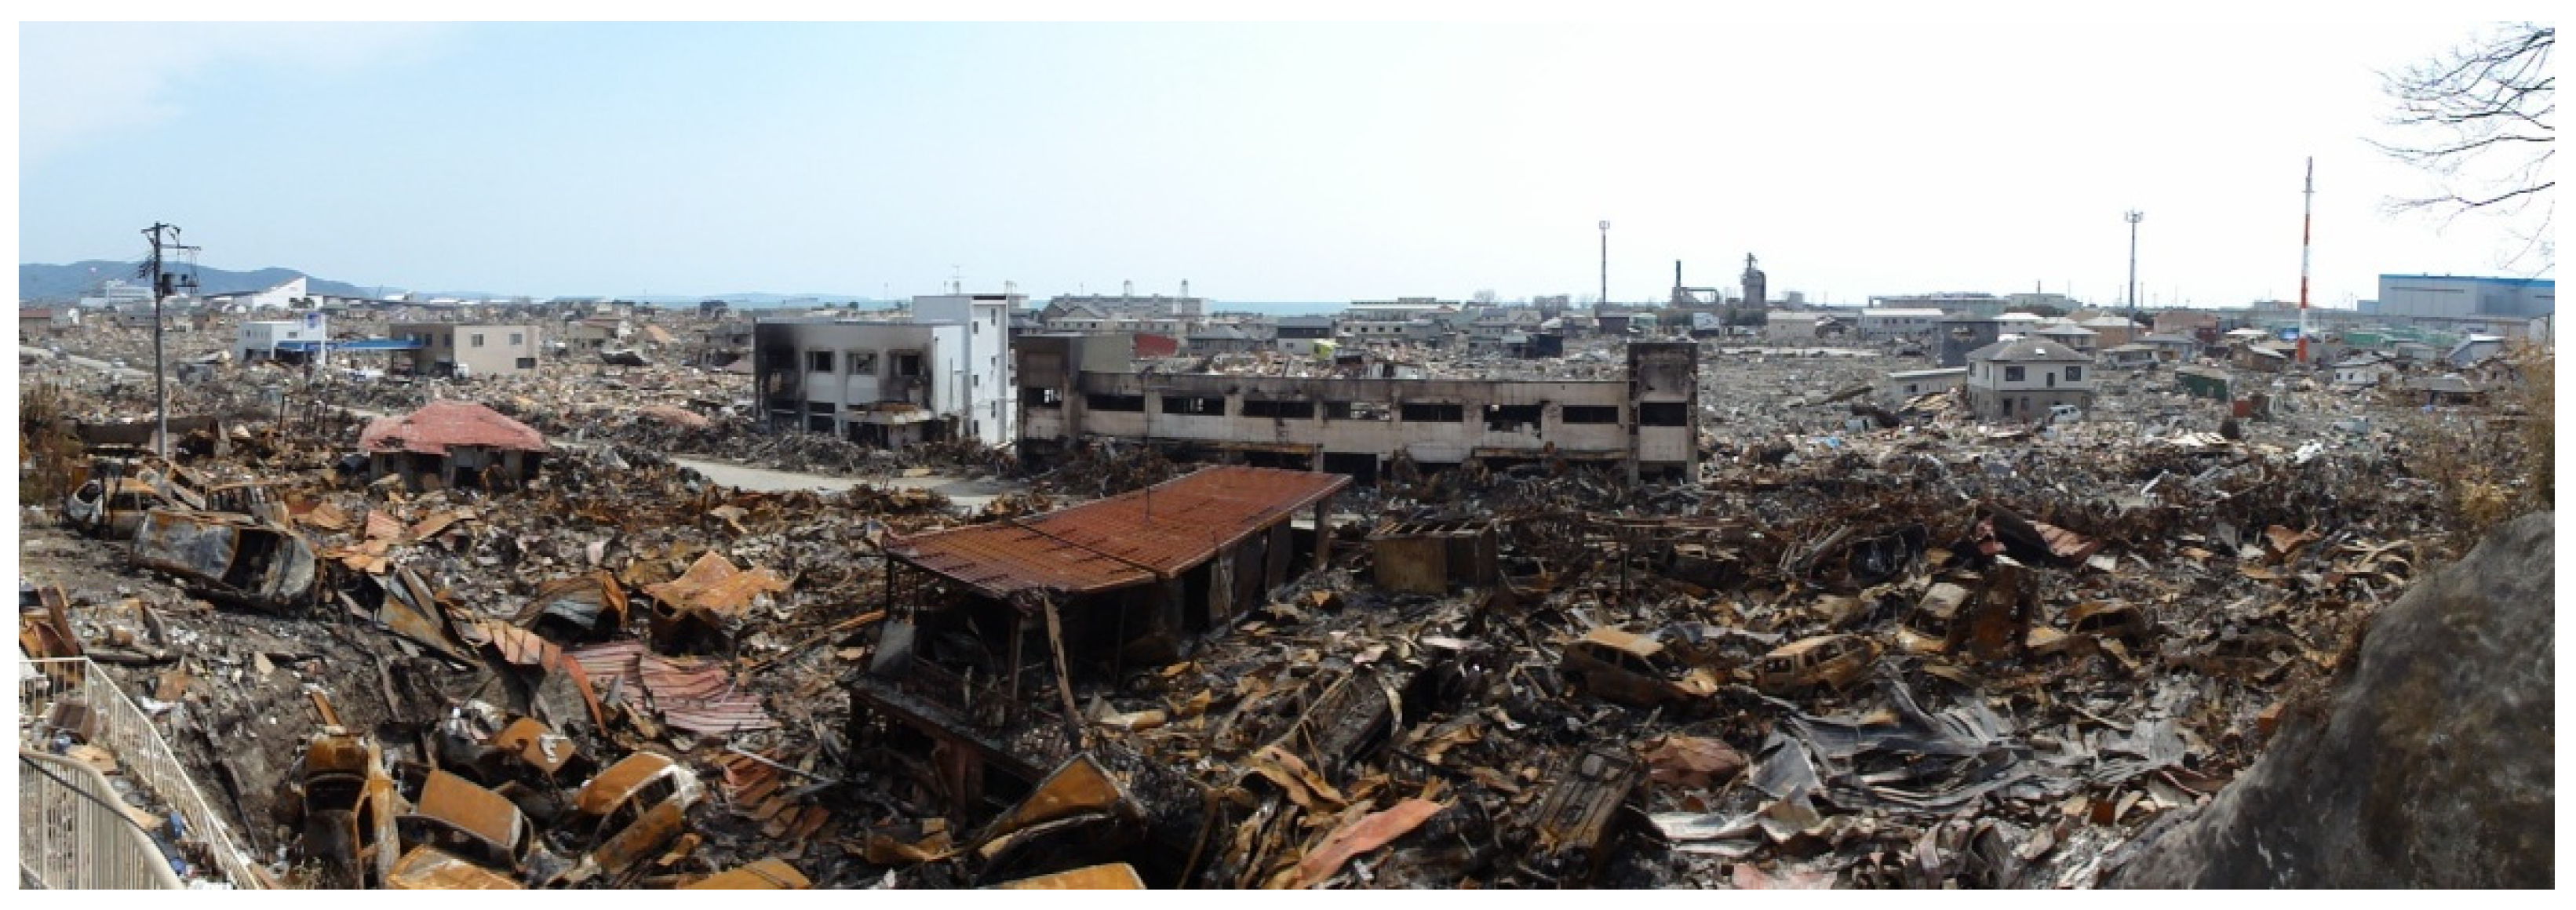
As one example of a fire’s outbreak and spread, we present the case of the area around Kadonowaki Elementary School in Ishinomaki City. Almost all of the wooden houses in the residential area between the elementary school and the coast were destroyed by the tsunami and reduced to flammable woody debris. This woody debris was trapped against the hill behind the elementary school and accumulated there. Vehicles swept away during the tsunami inundation also accumulated around the elementary school building. Repeated impacts as they accumulated caused their fuel tanks to fracture, and the salt in the seawater caused short circuits in electrical systems, which in turn ignited the spilled gasoline. The burning gasoline is thought to have ignited the woody debris that had accumulated around the school building, thus causing the fire to spread (
Figure 1). Once started, fires may also have been spread by liquid propane gas leaked from household cylinders and oil leaked from storage tanks. Thus, the presence of woody debris derived from destroyed wooden buildings and transported and accumulated by the tsunami, which allows tsunami fires to spread, is one indicator that can be used for tsunami fire risk assessment.
There have been many studies on the dynamics of tsunami debris and drifted objects since the 1980s [
7,
8]. In addition, there are some studies on the observation [
9] and numerical analysis [
10] of the behavior of tsunami debris in the sea after the 2011, off the coast of Tohoku earthquake; however, there are not so many studies on the prediction of the amount of tsunami debris launched on land. Nishino and Imazu [
11] and Kozono et al. [
12] have proposed models for predicting the generation and accumulation of tsunami debris. In these models, tsunami-related building destruction and the associated generation of debris are analyzed in relation to tsunami fluid force data obtained by numerical analysis. Empirical data have also been used to develop fragility functions for building damage (e.g., [
13]), and debris drift processes have been analyzed by using numerical models of debris diffusion (e.g., [
7]). All of these models require various parameters related to debris formation and debris drift, and they generally need to be tuned to target terrain conditions and debris characteristics. Therefore, at present, they are not general-purpose models suitable for practical use.
Real-time tsunami inundation predictions based on DONET tsunami observations [
14] have been used by local governments in Japan (e.g., Wakayama Prefecture, [
15]). To implement predictions of debris accumulation as an additional function in a real-time tsunami inundation prediction system, a huge number of tsunami scenarios must be considered. However, the methods of Nishino and Imazu [
11] and Kozono et al. [
12] are not appropriate for effective use of conventional tsunami inundation data because of high economic and computational costs. A practical evaluation method for estimating the amount and thickness of accumulated debris, that can effectively use the results of inundation computations for multiple tsunami scenarios, would enable efficient prediction of tsunami debris accumulation and evaluation of the tsunami-related fire hazards, which depends on the distribution of accumulations of tsunami debris.
In this study, we focused on the role of tsunami debris in the spread of tsunami-related fires and estimated production of debris by using conventional tsunami analysis results and empirically obtained building fragility functions. We then applied a previously developed practical evaluation method for tsunami debris accumulation [
6] to the urban area of Owase City, Mie Prefecture. The prediction results, including the distribution of tsunami debris and its implications for estimating tsunami hazards, are discussed.
2. Practical Method for Evaluating Tsunami Debris Accumulation and Thickness
In this section, we describe the practical tsunami evaluation method developed by Imai et al. [
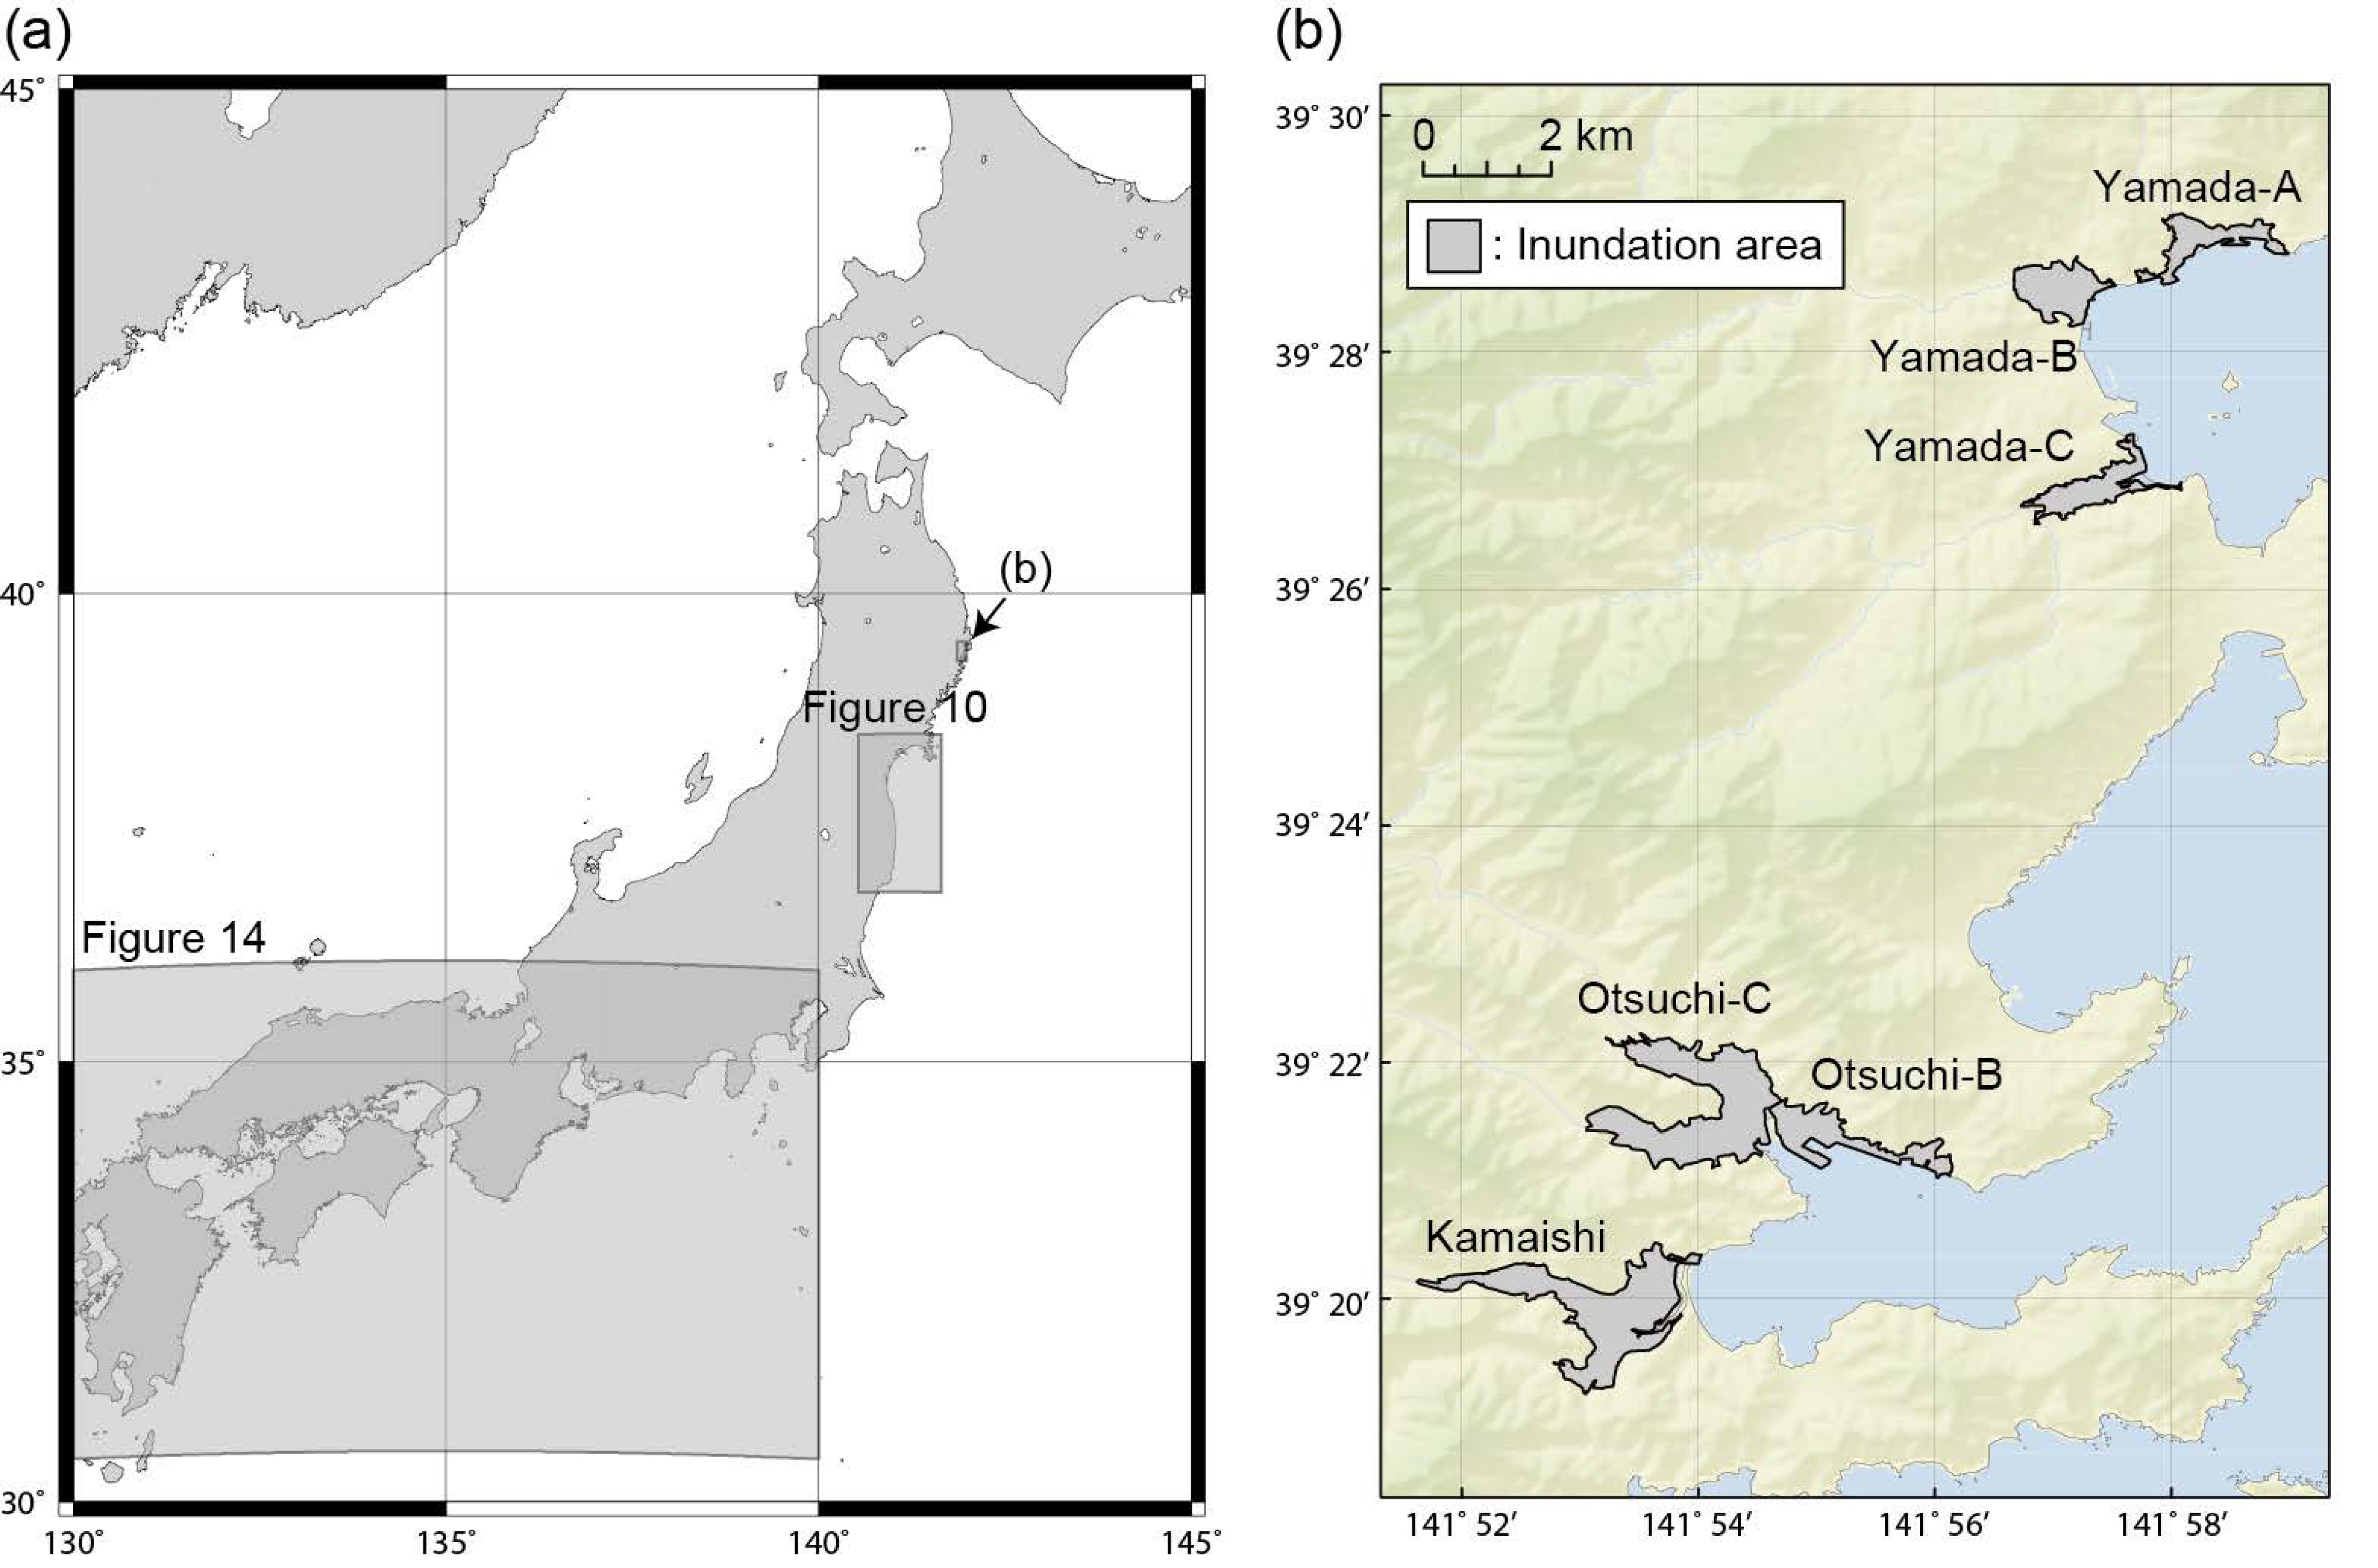
6]. In this method, four factors that determine the probability and thickness of tsunami debris accumulation are statistically extracted. To identify these factors, areas in Iwate Prefecture, severely affected by the 2011 Tohoku-oki earthquake tsunami, were analyzed: three areas in Yamada town, two areas in Otsuchi town, and all of Kamaishi city (
Figure 2).
In these areas, high-quality, high-resolution laser imaging detection and ranging (LiDAR) were conducted by the Geospatial Information Authority of Japan immediately after the 2011 Tohoku-oki earthquake tsunami. The resulting digital surface model (DSM) of the inundation area includes the height of the debris generated by the tsunami. The distribution thickness and volume of the debris was calculated from the difference between this DSM and the digital elevation model (DEM) for the corresponding area, based on measurements obtained before the earthquake, following Koshimura and Fukuoka [
16].
To assess building damage in the tsunami inundation area, information from the Reconstruction Assistance Survey Archive by the Japanese Ministry of Land, Infrastructure, Transport, and Tourism (MLIT) was used. Tsunami inundation depth data were obtained from the Reconstruction Assistance Survey Archive and the 2011 Tohoku Earthquake Tsunami Joint Survey Group [
17].
The DSM included the heights of vehicles, remaining houses, and trees at the inundation boundary, which were removed so that debris thickness could be accurately estimated. In addition, since the earthquake caused large crustal deformation in the east-southeast direction along the Iwate Prefecture coast, building locations were corrected by using pre-earthquake positional information.
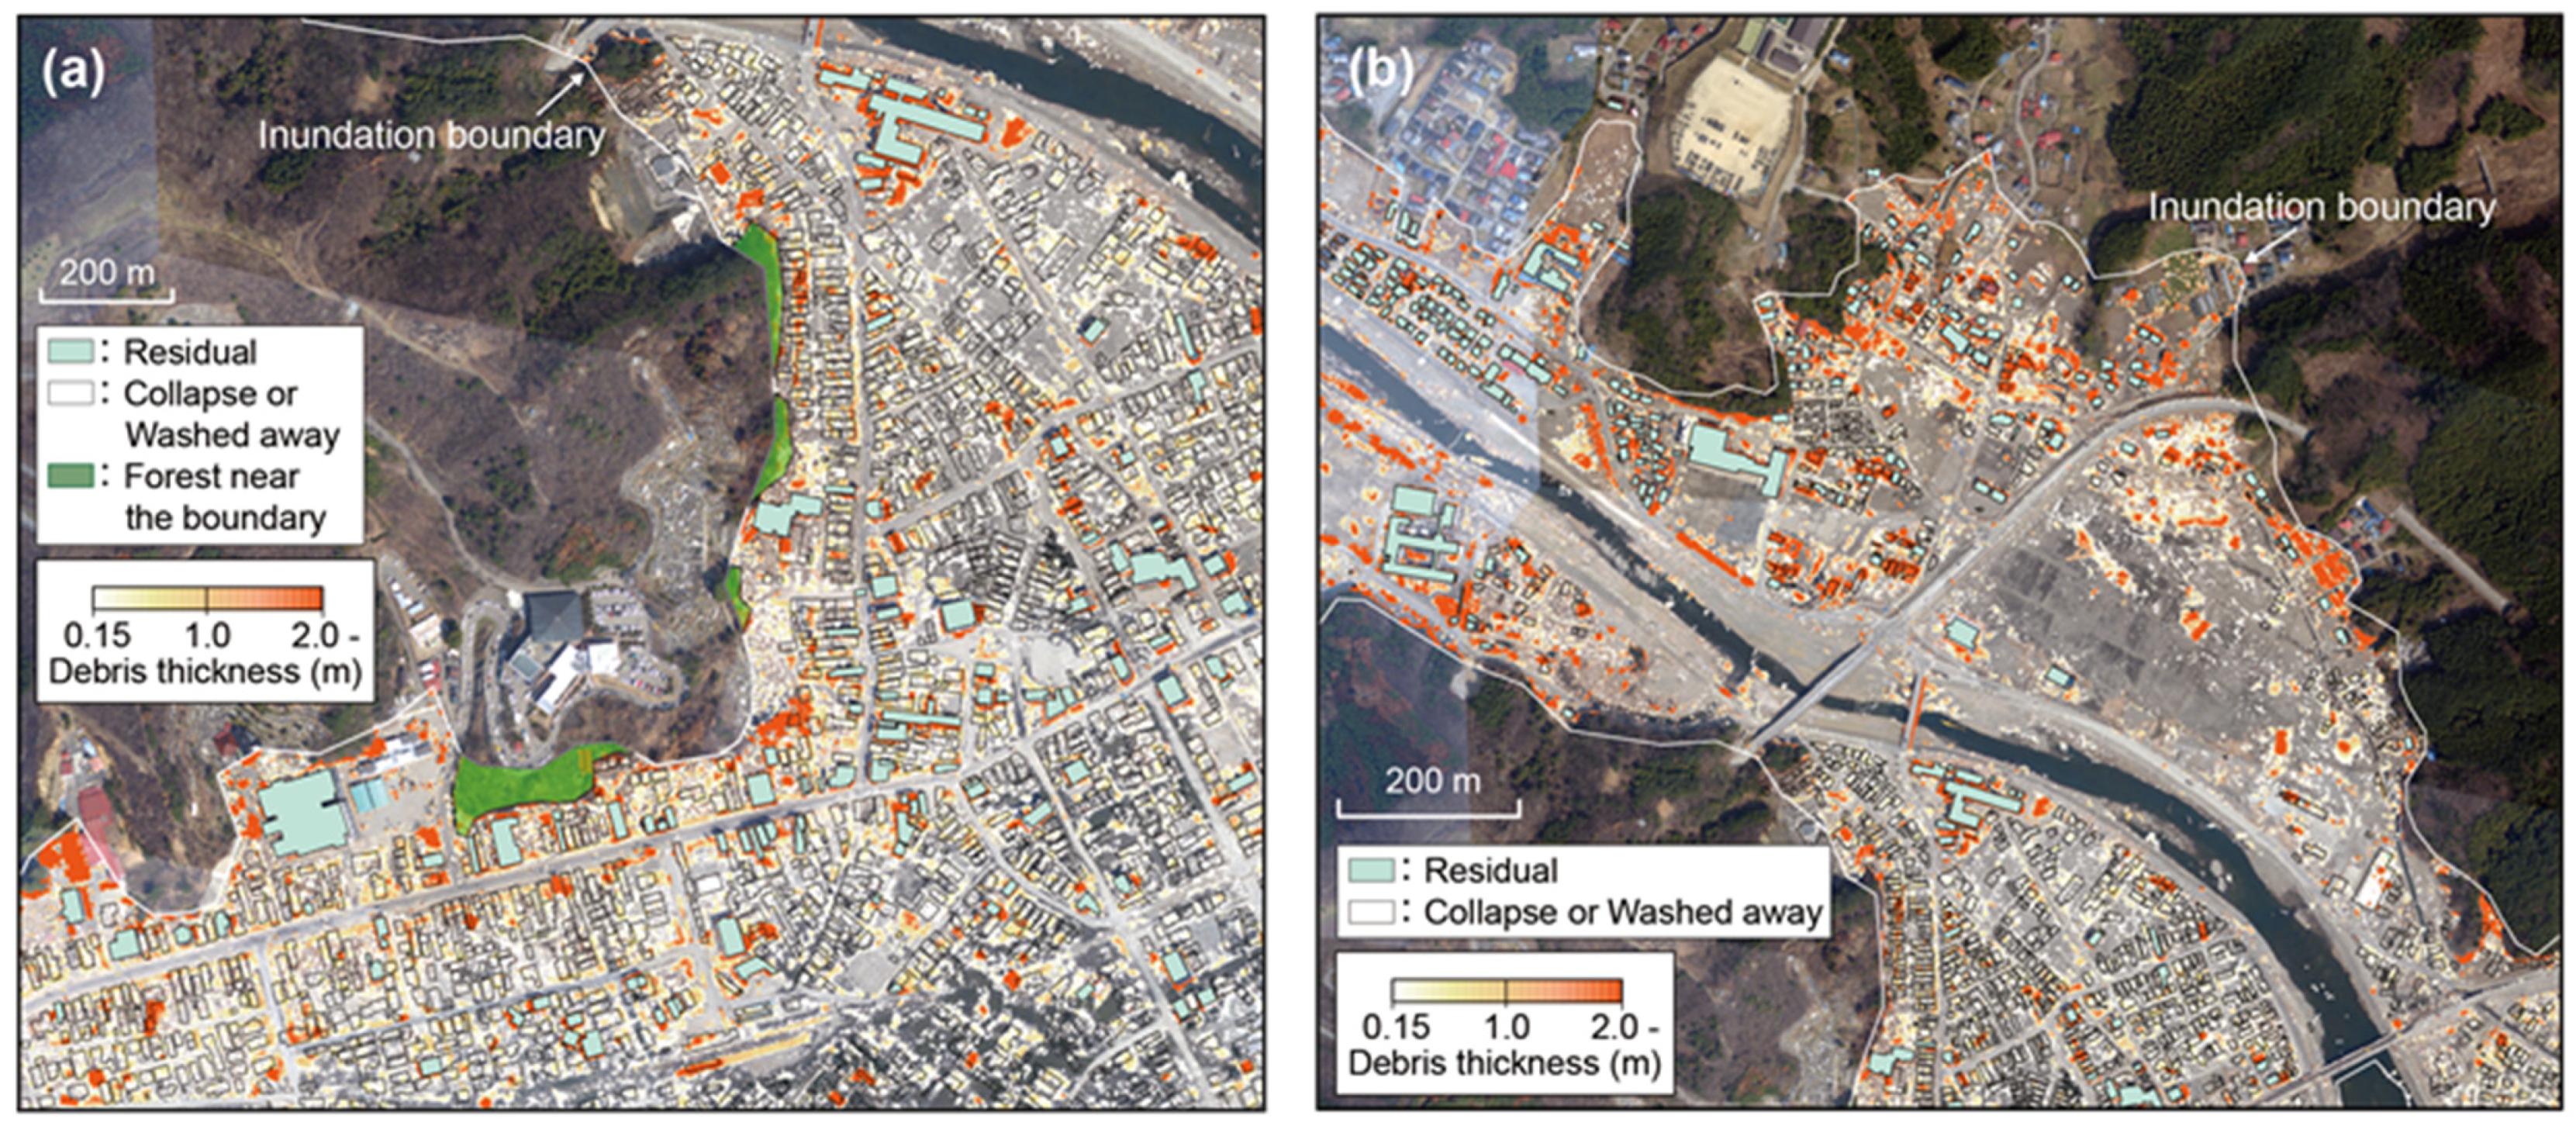
The corrected debris distribution maps showed that tsunami debris tended to accumulate near the inundation boundary and near where buildings had been washed away (
Figure 3). Debris accumulated around building foundations and between remaining buildings. The mechanism of debris accumulation was similar to that which causes drifting debris to be trapped by trees [
18].
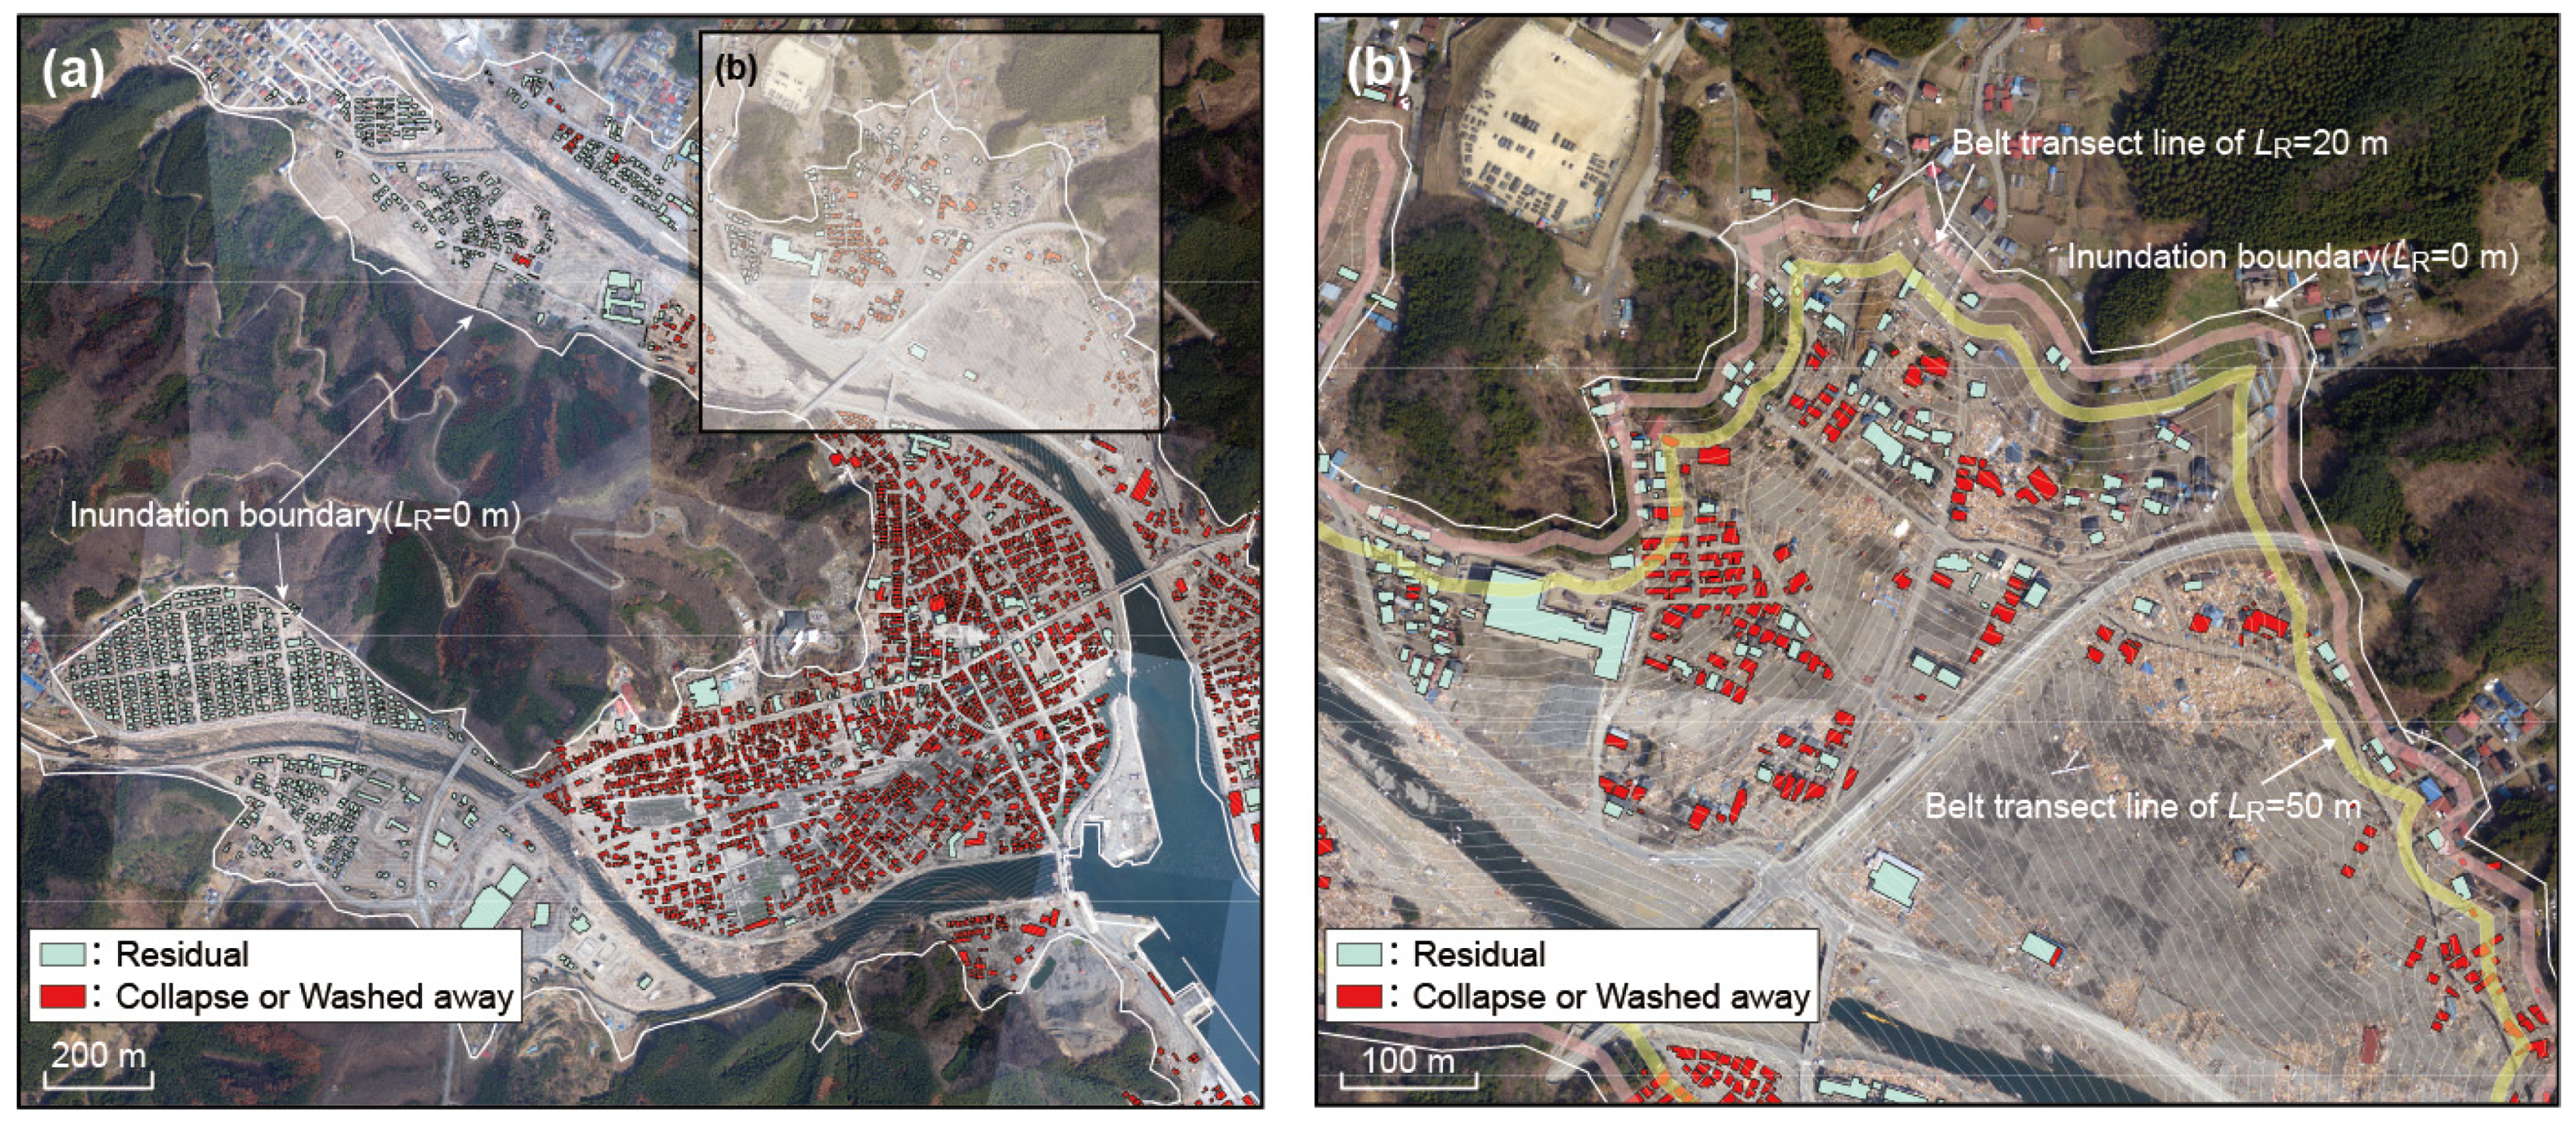
To clarify tsunami debris accumulation trends and amounts, belt transects were defined parallel to the tsunami inundation boundary in each analysis area (
Figure 4). Each belt transect was 10 m wide, and the distance from the inundation boundary to the seaward edge of the transect was defined as
LR. Each belt transect was also divided into grids at 10 m intervals.
In each grid along each belt transect, the maximum inundation depth
D (m) was used as the index of tsunami magnitude. The average debris thickness, obtained from the difference between the DSM and DEM, was defined as
DT (m), and the maximum topographic slope was defined as
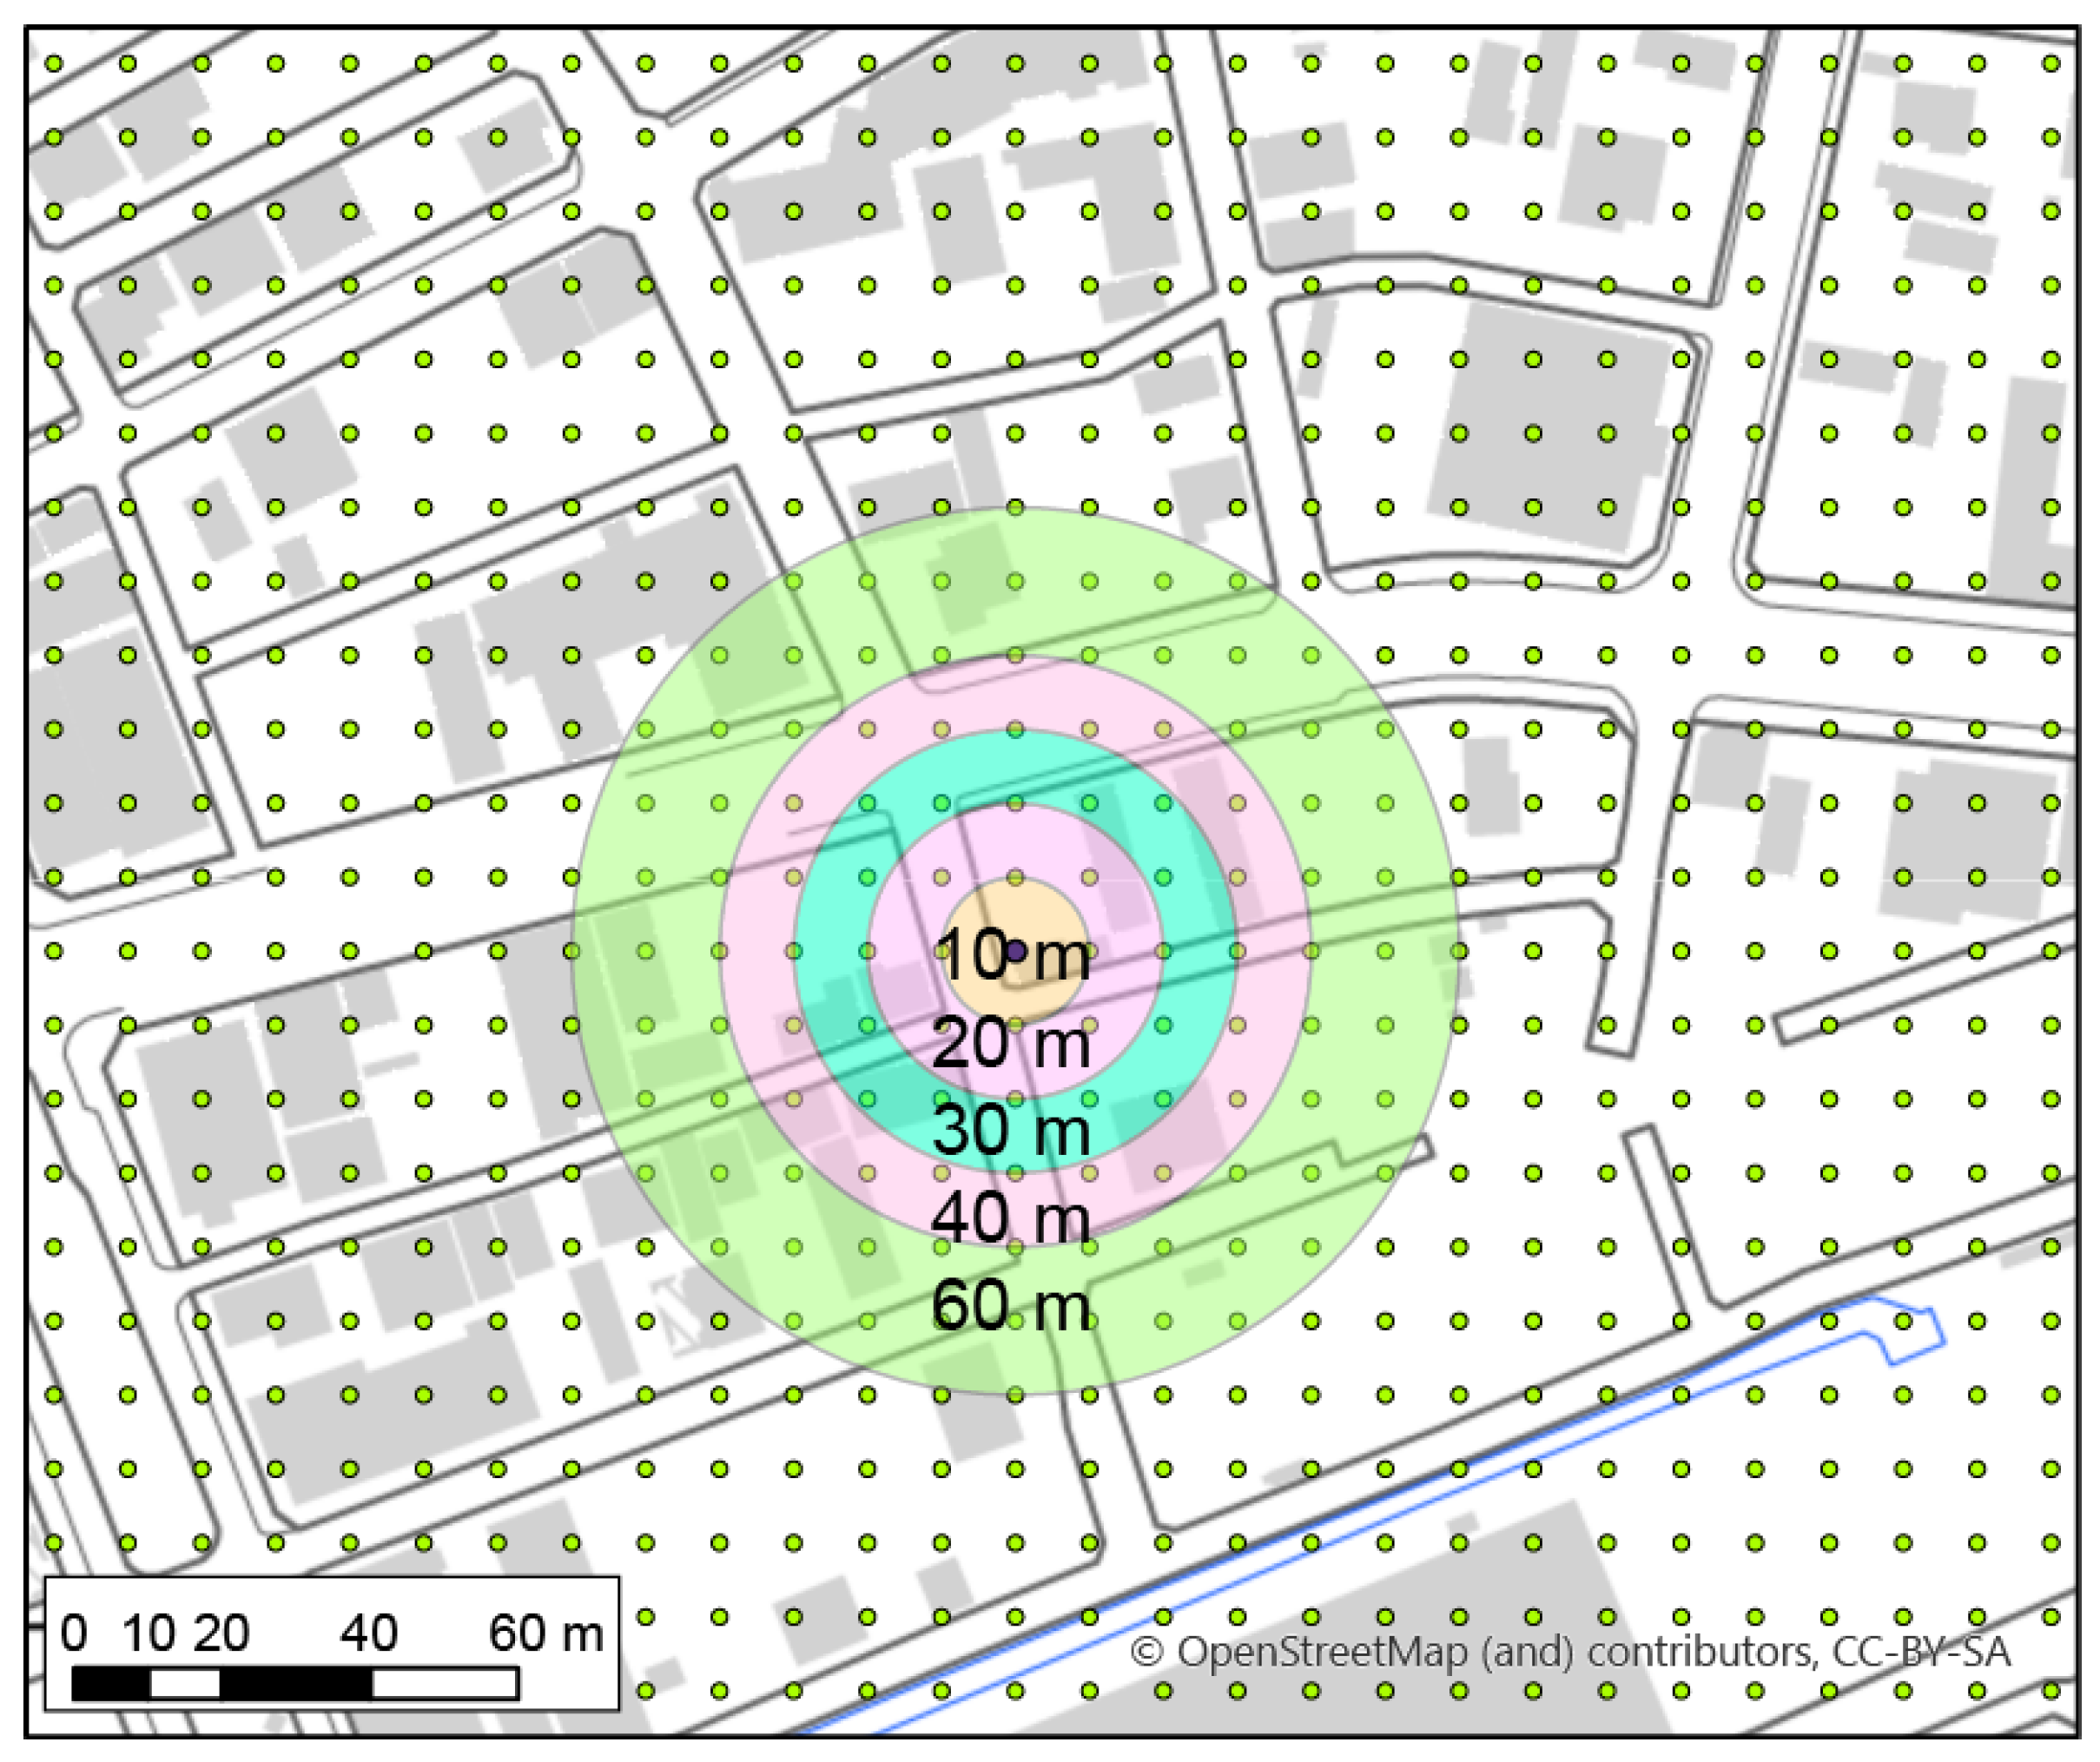
iM (%). An index for the existence of buildings (including washed away and totally destroyed buildings) weighted by the distance between 10 and 60 m from an arbitrary position was defined as
SI (=
k10 +
k20/2 +
k30/3 +
k40/4 +
k60/6,
ki is a parameter for the existence of a building, independent of whether it has been washed away or not, with 1 and 0 corresponding to existence or non-existence; the subscript i indicates the distance range in meters), the definition sketch of
SI evaluation is shown in
Figure 5. To describe the characteristics of each analysis area, the ratio of the maximum width,
W, of the inundation area to the shortest distance from the shoreline to the inundation boundary,
LR0, in each analysis area was defined as
AS. Debris volume in each grid was calculated by multiplying
DT by the area of the grid. If the debris thickness was less than 0.15 m (the detection accuracy of LiDAR), no debris accumulation was assumed.
Each parameter was then normalized as follows: the normalized distance from the inundation boundary was defined as L* = 1 − LR/LR0; the inundation depth was defined as D* = D/LR; the normalized debris thickness was denoted by NDT = DT/ΣDT (where ΣDT is the total thickness of the debris in each area).
Tsunami debris can accumulate on land, or it can be discharged into the sea. Therefore, the amount of woody debris from the tsunami that remained on land in each analysis area was estimated by comparing the volume of the buildings that had been washed away with the total accumulated debris volume. The volume of debris deposited was calculated by taking into account the porosity of the debris height data. The estimated total volume of debris from destroyed or collapsed buildings was calculated as the total volume of the buildings that were washed away in the building area. On average, the proportion of the building debris produced by the tsunami that remained on the land, the residual rate, was about 50%, although it varied among the analysis areas (
Table 1). The amount of debris remaining on the land depends on various factors, including tsunami size, land use, and topography. The determination of the residual rate should be evaluated in a future study.
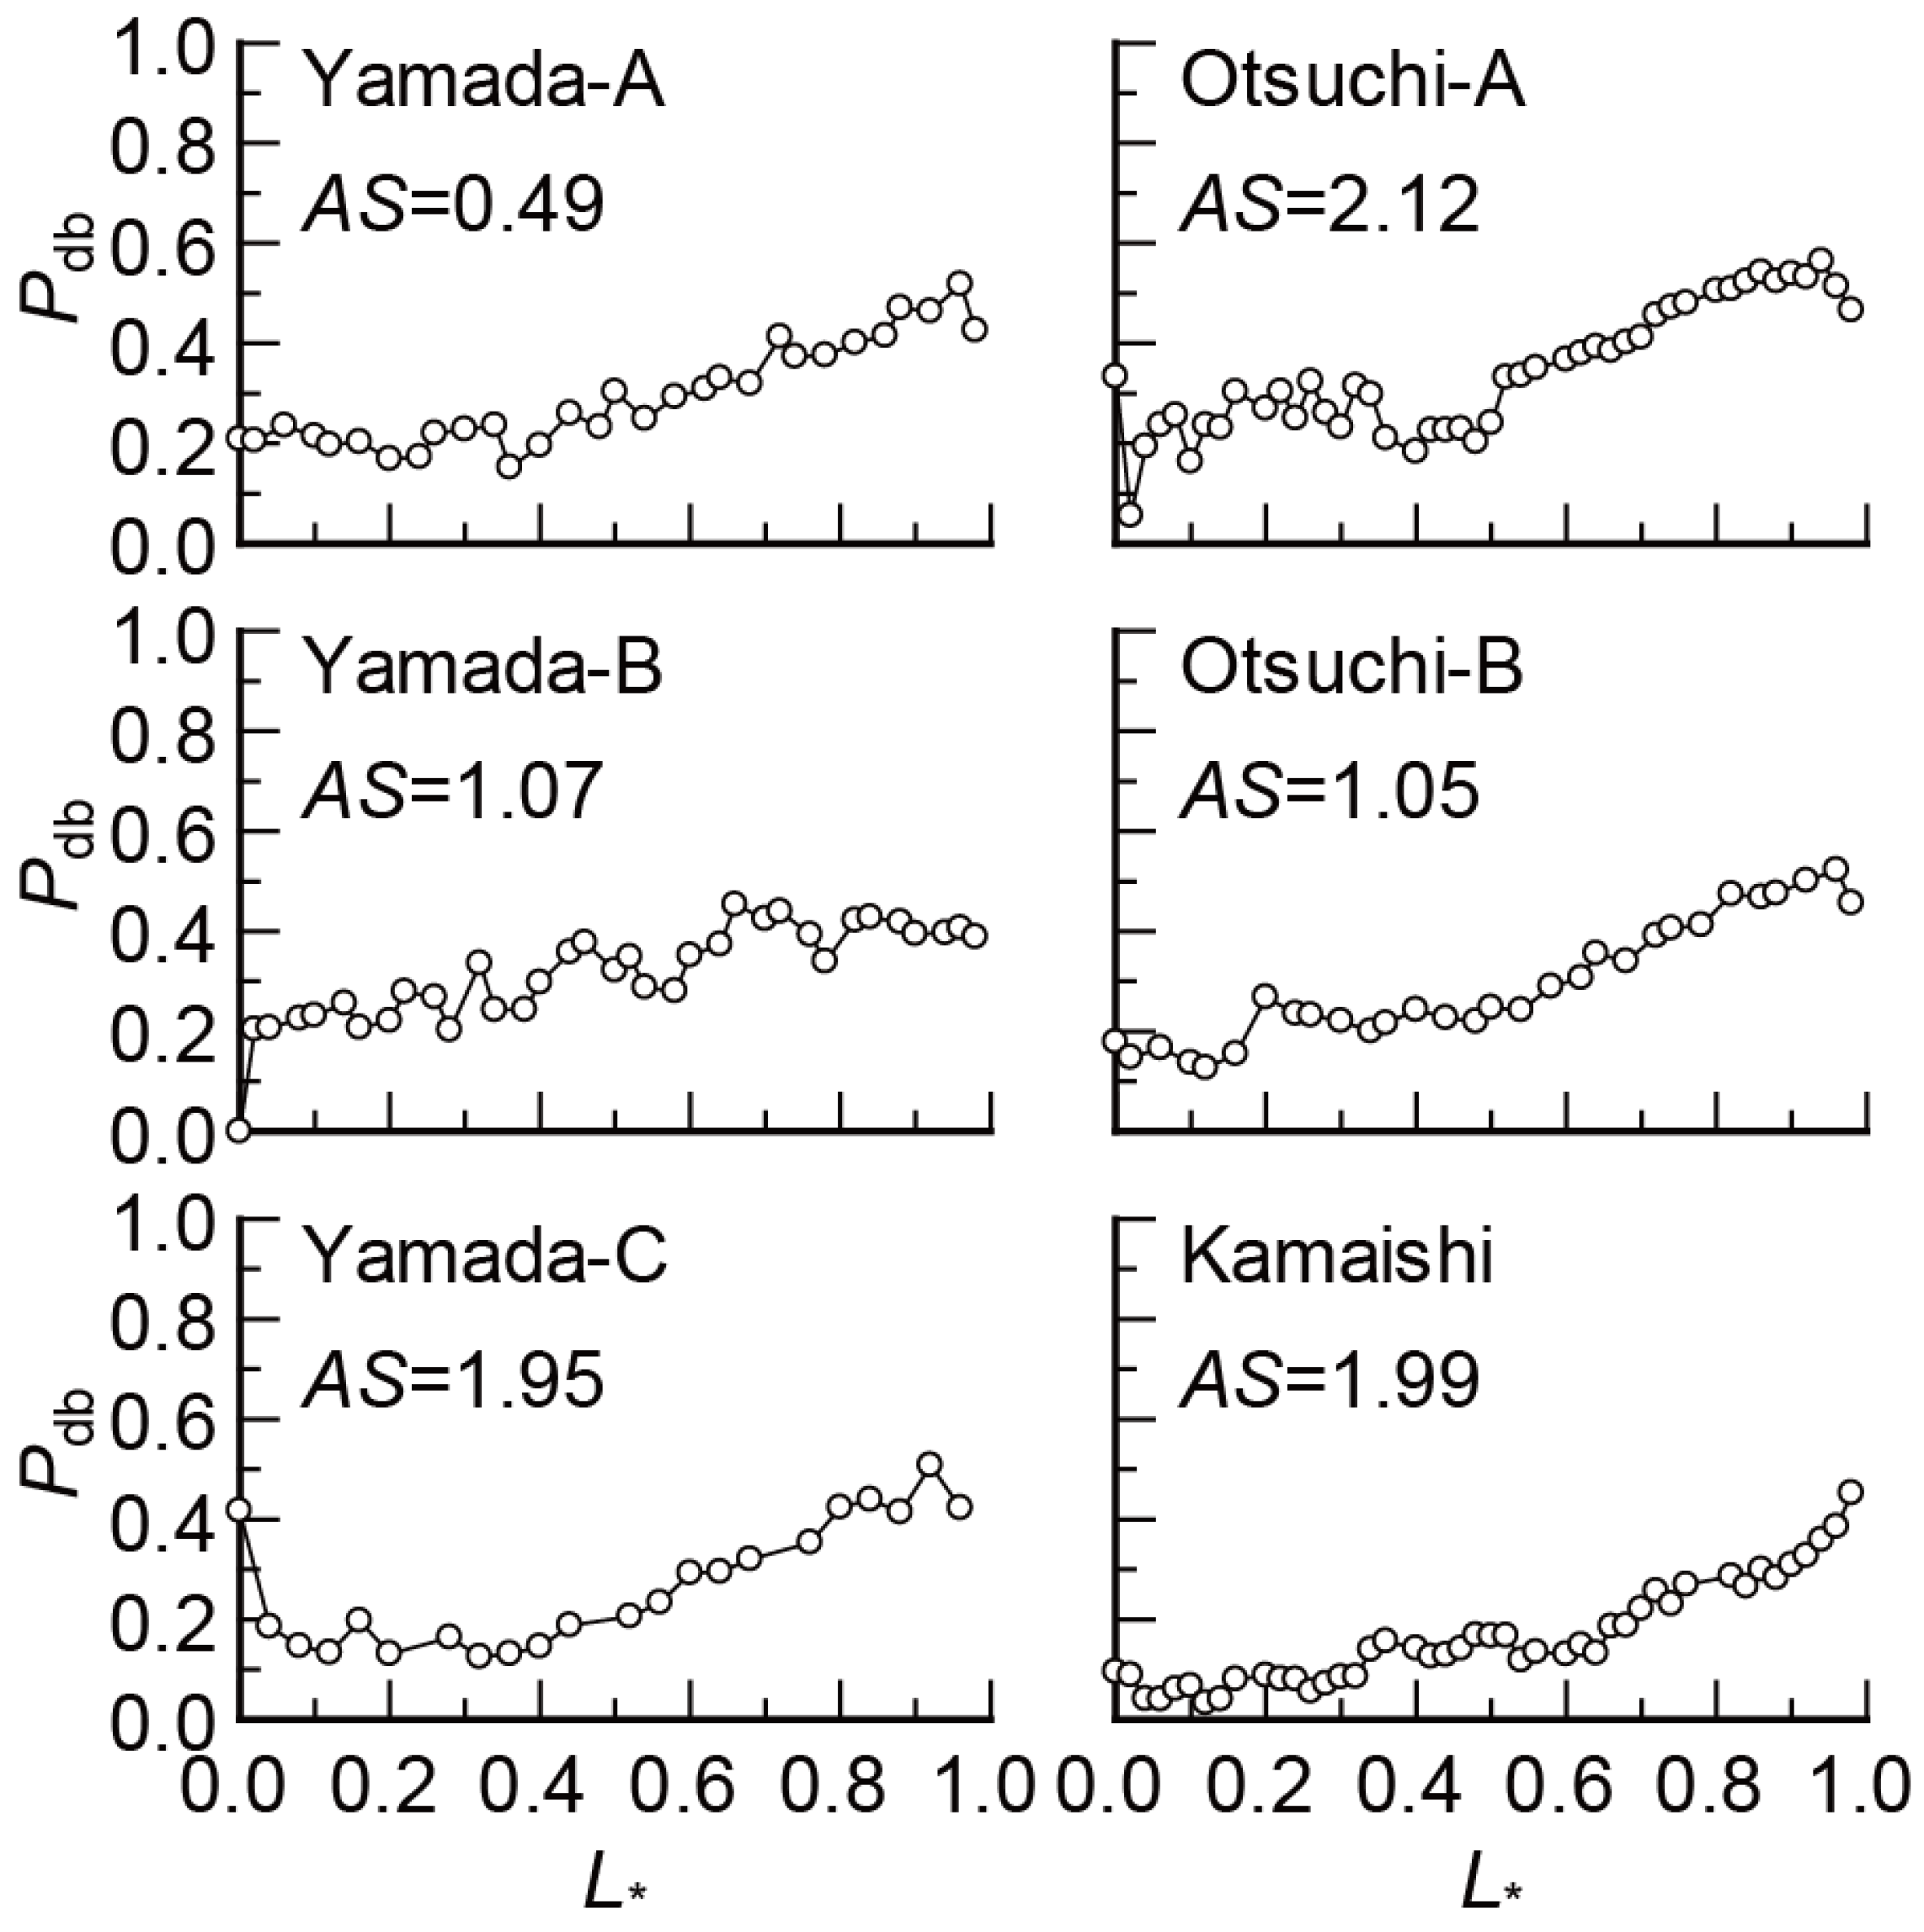
The probability of debris deposition,
Pdb, was obtained by binarizing the deposition or non-deposition of debris in each belt transect and then compared with
L* (
Figure 6). In general,
Pdb tended to be larger closer to the inundation boundary (
L* = 1.0). Although this trend differed among the analysis areas,
Pdb never exceeded 0.5; when
AS was less than 1,
Pdb increased slowly, but in some other areas,
Pdb was almost constant. Therefore,
L* cannot fully explain
Pdb. Moreover,
Pdb was sometimes higher at lower values of
L*, possibly because residual foundations of washed away buildings prevented the deposition of debris. In addition to
L*,
AS and
SI are candidate parameters to explain
Pdb.
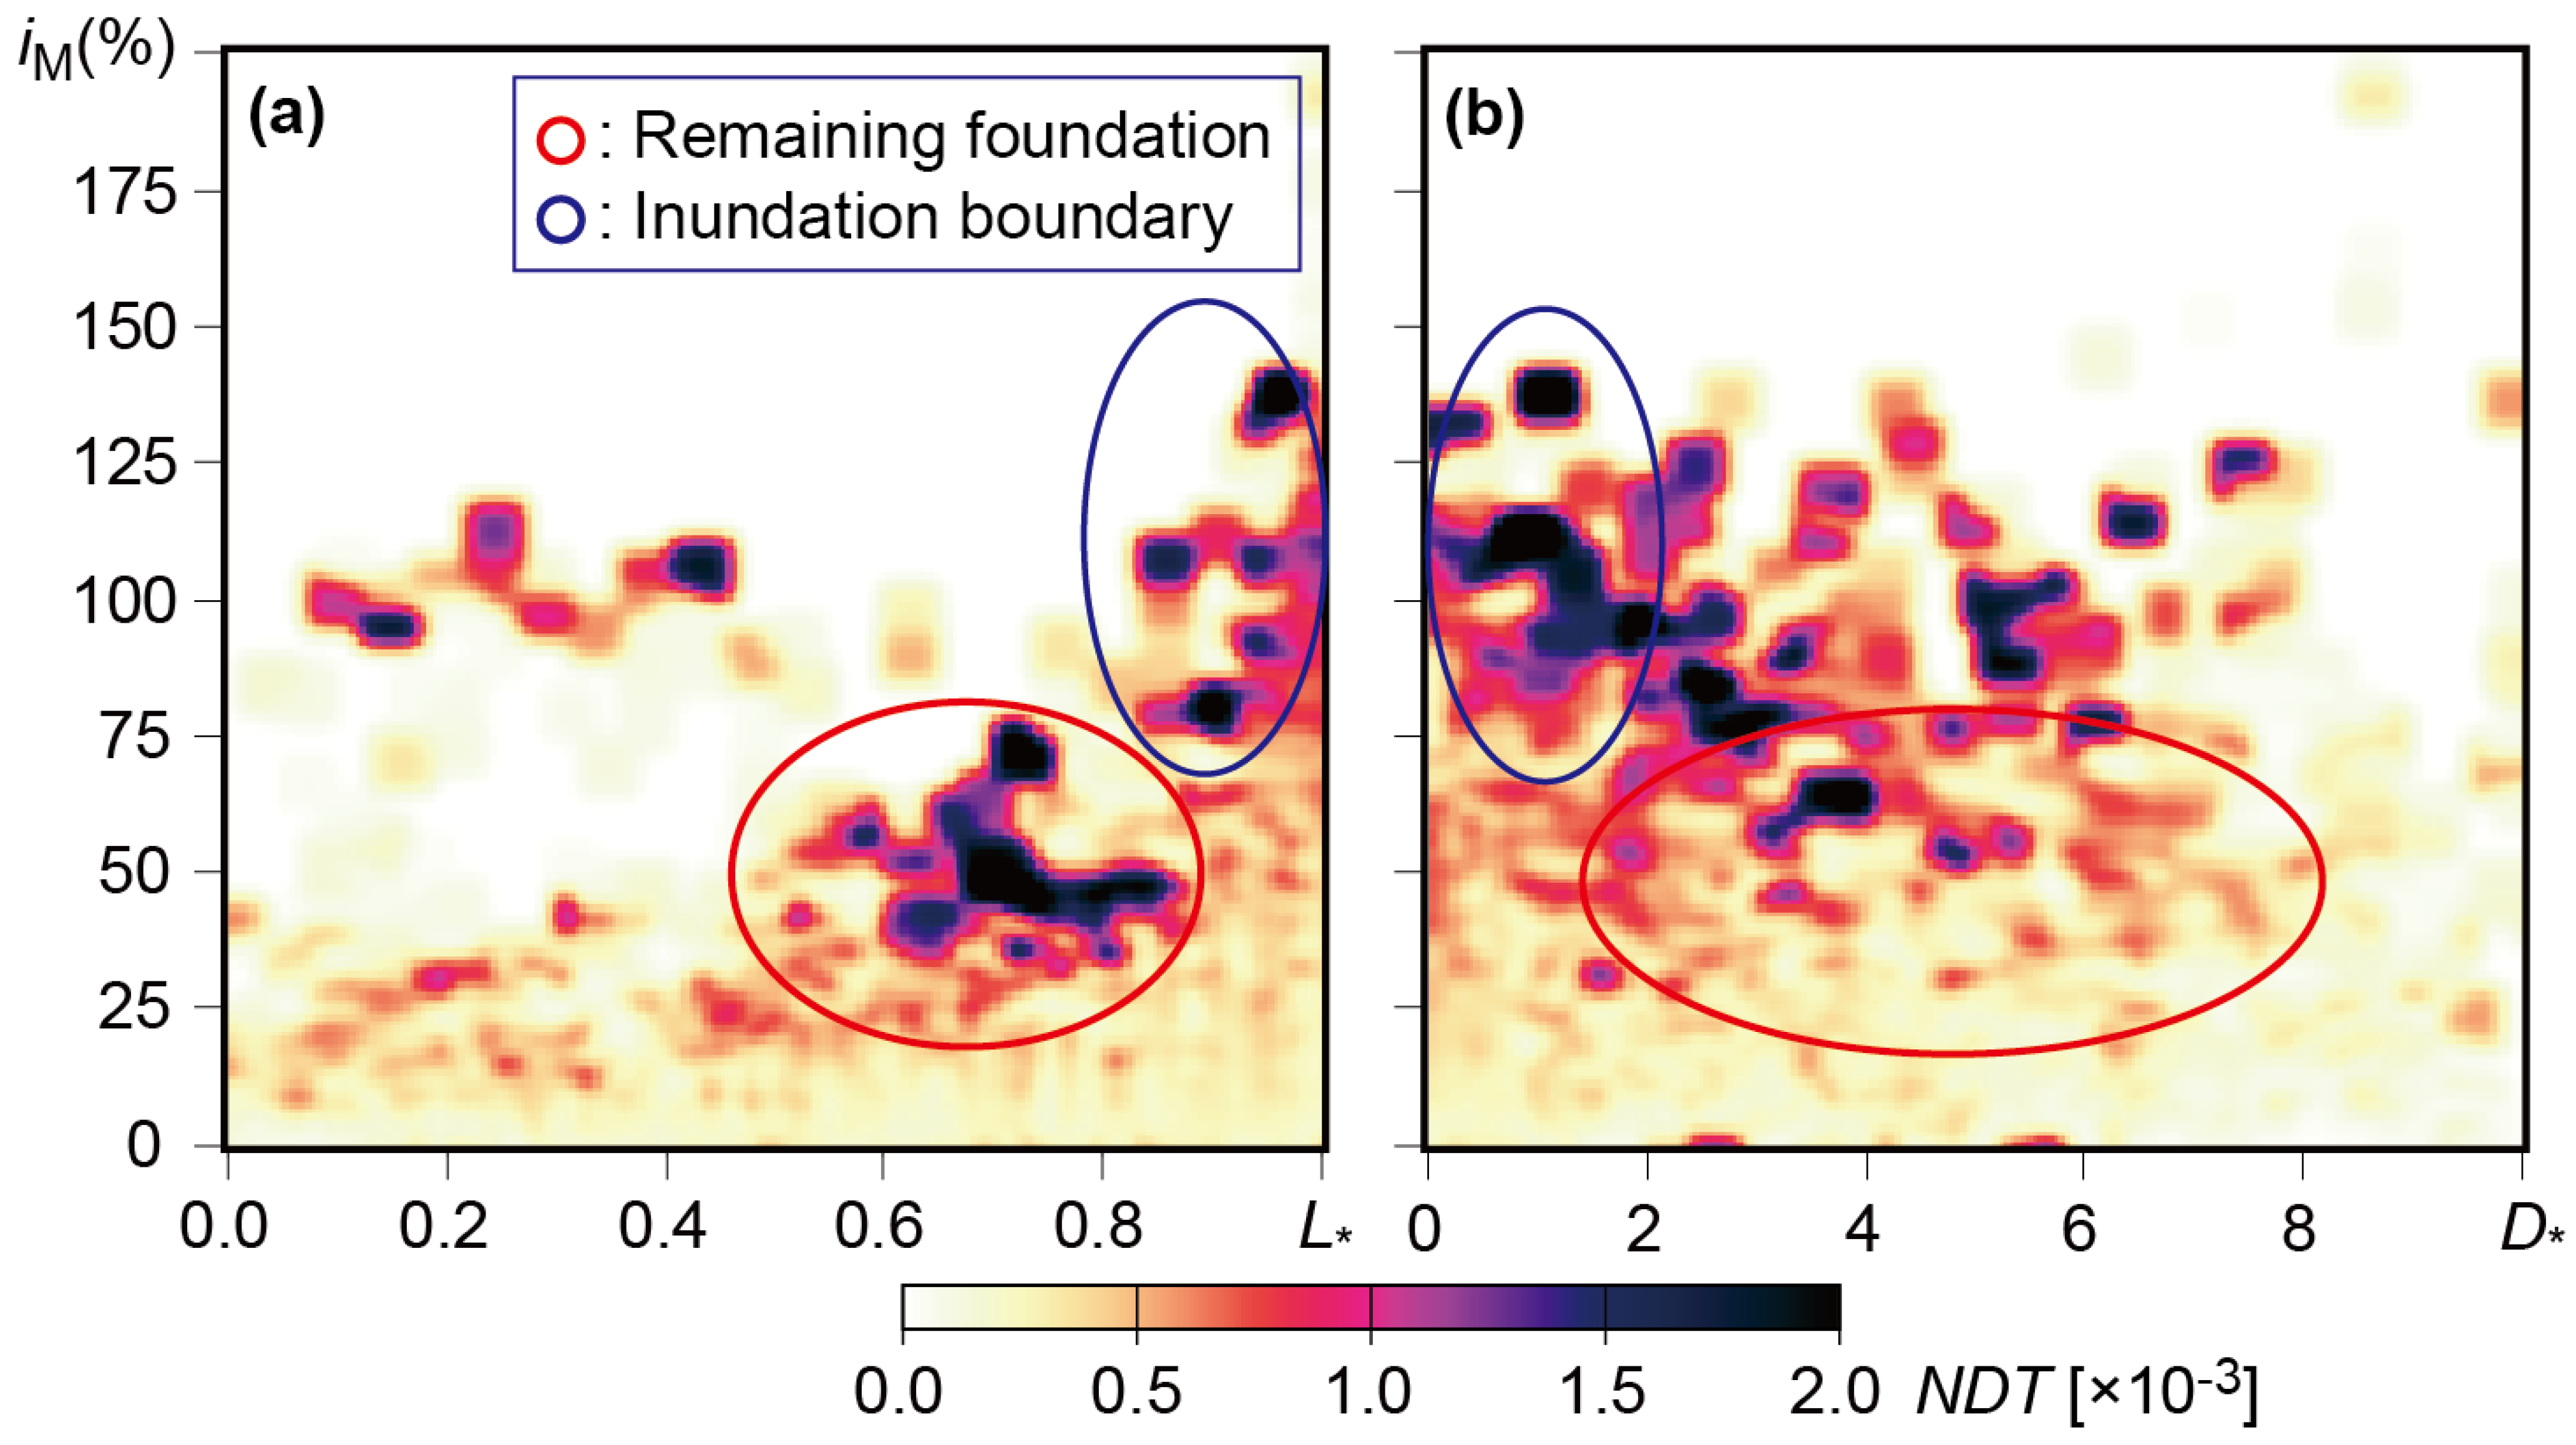
The relationships between
NDT and
iM,
L*, and
D* were examined using data from all analysis regions (
Figure 7).
NDT was higher when 80% <
iM < 100% and 0.0 <
L* < 0.4, and it was also higher when 25% <
iM < 75% and 0.4 <
L* < 0.8 (
Figure 7a). Where
iM was relatively less, these higher
NDT values were attributed to the accumulation of debris in residential areas. Because the analysis area is located along a ria coast, characterized by narrow valleys surrounded by mountainous terrain,
iM was relatively large near the inundation boundary. The relatively steep mountainous terrain blocked the tsunami flow and caused debris to accumulate, as reported by Hokugo et al. [
1]. In addition,
NDT was high when 0.0 <
D* < 8 and 25% <
iM < 125% (
Figure 7b). These high
NDT values were also considered to be related to land use, because residential areas are mainly in areas with relatively small
iM. The relationships between each of these parameters and
NDT are difficult to interpret systematically and there are no clear trends; these are features of a complex system.
The practical evaluation model for debris accumulation, developed by Imai et al. [
12], consists of two independent evaluation models, one for
Pdb and the other for
NDT.
A stochastic model for
Pdb was constructed by a logistic regression in which the explanatory values were
AS,
L*, and
SI, as follows:
The predictive accuracy of Pdb > 0.5 determined with Equations (1) and (2) was 70%.
NDT was assumed to be a power function of
AS,
L*,
D*,
iM, and
SI, and Equation (3) was obtained by fitting the function to the observed data, as follows:
σNDT as of 0.48 × 10⁻⁴, the standard deviation included in the regression value of the predicted NDT. The predicted NDT ranged from 0.5 to 3.0 times the observed value. It was applicable for 0.49 < AS < 2.13, 0 < L* < 1, D < 7 m, 0 < D < 10, 0 < iM < 200, and 0 < SI < 2.25.
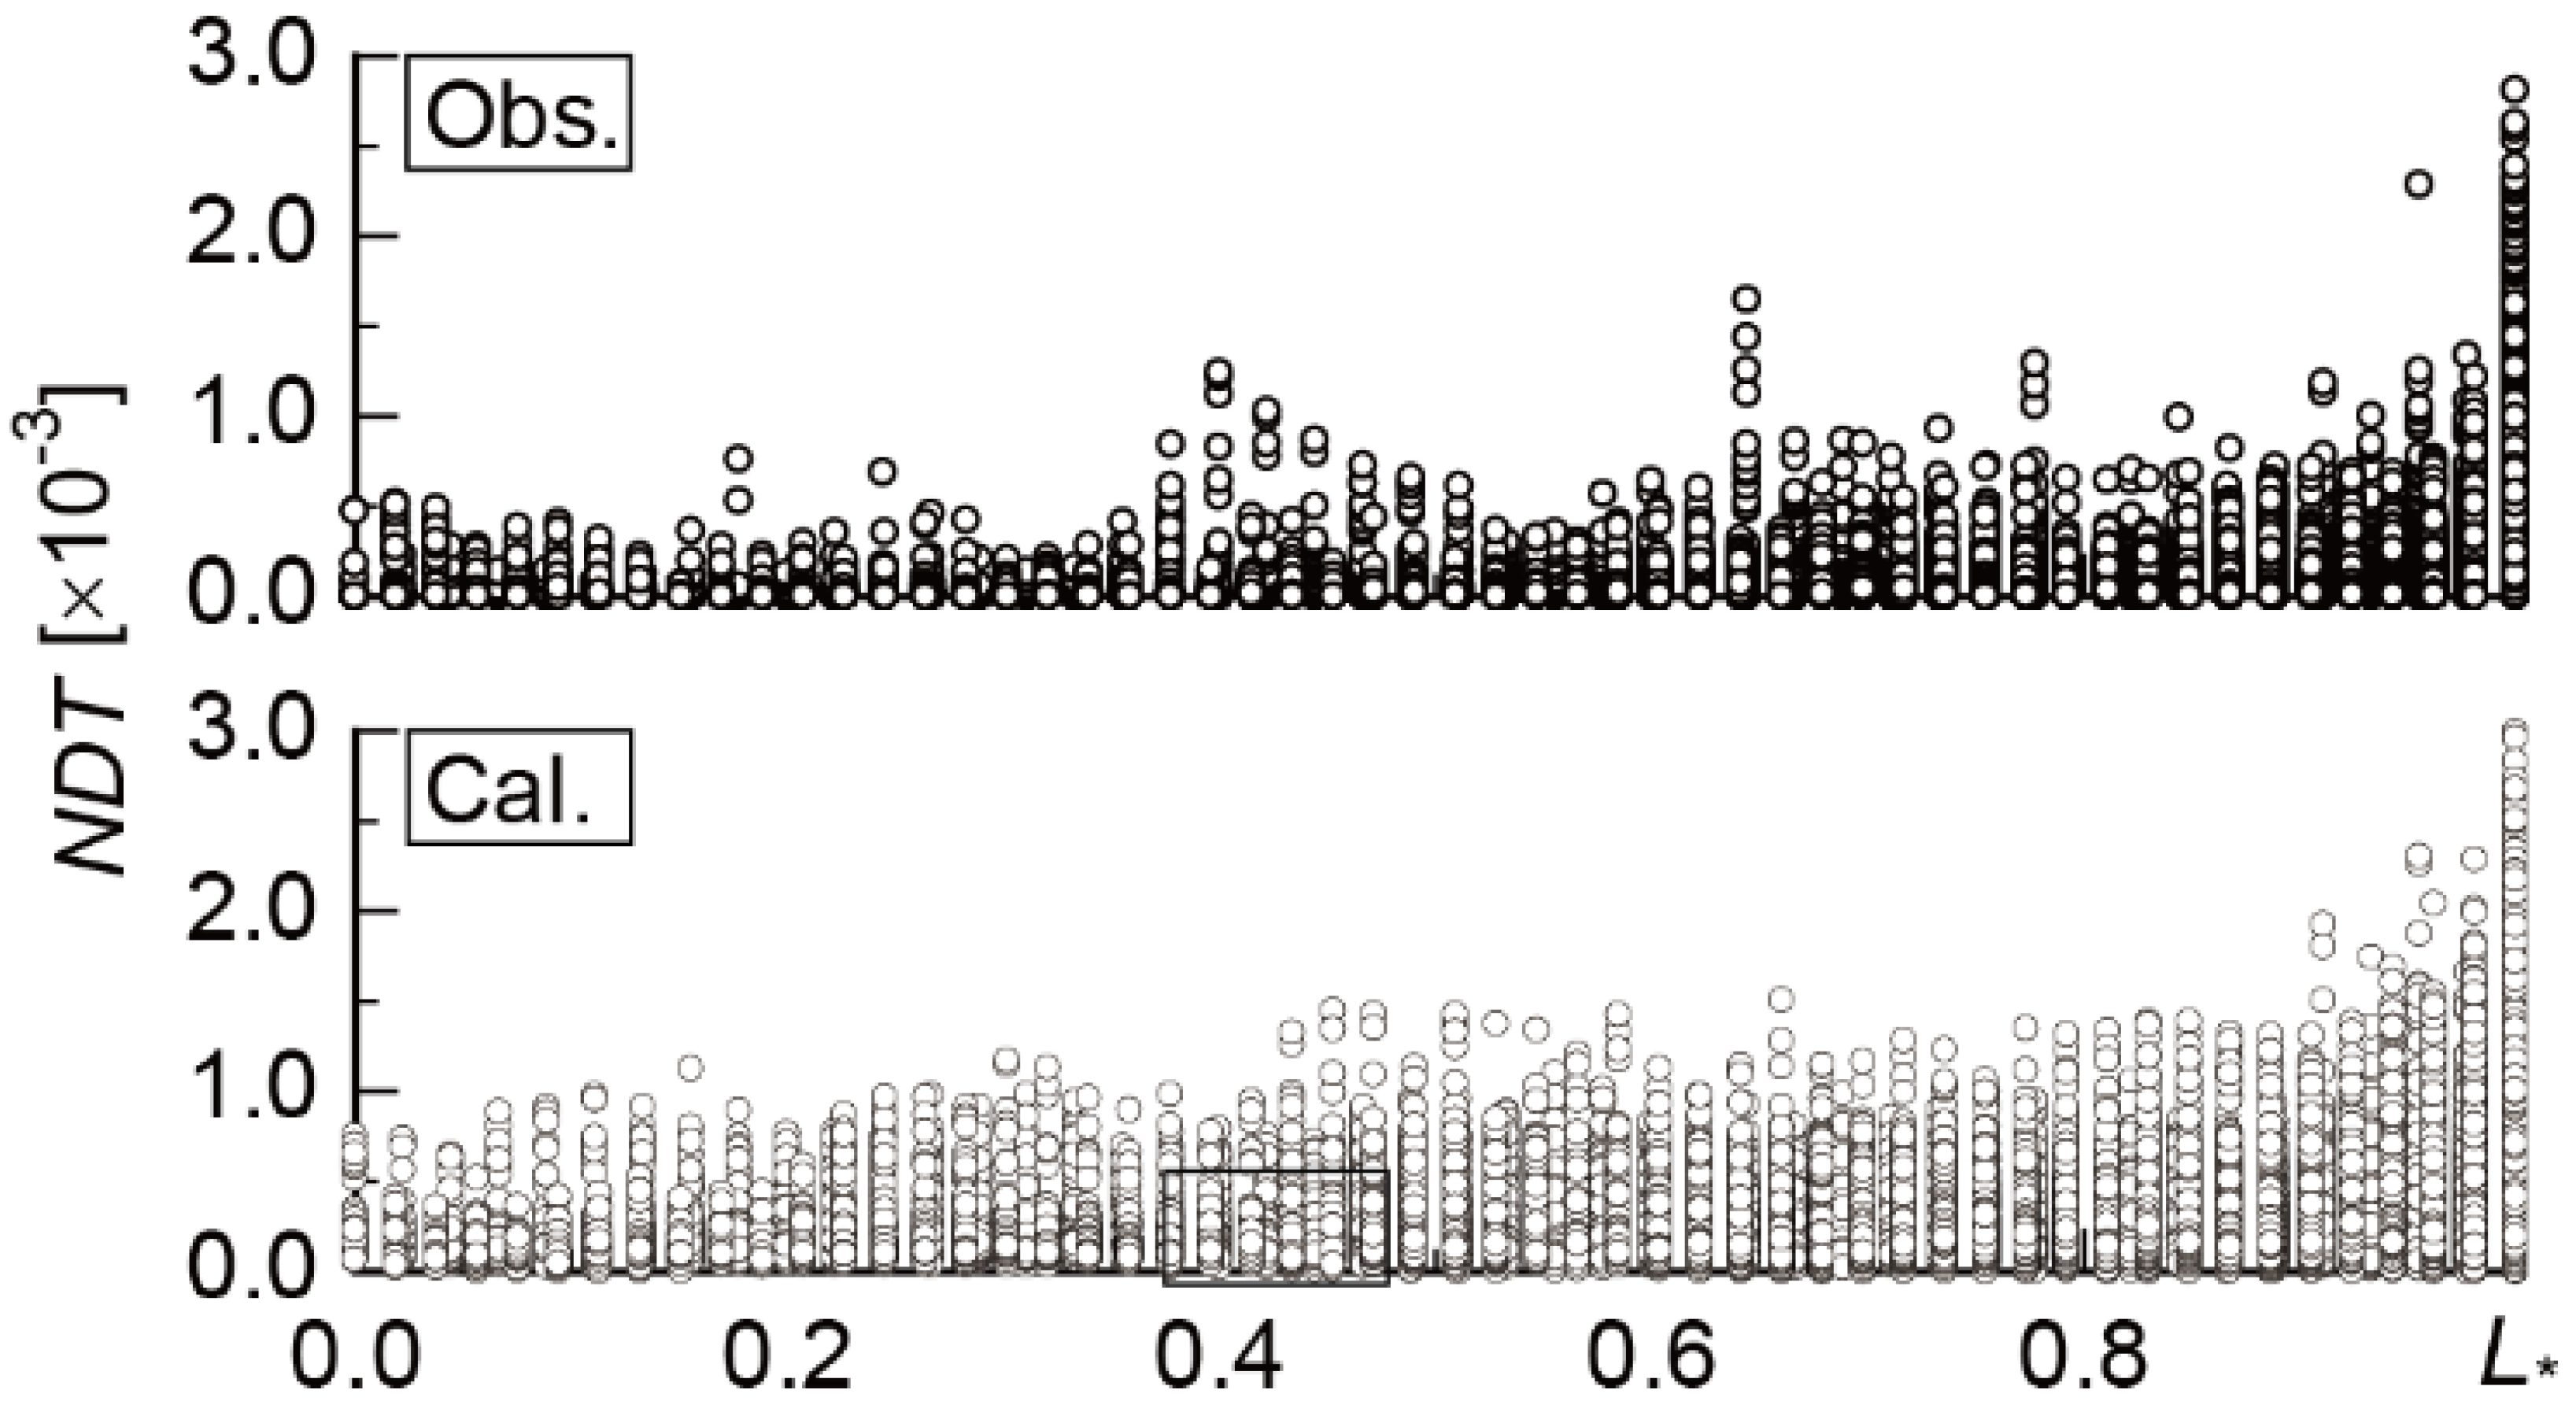
Both the observed and calculated value of
NDT tended to increase as
L* approached the inundation boundary (
L* ≈ 1) (
Figure 8). For example, in
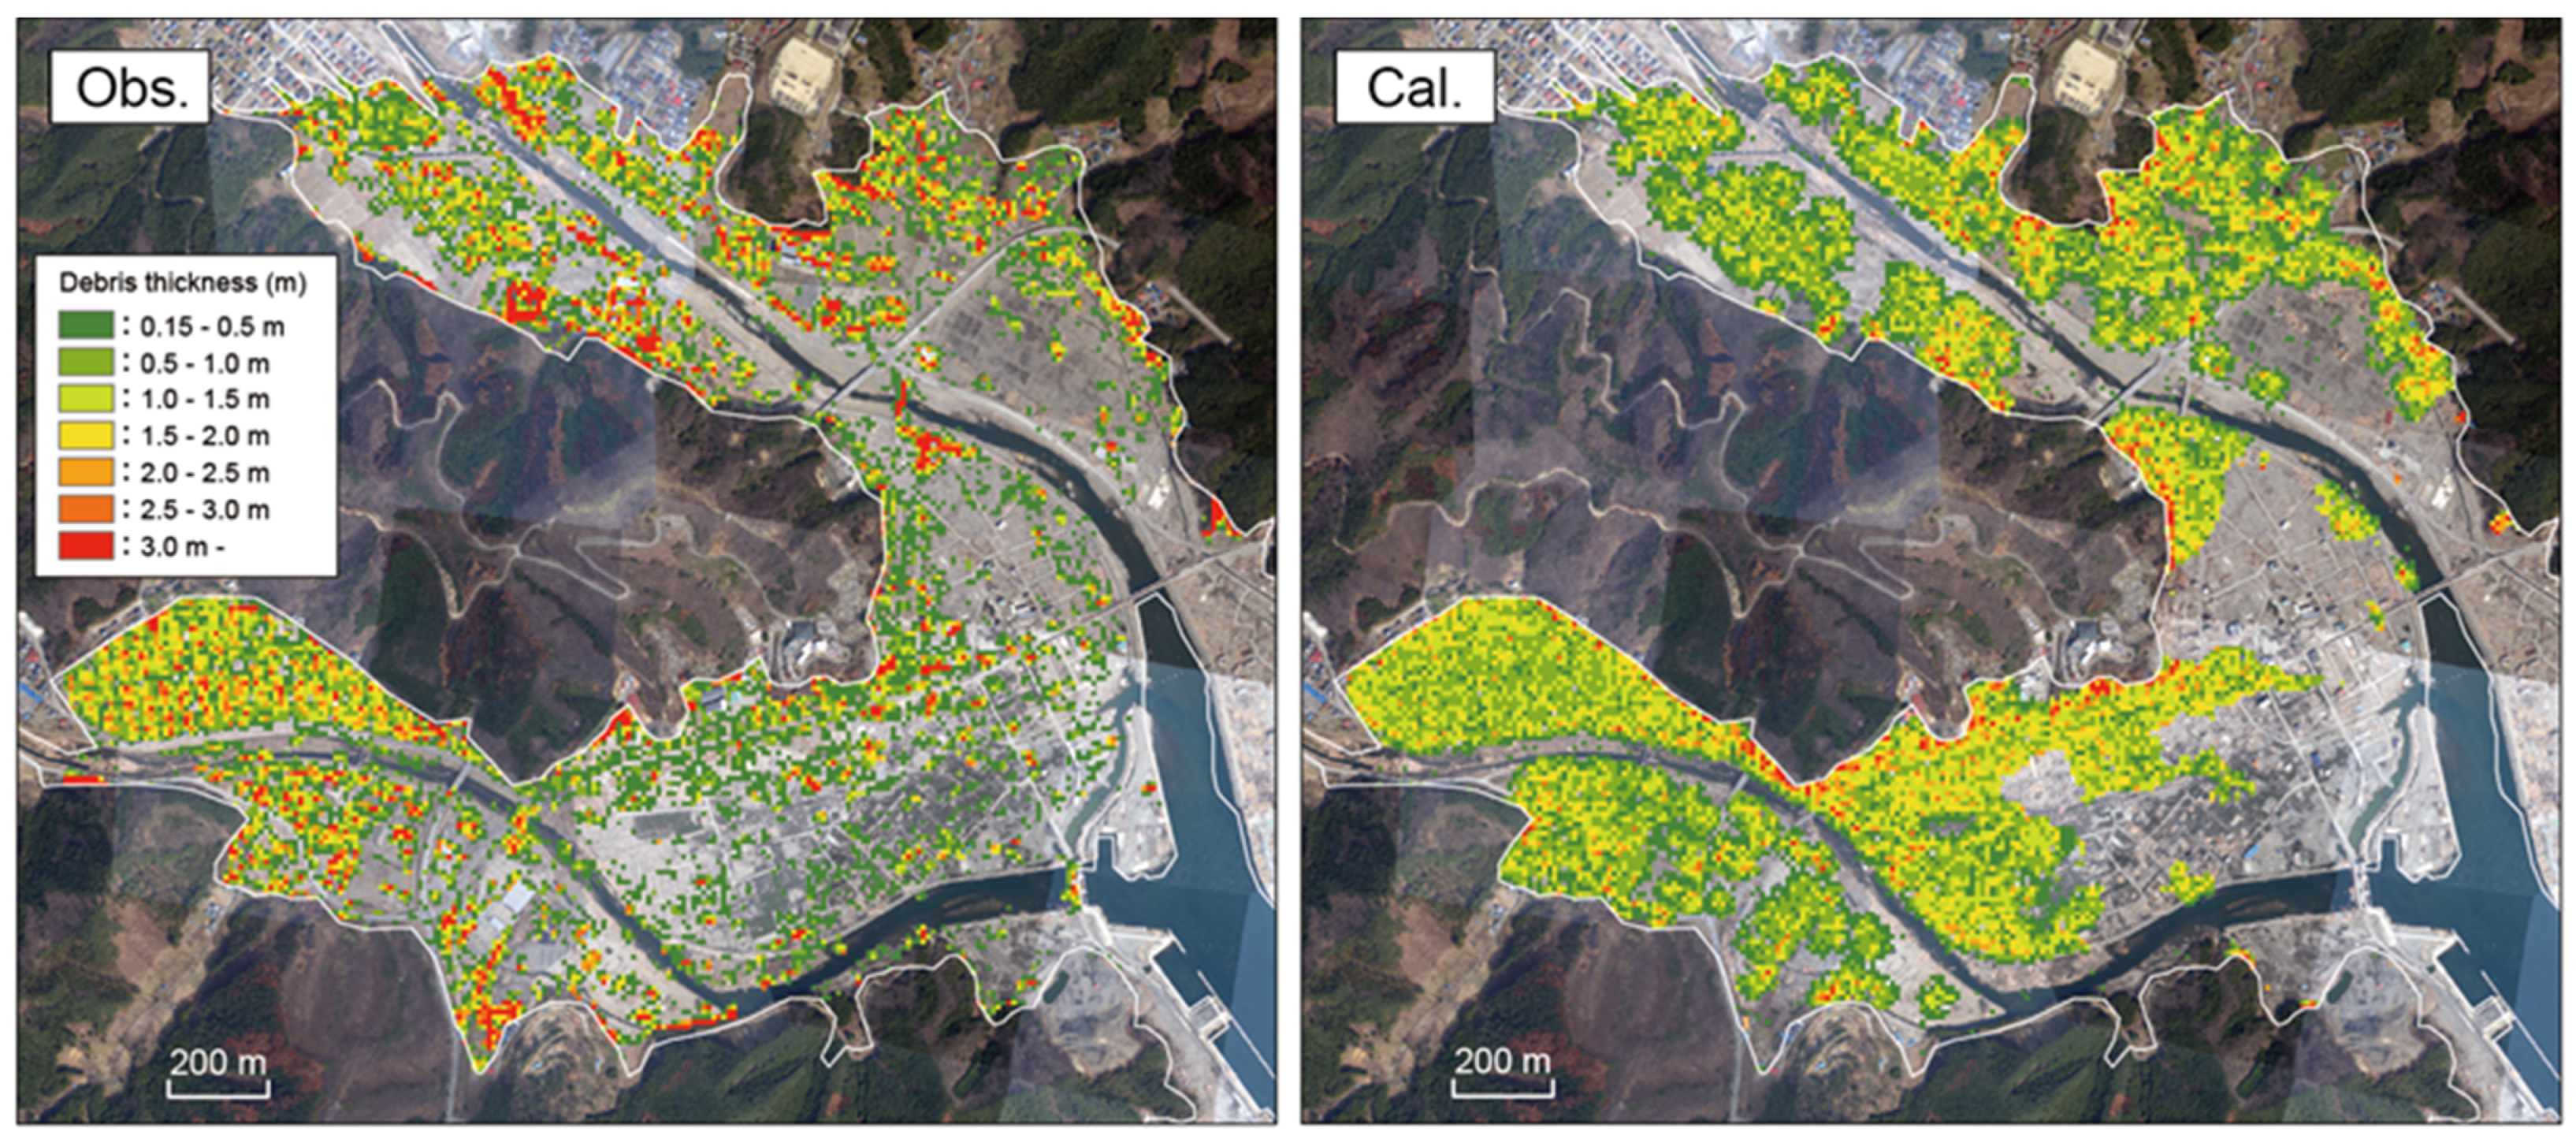
Figure 8, the observed and calculated distributions of accumulated debris thickness in Otsuchi are compared (
Figure 9). The accumulated debris thickness was calculated using Equation (3) with the observed values of each parameter (
AS,
L*,
D*,
iM, and
SI), and the probability of debris accumulation was calculated using Equations (1) and (2) with uniform random numbers, where the mean of 100 trials was used as the representative value. In the calculated results, the accumulation of debris was seen around the inundation boundary and buildings, but local increases in debris thickness in the observed distribution were not reproduced. Rather, the debris tended to be deposited thinly over a wider area than was the case in the observed distribution.
3. Estimation of the Total Amount of Tsunami Debris in the Target Area by a Tsunami Fragility Function
The evaluation model expressed by Equations (1)–(3) is used to predict where tsunami debris is likely to accumulate and its thickness. To convert NDT obtained by Equation (3) to the actual debris thickness, DT, the total volume of woody debris produced by the tsunami in the analysis area must be known. In this study, we estimated the total volume of woody debris by using a tsunami fragility function for wooden buildings under the assumption that most of the woody debris was derived from wooden buildings damaged by the tsunami.
The fragility function, which follows the form of fragility function for earthquake motion, is defined by Equation (4), based on the normal distribution function Φ [
19], as follows:
Here,
PD is the probability of total loss damage,
x represents the external force (here, the tsunami inundation depth),
t is the variable of integration, and
μ and
σ are the average and standard deviation of
x;
μ corresponds to the inundation depth at which the damage probability is 50%. The values of the statistical variables
μ and
σ were determined by the conventional method [
19].
A ria coast, such as the Sanriku coast, is characterized by relatively steep slopes. Therefore, the building damage caused by tsunamis was expected to be complicated by the return flow of the tsunami waves, including reflected and superposed waves, due to the steep topography at the edges of the inundated areas. In contrast, on a coastal plain with a straight coastline, most building damage is caused by the tsunami run-up flow, and the influence of the return flow and reflected or superposed waves is assumed to be very weak. The building fragility function was constructed for a plain coast with a straight shoreline, where the complexity of the tsunami flow field is considered to be low, and a clear relationship exists between tsunami magnitude and building damage.
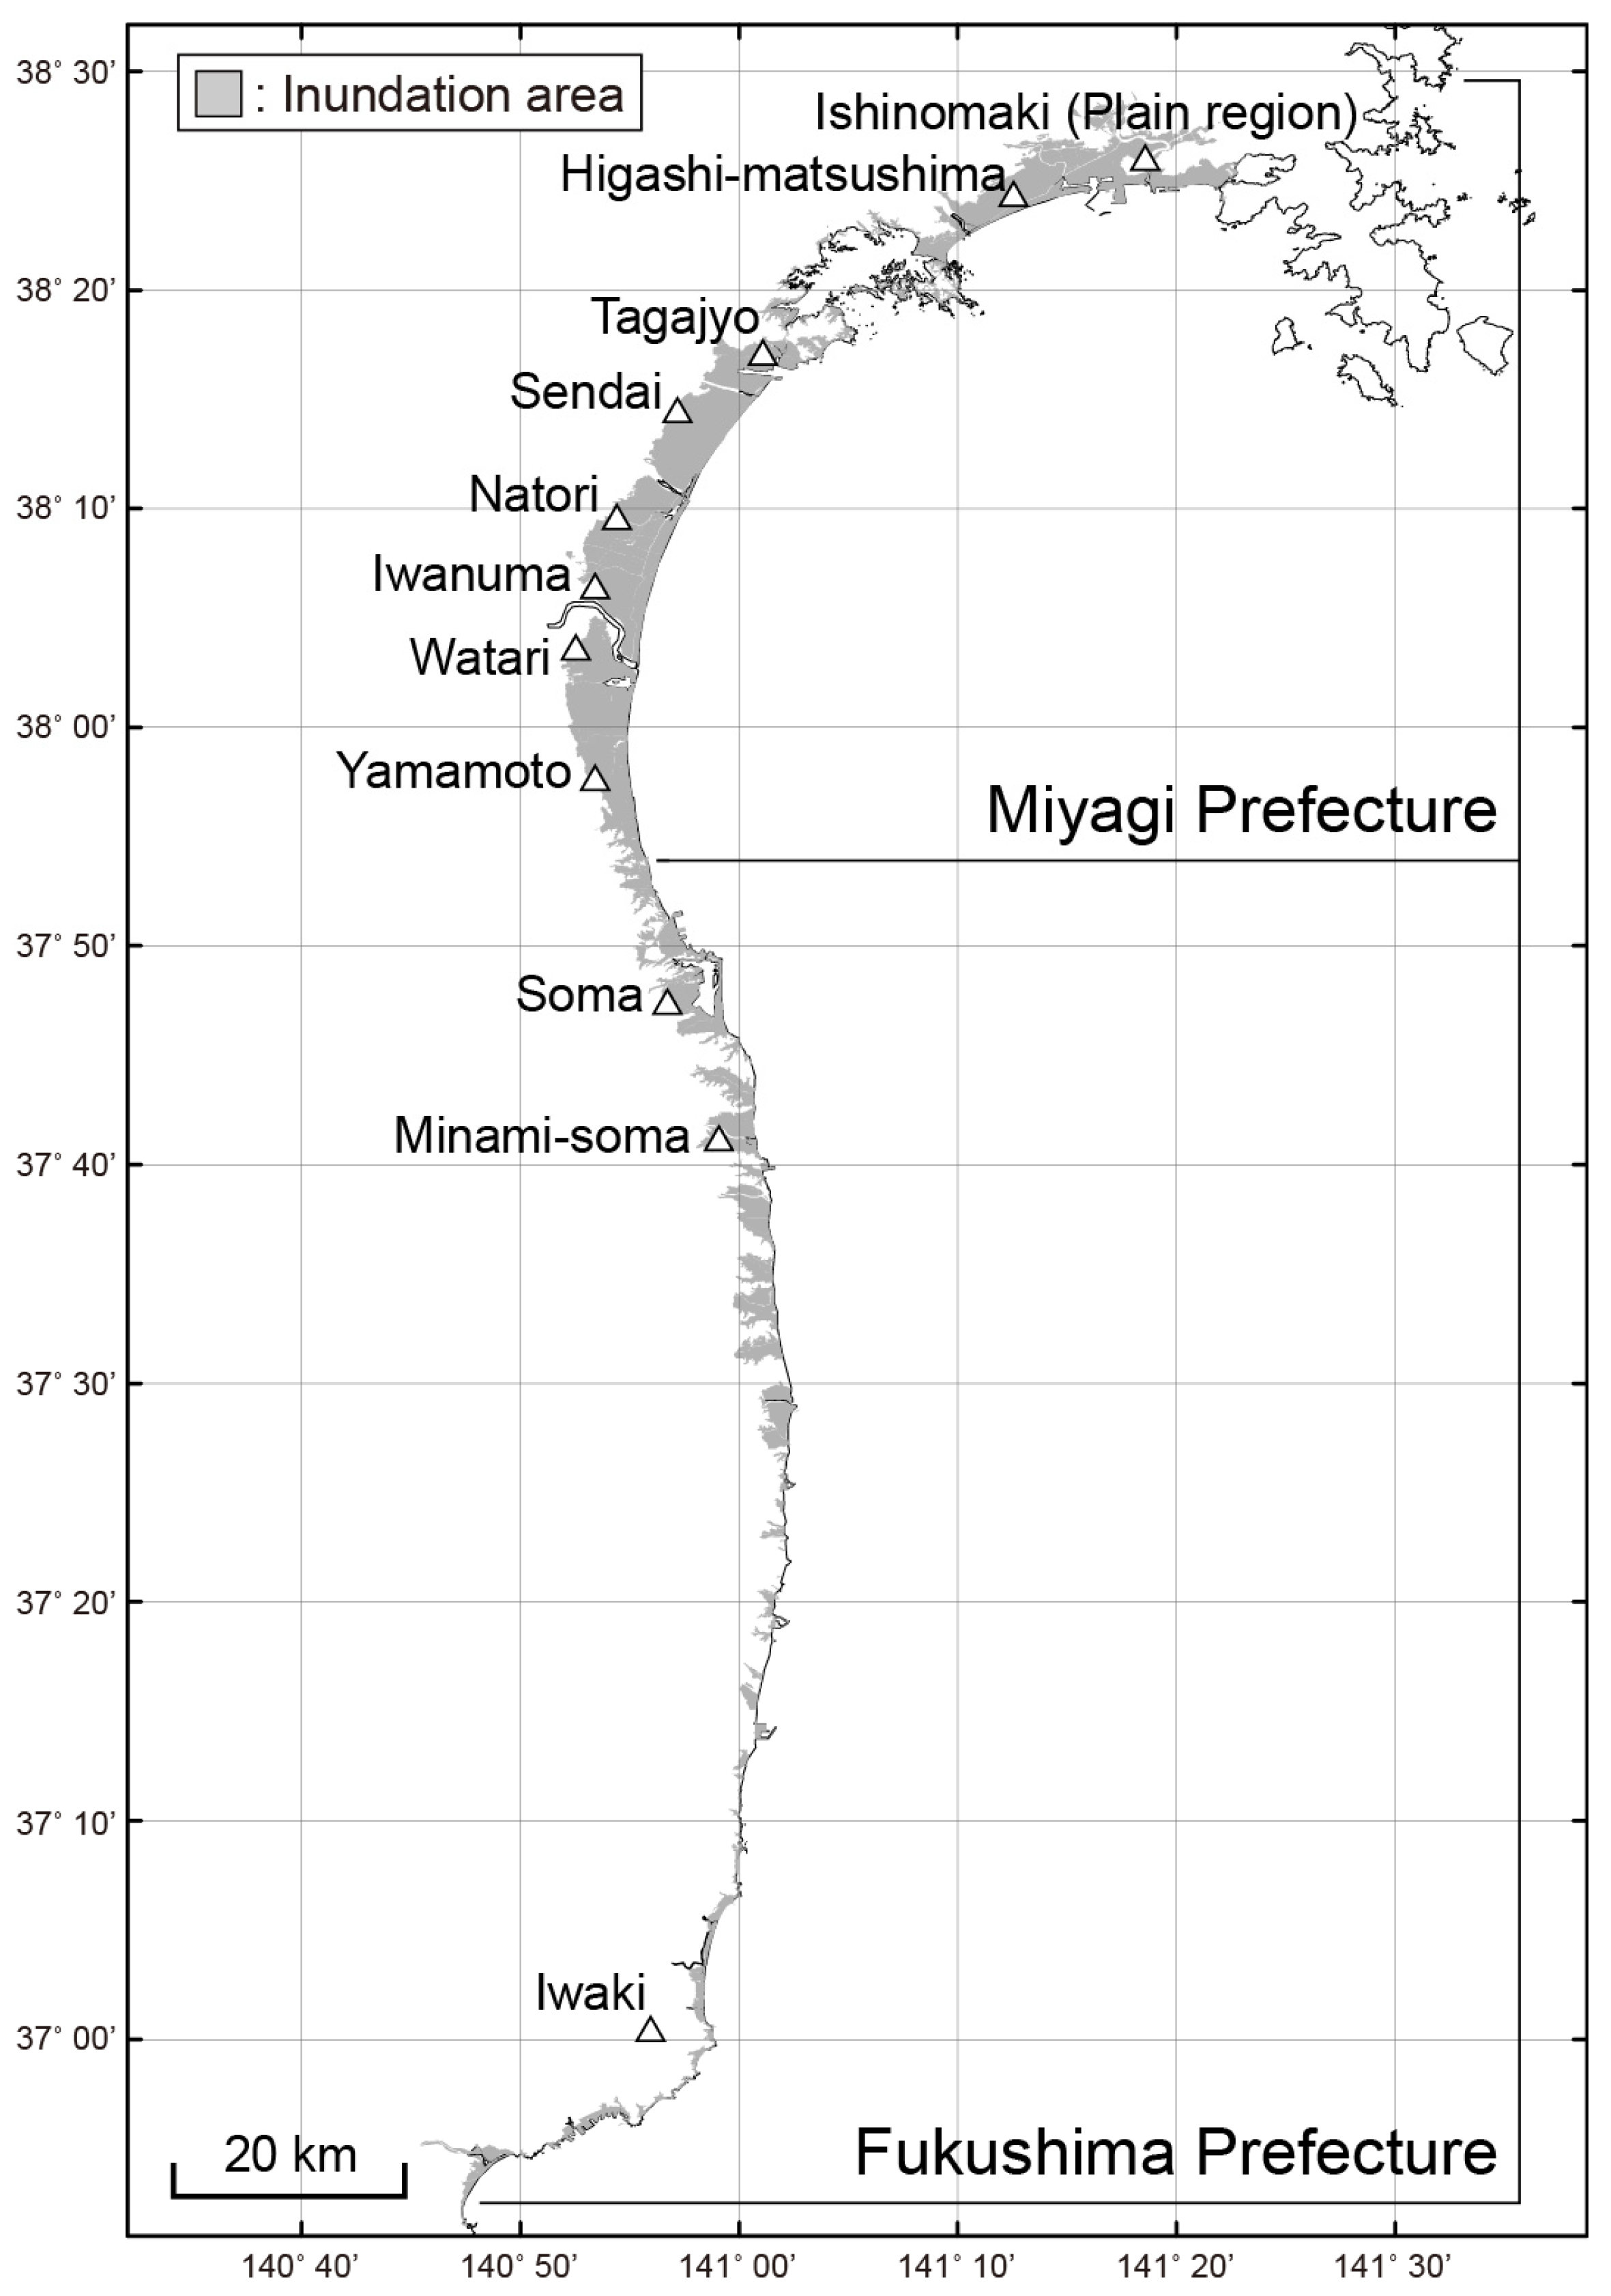
In this study, we used data of building damage caused by the 2011 Tohoku earthquake tsunami from cities on the Sendai plain and other coastal plain areas struck by the tsunami to construct the tsunami-induced building fragility function: Ishinomaki City (Ishinomaki Plain only), Higashi-matsushima City, Tagajo City, Sendai City, Natori City, Iwanuma City, Watari Town, Yamamoto Town in Miyagi Prefecture, and Soma City, Minami-soma City, and Iwaki City in Fukushima Prefecture (
Figure 10). Data used included the proportion of wooden buildings among the damaged structures and tsunami inundation depth.
In Equation (4), μ and σ depend on regional characteristics; therefore, we investigated the dependence of μ and σ on the proportion of robust buildings and the typical topographic slope in the analysis area. Here, reinforced concrete and steel buildings are defined as robust buildings, and Mr is defined as the proportion of robust buildings among all buildings in the inundation area. To determine the representative topographic slope, iF, the inundated area was divided into sections about 0.5–1 km long in the alongshore direction; then, in each section, the slope in the direction perpendicular to the shoreline was calculated, and the average slope in all sections was used as iF.
We examined the relationships between
Mr and the coefficients
μ and
σ, and between
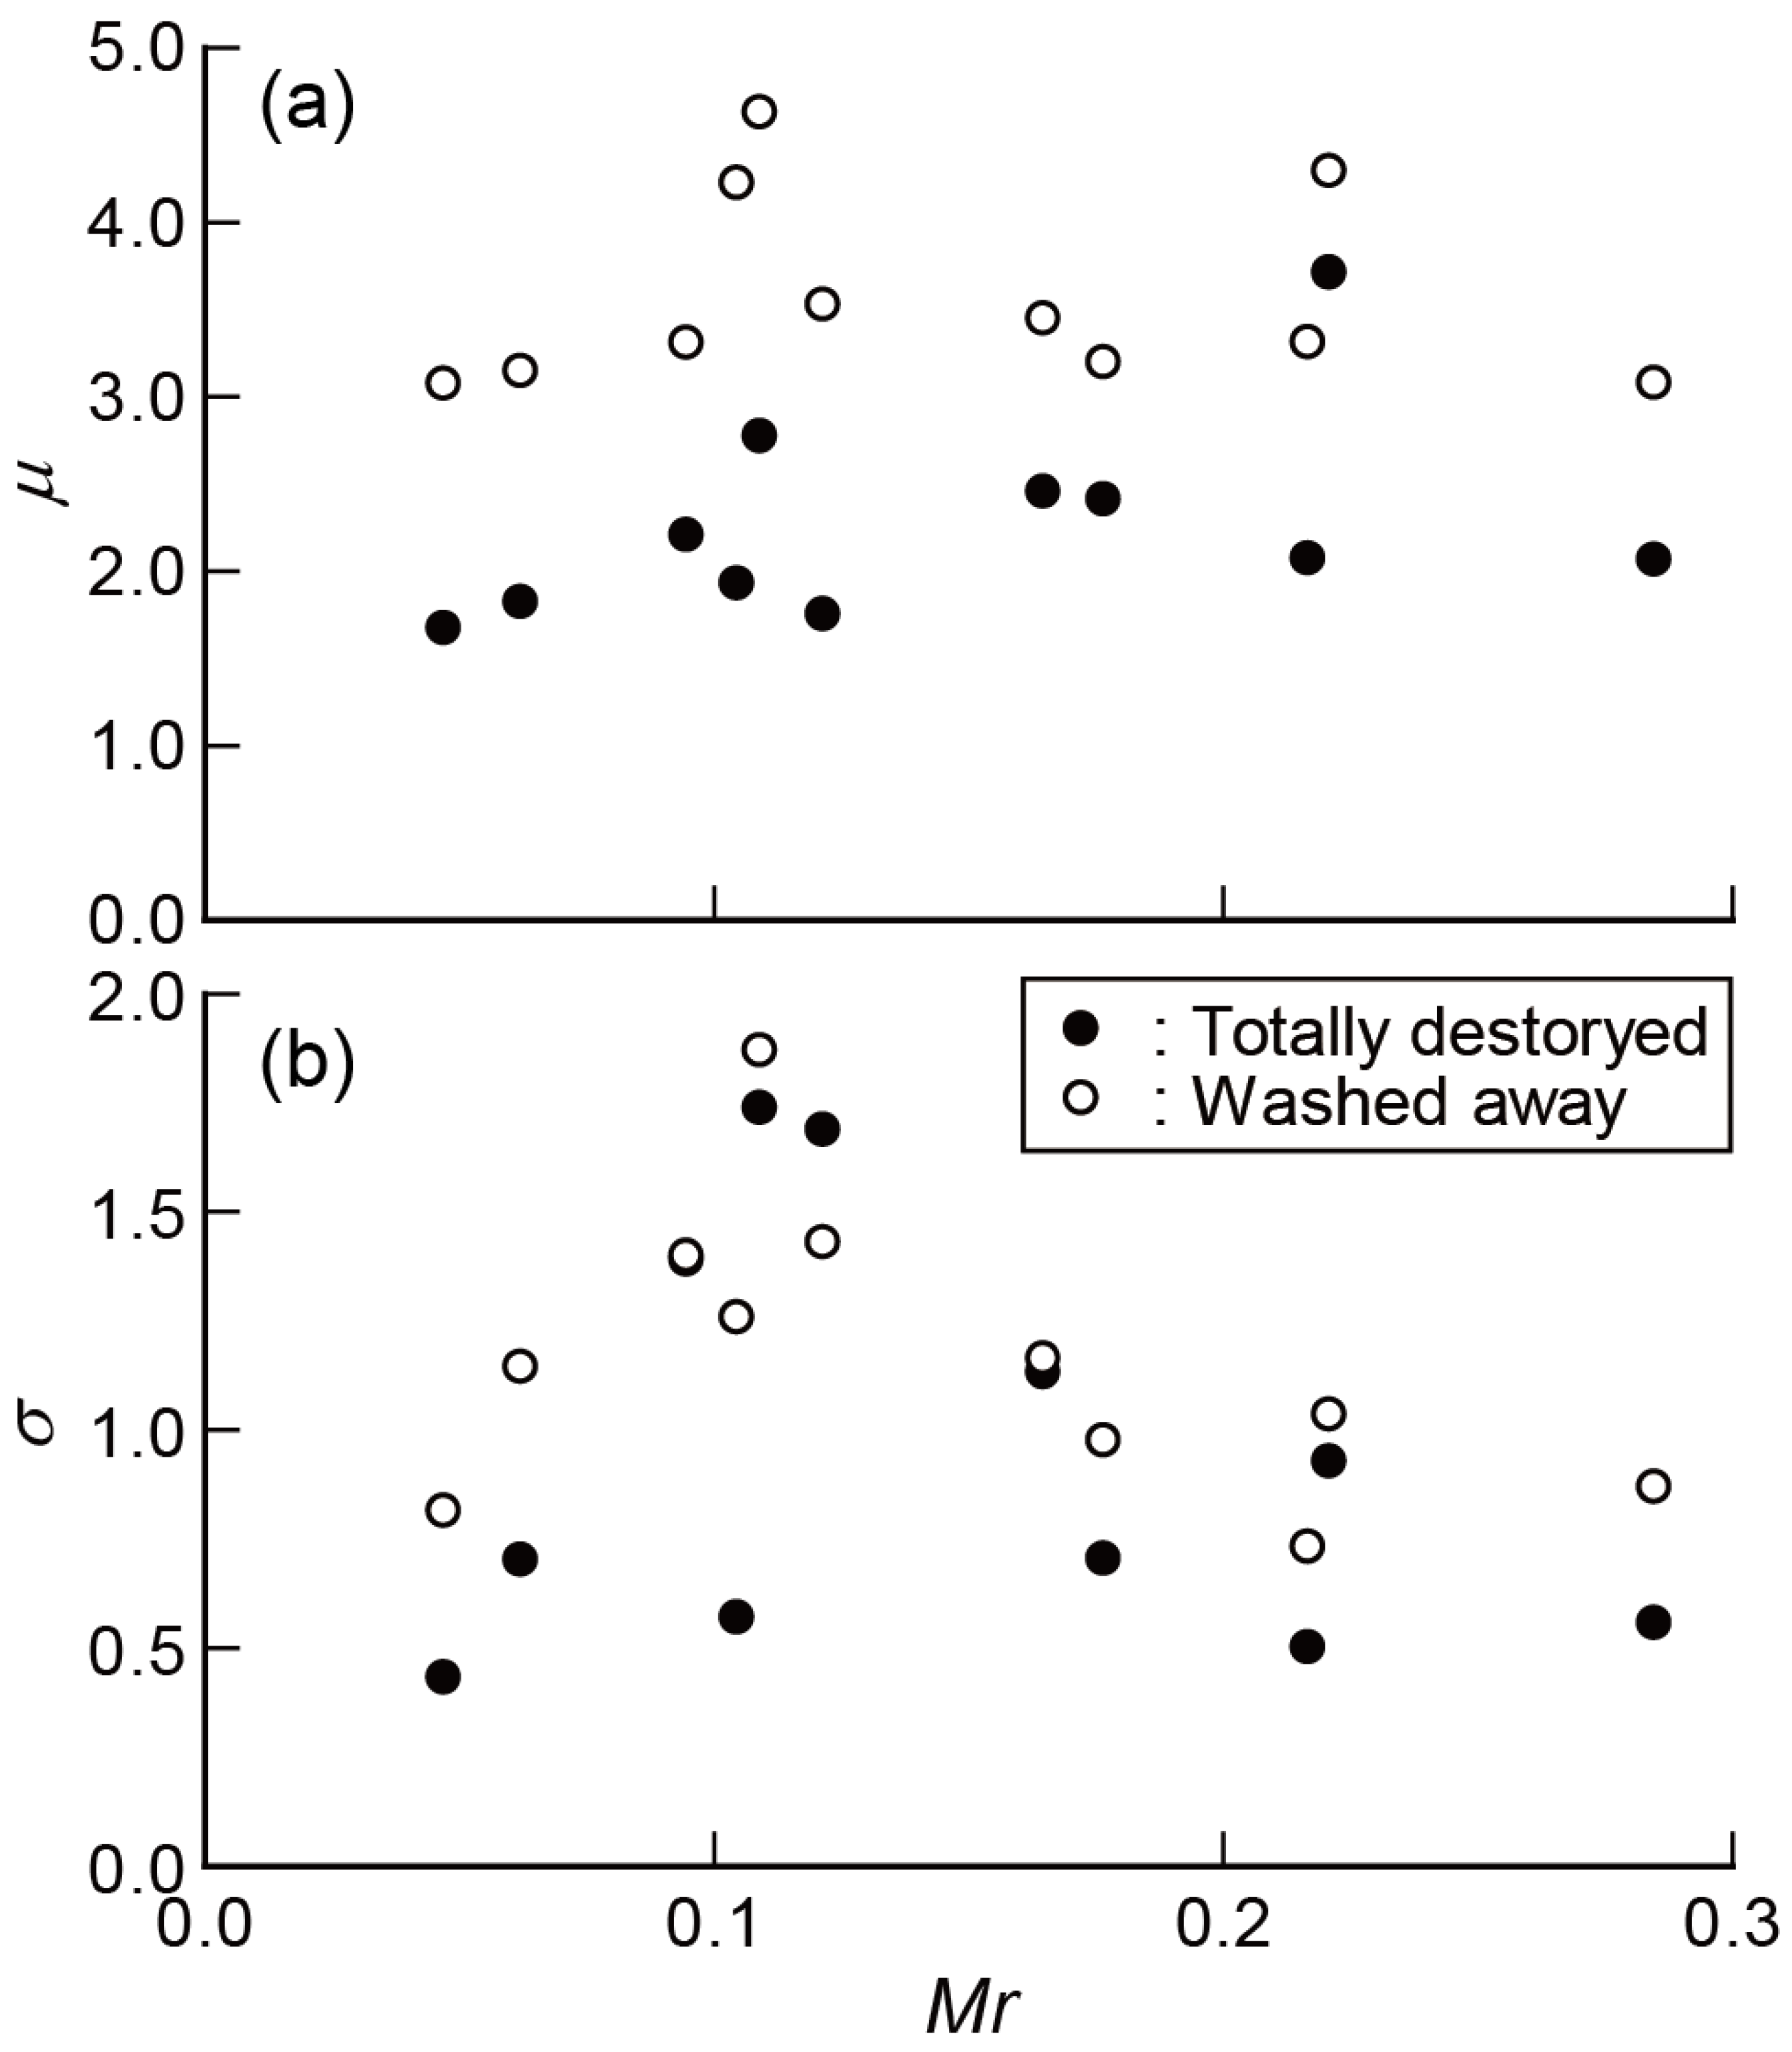
iF and the coefficients. We found no correlation between
μ and
Mr, but
σ tended to decrease as
Mr increased (
Figure 11). These trends were the same, regardless of whether
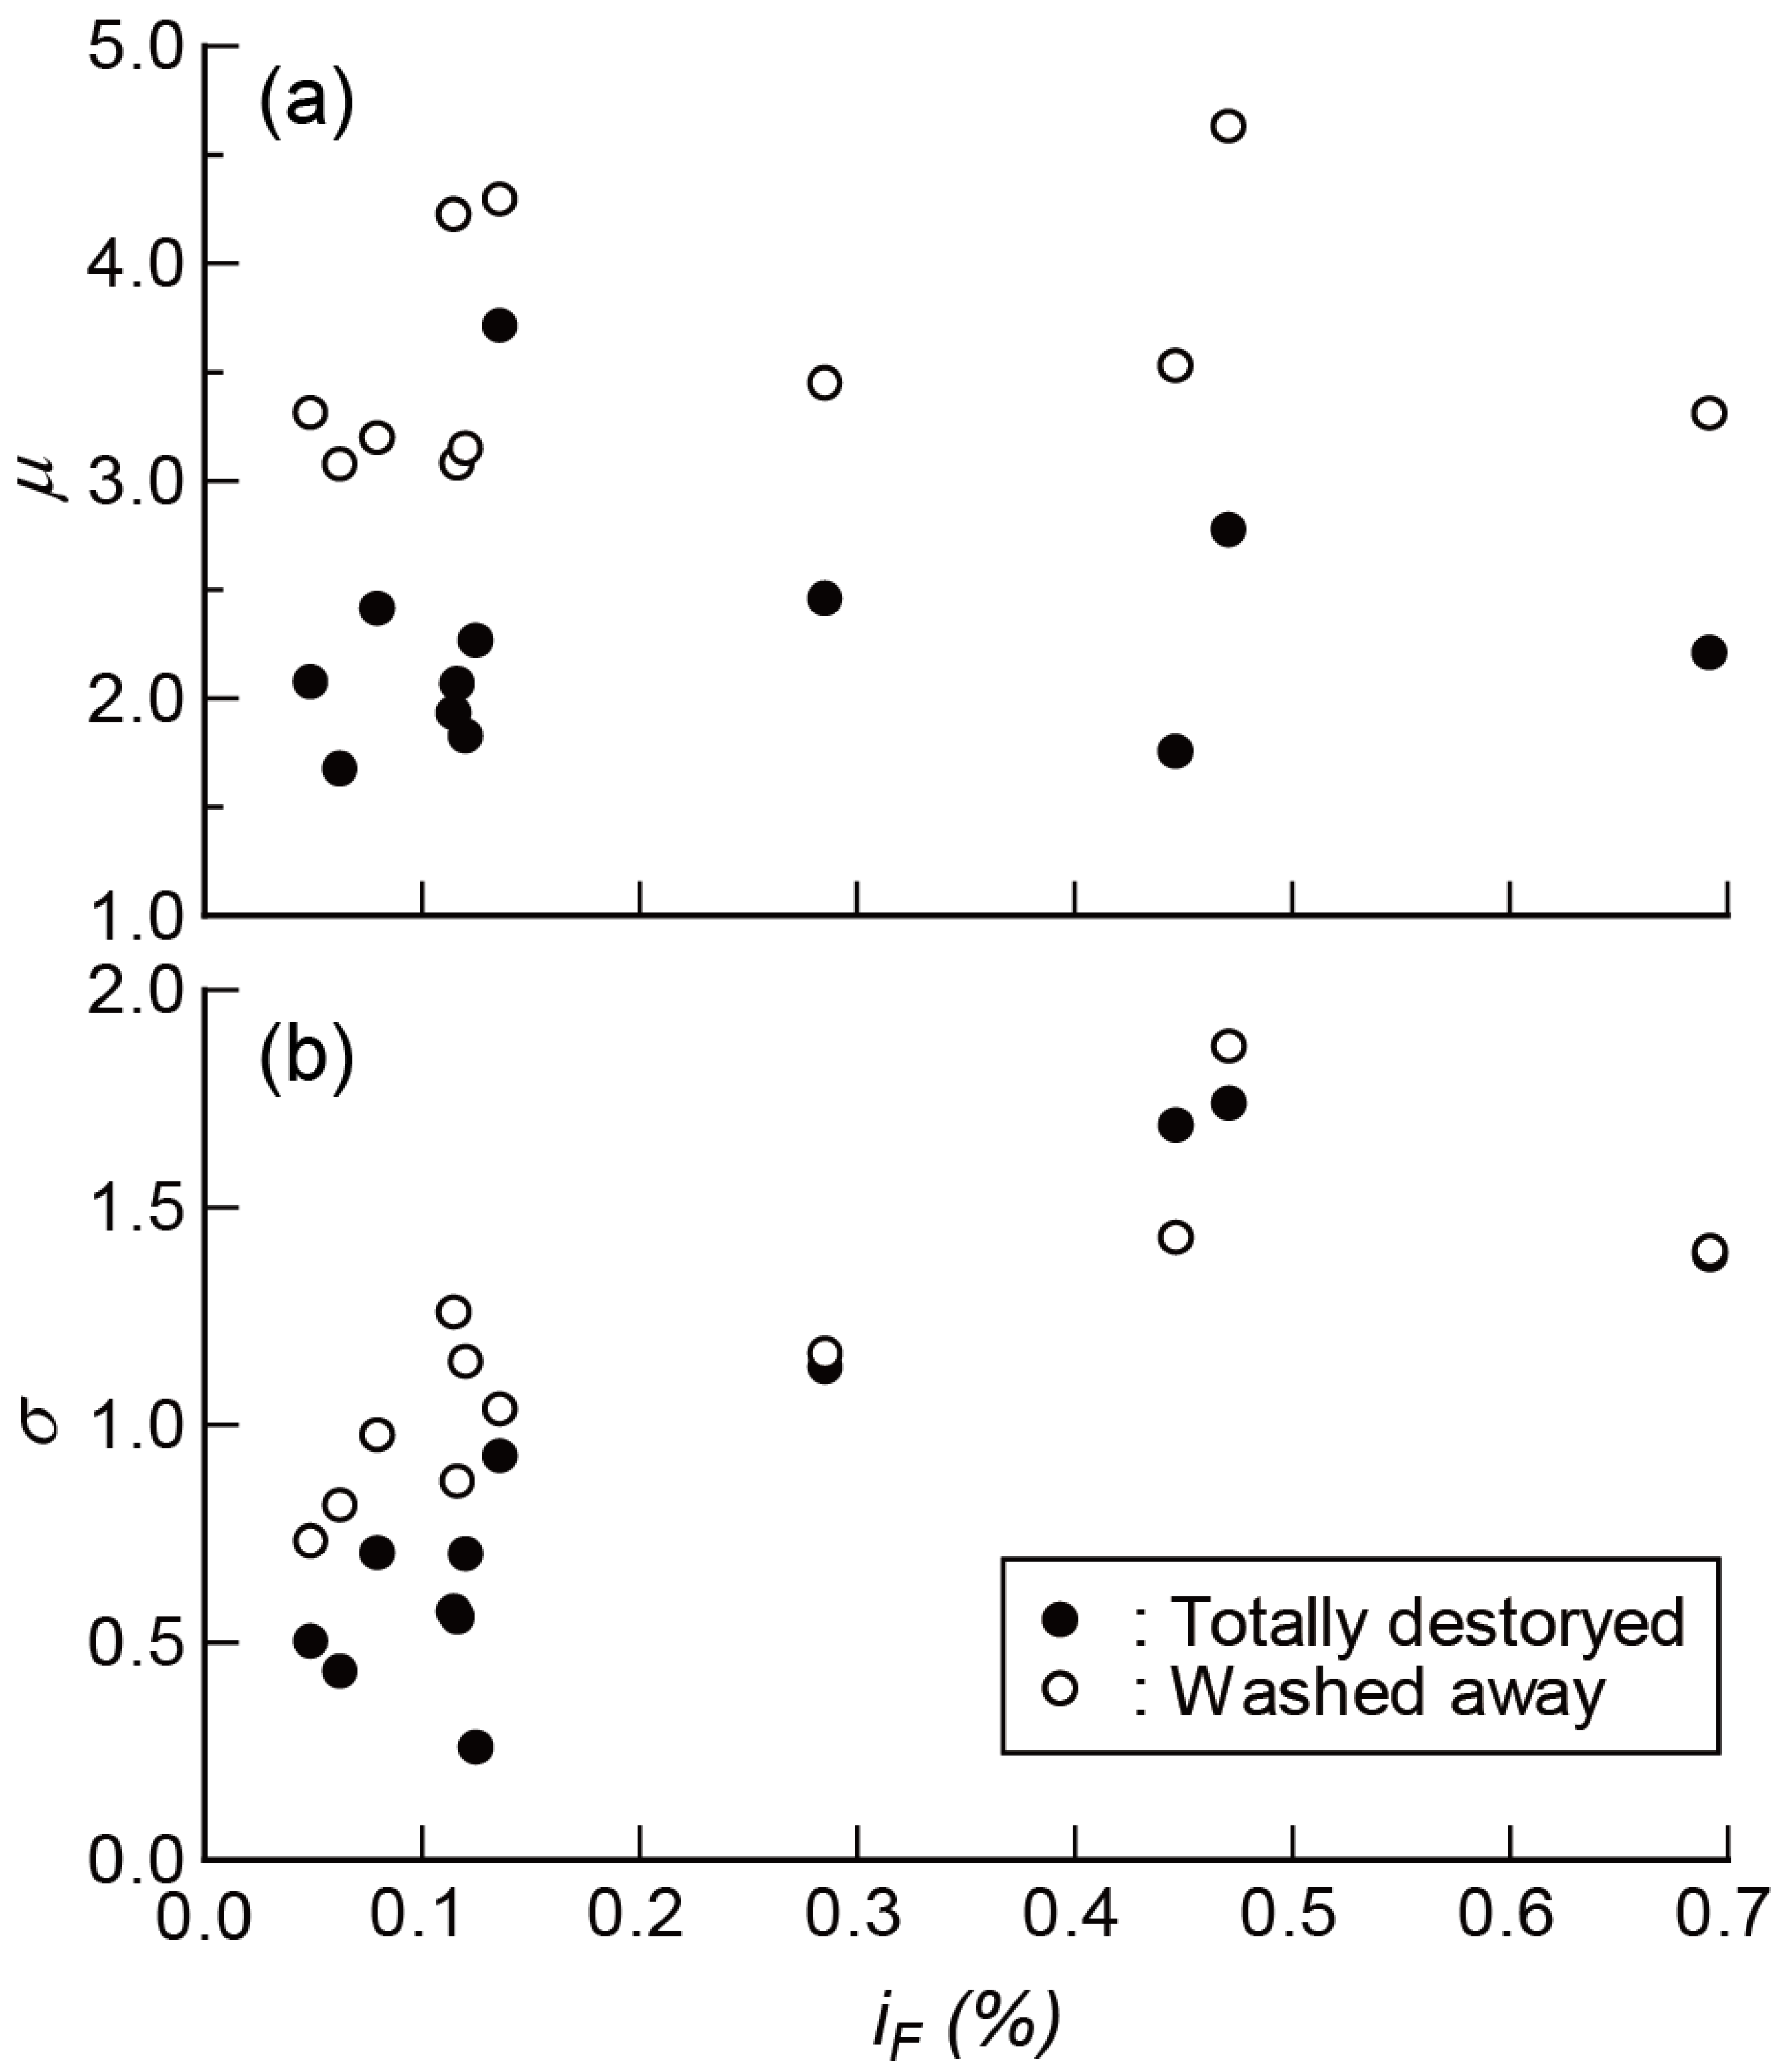
Mr represented buildings that had been totally destroyed or ones that had been washed away. We also found no correlation between
μ and
iF, although
σ tended to increase as the slope of the terrain increased (
Figure 12), whether the totally destroyed or the washed away buildings were considered. Therefore, because we could not confirm any dependence of
μ on
iF or
Mr within the coverage area of this study, we used a constant value for each damage type. In the case of totally destroyed buildings we used
μ = 2.26 ± 0.51 and we adopted
μ = 1.75 for safe-side evaluation. In considering those buildings that had been washed away, we used
μ = 3.57 ± 0.52 and adopted
μ = 3.05 for safe-side evaluation. These values of
μ can be used in the fragility function for prediction for general wooden buildings currently in Japan.
Because we found that
σ depended on
iF and
Mr, in the case of totally destroyed buildings, we used Equation (5) with the standard deviation of this approximation as ±0.2, as follows:
and in the case of washed away buildings, we used Equation (6) with the standard deviation of this approximation as ±0.2, as follows:
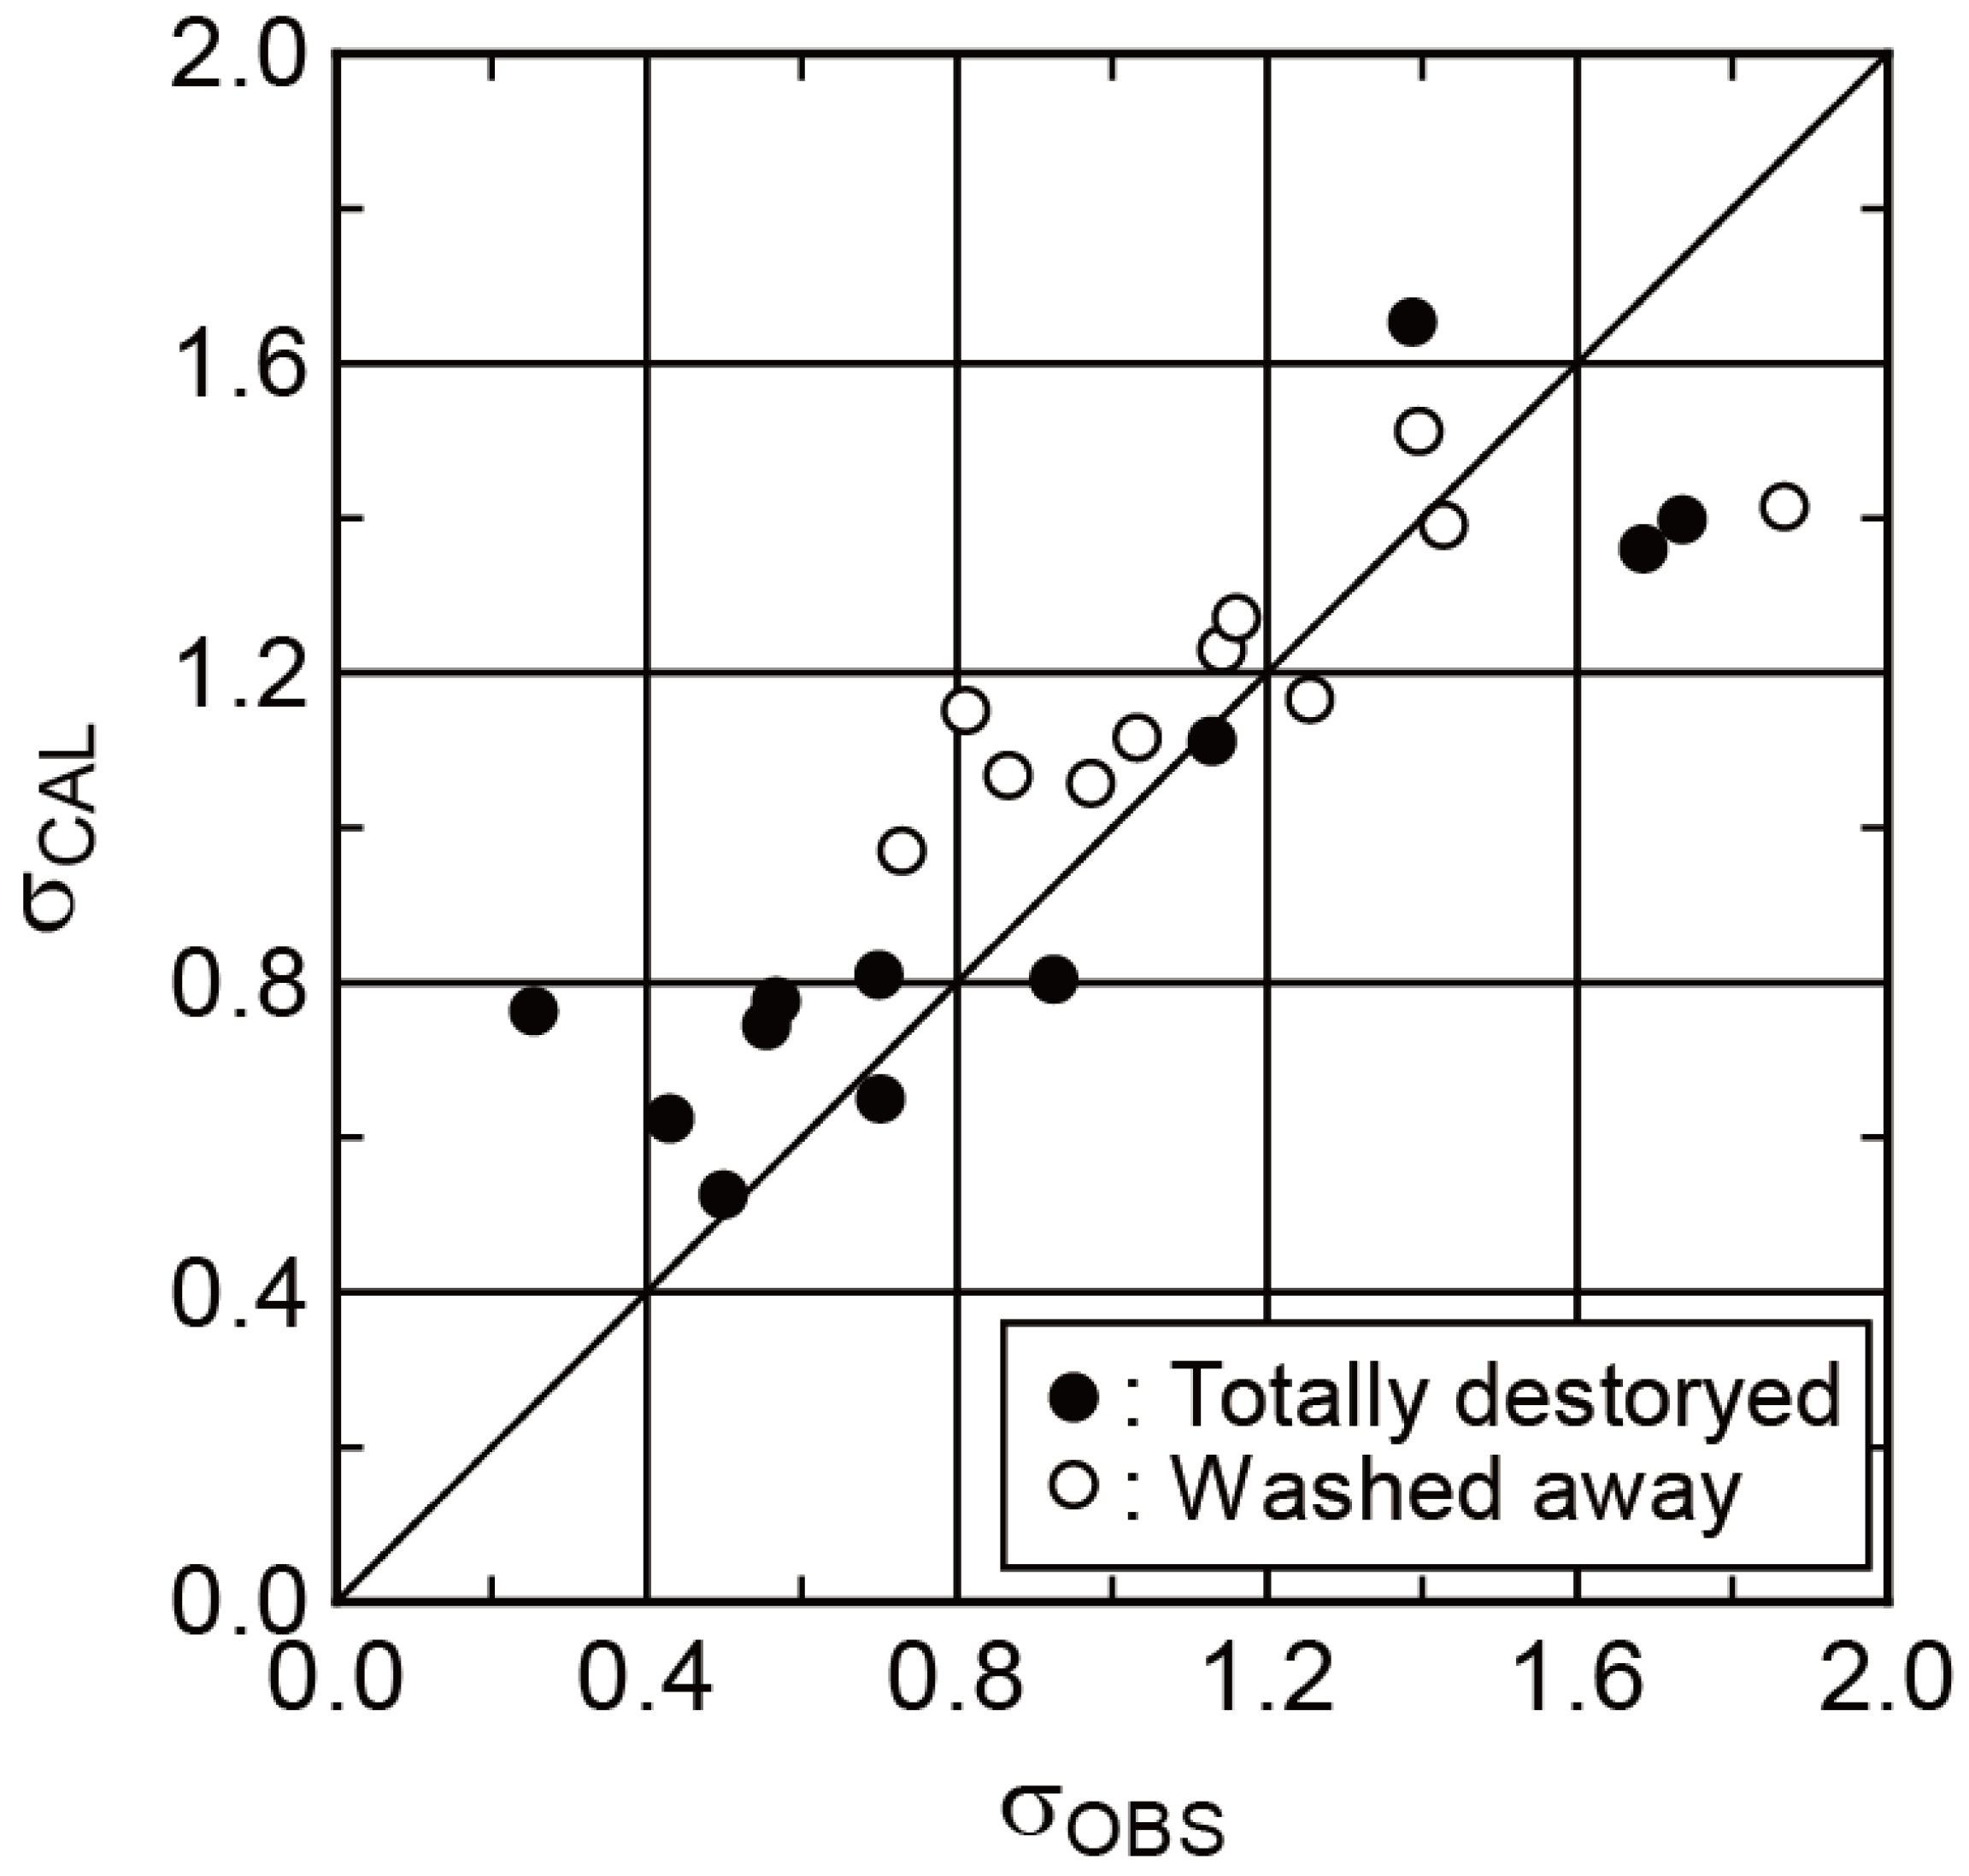
Comparison of observed and calculated values of
σ (
Figure 13) showed that they were generally consistent; the coefficient of determination
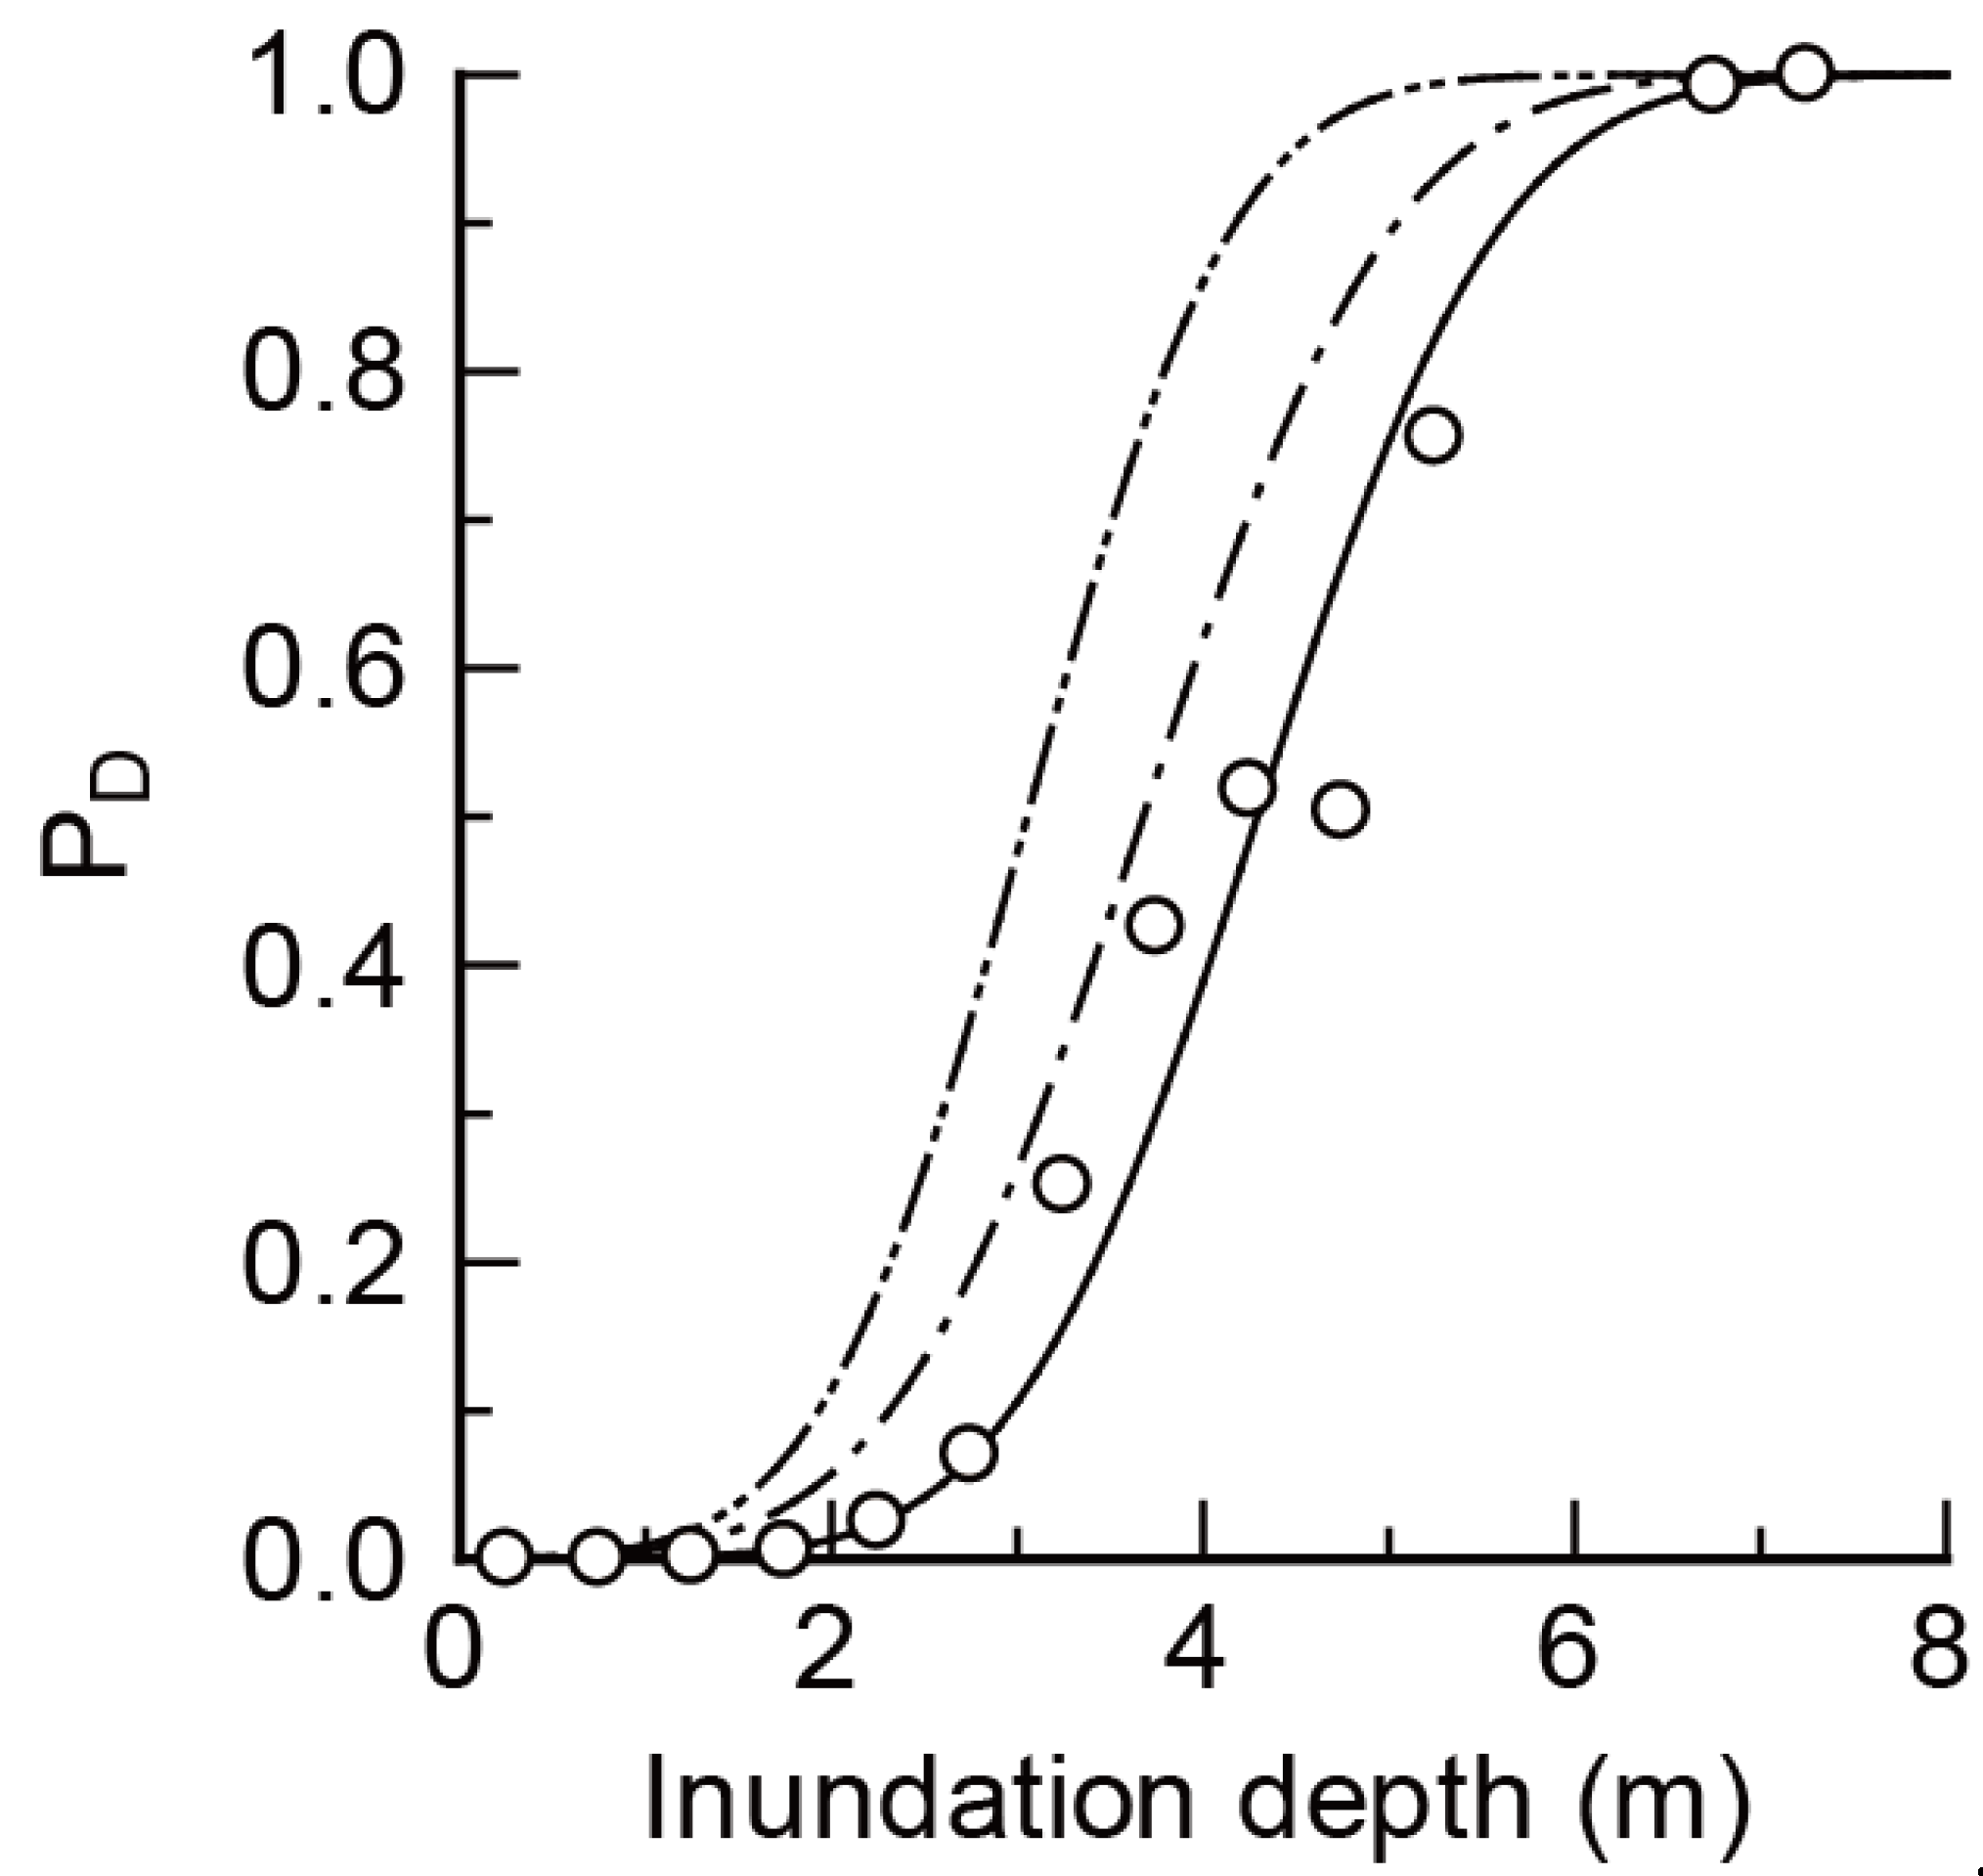
R2 was 0.78 in the case of totally destroyed buildings and 0.71 for washed away buildings. We also compared fragility functions for building loss, constructed using the values of
µ = 3.57 or 3.05 given above and Equation (6), with the fragility function fitted to observed damage (see
Figure 14 for an example). The result showed that the calculated function is on the safe side compared with the observation-based fragility function.
By using Equations (5) and (6), we can derive a damage function based on the characteristics of the typical terrain and a village in each region. However, since these equations are applicable to each village, local effects are not able to considered in these equations. There are two important issues that more need to be considered for suitable damage estimation for actual: the effect of tsunami diffusion due to robust building layout, and the evaluation of building destruction mode depending on tsunami flow velocity. Such a detailed study will require the use of estimation of damage using fluid forces, flow depth, and flow velocity (e.g., [
20]).
4. Application to Predictive Analytics
In this section, we describe the application of the developed evaluation method for tsunami debris accumulation to Owase City, Mie Prefecture, in central Japan, which has repeatedly suffered damage from huge tsunamis caused by past Nankai Trough earthquakes. The way in which the tsunami source scenario is determined affects tsunami damage predictions. Since the 2011 Tohoku tsunami, tsunami damage prediction has been based on either the disaster prevention level for a 100-year tsunami in the target area of the prediction, or the disaster mitigation level for the maximum possible tsunami according to the Japan Cabinet Office [
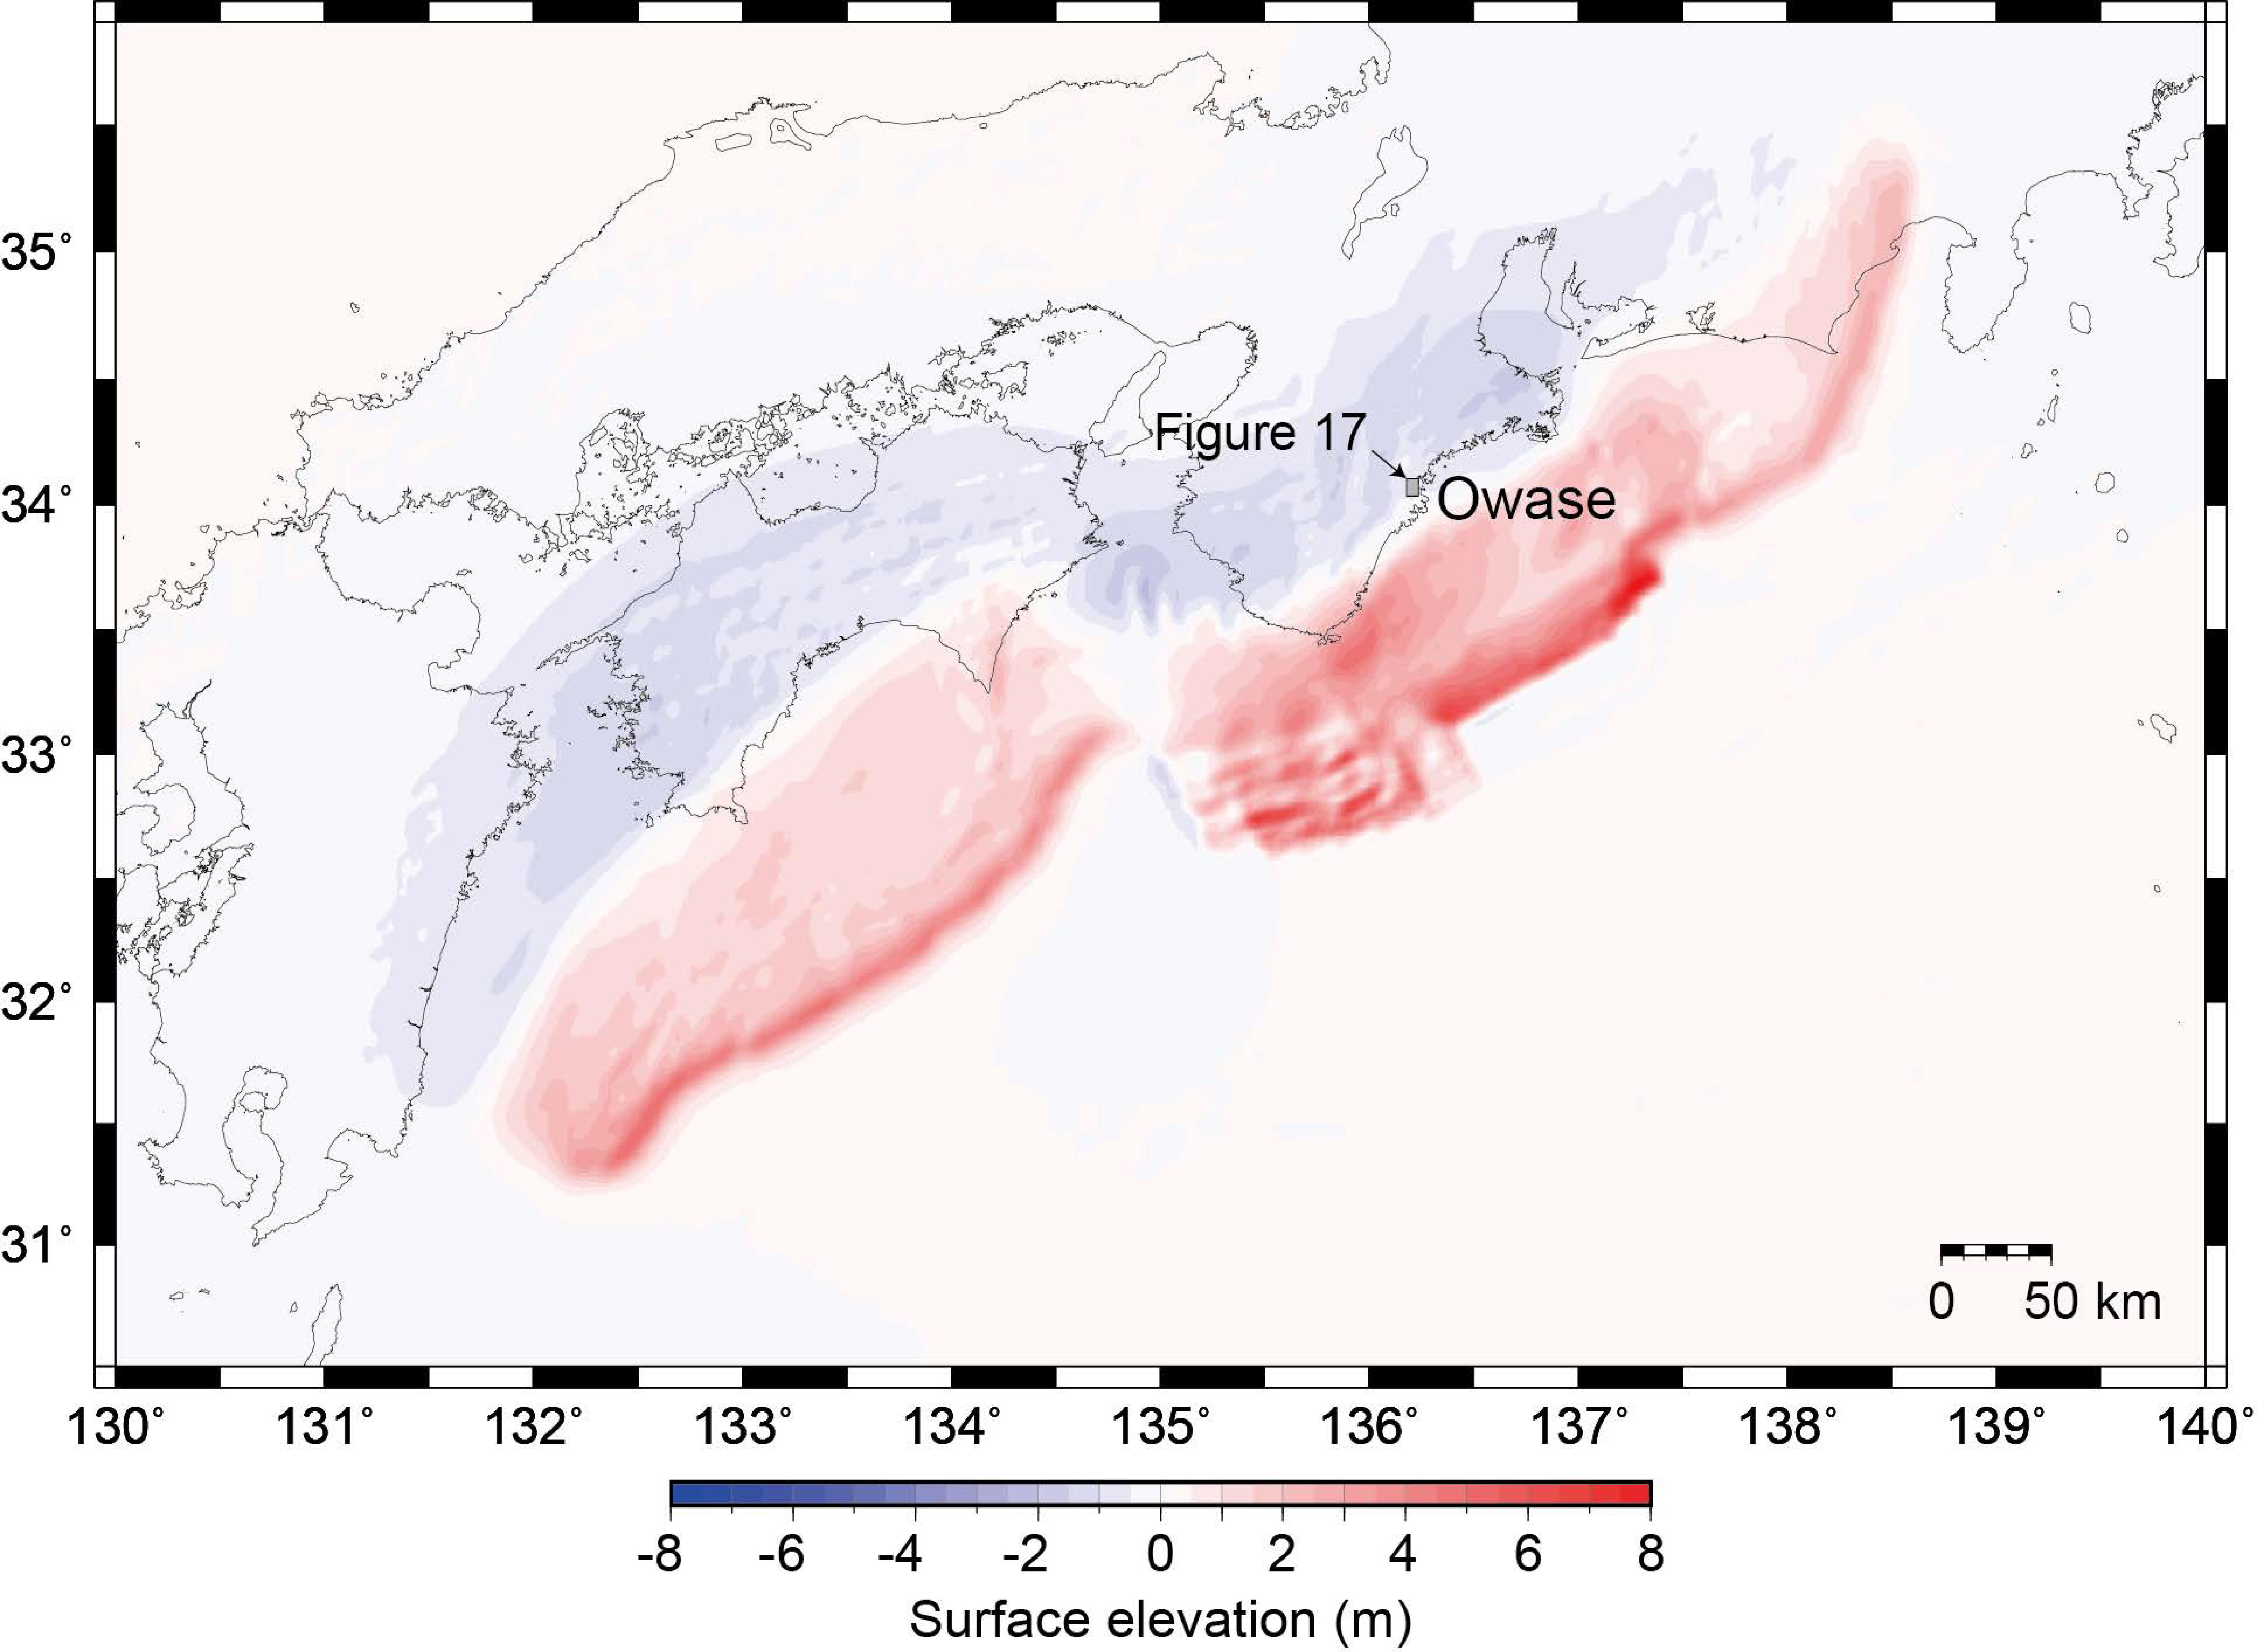
21]. Here, we used 11 earthquake source fault models (Cases 1 to 11) for Nankai Trough megathrust earthquakes published by the Cabinet Office. Vertical displacement associated with one of these models (Case 7) is shown in
Figure 15.
To calculate tsunami propagation, we used the JAGURS tsunami analysis code [
22], based on the nonlinear long wave equation, as the governing equation. The spatial grid spacing including the tsunami source was changed stepwise from 810 m to 270, 90, 30, and 10 m for a high-resolution bathymetric model. The computation time step was set to 0.1 s to satisfy Courant–Friedrichs–Levy conditions in each region. In the part of the damage prediction area, we used a grid spacing of 10 m.
To predict debris accumulation in Owase City, the amount of debris generated must first be estimated. For this estimation, we calculated the maximum inundation depth using the conventional tsunami inundation computation method, and we used Equations (4) and (6) to calculate the damage rate of wooden buildings, because we assumed that only buildings that were completely damaged or washed away would be reduced to debris. Although earthquake strong motions also produce debris from totally collapsed buildings, that effect was not included in the calculation. The amount of combustible debris in each wooden building was calculated by a method proposed by MLIT [
23], which separates combustible from noncombustible components of wooden buildings and from other components, such as fixtures and furniture. The state of woody combustible materials turned into debris by a tsunami was calculated by the method proposed in [
24]. In estimating the total debris volume by these methods, we assumed that 50% would remain on the land, as estimated for the 2011 Tohoku-oki earthquake tsunami (
Table 1).
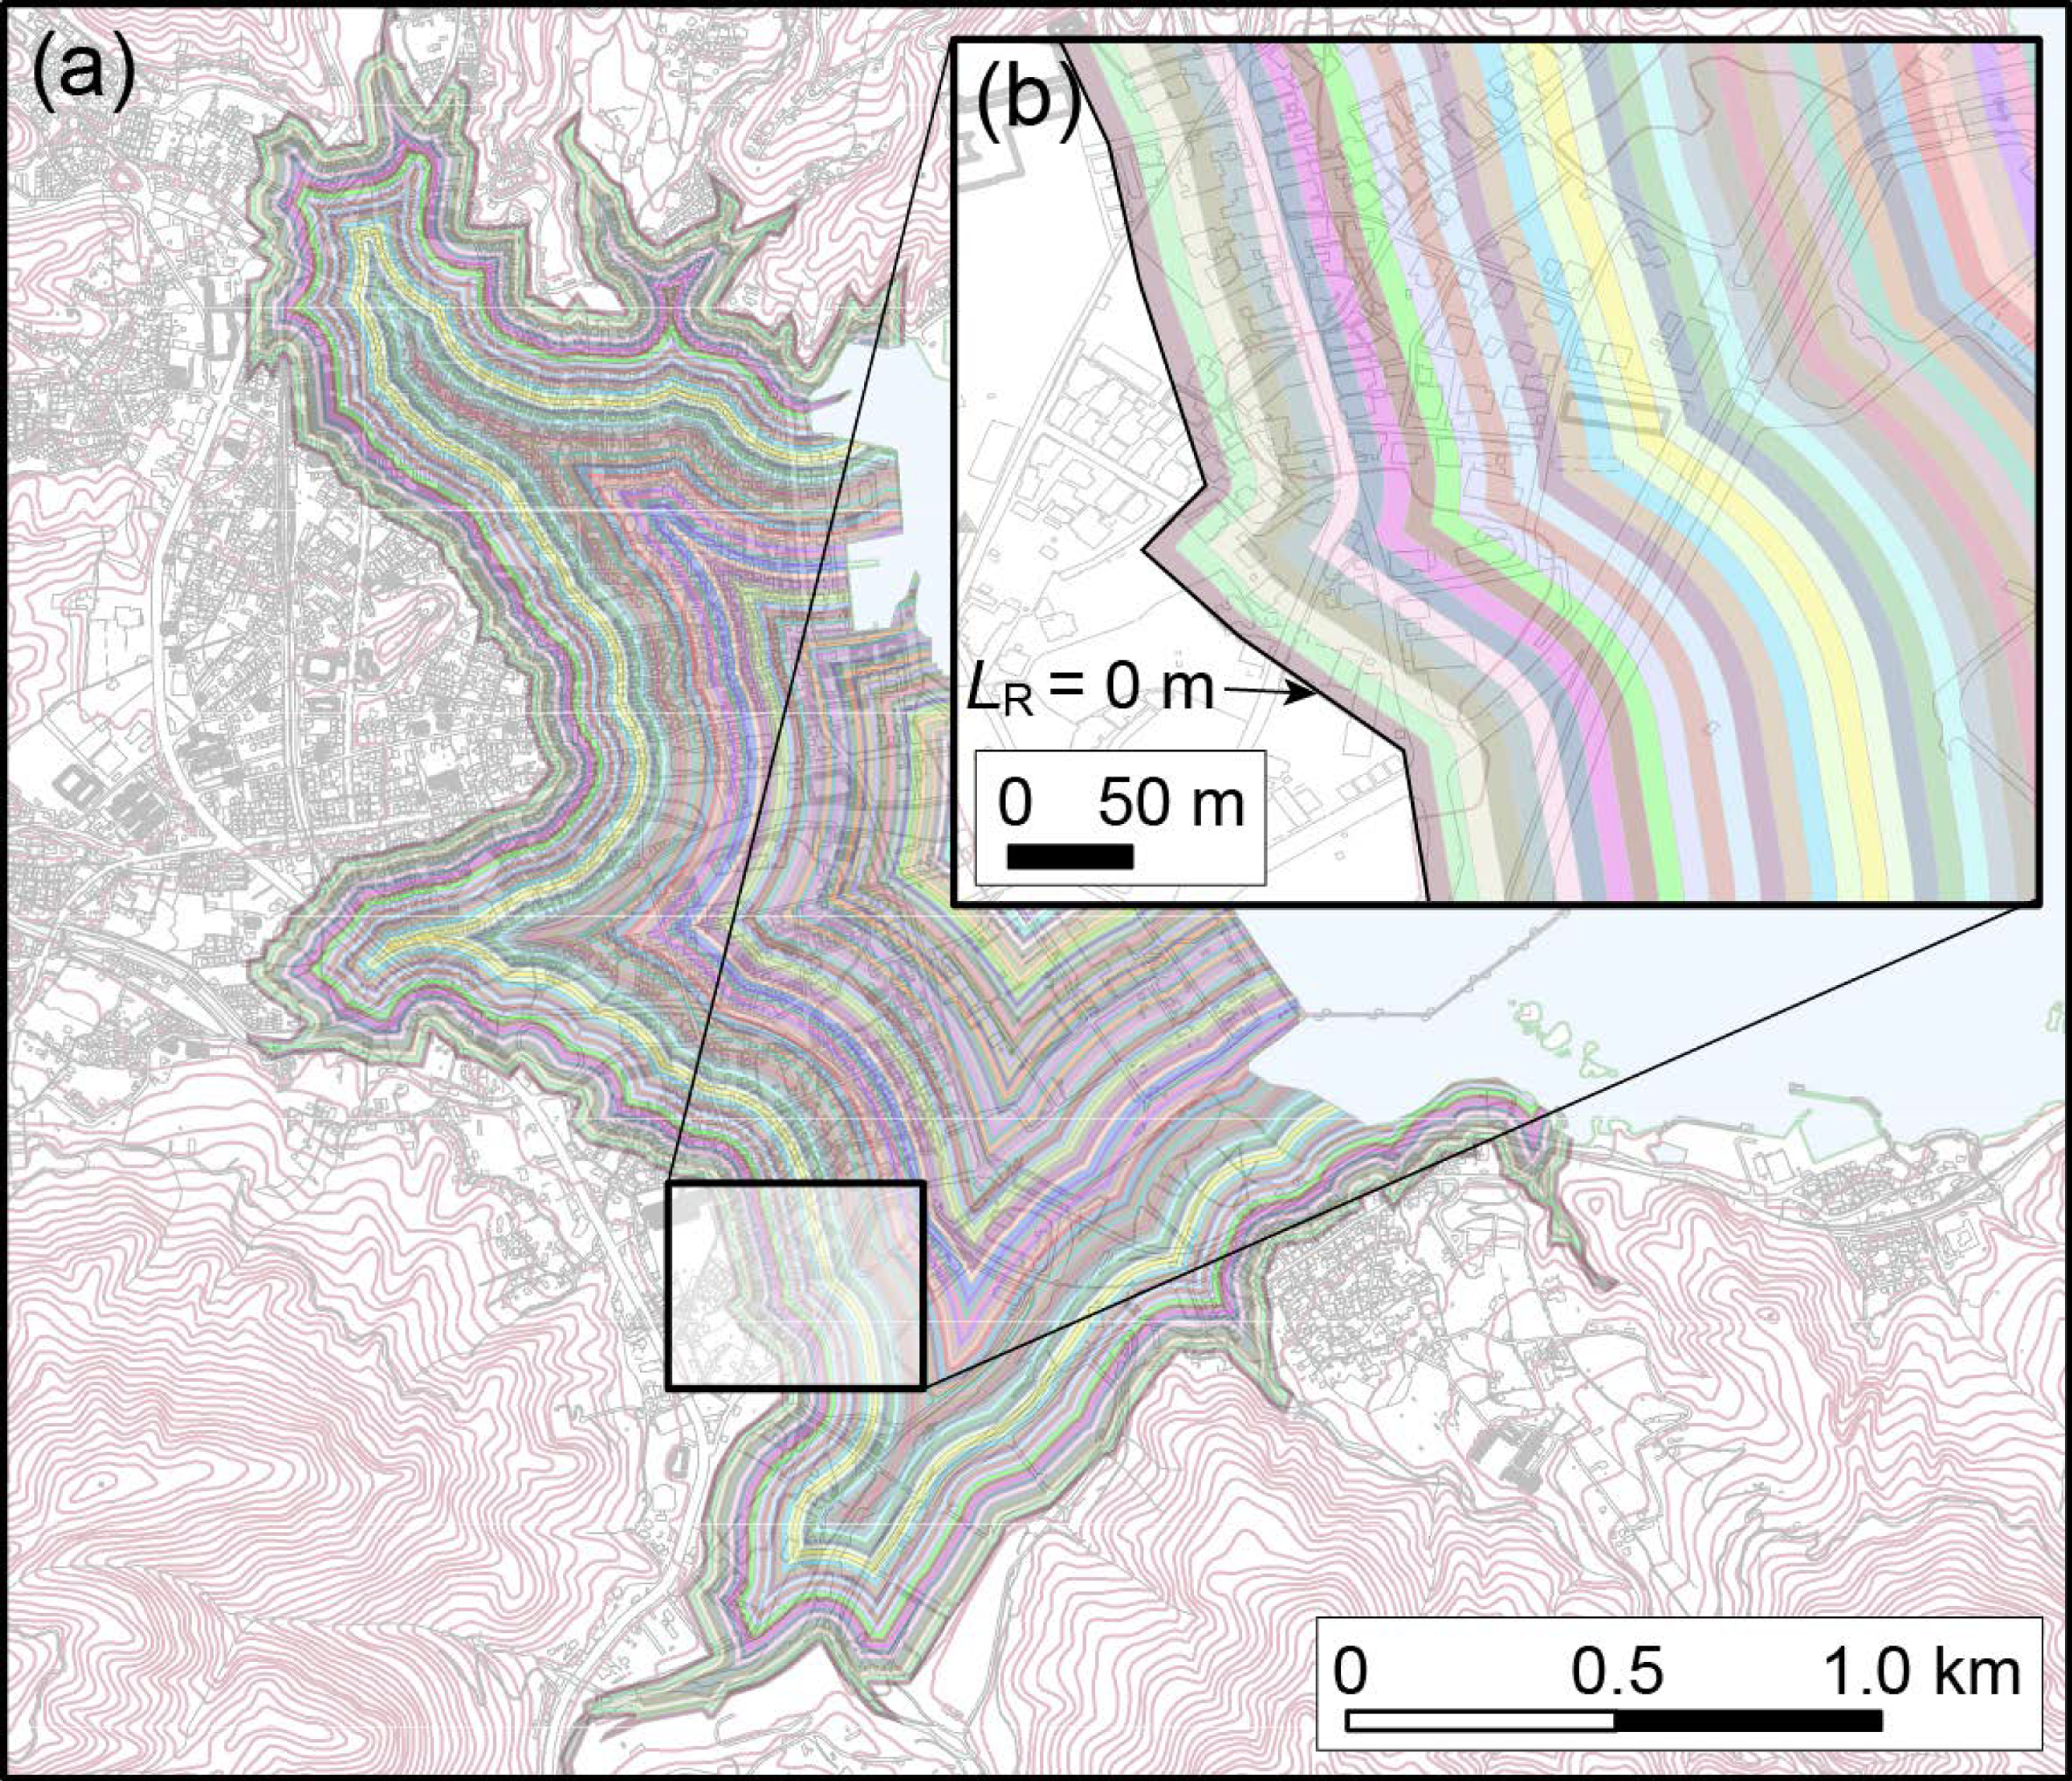
For the prediction of tsunami debris, we calculated
LR (
Figure 16) and
SI (
Figure 5) in the tsunami inundation area for each tsunami scenario. The range of parameters used for debris prediction in these 11 cases, according to the extent of the inundation area, as 0.5 <
AS < 0.8, 0 <
iM < 20, and 0 <
D* < 1.0, satisfied the applicable range of Equations (1)–(3). The probability of debris accumulation,
Pdb, and its thickness,
DT were evaluated by using Equations (1)–(3). Debris accumulation was defined by
Pdb > χ (χ of a uniform random number between 0 and 1). We conducted 100 debris evaluation trials and used the average as the representative prediction value for debris accumulation.
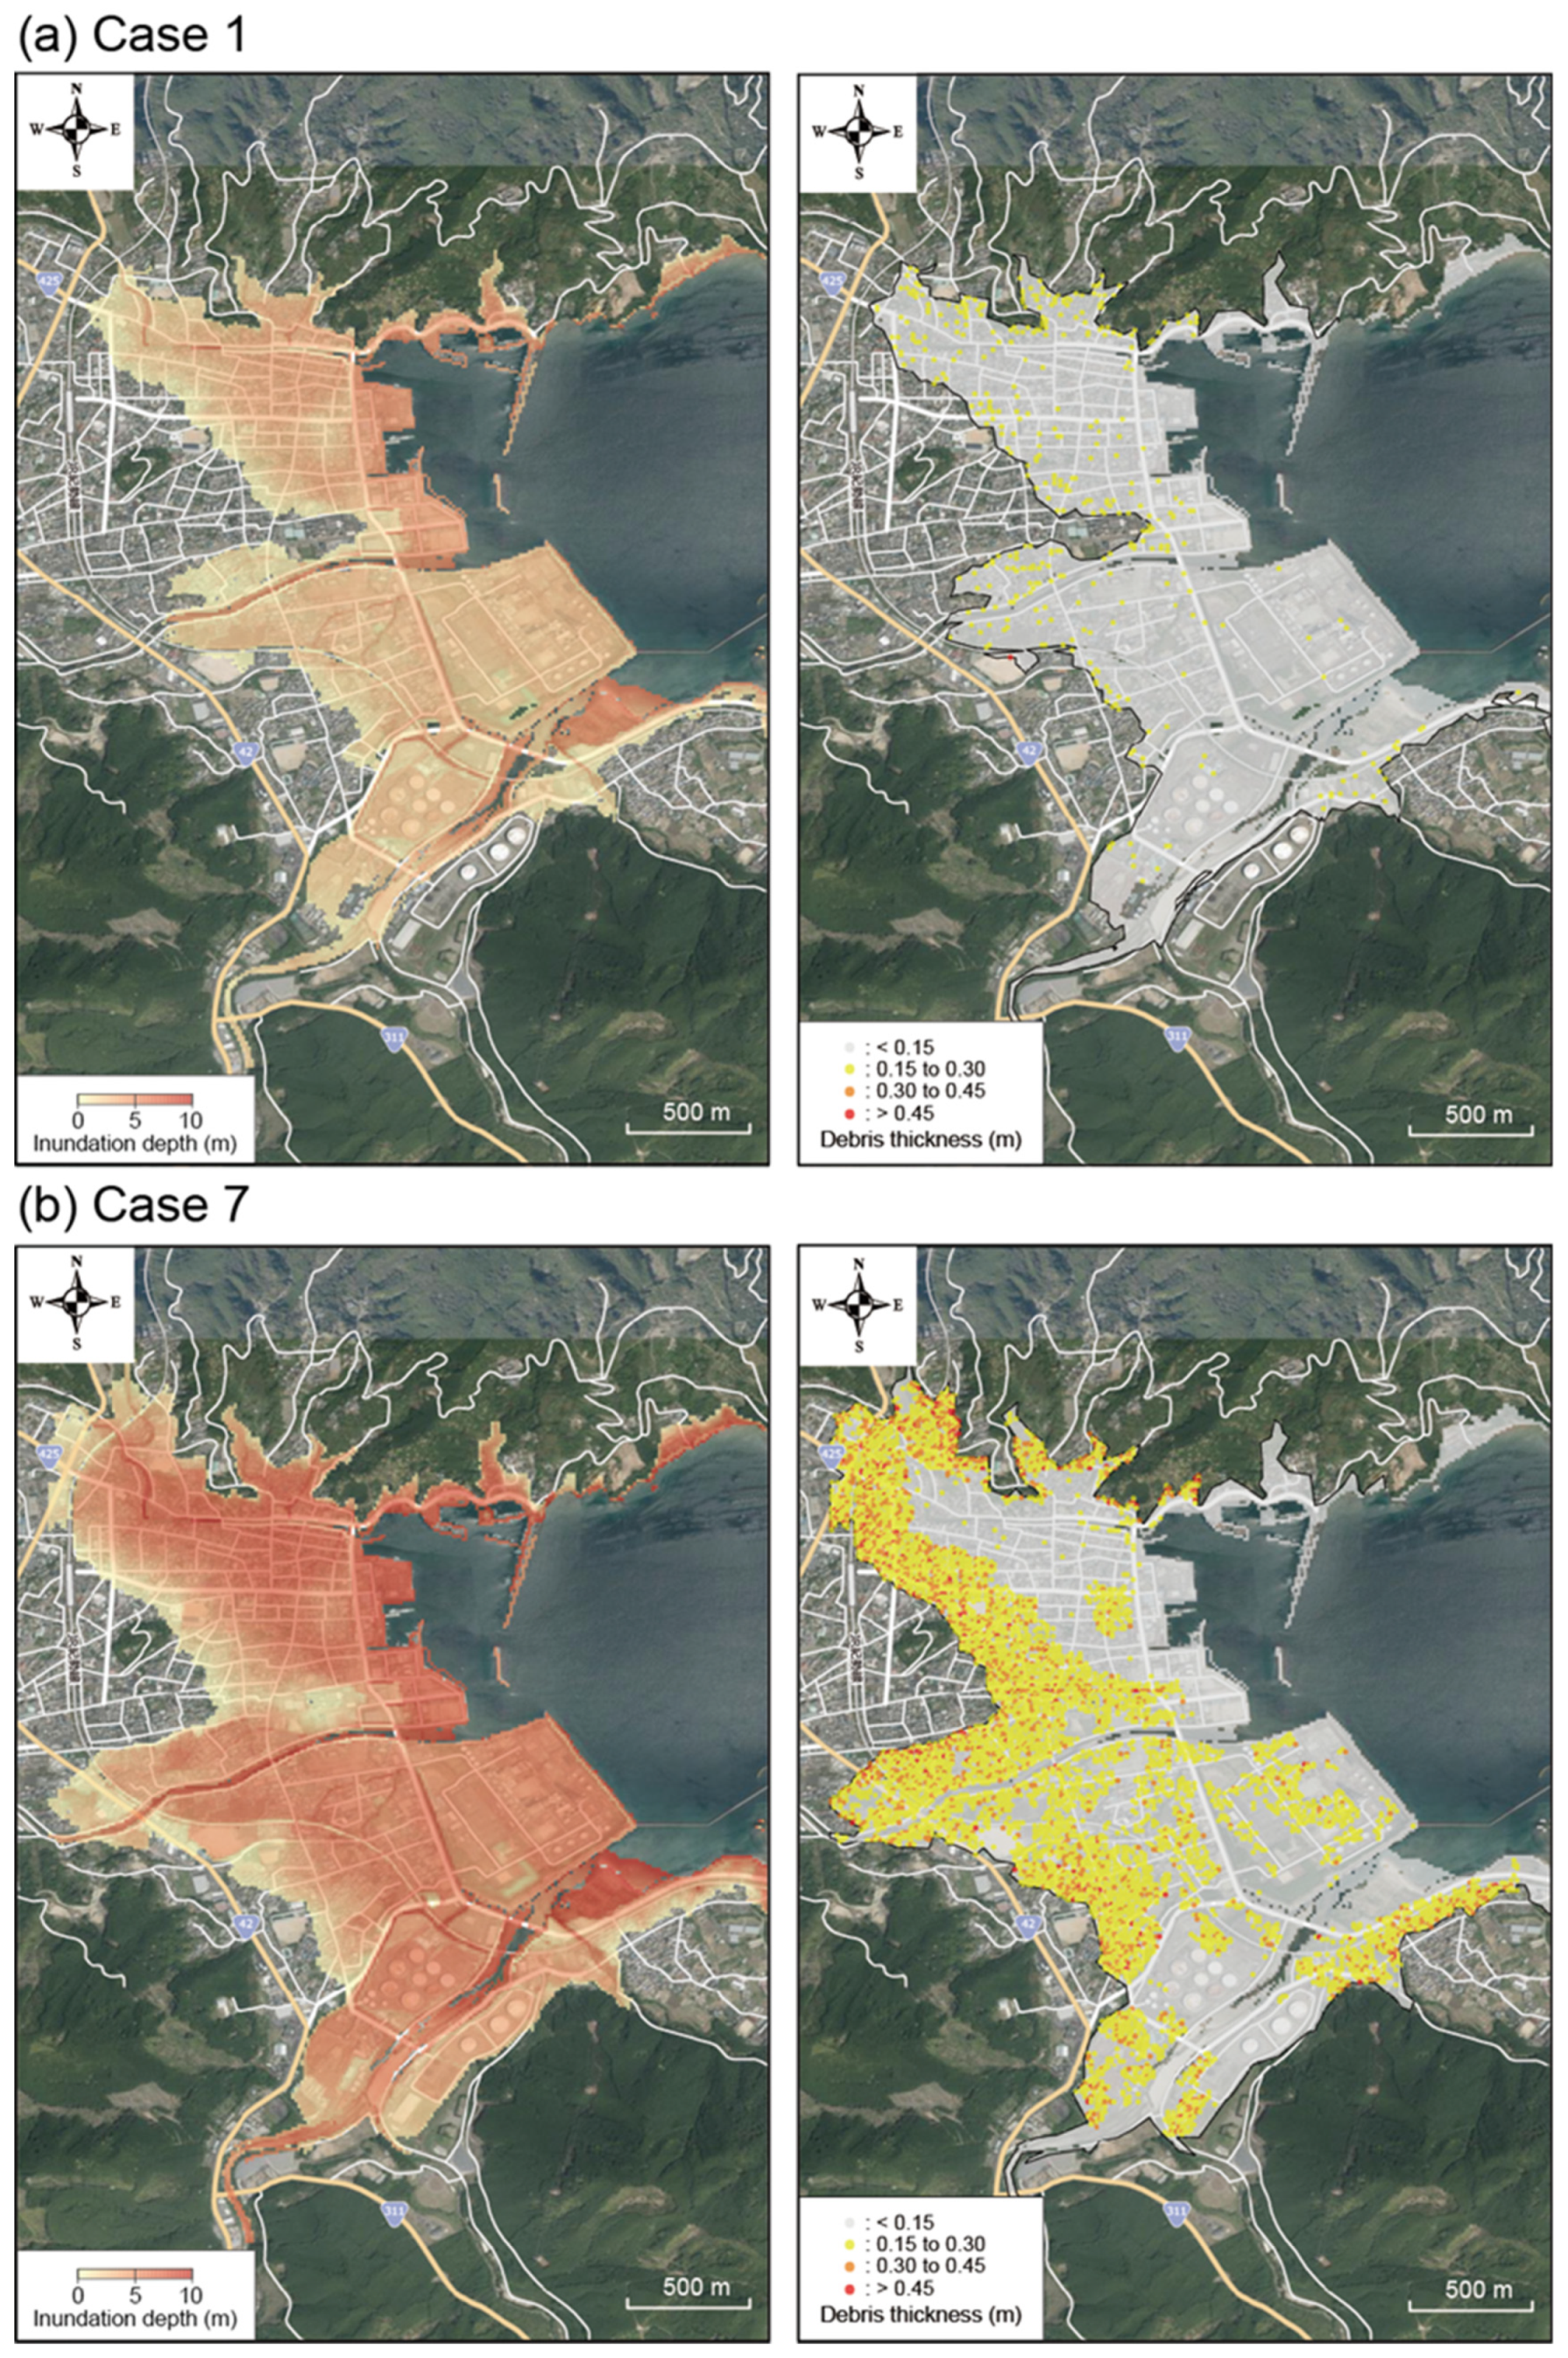
Figure 17 shows the tsunami inundation areas and distributions of debris accumulation thickness in Owase City for the Case 1 and Case 7 tsunami scenarios.
In Case 1, the inundation depth is about 5 m in the coastal area, and the run-up distance is about 1 km. Therefore, although the inundation area includes parts of Owase city, the inundation depth is limited to about 5 m and damage to buildings is therefore limited. Thus, only a small accumulation of debris is seen along inundation boundary. In contrast, in Case 7, the inundation depth reaches about 10 m in the coastal area, resulting in extensive damage to wooden buildings and, consequently, a large amount of woody debris. Most of the debris is accumulated along the inundation boundary. Most widely used tsunami hazard maps are based solely on inundation depth, and it is often supposed that areas near the inundation boundary, where the inundation depth is less, are safer than areas nearer to the coast. However, in the case of a huge tsunami with a height exceeding 10 m at the coast, the debris tends to accumulate along the inundation boundary. For instance, because the major arterial roads that connect the northern and southern parts of Mie Prefecture overlap near the Case 7 inundation boundary, debris accumulation there would likely hinder emergency responses. In urban areas near the inundation boundary, the risk of tsunami-related fires spreading in the accumulated debris should also be considered.
However, these debris accumulation models are empirical, so their adaptability to different regions needs to be studied further.
