
Behaviour of Compacted Filtered Iron Ore Tailings–Portland Cement Blends: New Brazilian Trend for Tailings Disposal by Stacking

 , , and
Abstract
1. Introduction
2. Background
3. Experimental Program
3.1. Materials
3.2. Methods
3.2.1. Moulding Portland Cement Stabilized Iron Ore Tailings (IOT) Specimens
3.2.2. Program of Unconfined Compression Tests
3.2.3. Program of Pulse Velocity Tests and Ultrasonic Elastic Constants
3.2.4. Program of Durability of Specimens Submitted to Wetting–drying Cycles
3.2.5. Program of Consolidated Isotropically Drained (CID) Triaxial Tests
4. Results and Analysis
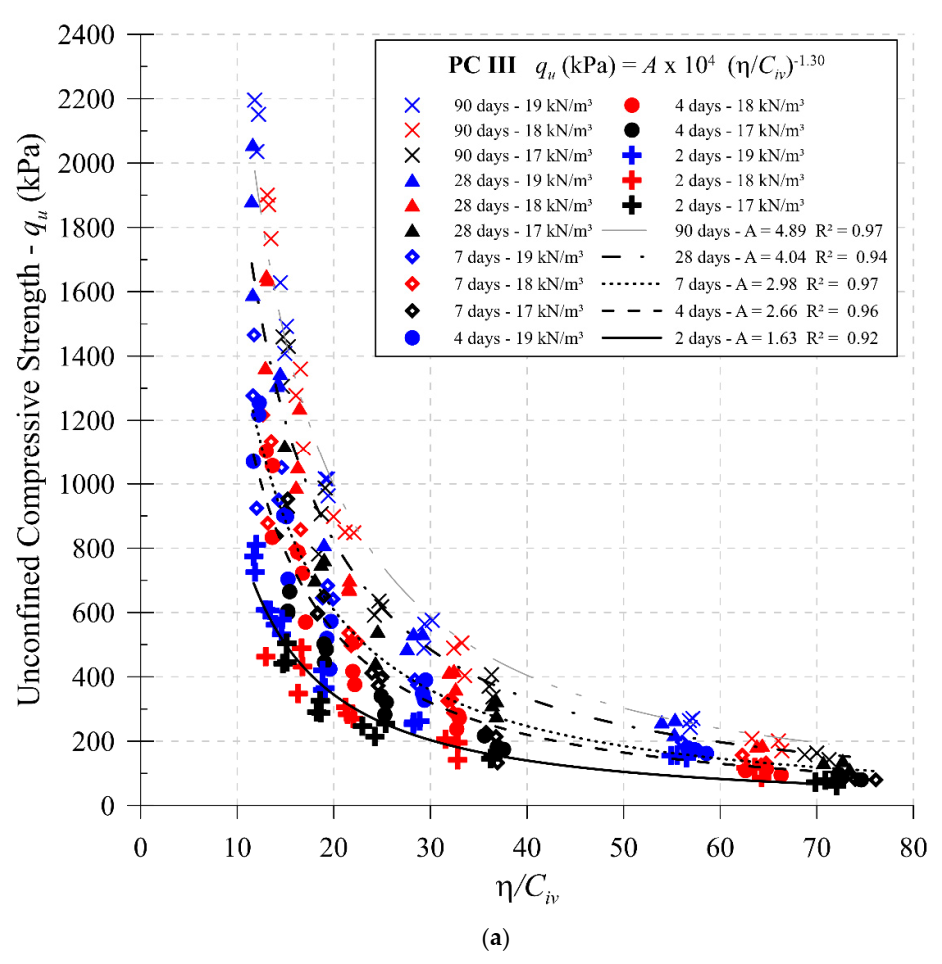
4.1. Unconfined Compressive Strength (qu)
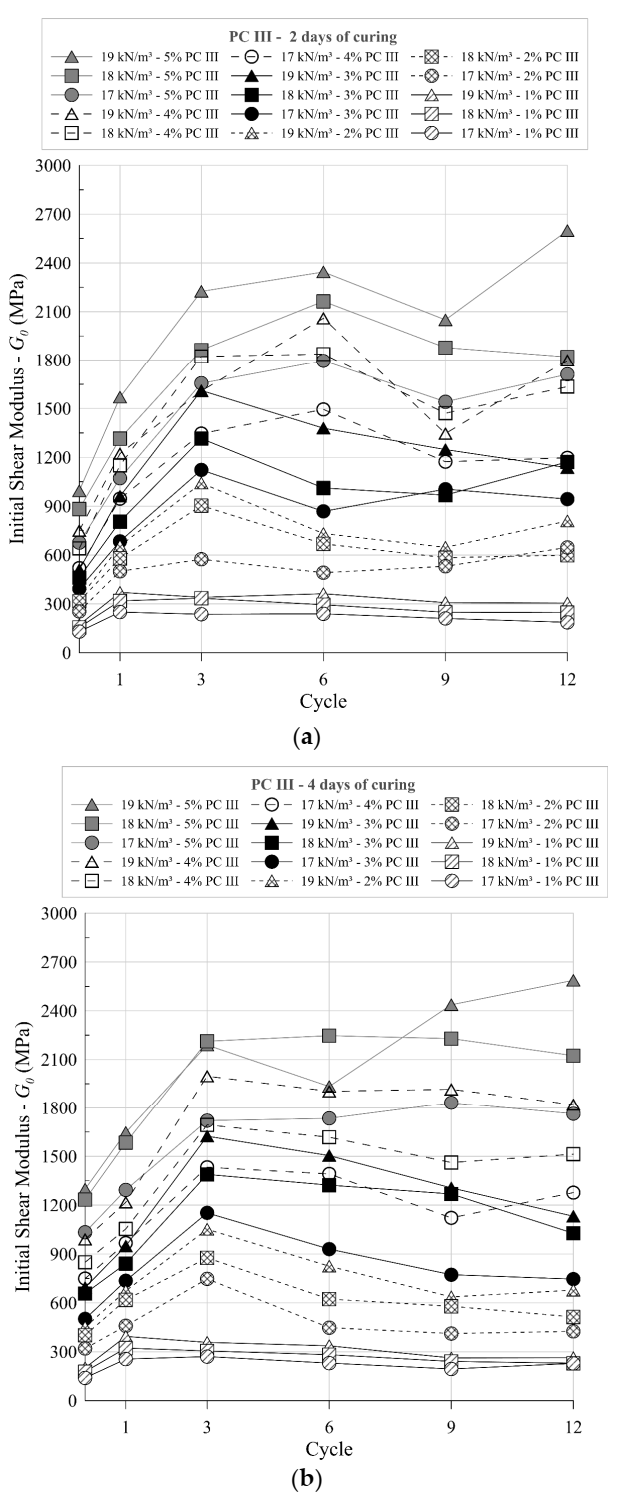
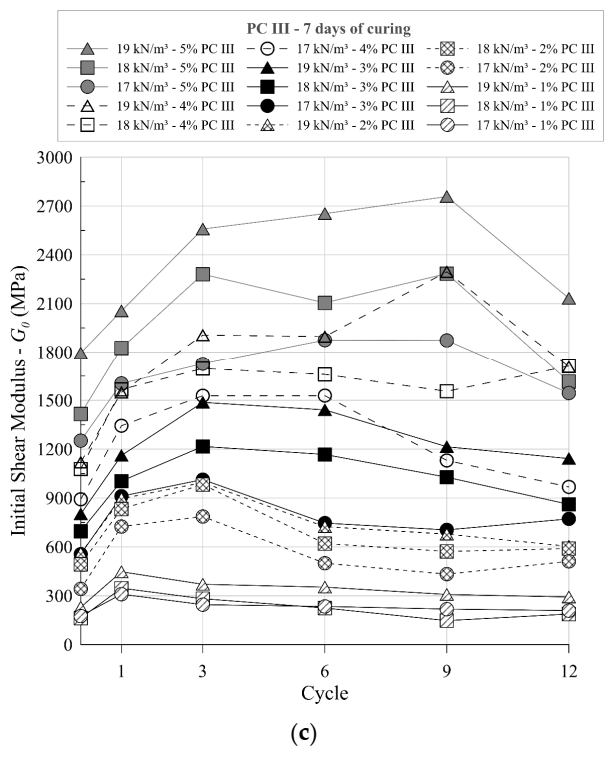
4.2. Initial Shear Modulus
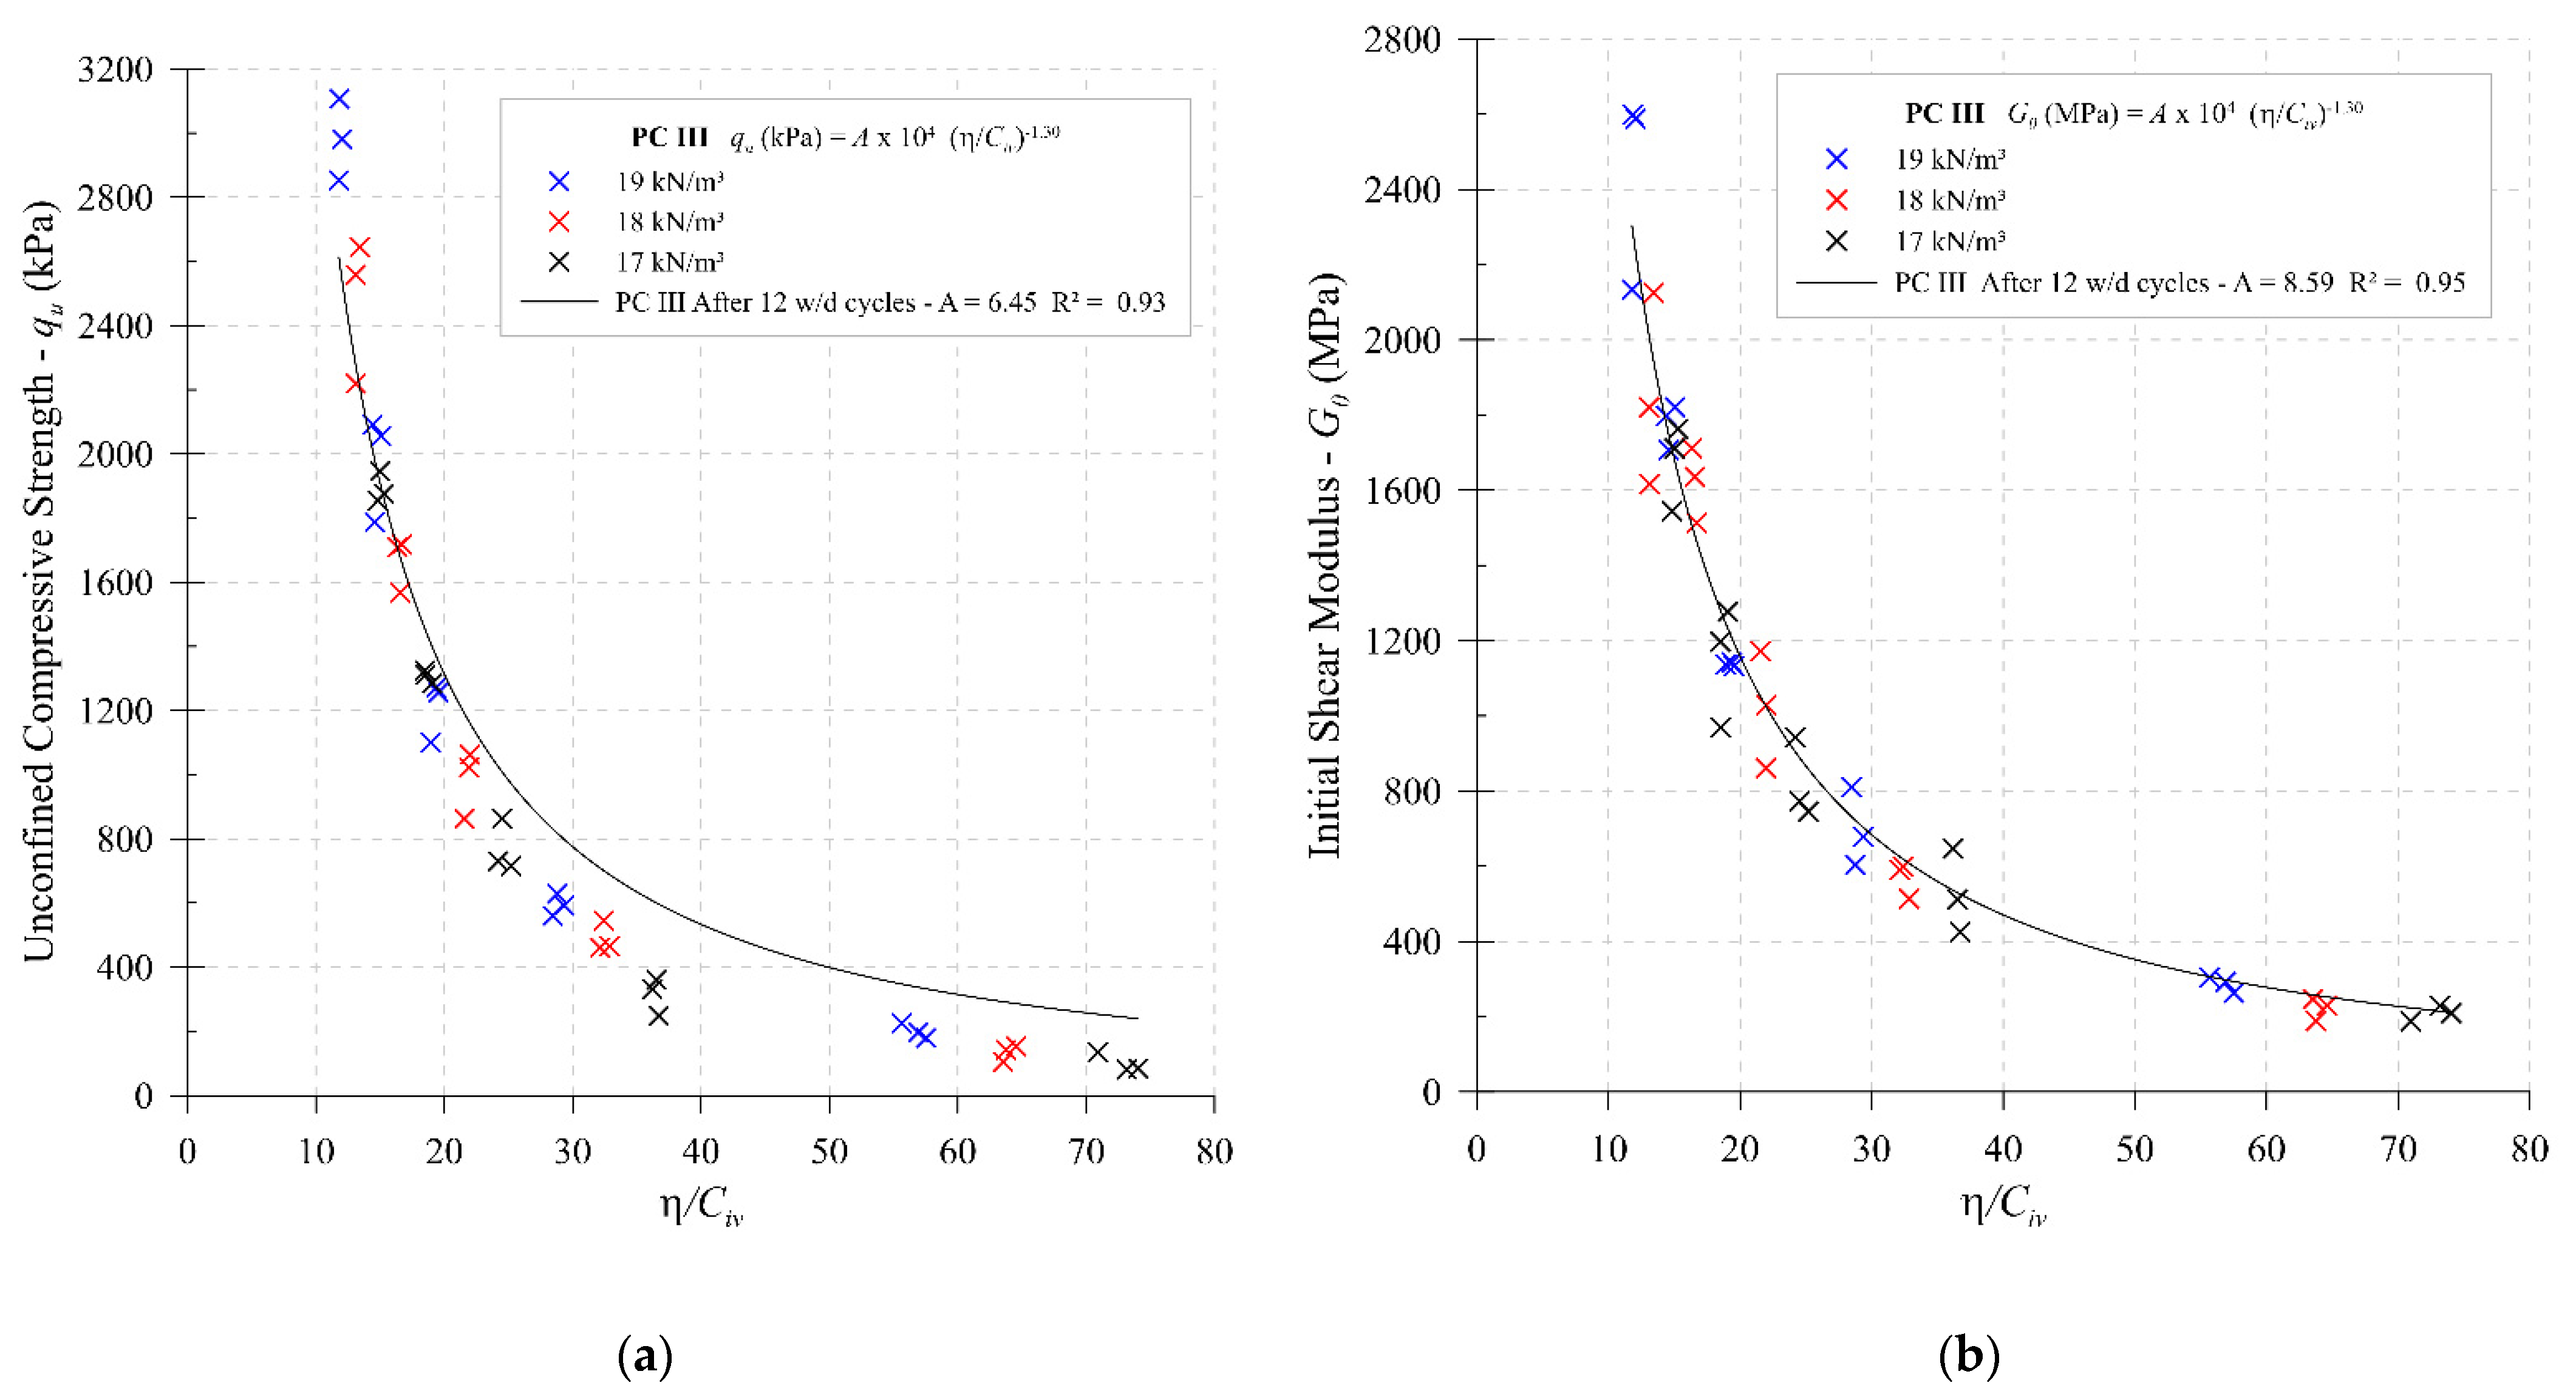
4.3. Durability under Wetting–Drying Cycles
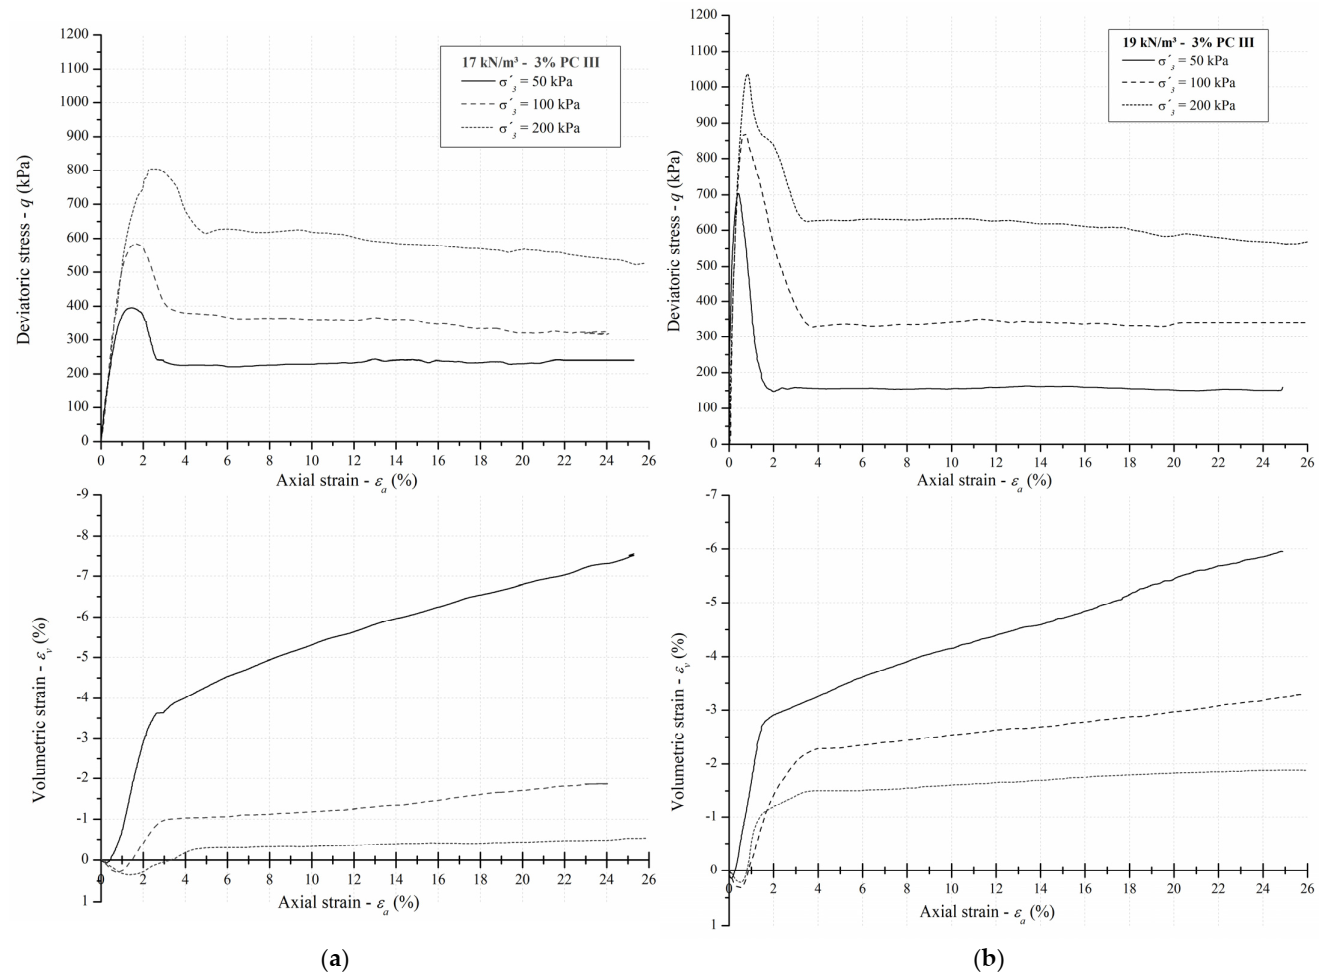
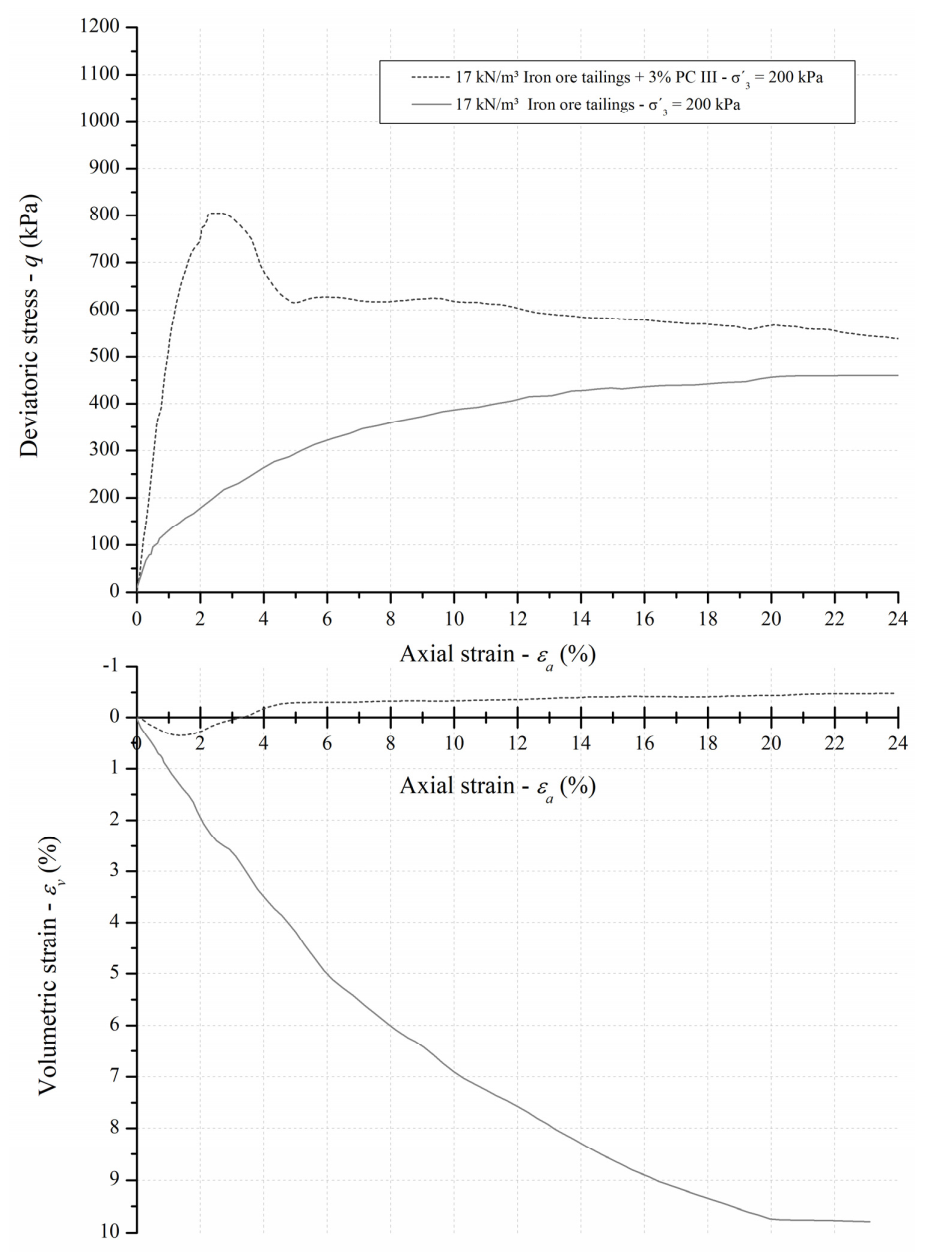
4.4. Triaxial
5. Discussion
6. Conclusions
Author Contributions
Funding
Institutional Review Board Statement
Informed Consent Statement
Data Availability Statement
Conflicts of Interest
Abbreviations
| A, C, D, E | scalars |
| B | Skempton’s parameter |
| c′peak | peak cohesion at effective stresses |
| Civ | volumetric cement content |
| d | particle diameter |
| Esec | secant modulus |
| G0 | initial shear modulus |
| IOT | iron ore tailings |
| PC | Portland cement |
| qu | unconfined compressive strength |
| ξ | power function parameter |
| εa | axial strain |
| εv | volumetric strain |
| γd | dry unit weight |
| γs | unit weight of solids |
| φ′cs | angle of shearing resistance at critical state |
| φ′peak | peak angle of shearing resistance at effective stresses |
| η | porosity |
| η/Civ | porosity/cement index |
References
- Li, W.; Coop, M.; Senetakis, K.; Schnaid, F. The mechanics of a silt-sized gold tailing. Eng. Geol. 2018, 241, 97–108. [Google Scholar] [CrossRef]
- Kossoff, D.; Dubbin, W.; Alfredsson, M.; Edwards, S.; Macklin, M.; Hudson-Edwards, K. Mine tailings dams: Characteristics, failure, environmental impacts, and remediation. Appl. Geochem. 2014, 51, 229–245. [Google Scholar] [CrossRef]
- Armstrong, M.; Langrené, N.; Petter, R.; Chen, W.; Petter, C. Accounting for tailings dam failures in the valuation of mining projects. Resour. Policy 2019, 63, 101461. [Google Scholar] [CrossRef]
- Hu, L.; Wu, H.; Zhang, L.; Zhang, P.; Wen, Q. Geotechnical properties of mine tailings. J. Mater. Civ. Eng. 2017, 29, 04016220. [Google Scholar] [CrossRef]
- World Mine Tailings Failures. State of World Mine Tailings Portfolio 2020. WMTF. 2020. Available online: https://worldminetailingsfailures.org/ (accessed on 15 November 2021).
- United Nations Environment Programme. New Report Urges Global Action on Mining Pollution. UNEP. 2017. Available online: https://www.unep.org/news-and-stories/story/new-report-urges-global-action-mining-pollution (accessed on 15 November 2021).
- Islam, K.; Murakami, S. Global-scale impact analysis of mine tailings dam failures: 1915–2020. Glob. Environ. Chang. 2021, 70, 102361. [Google Scholar] [CrossRef]
- Lyu, Z.; Chai, J.; Xu, Z.; Qin, Y.; Cao, J. A comprehensive review on reasons for tailings dam failures based on case history. Adv. Civ. Eng. 2019, 2019, 4159306. [Google Scholar] [CrossRef]
- Santamarina, J.C.; Torres-Cruz, L.A.; Bachus, R.C. Why coal ash and tailings dam disasters occur. Science 2019, 364, 526–528. [Google Scholar] [CrossRef] [PubMed]
- Statista. Iron Ore Mine Production in Brazil from 2015 to 2020. Statista. 2021. Available online: https://www.statista.com/statistics/1026351/brazil-iron-ore-mine-production/ (accessed on 15 November 2021).
- Vick, S.G. Planning, Design, and Analysis of Tailings Dams; Bitech: Vancouver, BC, Canada, 1990. [Google Scholar]
- Consoli, N.C.; Sills, G.C. Soil formation from tailings: Comparison of predictions and field measurements. Géotechnique 2000, 50, 25–33. [Google Scholar] [CrossRef]
- James, M.; Aubertin, M.; Wijewickreme, D.; Wilson, G.W. A laboratory investigation on the dynamic properties of tailings. Can. Geotechnical J. 2011, 48, 1587–1600. [Google Scholar] [CrossRef]
- Jefferies, M.G.; Been, K. Soil liquefaction: A critical state approach; CRC Press: Boca Raton, FL, USA, 2015. [Google Scholar]
- Villavicencio, G.; Breul, P.; Bacconnet, C.; Fourie, A.; Espinace, R. Liquefaction potential of sand tailings dams evaluated using probabilistic interpretation of estimated in-situ relative density. Rev. De La Construcción 2016, 15, 9–18. [Google Scholar] [CrossRef]
- ASTM D2487; Standard practice for classification of soils for engineering purposes (Unified Soil Classification System); American Society for Testing and Materials: West Conshohocken, PA, USA, 2017.
- ASTM C150; Standard specification for Portland cement; ASTM International: West Conshohocken, PA, USA, 2017.
- Selig, E.; Ladd, R.S. Preparing test specimens using undercompaction. Geotechnical Test. J. 1978, 1, 16. [Google Scholar] [CrossRef]
- ASTM D7263; Standard test methods for laboratory determination of density and unit weight of soil specimens; American Society for Testing and Materials: West Conshohocken, PA, USA, 2021.
- Consoli, N.C.; da Fonseca, A.V.; Cruz, R.; Rios, S. Voids/cement ratio controlling tensile strength of cement treated soils. J. Geotechnical Geoenvironmental Eng. 2011, 137, 1126–1131. [Google Scholar] [CrossRef]
- ASTM C39; Standard test method for compressive strength of cylindrical concrete specimens; American Society of Civil Engineers: West Conshohocken, PA, USA, 2018.
- Mitchell, J.K. Soil improvement—State-of-the-art report. In Proceedings of the 10th International Conference on Soil Mechanics and Foundation Engineering, International Society of Soil Mechanics and Foundation Engineering, Stockholm, Sweden, 15–19 June 1981; pp. 509–565. [Google Scholar]
- Consoli, N.C.; Foppa, D.; Festugato, L.; Heineck, K.S. Key parameters for strength control of artificially cemented soils. J. Geotechnical Geoenvironmental Eng. 2007, 133, 197–205. [Google Scholar] [CrossRef]
- Consoli, N.C.; Ferreira, P.; Tang, C.-S.; Marques, S.F.V.; Festugato, L.; Corte, M.B. A unique relationship determining strength of silty/clayey soils–Portland cement mixes. Soils Found. 2016, 56, 1082–1088. [Google Scholar] [CrossRef]
- ASTM D2845; Standard test method for laboratory determination of pulse velocities and ultrasonic elastic constants of rock; American Society for Testing and Materials: West Conshohocken, PA, USA, 2008.
- Mitchell, J.K.; Soga, K. Fundamentals of Soil Behavior, 3rd ed.; John Wiley & Sons: Hoboken, NJ, USA, 2005. [Google Scholar]
- ASTM D559; Standard test methods for wetting and drying compacted soil-cement mixtures; American Society for Testing and Materials: West Conshohocken, PA, USA, 2015.
- Consoli, N.C.; Samaniego, R.A.Q.; González, L.E.; Bittar, E.J.; Cuisinier, O. Impact of severe climate conditions on loss of mass, strength, and stiffness of compacted fine-grained soils–Portland cement blends. J. Mater. Civ. Eng. 2018, 30, 04018174. [Google Scholar] [CrossRef]
- BS 1377; Methods of test for soils for civil engineering purposes; British Standards: London, UK, 1990.
- Clayton, C.R.I.; Khatrush, S.A. A new device for measuring local axial strains on triaxial specimens. Géotechnique 1986, 36, 593–597. [Google Scholar] [CrossRef]
- Maswoswe, J.J. Stress Path Method for a Compacted Soil during Collapse Due to Wetting. Ph.D. Thesis, University of London, London, UK, 1985. [Google Scholar]
- La Rochelle, P.; Leroueil, S.; Trak, B.; Blais-Leroux, L.; Tavenas, F. Observational approach to membrane and area corrections in triaxial tests. In Proceedings of the Advanced Triaxial Testing of Soil and Rock, Louisville, KY, USA, 19–20 June 1986; p. 715, (published by ASTM STP 977–1988). [Google Scholar]
- Consoli, N.C.; Morales, D.P.; Saldanha, R.B. A new approach for stabilization of lateritic soil with Portland cement and sand: Strength and durability. Acta Geotechnica 2021, 16, 1473–1486. [Google Scholar] [CrossRef]
- Diambra, A.; Ibraim, E.; Peccin, A.; Consoli, N.C.; Festugato, L. Theoretical derivation of artificially cemented granular soil strength. J. Geotech. Geoenvironmental Eng. 2017, 143, 04017003. [Google Scholar] [CrossRef]
- Rios, S.; da Fonseca, A.V.; Consoli, N.C.; Floss, M.; Cristelo, N. Influence of grain size and mineralogy on the porosity/cement ratio. Géotechnique Lett. 2013, 3, 130–136. [Google Scholar] [CrossRef]
- Diambra, A.; Festugato, L.; Ibraim, E.; da Silva, A.P.; Consoli, N.C. Modelling tensile/compressive strength ratio of artificially cemented clean sand. Soils Found. 2018, 58, 199–211. [Google Scholar] [CrossRef]
- Cuccovillo, T.; Coop, M.R. On the mechanics of structured sands. Géotechnique 1999, 49, 741–760. [Google Scholar] [CrossRef]
- Consoli, N.C.; Cruz, R.C.; Da Fonseca, A.V.; Coop, M.R. Influence of cement-voids ratio on stress-dilatancy behavior of artificially cemented sand. J. Geotech. Geoenvironmental Eng. 2012, 138, 100–109. [Google Scholar] [CrossRef]
- Airey, D.W. Triaxial testing of naturally cemented carbonate soil. J. Geotech. Eng. 1993, 119, 1379–1398. [Google Scholar] [CrossRef]
- Coop, M.R.; Willson, S.M. Behavior of hydrocarbon reservoir sands and sandstones. J. Geotech. Geoenvironmental Eng. 2003, 129, 1010–1019. [Google Scholar] [CrossRef]


| Physical Properties | Iron Ore Tailings (IOT) |
|---|---|
| Specific gravity of solids | 2.916 |
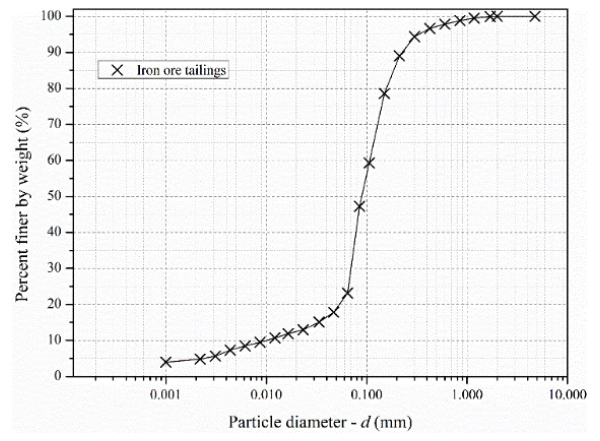
| Uniformity coefficient | 10.7 |
| Coefficient of curvature | 3.9 |
| Mean particle diameter-(mm) | 0.085 |
| Liquid limit (%) | - |
| Plastic limit (%) | - |
| Plasticity index (%) | Nonplastic |
| Medium sand (0.425 mm < d < 0.200 mm) (%) | 4.0 |
| Fine sand (0.075 mm < d < 0.425 mm) (%) | 49.0 |
| Silt (0.002 mm < d < 0.075 mm) (%) | 42.0 |
| Clay (d < 0.002 mm) (%) | 5.0 |
| USCS Classification (ASTM 2017) | SM |
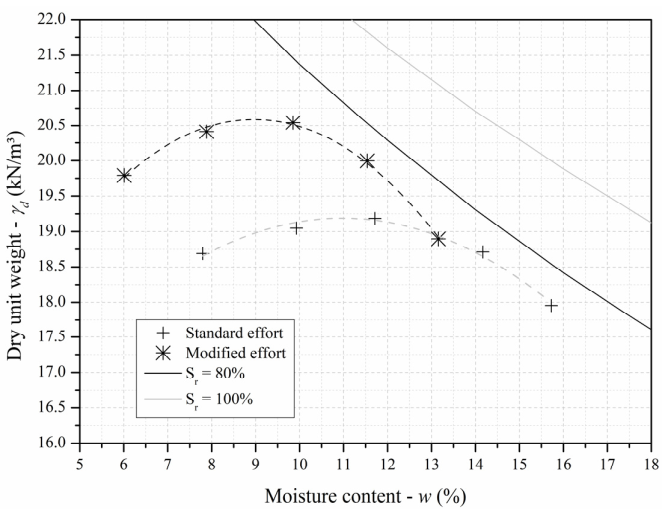
| Maximum dry unit weight at standard energy compaction (kN/m3) | 19.2 |
| Optimum moisture content at standard energy compaction (%) | 11.6 |
| Curing Period | Strength Data—qu | Stiffness Data—G0 | ||
|---|---|---|---|---|
| “A” | Coefficient of Determination (R²) | “C” | Coefficient of Determination (R²) | |
| 2 days | 1.63 | 0.92 | 1.46 | 0.86 |
| 4 days | 2.66 | 0.96 | 2.98 | 0.92 |
| 7 days | 2.98 | 0.97 | 4.11 | 0.97 |
| 28 days | 4.04 | 0.94 | 4.53 | 0.96 |
| 90 days | 4.89 | 0.96 | 6.04 | 0.96 |
| γd = 17 kN/m³ & 3% PC III | γd = 19 kN/m³ & 3% PC III | ||||||
|---|---|---|---|---|---|---|---|
| Esec (MPa) | Esec (MPa) | ||||||
| Confining Pressure | εa (%) = 0.1 | εa (%) = 0.5 | εa (%) = 1.0 | Confining Pressure | εa (%) = 0.1 | εa (%) = 0.5 | εa (%) = 1.0 |
| 50 kPa | 714.7 | 441.6 | 355.1 | 50 kPa | 1888.9 | 1412.8 | 378.6 |
| 100 kPa | 740.2 | 605.3 | 524.2 | 100 kPa | 2042.7 | 1652.9 | 812.5 |
| 200 kPa | 816.1 | 500.1 | 526.6 | 200 kPa | 2599.9 | 1808.6 | 965.3 |
| (a) | (b) | ||||||
Publisher’s Note: MDPI stays neutral with regard to jurisdictional claims in published maps and institutional affiliations. |
© 2022 by the authors. Licensee MDPI, Basel, Switzerland. This article is an open access article distributed under the terms and conditions of the Creative Commons Attribution (CC BY) license (https://creativecommons.org/licenses/by/4.0/).
Share and Cite
Consoli, N.C.; Vogt, J.C.; Silva, J.P.S.; Chaves, H.M.; Scheuermann Filho, H.C.; Moreira, E.B.; Lotero, A. Behaviour of Compacted Filtered Iron Ore Tailings–Portland Cement Blends: New Brazilian Trend for Tailings Disposal by Stacking. Appl. Sci. 2022, 12, 836. https://doi.org/10.3390/app12020836
Consoli NC, Vogt JC, Silva JPS, Chaves HM, Scheuermann Filho HC, Moreira EB, Lotero A. Behaviour of Compacted Filtered Iron Ore Tailings–Portland Cement Blends: New Brazilian Trend for Tailings Disposal by Stacking. Applied Sciences. 2022; 12(2):836. https://doi.org/10.3390/app12020836
Chicago/Turabian StyleConsoli, Nilo Cesar, Jordanna Chamon Vogt, João Paulo Sousa Silva, Helder Mansur Chaves, Hugo Carlos Scheuermann Filho, Eclesielter Batista Moreira, and Andres Lotero. 2022. "Behaviour of Compacted Filtered Iron Ore Tailings–Portland Cement Blends: New Brazilian Trend for Tailings Disposal by Stacking" Applied Sciences 12, no. 2: 836. https://doi.org/10.3390/app12020836
APA StyleConsoli, N. C., Vogt, J. C., Silva, J. P. S., Chaves, H. M., Scheuermann Filho, H. C., Moreira, E. B., & Lotero, A. (2022). Behaviour of Compacted Filtered Iron Ore Tailings–Portland Cement Blends: New Brazilian Trend for Tailings Disposal by Stacking. Applied Sciences, 12(2), 836. https://doi.org/10.3390/app12020836