1. Introduction
Of the fields of chemical physics, computational chemistry and atomistic simulations could be considered to be the fastest growing. The potential applications of the field are bound mostly by advances in computer hardware, which is (typically) outside the remit of the chemist’s research. The growth in power, and consequent reduction in cost, of computational resources has historically doubled approximately every two years, a trend known as Moore’s Law. In this way, computational chemists have been incredibly fortunate; over the course of ten years, the increase in available resources can reclassify a problem from “impossible”, to “cutting-edge”, to “difficult”, to “routine”.
However, an infinite growth in computational resources should not be assumed. Already, chipset manufacturers are running up against hard physical limits in designing and manufacturing processors with higher transistor densities than the previous generation [
1]. Therefore, it is becoming increasingly important for computational chemists to have knowledge of, and access to, a variety of efficient and reliable simulation methodologies to correspond with the nature and scale of the system they wish to examine.
Herein, we present a description and some analyses of a self-consistent charge density functional tight-binding molecular dynamics (SCC DFTB-MD, or simply DFTB) simulation of an explicitly solvated, anatase-structured TiO2 nanoparticle. The aim of this paper is not to provide an exhaustive or comprehensive description of the properties of such a system, but rather to showcase the application of a relatively under-utilised methodology in DFTB, and to perhaps inspire other computational chemists to consider expanding their repertoire of techniques to include this methodology for large-scale simulations.
The core of the DFTB methodology is very similar to full DFT; the Kohn–Sham equations are solved numerically, using approximate parameters determined by the electronic density of the system. The key difference between the methods is the eponymous “tight-binding” approximation; electrons are tightly bound to the atomic orbitals they occupy at the beginning of the simulation, although they are permitted to become as dispersed or localised as is necessary to minimise the energy of the system. Thus, the electronic Hamiltonians are parameters of the method, similar to the pseudopotentials of DFT. The tight-binding approximation means that the method is not inherently suited to metallic systems, although the careful construction of parameters can go some way towards offsetting this. However, the lack of widely available DFTB parameter sets is likely the largest problem faced by those who wish to employ it. A more complete description of the DFTB methodology is provided by Koskinen and Mäkinen [
2].
The motivation for this study stems from the authors’ previous research of systems containing TiO
2. Previous publications from the authors have examined planar systems of TiO
2 under a variety of different conditions, such as various surface terminations, with and without applied electric fields, and diverse simulation methodologies from force-field MD to ab initio MD [
3,
4,
5,
6,
7]. Hitherto this publication, we had not considered the use of DFTB-based methodologies for simulations of this kind of system; however, following the publication of a series of articles concerning SCC DFTB calculations of TiO
2 systems by di Valentin and colleagues [
8,
9], we became aware of the potential power of the method. By including electronic structure data (with a few caveats, as will be described), DFTB has many of the advantages of full Density-Functional Theory (DFT), while requiring less resources by orders of magnitude. This means that the systems studied can be larger and/or MD trajectories can be longer for the same resource allocation.
2. Materials and Methods
The details of the simulation are, thus, as follows: SCC DFTB-MD was performed using the matsci 0.3 parameter set [
10] and the DFTB+ software, version 20.1 [
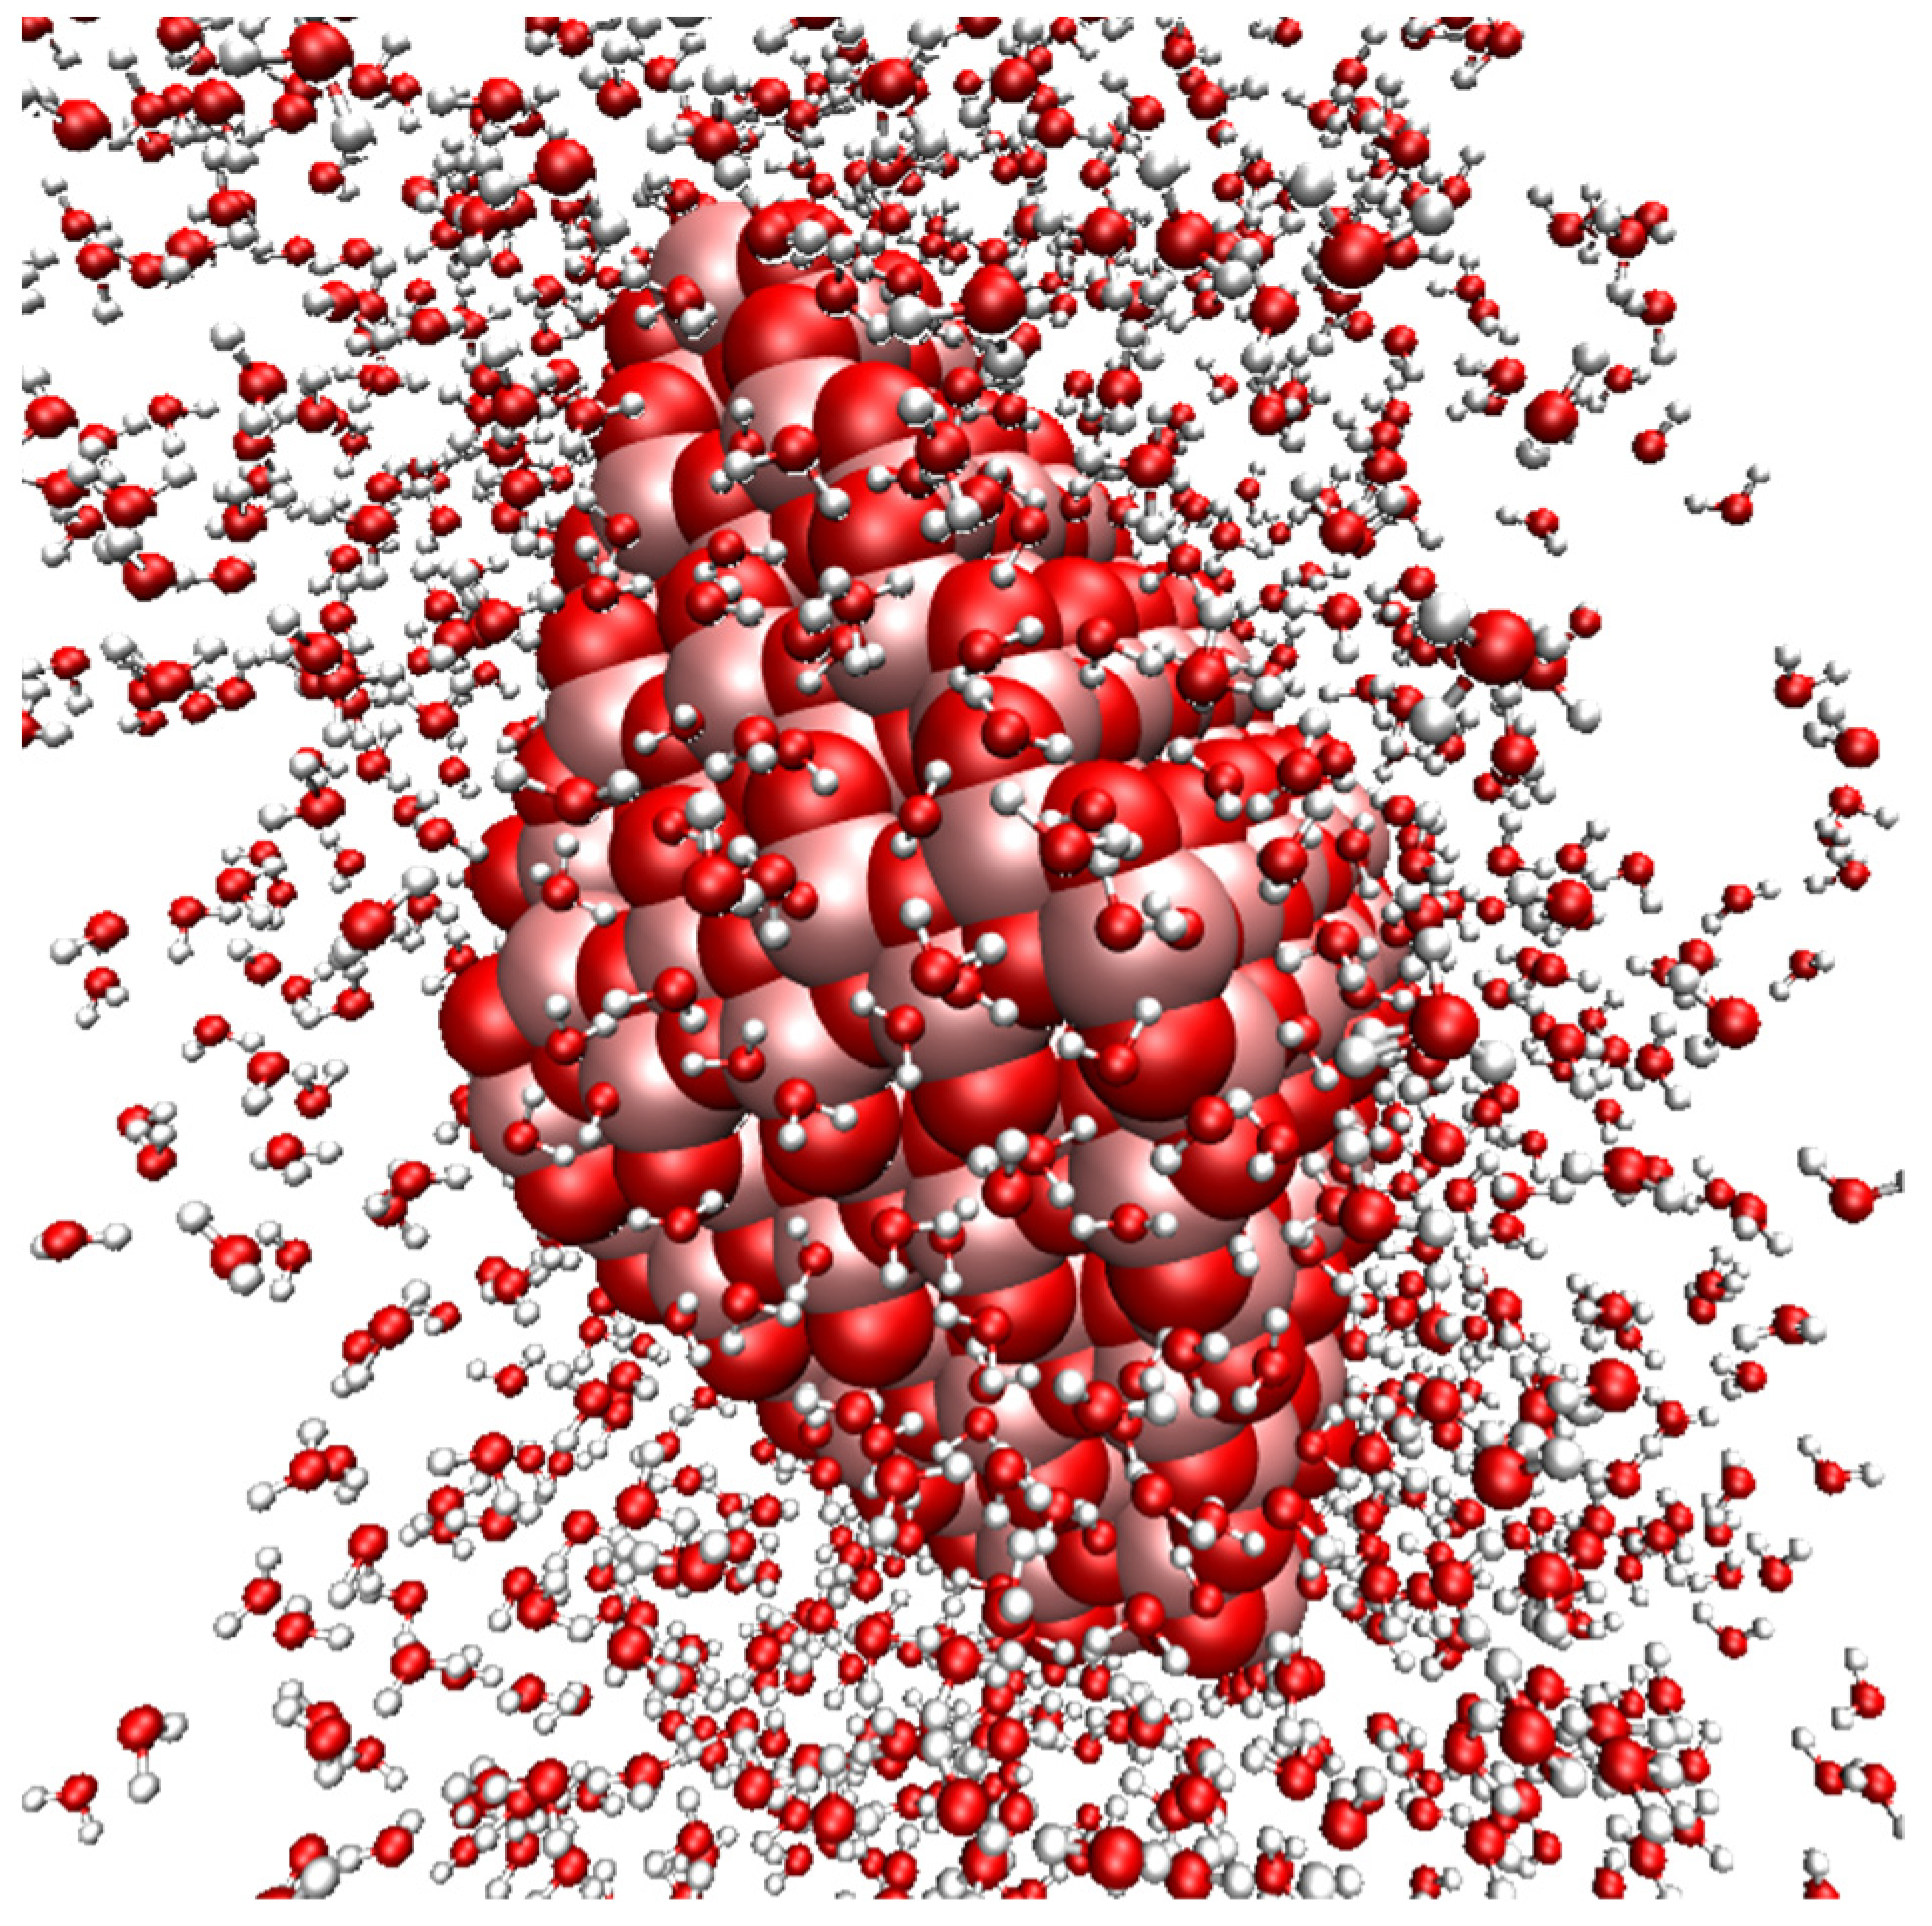
11]. The system consisted of an anatase nanoparticle in an orthogonal unit cell, shpwn in
Figure 1; the number of particles and cell parameters are outlined in
Table 1 (the number of TiO
2 units in the nanoparticle is non-stoichiometric; there are 163 Ti and 324 O atoms). The simulation cell was chosen so that there would be at least 20 Å between periodic images of the nanoparticle—cf.
Figure 1. This spacing leads to a very high virtual concentration of nanoparticles, but keeps separation between slabs, as usually employed in DFT simulations. The nanoparticle itself was constructed using a simulation cell from the Materials Project [
12] and the Wulffpack Python library [
13]. The ELPA solver from the ELSI library was used for electronic structure solvation [
14]. The Extended Lagrangian Born–Oppeheimer Molecular Dynamics (XLBOMD) scheme, as implemented in DFTB+, was used to speed up the SCC convergence of the system [
15].
The system was equilibrated at a temperature of 300 K for 1000 steps of 1.0 fs in the NVT ensemble using non-SCC DFTB-MD, followed by a data gathering simulation of 2048 steps of 1.0 fs in the NVE ensemble using SCC DFTB-MD. However, it is possible that the equilibration was not sufficient, as the system temperature quickly rose to approximately 650 K. Increased system temperature is also a symptom of poor SCC convergence, which could be attributed to the approximations introduced by the XLBOMD algorithm. Regardless, the total system energy was checked and found to be conserved to within 0.03% throughout the trajectory, validating the NVE ensemble and indicating that the increase in temperature is not due to energy leakage from poorly convergent SCC cycles.
For comparative purposes, smaller planar systems of anatase (101) and rutile (110) interfaces were also simulated using SCC DFTB-MD, employing the same parameter set, simulation settings, and software. The number of particles and cell parameters for these systems are outlined in
Table 1. The scale of these systems was chosen to be suitable for calculation using periodic DFT, and thus provide a benchmark for direct comparison between DFT and DFTB, which is discussed by the authors in an upcoming publication. The anatase and rutile unit cells were again sourced from Materials Project, and the surface slabs were constructed using the ASE Python library [
16]. These simulations were conducted for 5 ps in order to gather a meaningful number of reference data, and because far fewer computational resources were required for these simulations.
3. Results
3.1. Free Energy of Interaction
To assess the performance of the SCC DFTB-MD methodology for this system, we performed several analyses. The authors’ interest in TiO
2 stems mainly from the material’s application as a photoelectrochemical catalyst in the water-splitting reaction. Thus, a matter of key interest was whether the dissociative adsorption of water molecules on the nanoparticle surface is observed in the system—both experimental and theoretical investigations report mixed dissociative and molecular adsorption at TiO
2 surfaces [
17]. We identified adsorbed molecules using the free energy of interaction, as defined by Equation (1), as follows:
Dissociatively adsorbed molecules would have a larger energy of interaction than molecularly adsorbed molecules, which would, in turn, have a larger energy of interaction than non-adsorbed molecules. The reference energies for the isolated nanoparticle and water molecule were chosen as those corresponding to the relaxed geometries used to initialise the simulation.
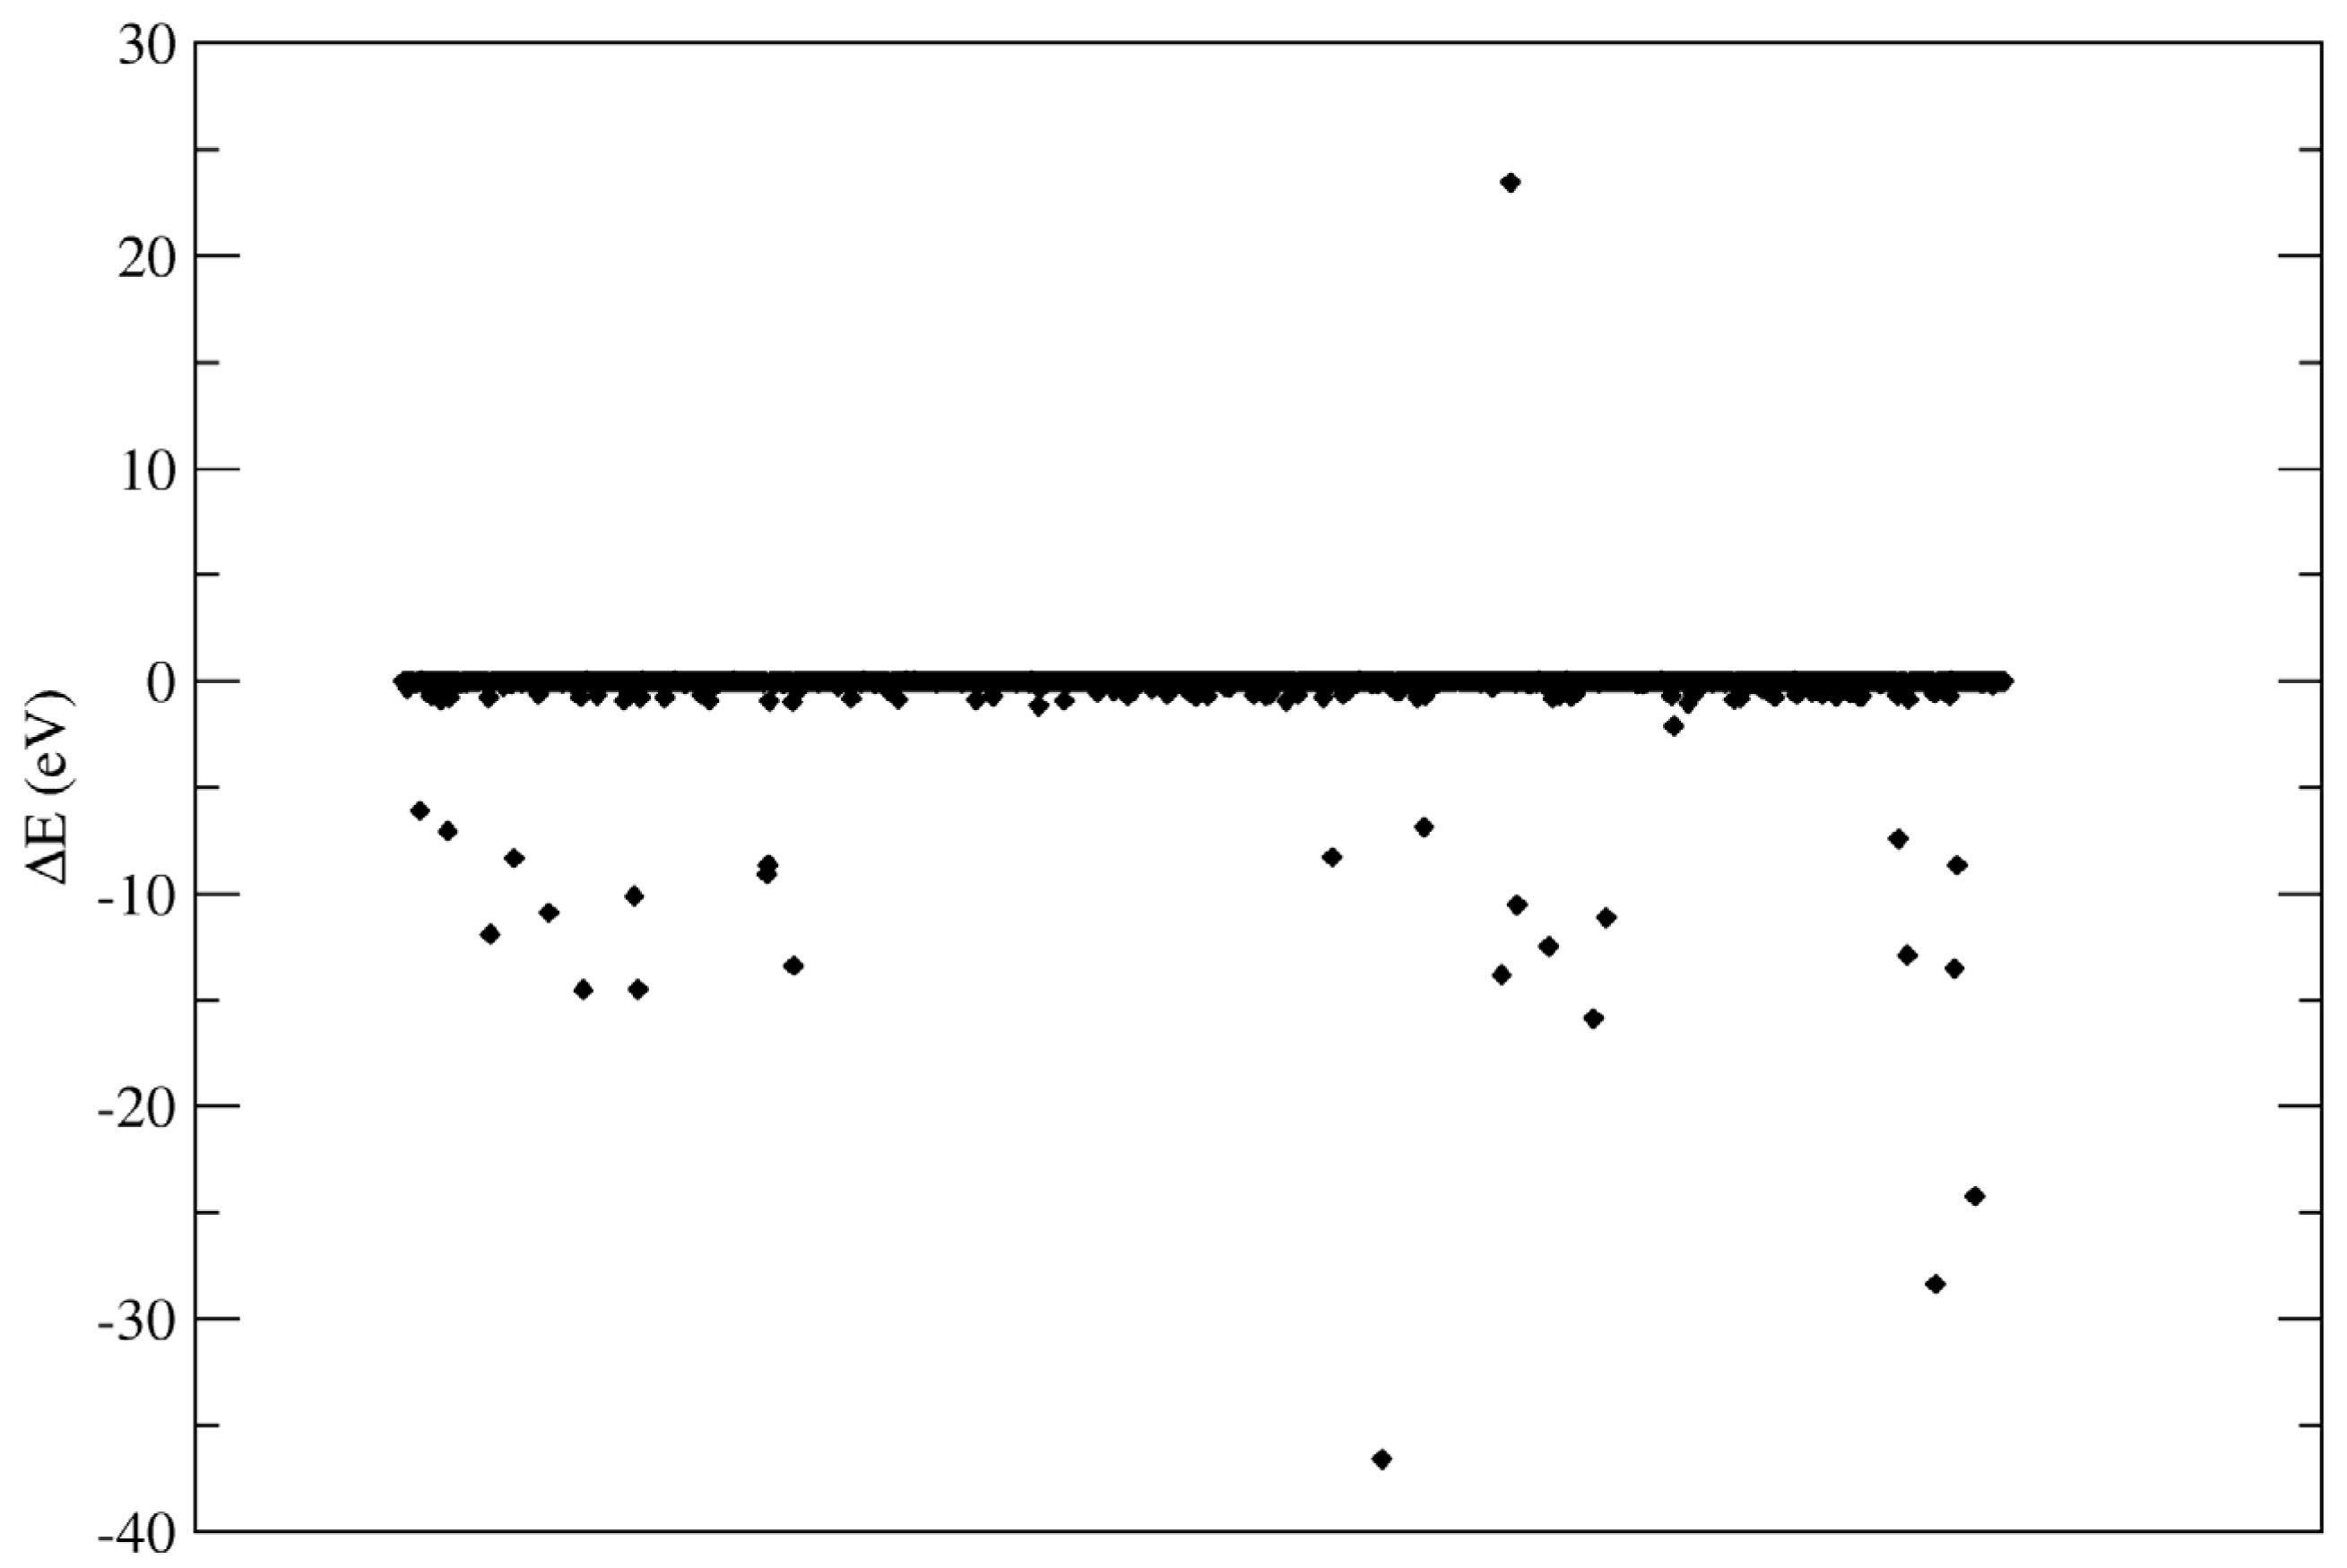
Figure 2 shows a scatter plot of the energy of interaction for water molecules in a single, randomly chosen frame of the trajectory.
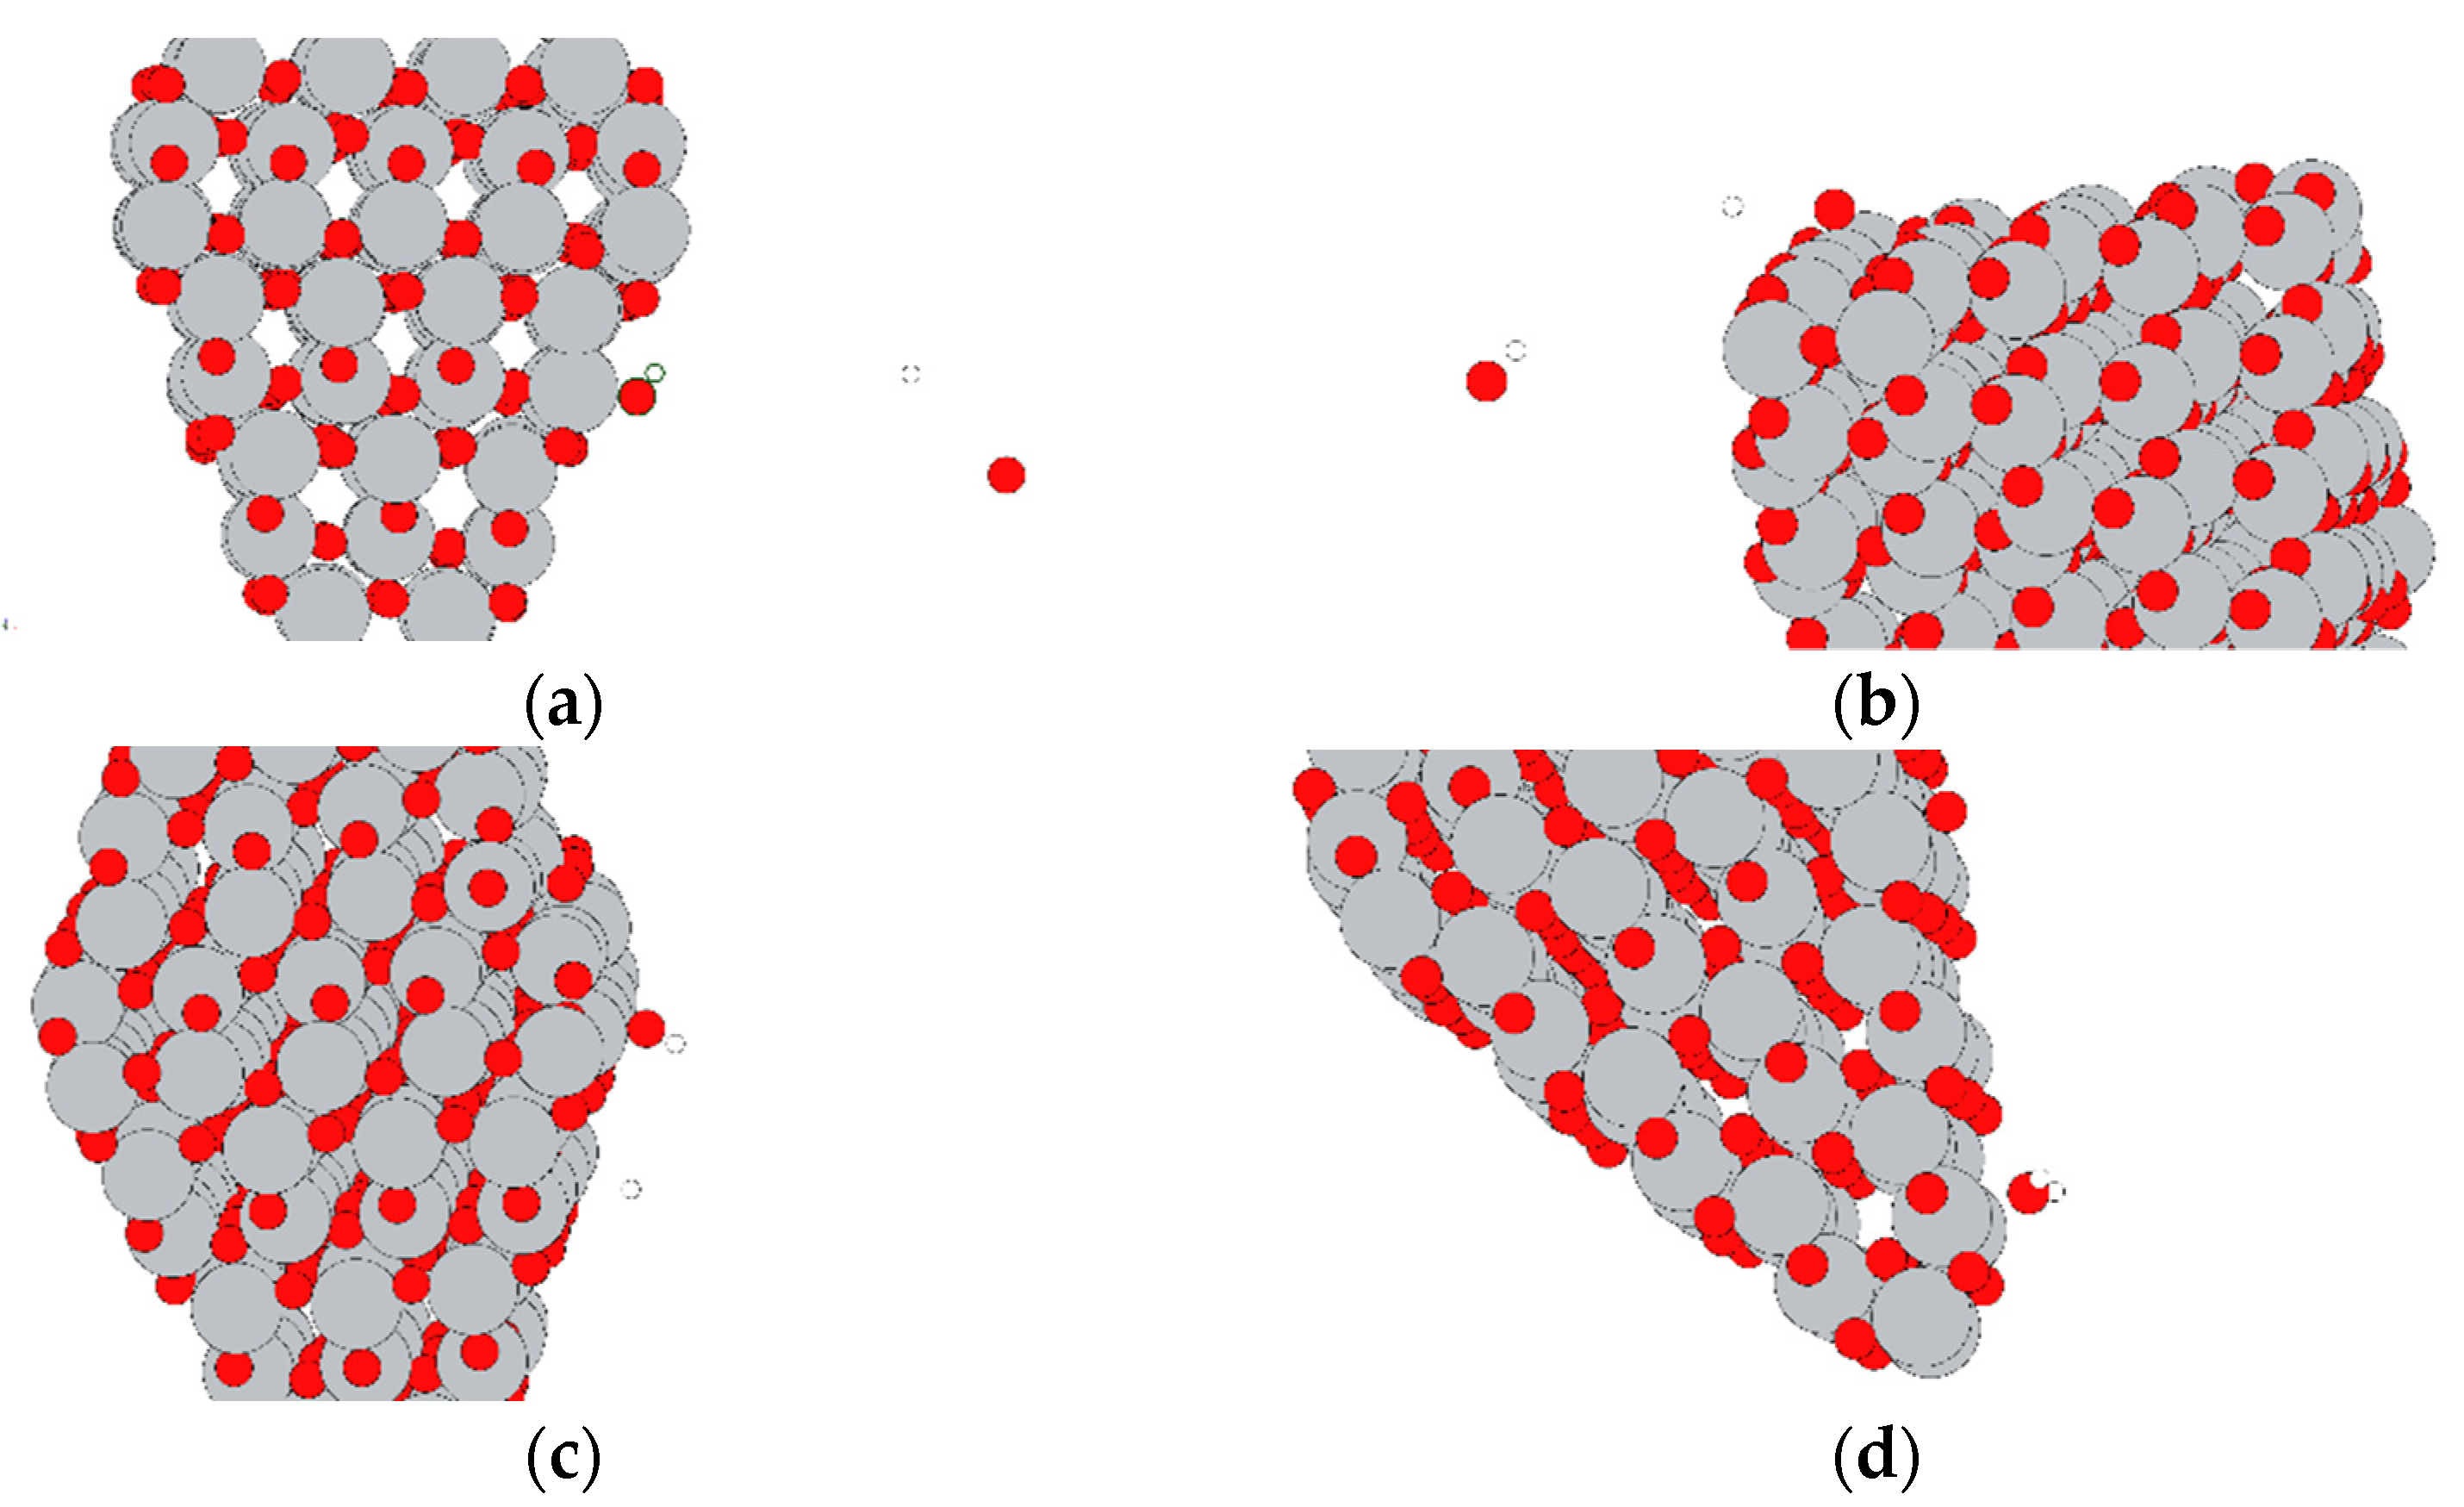
As can be observed, most the interactions are small and favourable, with a few larger, favourable (negative) interactions and a single large, unfavourable (positive) interaction. Selected interactions are summarised in
Table 2, with accompanying renderings in
Figure 3. As expected, the largest energies of interaction correspond to dissociated molecules. It is important to note that DFTB does not allow for electron transfer between atoms; thus, the interactions do not involve the formation of charged species, as would be expected in reality.
3.2. Formation of Water Layers
Another property of interest in this system is the self-assembly of water layers at the TiO
2 surface. Water molecules are known to form layers at planar TiO
2 surfaces [
18], and it would be expected that these layers also form around the nanoparticle.
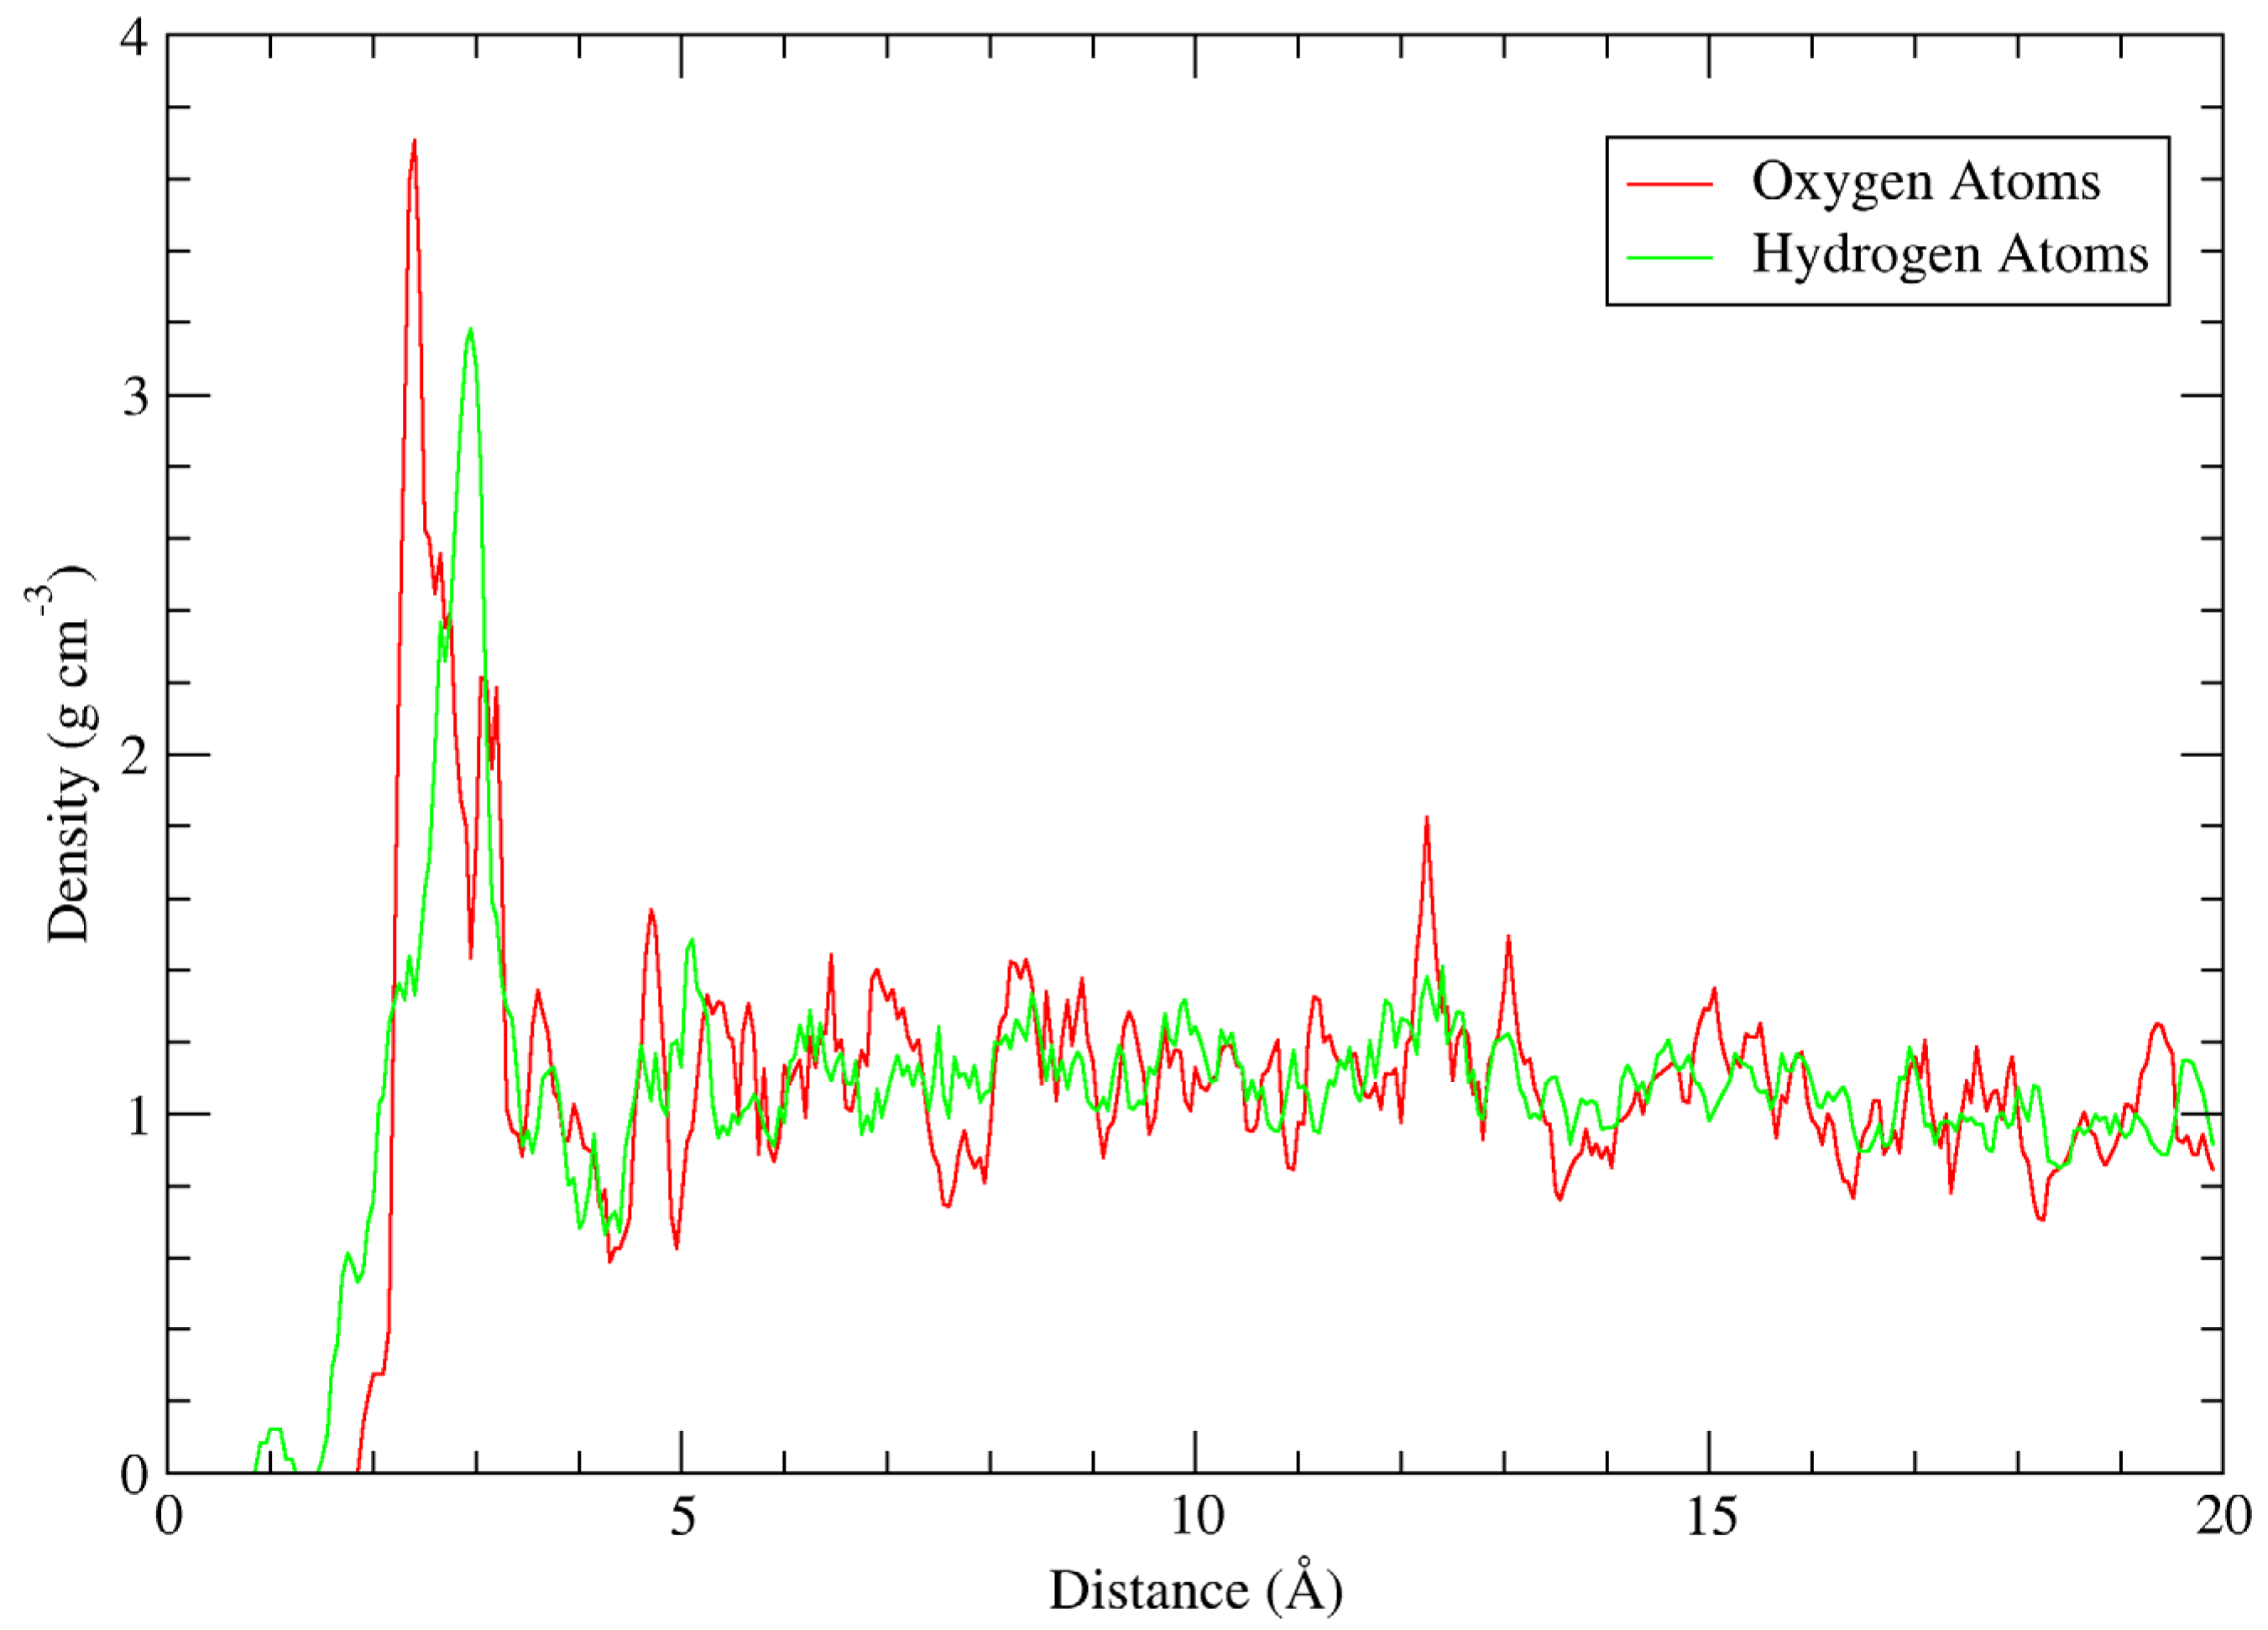
Figure 4 shows the density of water oxygen and hydrogen atoms as a function of distance to the nanoparticle surface. Because the nanoparticle occupies a non-negligible volume, the radial distance was taken as the shortest distance between a given water oxygen molecule and a constituent atom in the nanoparticle. To account for the large size and inhomogeneous shape of the nanoparticle within the simulation cell, a temporary 3 × 3 × 3 supercell was constructed by including duplicate systems with their coordinates translated by integer permutations of the cell vectors; this ensured that the density distribution remained smooth at distances up to 10 Å. The density was calculated by constructing shells of 0.05 Å width around the nanoparticle and dividing the number of atoms within the shell by the shell volume.
Figure 4 shows clear density peaks for both hydrogen and oxygen atoms. The hydrogen atom density peaks at approximately 3 Å, and its local minimum is at 4.0 Å. The oxygen atom density peaks at approximately 2.4 Å, with a number of shoulder peaks between 2.4 Å and the local minimum at 4.2 Å. The Ti–O bond length in anatase is approximately 2.0 Å, which corresponds to a small shoulder peak in the oxygen atom density in
Figure 4. Similarly, the average O–H bond length is approximately 0.96 Å, corresponding to a small peak in the hydrogen atom density. This clearly indicates chemical bonding occurring between the nanoparticle surface atoms and water molecule constituents. Other interesting insights include the narrow oxygen density peak, with a maximum at r = 4.7 Å, possibly corresponding to a second layer at the surface, as observed in other studies. However, the peak density in this region is quite low for a full layer compared to other studies of anatase systems, and the layer may only be partially present [
3,
19,
20].
3.3. Bond Creation/Cleavage
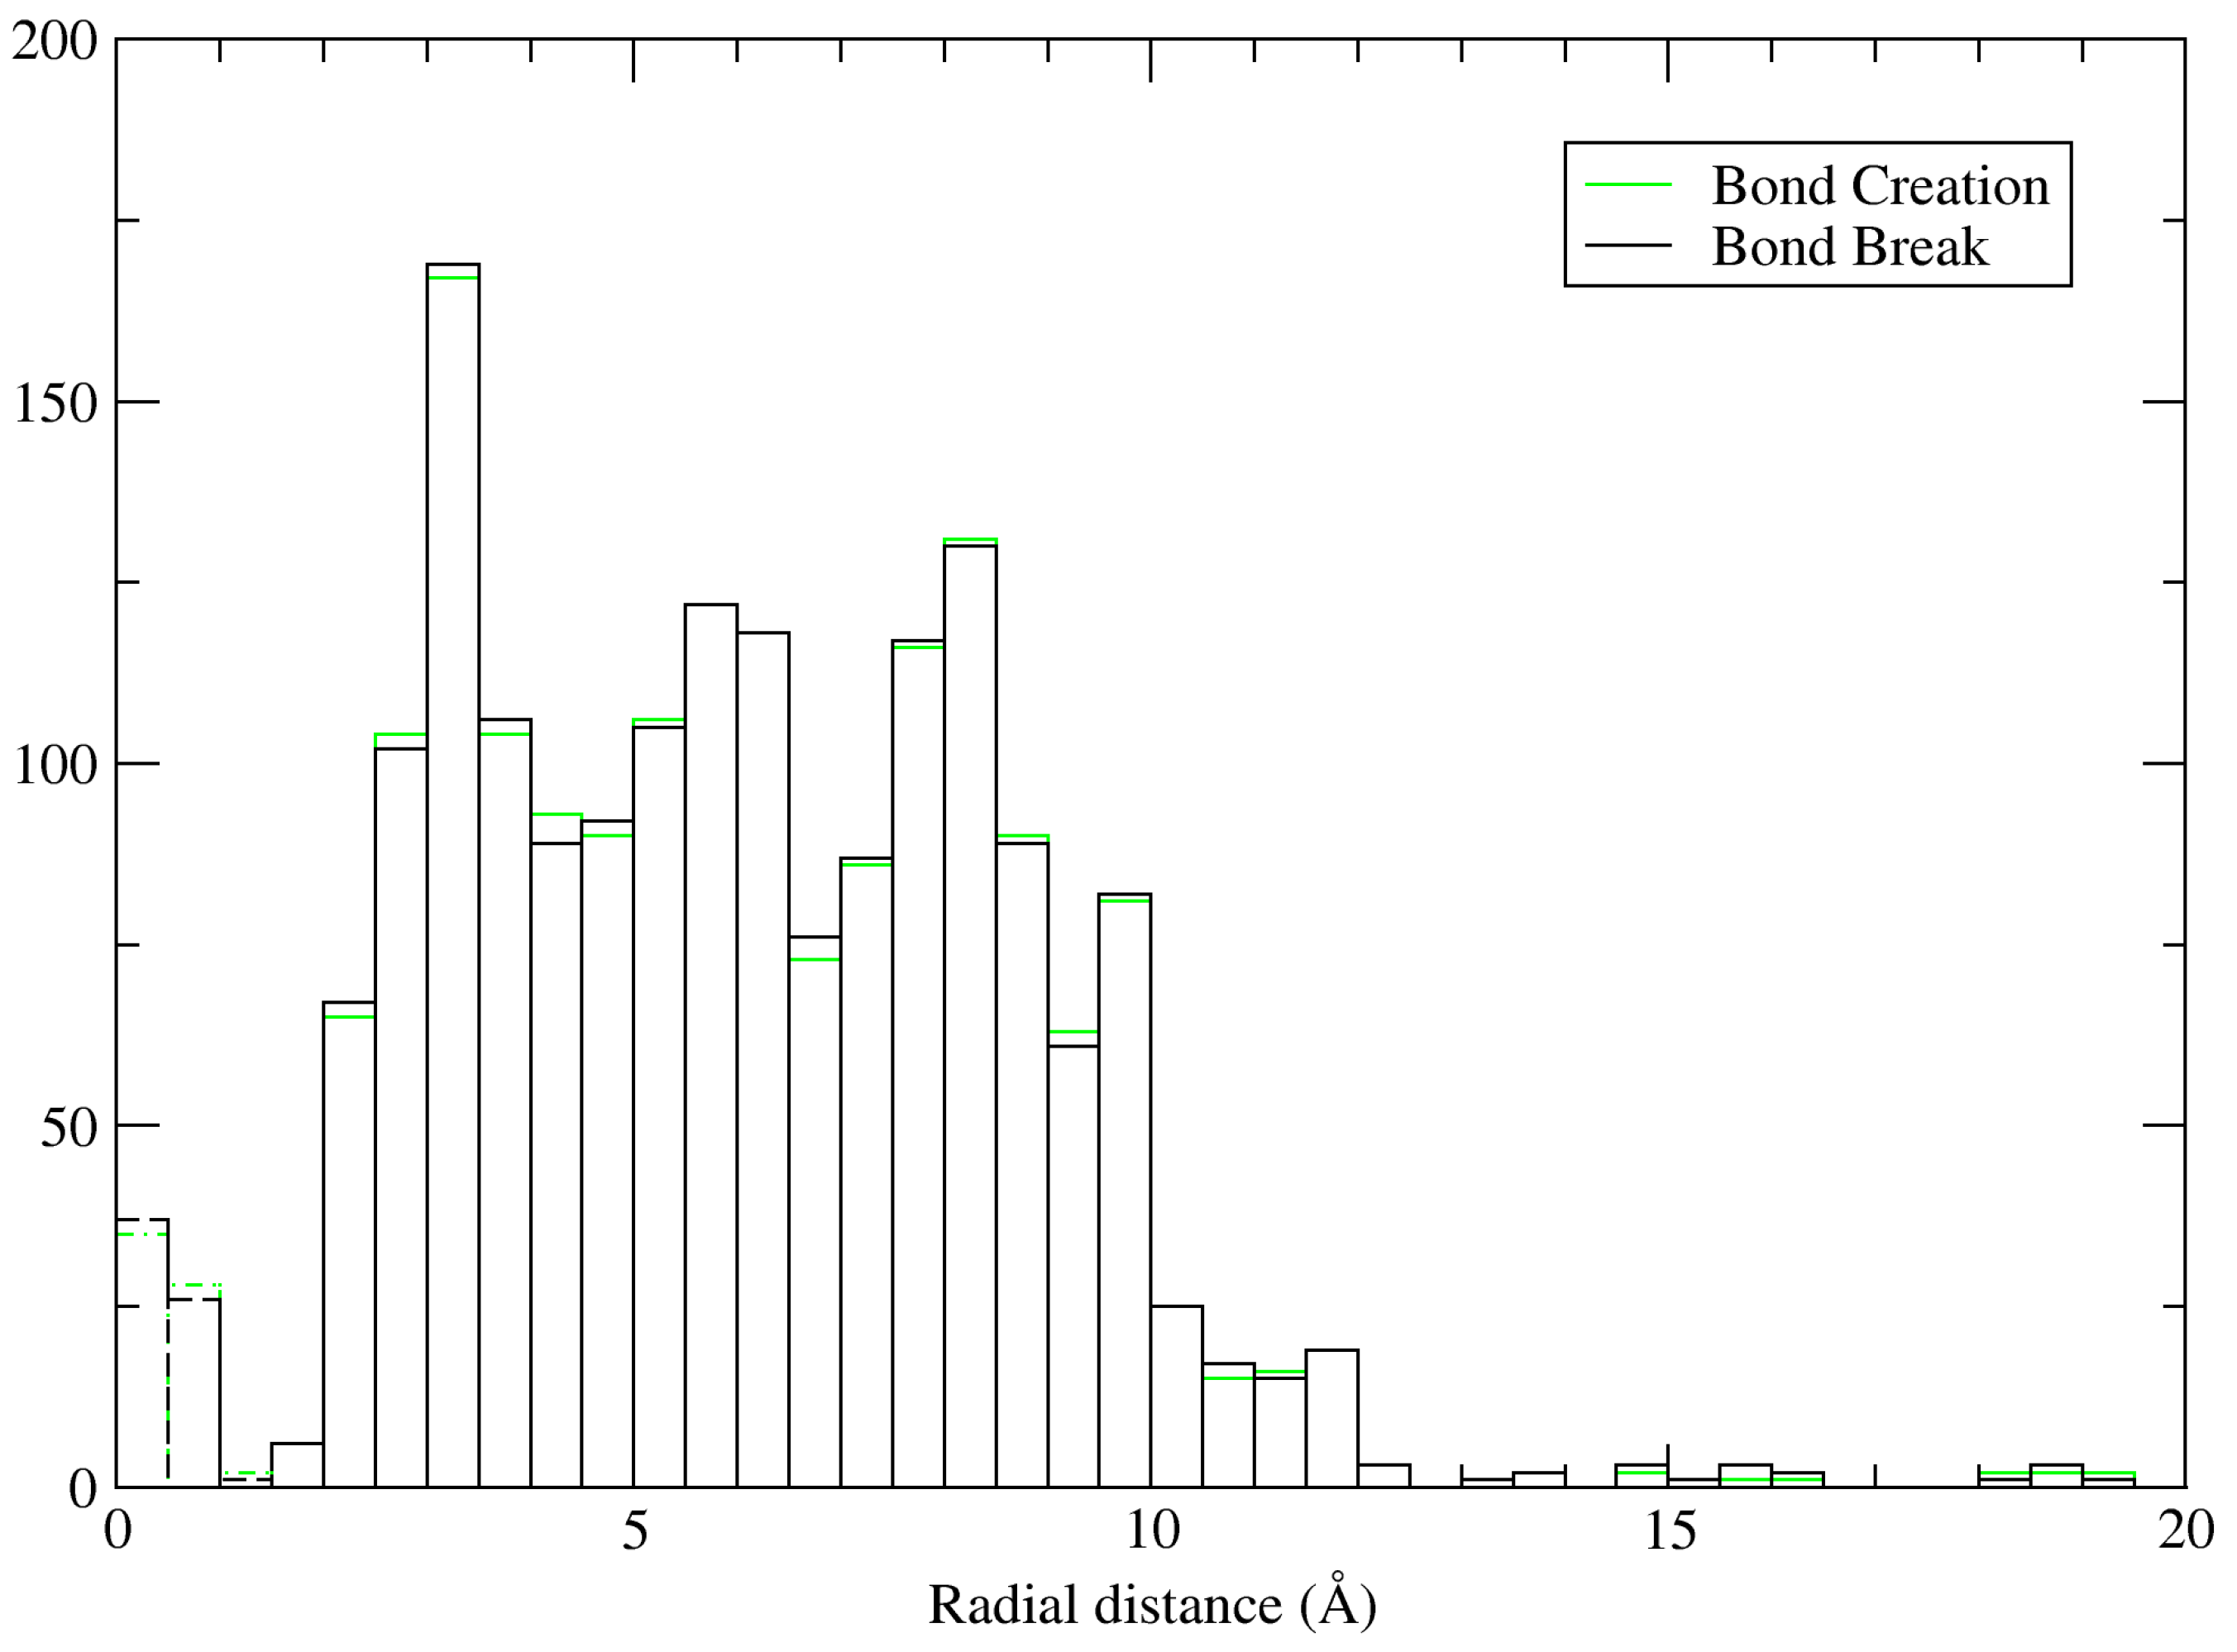
We studied the rates of O–H bond creation and cleavage in the vicinity of the nanoparticle, in order to assess the influence of the surfaces, edges and vertices. This was performed using the following internuclear distance-based criterion: if the internuclear distance between a hydrogen atom and an oxygen atom was previously less than a threshold value rOH and now exceeds it, the bond between them is determined to have been “broken”. The inverse condition was used to determine bond “formation”. Although simplistic, this kind of analysis gives a reasonable approximation of the underlying chemical reaction.
Figure 5 shows a histogram of the bond creation/cleavage events in the nanoparticle system, sorted by distance to the nearest TiO
2 surface atom. The leftmost region, plotted with dashed lines, indicates bond creation/destruction between the surface oxygen atoms and hydrogen. Because this simulation was conducted at a higher temperature than the interfacial systems, and the system is much bigger, a larger number of events were recorded; as a general rule, there was no notable excess of either creation or formation events at any particular distance. The most active region (i.e., the highest peak) occurs at 2.5–3.0 Å from the surface atoms, corresponding to the first layer density peak, followed by 8.0–8.5 Å. The vast majority of events take place within 10 Å. It should be borne in mind that, unlike
Figure 4,
Figure 5 is not repeated periodically nor normalised to shell volume, and, therefore, as the distance increases, so does the volume of the shell and, thus, the number of water molecules contained within.
3.4. Hydrogen Bonding
Using the Luzar–Chandler conditions (i.e., θ
DHA ≤ 30° and r
DHA ≤ 3.0 Å) [
21], we conducted analyses of the hydrogen bonding régime of water molecules around the nanoparticle, and compared them to bulk water and also to the surface slabs.
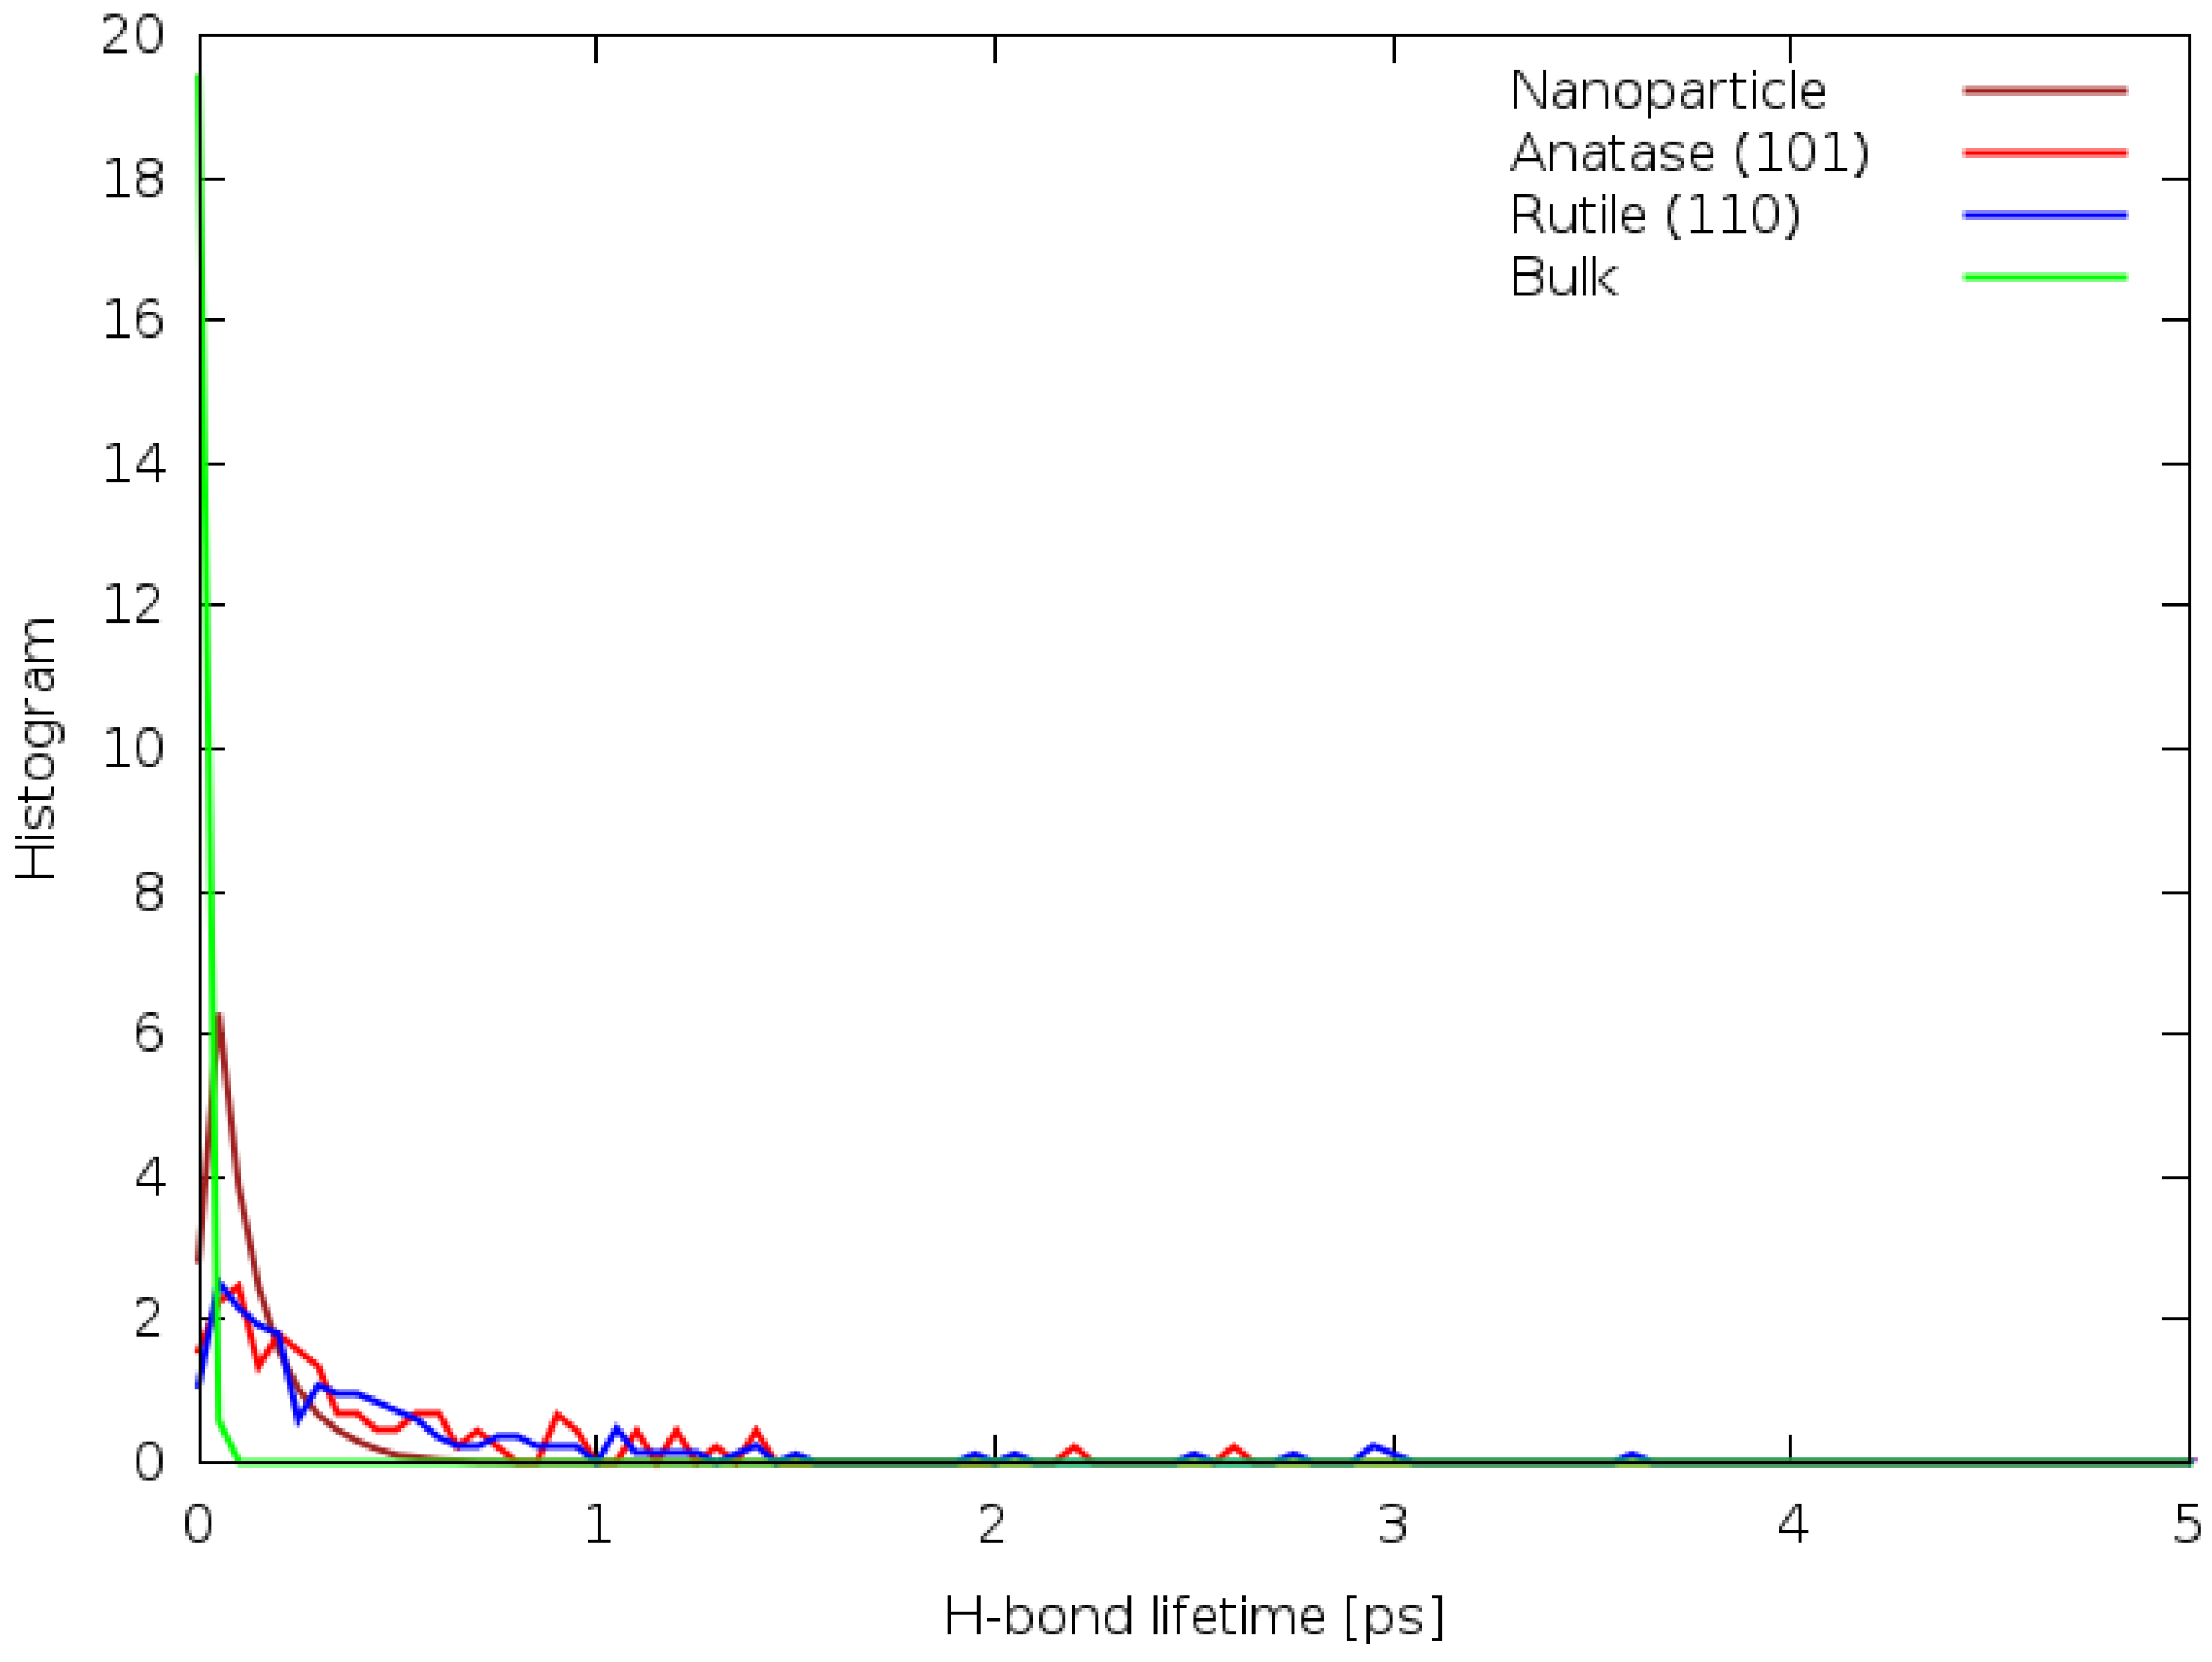
Figure 6 shows the difference between the distributions of hydrogen bond lifetimes.
In the nanoparticle system, the hydrogen bond lifetimes are also very short, all less than 0.5 ps, likely due to the higher temperature of the system. Conversely, in the anatase (101) and rutile (110) systems, some hydrogen bonds have a lifetime of over 2.5 ps. In the bulk DFTB simulation, the average bond lifetime is much smaller than 1 ps, which can be attributed to the lack of stabilising influences (such as a solid interface) to counteract thermal motion. Generally, the average hydrogen bond lifetime in these systems is less than 1 ps, but this is likely affected by the low water density in these systems. This contradicts the results of references [
5,
7], showing the disparity in results between DFTB and more commonly employed molecular dynamics methods.
The average length of hydrogen bonds also varies between the systems, as shown in
Figure 7. In particular, the nanoparticle system, anatase (101) system, and bulk water all have similar hydrogen bond length distributions, which are quite broad, with a slight peak at approximately 2.1 Å. In contrast, the rutile (110) distribution has a sharp peak at slightly less than 2.0 Å and a slowly decaying right tail. Unlike the average hydrogen bond lifetimes, this correlates well to the results of the aforementioned studies, which goes some way to validate the shorter lifetimes observed in
Figure 6. This, in turn, suggests that the behaviour of the water molecules is reasonable, and that these molecules have some increased mobility using DFTB vis-à-vis other methodologies. This also suggests that the inter-molecular structure in at least a subsection of this system (e.g., close to the surface) is relatively constrained compared to the other systems, which supports the hypothesis that the layering effect is much stronger in this system.
3.5. Vibrational Density of States
Despite the relatively short trajectory length of 2 ps, there are sufficient data to calculate the VDOS of water molecules in the nanoparticle system by the Fourier transformation of atomic velocities. The VDOS of hydrogen atoms in the nanoparticle system is shown in
Figure 8.
The most notable feature of
Figure 8 is the immediately apparent emergence of a wide vibrational mode at approximately 1800 cm
−1. This peak is not present in the VDOS obtained from classical MD in our previous studies, nor in other studies, such as [
22,
23,
24]. The existence of this vibrational mode also raises the question of the origin of the narrow peak at just below 1500 cm
−1 in
Figure 8. This peak is only present in the hydrogen VDOS of layered atoms, and could be attributed to the creation of an asymmetric bending mode in adsorbed or partially dissociated molecules. Finnie et al. studied the IR spectra of water molecules adsorbed onto a TiO
2 nanocrystal surface, but made no mention of an additional peak at approximately 1500 cm
−1 [
25], nor of the blue shifting of the bending mode. Probing the origins of this peak using the phonon modes calculation could yield valuable insight into this behaviour.
3.6. Electronic Density of States
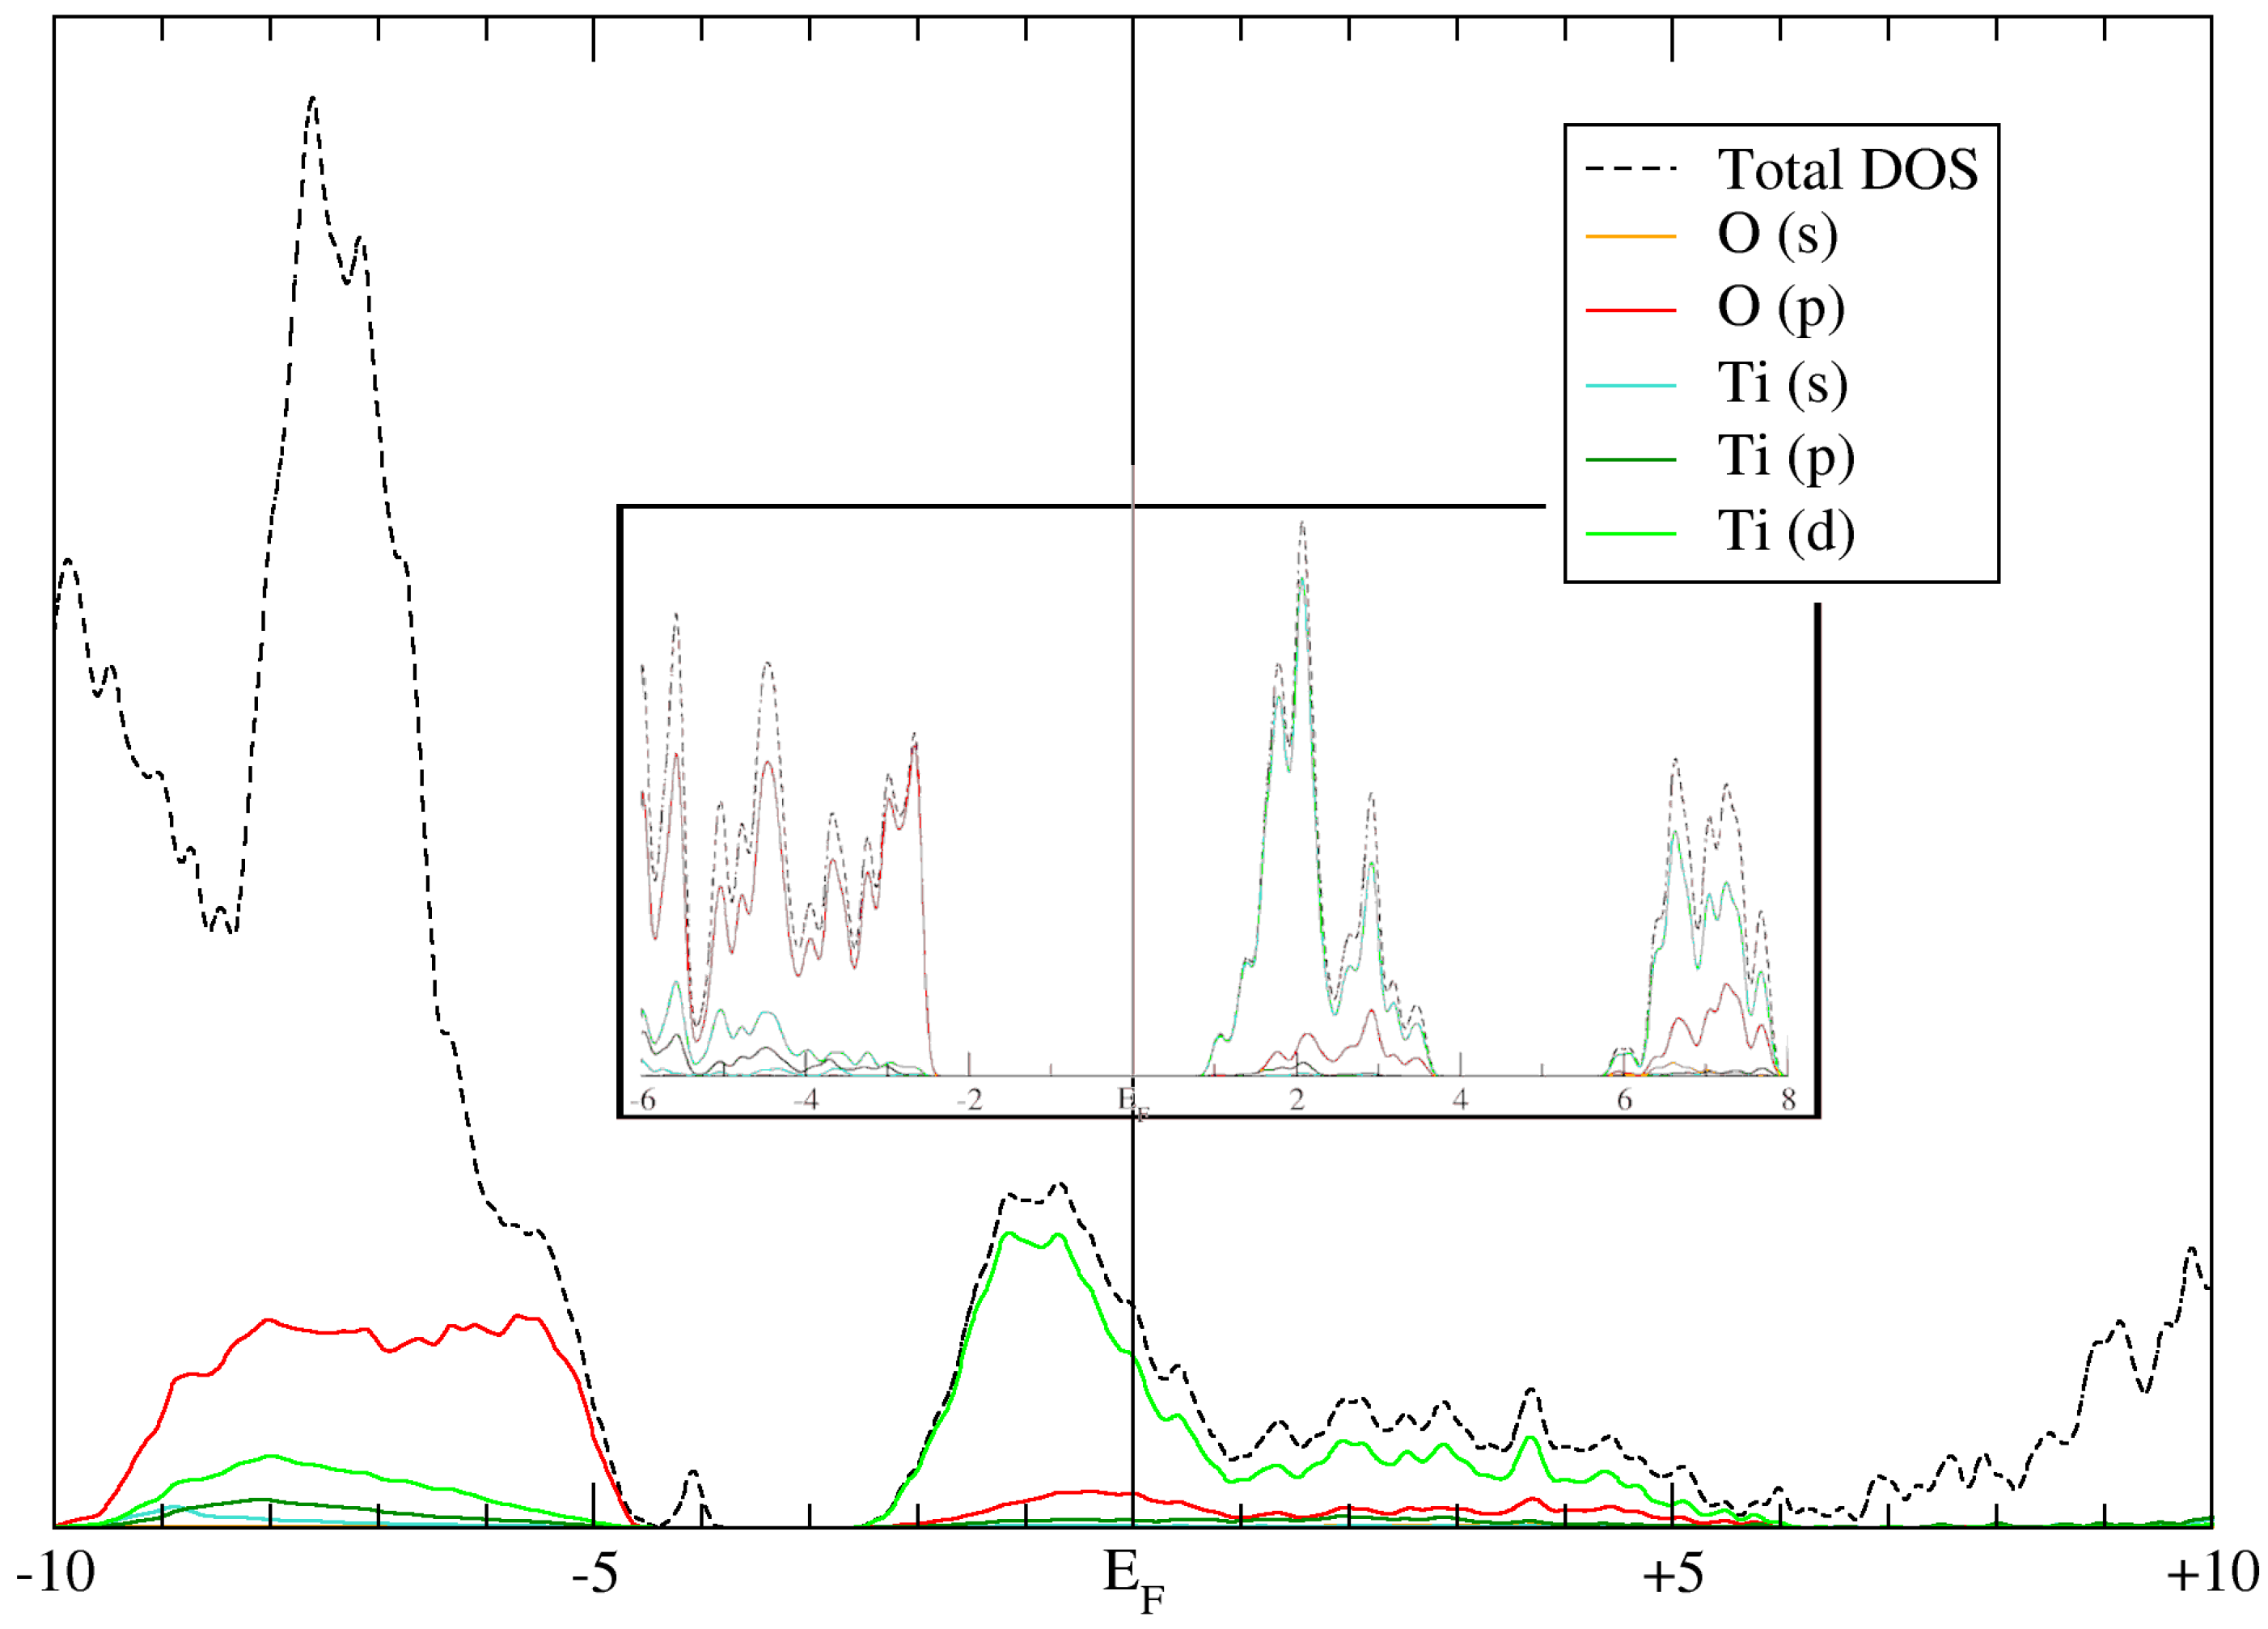
Finally, a key requirement for any electronic structure method is the accurate computation of the band structure and electronic density of states (EDOS) of the system. As the nanoparticle is a finite, zero-dimensional system with artificial periodicity, computing the band structure makes little sense. However, the shell-resolved EDOS is still calculable, and is shown in
Figure 9.
Curiously, the Fermi energy (E
F) of this system is placed in the middle of a band, implying that the system is metallic. This is likely due to the inclusion of water molecule states in the calculation, raising the average energy of the occupied states. From the calculations of the bulk EDOS of anatase (
Figure 9 inset), it can be deduced that the band in which the Fermi energy resides in the solvated nanoparticle system is the conduction band of bulk anatase, as it is primarily composed of Ti d-orbitals. This leads to another interesting observation, as follows: in the total EDOS (dashed black line), a minor peak is present at approximately −4.0 eV, which does not contain any contributions from nanoparticle atoms. If the aforementioned deduction is correct, this peak would represent mid-band states, likely formed by adsorbed oxygen atoms on the TiO
2 surface. These states were not reported previously in DFT calculations of hydrated anatase surfaces [
26]. These mid-band states can play an important role in the water-splitting reaction [
27], and further investigation is necessary to fully understand the nature and origin of this peak.
4. Conclusions
Here, we have presented the results of performing an SCC-DFTB-MD calculation of an explicitly solvated nanoparticle, which represents the application of an electronic structure method on a likely unprecedented scale, which may also be of relevance for the simulation of other emerging nano-phases. We found that, despite the extremely large system size, the simulation behaves well and produces useful data when analysed, such as the formation of water layers at the surface. Additionally, properties such as the electronic density of states and adsorption at the surface are reproduced with greater or equal accuracy when compared to the results of DFT simulations and experimental measurements. The potential applications of the SCC-DFTB-MD method are likely to be relevant to those interested in simulating nano-scale catalysts, as the method contains many of the advantages of DFT, while scaling 101–103 times better. The research presented in this article will hopefully inform these researchers about the advantages of DFTB-based methodologies.
Author Contributions
Conceptualization, N.J.E. and D.O.; methodology, D.O.; formal analysis, D.O.; investigation, D.O.; resources, N.J.E.; data curation, D.O.; writing—original draft preparation, D.O.; writing—review and editing, N.J.E. and D.O.; visualization, D.O.; supervision, N.J.E.; project administration, N.J.E.; funding acquisition, N.J.E. All authors have read and agreed to the published version of the manuscript.
Funding
This work was supported by Science Foundation Ireland and the National Natural Science Foundation of China through grant no. SFI 17/NSFC/5229. Additionally, computational resources for performing the simulation were bestowed by ICHEC, the Irish Centre for High-End Computing, through project no. ndche031c.
Institutional Review Board Statement
Not applicable.
Informed Consent Statement
Not applicable.
Data Availability Statement
The data from this study will be made public by the authors in due course according to the FAIR principles. Please contact the corresponding author for the release of these data.
Conflicts of Interest
The authors declare no conflict of interest. The funders had no role in the design of the study; in the collection, analyses, or interpretation of data; in the writing of the manuscript, or in the decision to publish the results.
References
- Burg, D.; Ausubel, J.H. Moore’s Law revisited through Intel chip density. PLoS ONE 2021, 16, e0256245. [Google Scholar] [CrossRef]
- Koskinen, P.; Mäkinen, V. Density-functional tight-binding for beginners. Comput. Mater. Sci. 2009, 47, 237–253. [Google Scholar] [CrossRef] [Green Version]
- O’Carroll, D.; Martinez-Gonzalez, J.A.; English, N.J. Coherency spectral analysis of interfacial water at TiO2 surfaces. Mol. Simul. 2020, 1–10. [Google Scholar] [CrossRef]
- O’Carroll, D.; English, N.J. Self-ordering water molecules at TiO2 interfaces: Advances in structural classification. J. Chem. Phys. 2020, 153, 064502. [Google Scholar] [CrossRef]
- Futera, Z.; English, N.J. Exploring Rutile (110) and Anatase (101) TiO2 Water Interfaces by Reactive Force-Field Simulations. J. Phys. Chem. C 2017, 121, 6701–6711. [Google Scholar] [CrossRef]
- Futera, Z.; English, N.J. Electric-Field Effects on Adsorbed-Water Structural and Dynamical Properties at Rutile- and Anatase-TiO2 Surfaces. J. Phys. Chem. C 2016, 120, 19603–19612. [Google Scholar] [CrossRef]
- English, N.J.; Kavathekar, R.S.; MacElroy, J.M.D. Hydrogen bond dynamical properties of adsorbed liquid water monolayers with various TiO2 interfaces. Mol. Phys. 2012, 110, 2919–2925. [Google Scholar] [CrossRef]
- Selli, D.; Fazio, G.; Seifert, G.; Di Valentin, C. Water Multilayers on TiO2 (101) Anatase Surface: Assessment of a DFTB-Based Method. J. Chem. Theory Comput. 2017, 13, 3862–3873. [Google Scholar] [CrossRef] [Green Version]
- Selli, D.; Fazio, G.; Di Valentin, C. Using Density Functional Theory to Model Realistic TiO2 Nanoparticles, Their Photoactivation and Interaction with Water. Catalysts 2017, 7, 357. [Google Scholar] [CrossRef] [Green Version]
- Luschtinetz, R.; Frenzel, J.; Milek, T.; Seifert, G. Adsorption of Phosphonic Acid at the TiO2 Anatase (101) and Rutile (110) Surfaces. J. Phys. Chem. C 2009, 113, 5730–5740. [Google Scholar] [CrossRef]
- Hourahine, B.; Aradi, B.; Blum, V.; Bonafé, F.; Buccheri, A.; Camacho, C.; Cevallos, C.; Deshaye, M.Y.; Dumitric, T.; Dominguez, A.; et al. DFTB+, a software package for efficient approximate density functional theory based atomistic simulations. J. Chem. Phys. 2020, 152, 124101. [Google Scholar] [CrossRef] [PubMed]
- Ong, S.P.; Richards, W.D.; Jain, A.; Hautier, G.; Kocher, M.; Cholia, S.; Gunter, D.; Chevrier, V.L.; Persson, K.A.; Ceder, G. Python Materials Genomics (pymatgen): A robust, open-source python library for materials analysis. Comput. Mater. Sci. 2013, 68, 314–319. [Google Scholar] [CrossRef] [Green Version]
- Rahm, J.M.; Erhart, P. WulffPack: A Python package for Wulff constructions. J. Open Source Softw. 2020, 5, 1944. [Google Scholar] [CrossRef]
- Yu, V.W.; Campos, C.; Dawson, W.; García, A.; Havu, V.; Hourahine, B.; Huhn, W.P.; Jacquelin, M.; Jia, W.; Keçeli, M.; et al. ELSI—An open infrastructure for electronic structure solvers. Comput. Phys. Commun. 2020, 256, 107459. [Google Scholar] [CrossRef]
- Aradi, B.; Niklasson, A.M.N.; Frauenheim, T. Extended Lagrangian Density Functional Tight-Binding Molecular Dynamics for Molecules and Solids. J. Chem. Theory Comput. 2015, 11, 3357–3363. [Google Scholar] [CrossRef]
- Hjorth Larsen, A.; Jørgen Mortensen, J.; Blomqvist, J.; Castelli, I.E.; Christensen, R.; Dułak, M.; Friis, J.; Groves, M.N.; Hammer, B.; Hargus, C.; et al. The atomic simulation environment—A Python library for working with atoms. J. Phys. Condens. Matter 2017, 29, 273002. [Google Scholar] [CrossRef] [Green Version]
- Henderson, M.A. An HREELS and TPD study of water on TiO2(110): The extent of molecular versus dissociative adsorption. Surf. Sci. 1996, 355, 151–166. [Google Scholar] [CrossRef]
- Tilocca, A.; Selloni, A. Structure and Reactivity of Water Layers on Defect-Free and Defective Anatase TiO2(101) Surfaces. J. Phys. Chem. B 2004, 108, 4743–4751. [Google Scholar] [CrossRef]
- Deshmukh, S.A.; Sankaranarayanan, S.K.R.S. Atomic scale characterization of interfacial water near an oxide surface using molecular dynamics simulations. Phys. Chem. Chem. Phys. 2012, 14, 15593–15605. [Google Scholar] [CrossRef]
- Kavathekar, R.S.; English, N.J.; MacElroy, J.M.D. Spatial distribution of adsorbed water layers at the TiO2 rutile and anatase interfaces. Chem. Phys. Lett. 2012, 554, 102–106. [Google Scholar] [CrossRef]
- Luzar, A.; Chandler, D. Structure and hydrogen bond dynamics of water–dimethyl sulfoxide mixtures by computer simulations. J. Chem. Phys. 1993, 98, 8160–8173. [Google Scholar] [CrossRef] [Green Version]
- Zhou, G.; Liu, C.; Huang, L. Molecular Dynamics Simulation of First-Adsorbed Water Layer at Titanium Dioxide Surfaces. J. Chem. Eng. Data 2018, 63, 2420–2429. [Google Scholar] [CrossRef]
- Patel, M.; Mallia, G.; Liborio, L.; Harrison, N.M. Water adsorption on rutile TiO2(110) for applications in solar hydrogen production: A systematic hybrid-exchange density functional study. Phys. Rev. B Condens. Matter Mater. Phys. 2012, 86, 045302. [Google Scholar] [CrossRef]
- Raju, M.; Kim, S.Y.; Van Duin, A.C.T.; Fichthorn, K.A. ReaxFF reactive force field study of the dissociation of water on titania surfaces. J. Phys. Chem. C 2013, 117, 10558–10572. [Google Scholar] [CrossRef]
- Finnie, K.S.; Cassidy, D.J.; Bartlett, J.R.; Woolfrey, J.L. IR Spectroscopy of Surface Water and Hydroxyl Species on Nanocrystalline TiO2 Films. Langmuir 2001, 17, 816–820. [Google Scholar] [CrossRef]
- Sotoudeh, M.; Abbasnejad, M.; Mohammadizadeh, M.R. First principles study of hydrogen doping in anatase TiO2. Eur. Phys. J. Appl. Phys. 2014, 67, 30401. [Google Scholar] [CrossRef]
- Di Valentin, C.; Pacchioni, G.; Selloni, A. Electronic Structure of Defect States in Hydroxylated and Reduced RutileTiO2(110) Surfaces. Phys. Rev. Lett. 2006, 97, 166803. [Google Scholar] [CrossRef] [PubMed]
| Publisher’s Note: MDPI stays neutral with regard to jurisdictional claims in published maps and institutional affiliations. |
© 2022 by the authors. Licensee MDPI, Basel, Switzerland. This article is an open access article distributed under the terms and conditions of the Creative Commons Attribution (CC BY) license (https://creativecommons.org/licenses/by/4.0/).


