Article

Hybrid Coded Excitation of the Torsional Guided Wave Mode T(0,1) for Oil and Gas Pipeline Inspection

1
NSIRC, TWI Ltd., Cambridge CB21 6AL, UK
2
Department of Electronic and Computer Engineering, Brunel University London, London UB8 3PH, UK
3
Department of Mechanical Engineering, University of Bristol, Bristol BS8 1TR, UK
4
Department of Automation, Dalian Ocean University, Dalian 116023, China
*
Author to whom correspondence should be addressed.
Appl. Sci. 2022, 12(2), 777; https://doi.org/10.3390/app12020777
Submission received: 15 December 2021 / Revised: 7 January 2022 / Accepted: 9 January 2022 / Published: 13 January 2022

Abstract

:
Ultrasonic guided wave testing is an essential technique in non-destructive testing for structural integrity of oil and gas pipelines. This technique, based on the pulse-echo method, is often used for the long-range detection of pipelines at any location. However, guided waves suffer from high attenuation when they propagate in attenuative material structures and multiple wave modes due to the excitation, which reduces the power of echo signals and induces corruption caused by coherent noise. In this paper, a developed hybrid coded excitation method that uses the convolution of a Barker code and Golay code pair is proposed and applied for an ultrasonic guided wave testing system to excite the torsional guided wave mode T(0,1) in a steel pipe. The proposed method combines the advantages of these two coding methods and increases the flexibility of code lengths. The performance is evaluated by signal to noise ratio and peak sidelobe level of the processed signal. Both theoretical simulations and experiments have investigated using the proposed codes composed of Barker codes and Golay code pairs of different lengths and combinations. The experimental results show the significant improvement of the signal to noise ratio and the peak sidelobe level due to the proposed hybrid code usage for the excitation of guided waves. The values are further improved to around 32 dB and around −24 dB, respectively. Overall, the proposed hybrid coded method for improving the echo SNR can benefit from guided wave testing to reduce coherent and random noise levels and many other potential applications.

1. Introduction

Ultrasonic guided wave testing is an important method of non-destructive testing (NDT) techniques because of its potential to evaluate the durability, the physical and mechanical properties of pipelines [1]. This method is widely used to test pipeline integrity over a long distance from any location [2]. Different types of guided waves can propagate in any bounded medium, such as the well-known Rayleigh (surface) waves or the Lamb waves on plates [3]. An array has many transducers used in a pulse-echo mode installed around the pipe circumference to excite signals in low frequencies of ultrasound at any inspection location. The purpose is to generate a single axisymmetric wave pattern. However, guided waves suffer from high attenuation when they propagate in attenuative material pipes and multiple modes due to the excitation, which reduces the power of echo signals and induces corruption caused by coherent noise [4]. Therefore, the excitation amplitude of input signals needs to be enhanced to acquire featured signal responses.
For industrial purposes, many of these pipelines need to carry explosive and flammable material such as oil or natural gas. The common inspection systems are not suitable due to the high voltage (typical above 50 Volts) used by the pulsing circuitry. It may has high possibility of dangerous to cause high-voltage sparks, even a potential risk to create a fire or explosion [5]. The problem must be solved in a safe manner. Therefore, an inspection system operated by low-voltage ultrasound is required in these specific application environments. Another critical point of industrial interest is to develop an innovative technique for fault detection in pressurized pipes. It is the case of the Transient Test-Based Techniques (TTBTs). Even if in the last two decades they have been used mainly for water pipes, it can be used for any fluid. Transient Test-Based Techniques identify leaks and other possible faults (e.g., partial blockages, and pipe wall deteriorations) straightforwardly on the basis of the measured reflected pressure waves [6,7]. It is worth noting that, with respect to other techniques, TTBTs are very attractive since the duration of the test is very short and they allow detecting also devious defects (e.g., partial blockages, illegal branches) which do not give rise to any exterior sign. Moreover, small, but sharp, amplitude pressure waves allow reliable fault detection [8]. Therefore, it is also necessary to use advanced signal processing methods for improving the transient signal performance, such as its the signal-to-noise ratio (SNR) or others.
Generally, there are many techniques to improve the inspection system performance by increasing the SNR, such as wavelet transform, pulse compression and so on. In the case of poor SNR, it is tough for wavelet transform to filter the signal coefficients in every decomposition layer effectively, which may cause the denoising failure [9]. The pulse-compression technique is commonly used by radar, sonar and echography to enhance the echo SNR. This method depends on a combination of cross-correlation with a reference signal [10]. There are two modulation methods in pulse compression, including frequency modulation and phase modulation. Coded excitation is phase modulation on a pulse. Takeuchi first proposed the technique applied to medical ultrasound imaging systems in 1979 [11]. However, there are few studies within the literature on coded excitation in recent years due to the time-bandwidth limitation of this technique. O’Donnell considered using coded excitation to ultrasound system for improving the SNR [12]. Afterwards, the digital beamforming with signal compression was used in the ultrasound system. Later, Jedwab and Parker gave a general construction for an odd length binary Golay sequence pair of length 26 from a Barker sequence of length 13 and a related Barker sequence of length 11 [13]. However, their work focused on the theoretical research for coded excitation only.
Kim et al. proposed a combined coded excitation method by modulating Golay code sequence with Barker sequence for ultrasound imaging [14]. The combined codes, which are 3-bit Barker code, 8-bit Golay code pair and 3-bit Barker code modulated 4-bit Golay code pair, were used in their ultrasound imaging experiments. Recently, Wang and Cong proposed a new pseudo-Chirp-Barker-Golay (PCBG) coded excitation method for ultrasound imaging [15]. They used the Field II toolbox to simulate phantom and cyst phantom of B-mode image. The research for the usage of modulated codes is the most popular in ultrasound imaging applications now. In their research, the combined sequences of codes have relatively low sidelobe levels and high main lobe level. Meanwhile, their lengths are easily tuned. That means the combined coded pulse compression algorithm is practically promising to reduce the coherent noise level at a higher resolution and SNR of the inspection systems. S Hedayatrasa et al. [16] proposed a frequency-phase modulation method based on Barker code sequence. This method enhances the depth resolution and the experiment on glass fiber reinforced polymer demonstrated their robustness at various noise levels. L De Marchi et al. [17] applied the Gold sequence to code the guided wave actuation pulses for reducing the coherent noise caused by multiple transducers.
In this paper, a hybrid coded excitation method that uses a designed sequence of a Barker code convolution Golay code pair (BCG) is developed to improve the echo SNR of ultrasonic guided wave testing systems. The technique combines the advantages of these two coding methods and increases the diversity of code lengths. The technique performance will be evaluated by SNR and peak sidelobe level (PSL) of the processed signals. The main contributions of this paper are presented as follows:
  • The developed hybrid coded excitation technique is applied to the guided wave mode excitation for pipe inspection for the first time.
  • The proposed method has been theoretically evaluated that has better performance than other common techniques.
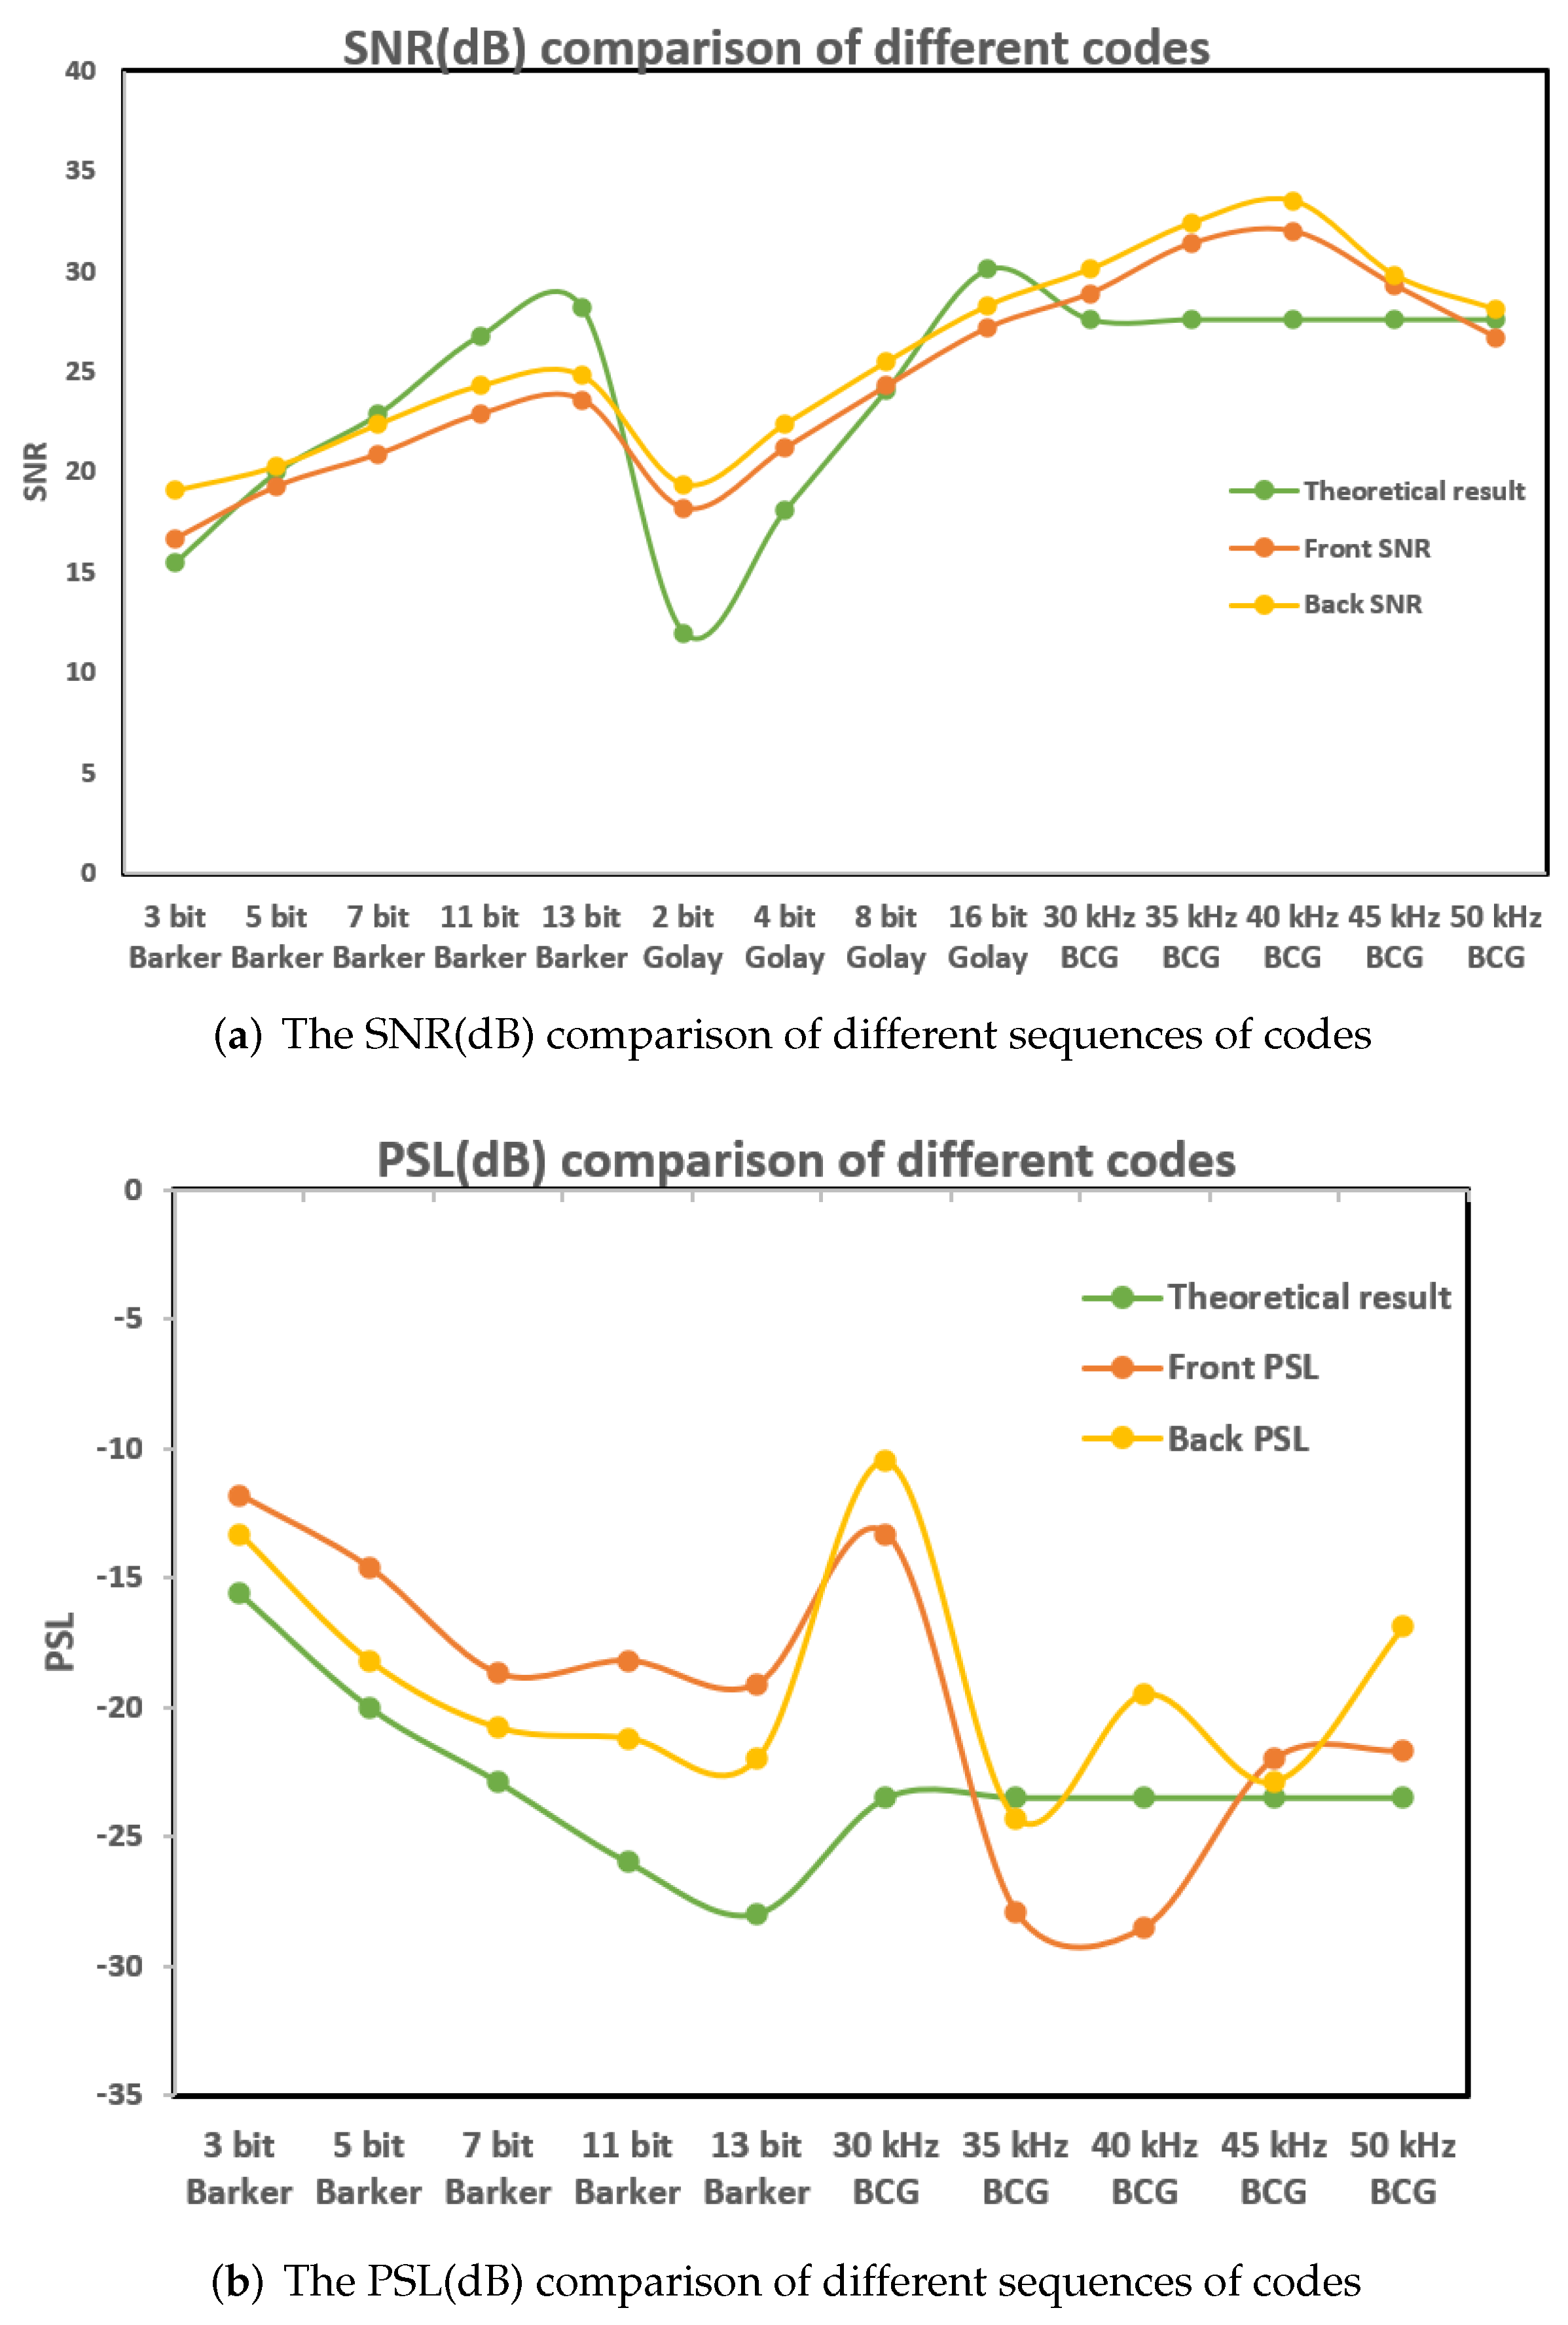
  • The experimental results that the proposed method has the best echo SNR and PSL at various frequencies (30 kHz–50 kHz).
  • This work can be extended to other potential applications for a significant SNR improvement.
The rest of this paper is organised as follows. First, we generate the dispersion curves of wave modes at frequencies of interest and code generation and compression are presented in Section 2. Then, Section 2 also illustrated the methodology and its superiority. Next, the experimental set-up and data analysis are described in Section 3. Finally, Section 4 gives the discussions and conclusions.

2. Methodology

To verify the feasibility of proposed coded excitation method for guided wave testing in pipes, the related dispersion curves of wave modes should be studied first. To obtain the transmitted sequence and estimate the transmitted signal performance, the proposed coded excitation generation and compression need to be investigated.

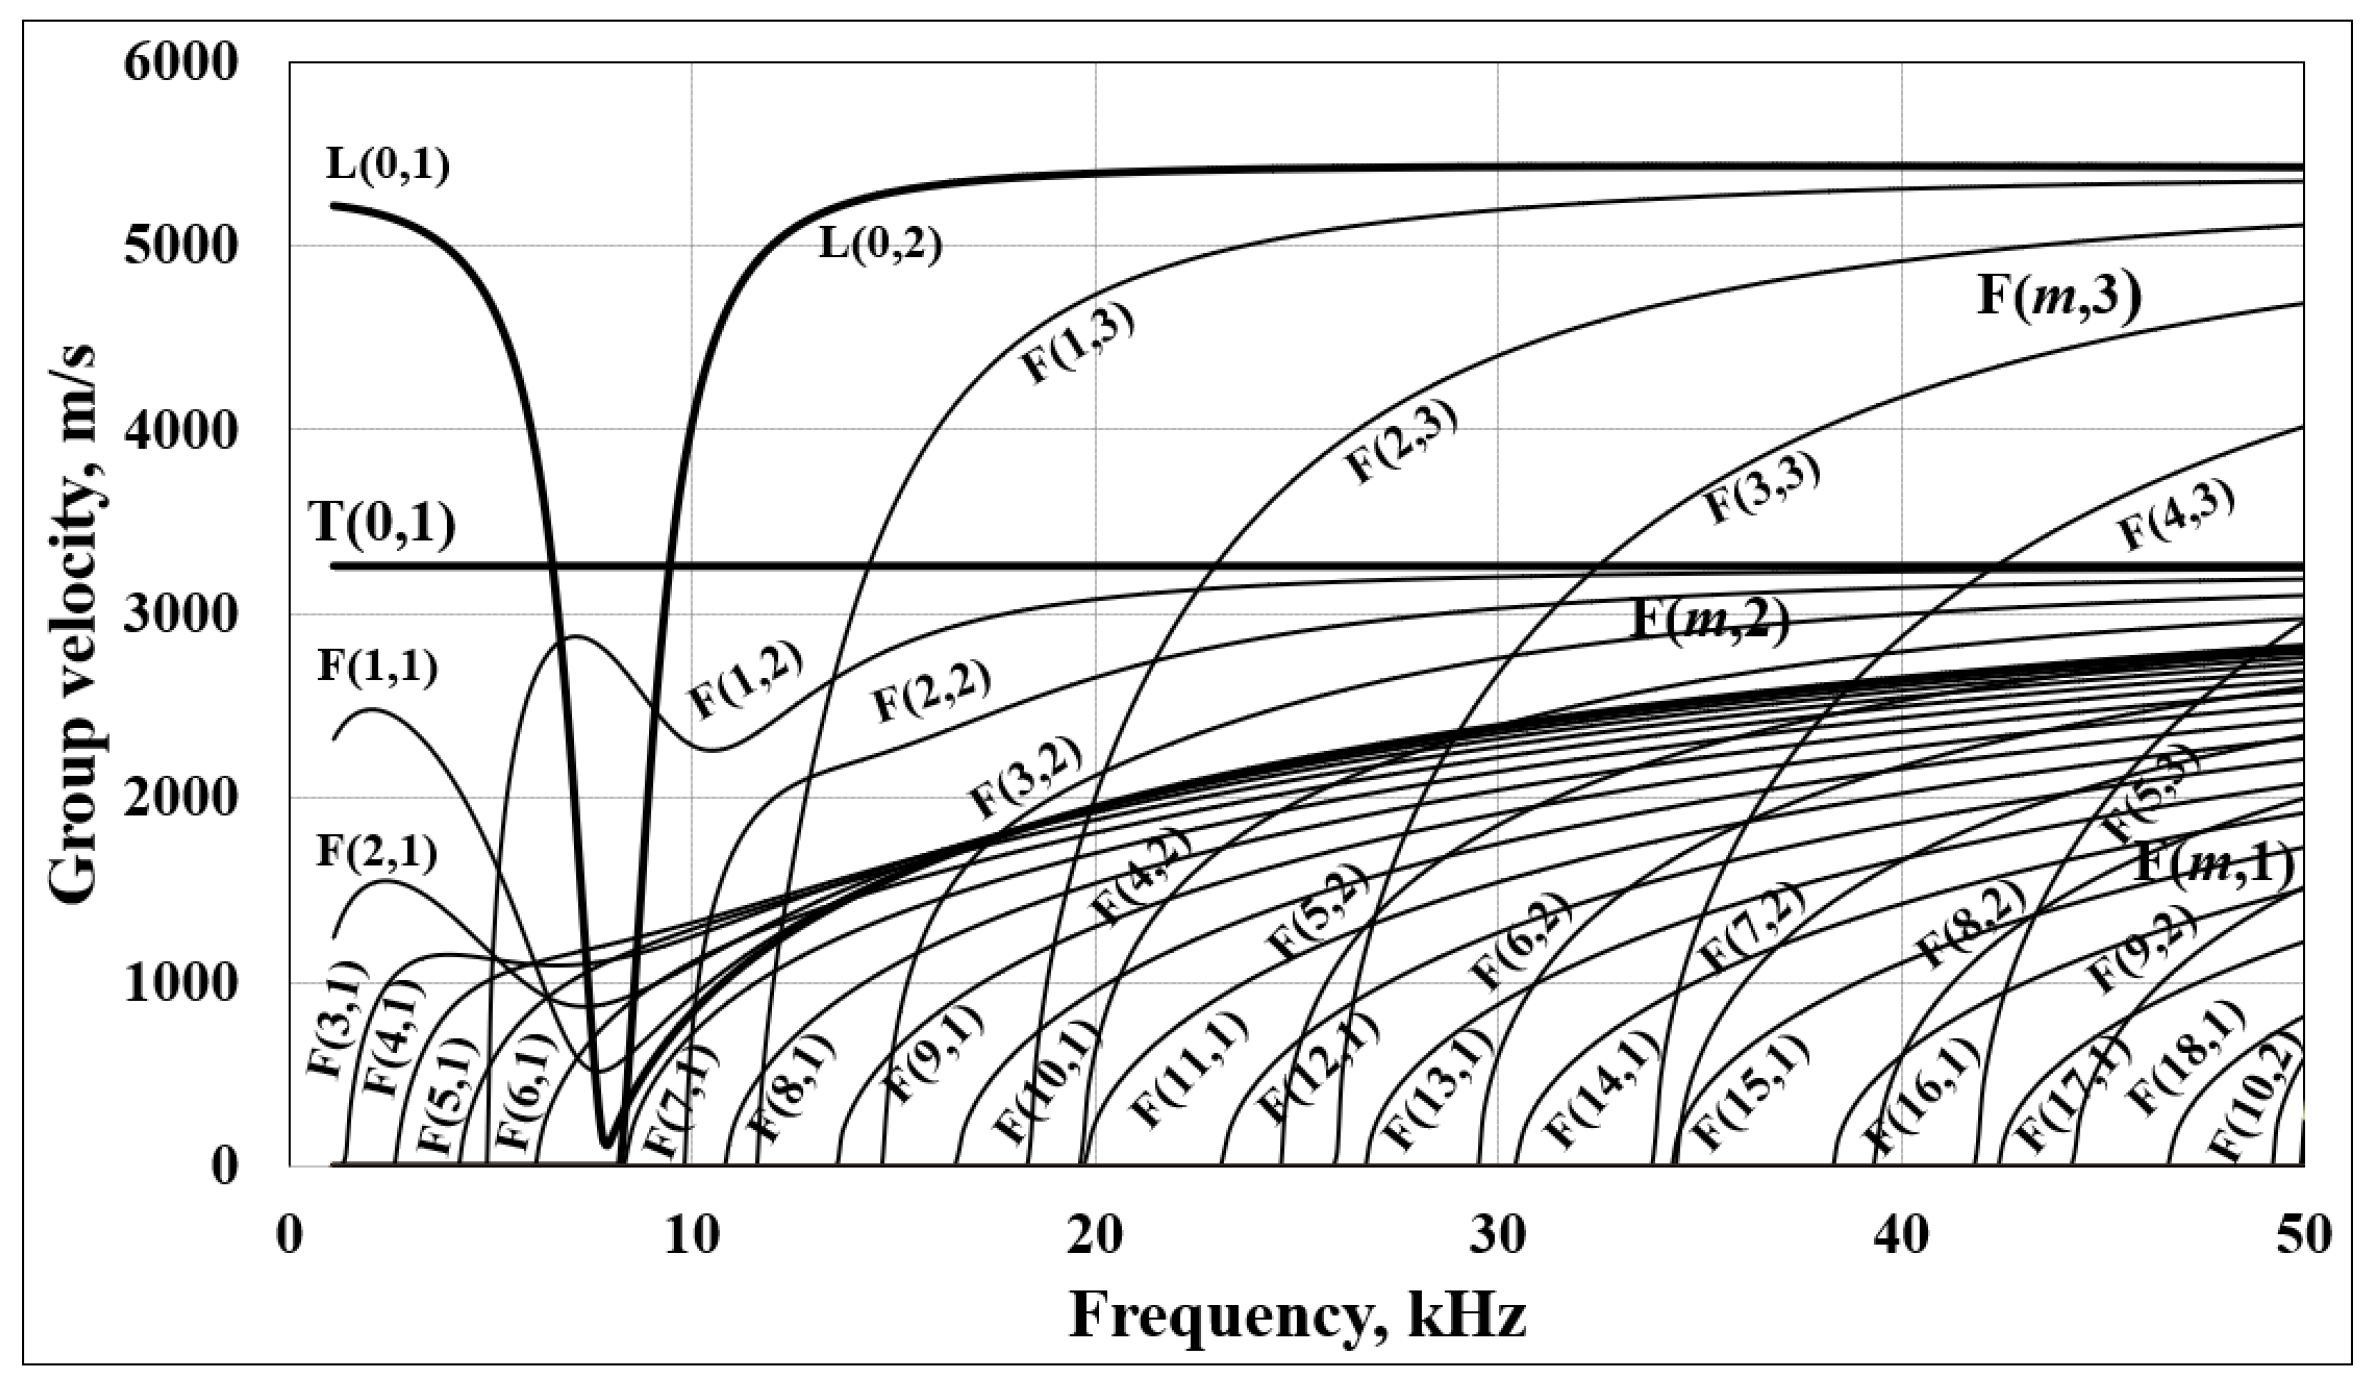
2.1. Dispersion Curves

When measuring over a long-range distance with ultrasound guided waves, the wave modes are excited at a low-frequency range between 20 kHz to 100 kHz [18]. Guided waves exist multi-modal orders and dispersed when they propagate along a cylindrical structure [19].
There are three main families of waves in a pipe, which are longitudinal, torsional and flexural. In these three families of wave modes, only longitudinal and torsional are axisymmetric. Silk and Bainton established a nomenclature of X ( m , n ) to describe these [20]. The X represents a letter (L, T, or F, for longitudinal, torsional or flexural, respectively) that relates to characteristics of the individual wave modes. The m is a positive integer used to identify harmonic changes in displacement around a pipe or the circumference of a pipe-like structure, and n is an index indicating how it occurs. In field tests, the actual results are normally different from the ideal. Due to the imperfections of equipment and the mode conversion caused by the non-axisymmetric structure on the internal material or geometry, the actual received signal will not be a pure axisymmetric wave but a mixed wave [21]. In addition to the multi-modal nature of guided wave propagation may also exhibit amplitude dispersion, but this situation will lead the energy diffusion signal in space and time at a period of propagation [22]. Unlike other waves, the T(0,1) mode is non-dispersive over the entire frequency range, so the T(0,1) mode is often used for detection in practical applications [21,23].
The effective characteristics of displacement shapes are generated using the semi-analytical finite element method [24]. Figure 1 presents the group velocity dispersion curves for an 8-inch (219.1 mm outer diameter) and schedule 40 (8.18 mm wall thickness) steel pipes. Longitudinal axisymmetric modes of L(0,1) and L(0,2) are also a zeroth circumferential order with first and second mode shapes, respectively. Non-axisymmetric flexural modes (up to m = 1) of F(1,1), F(1,2) and F(1,3) are a first circumferential order with a first, a second and a third mode shapes, respectively.

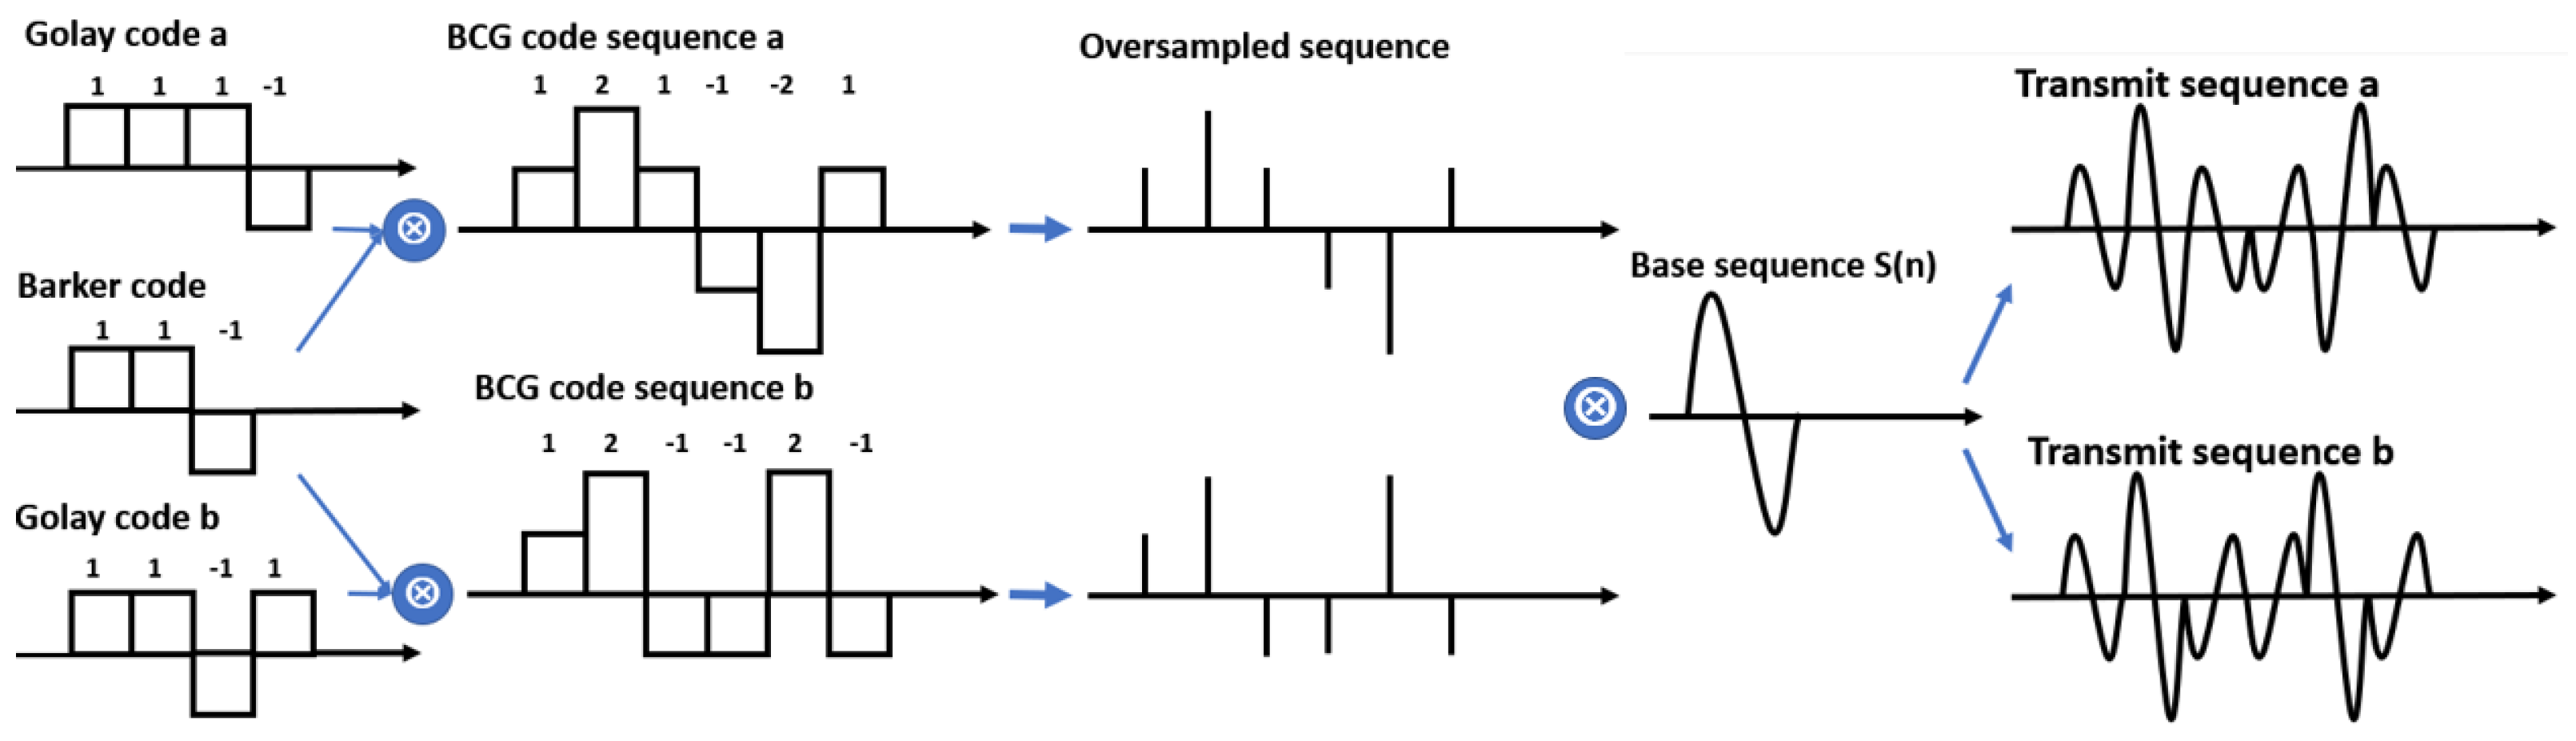
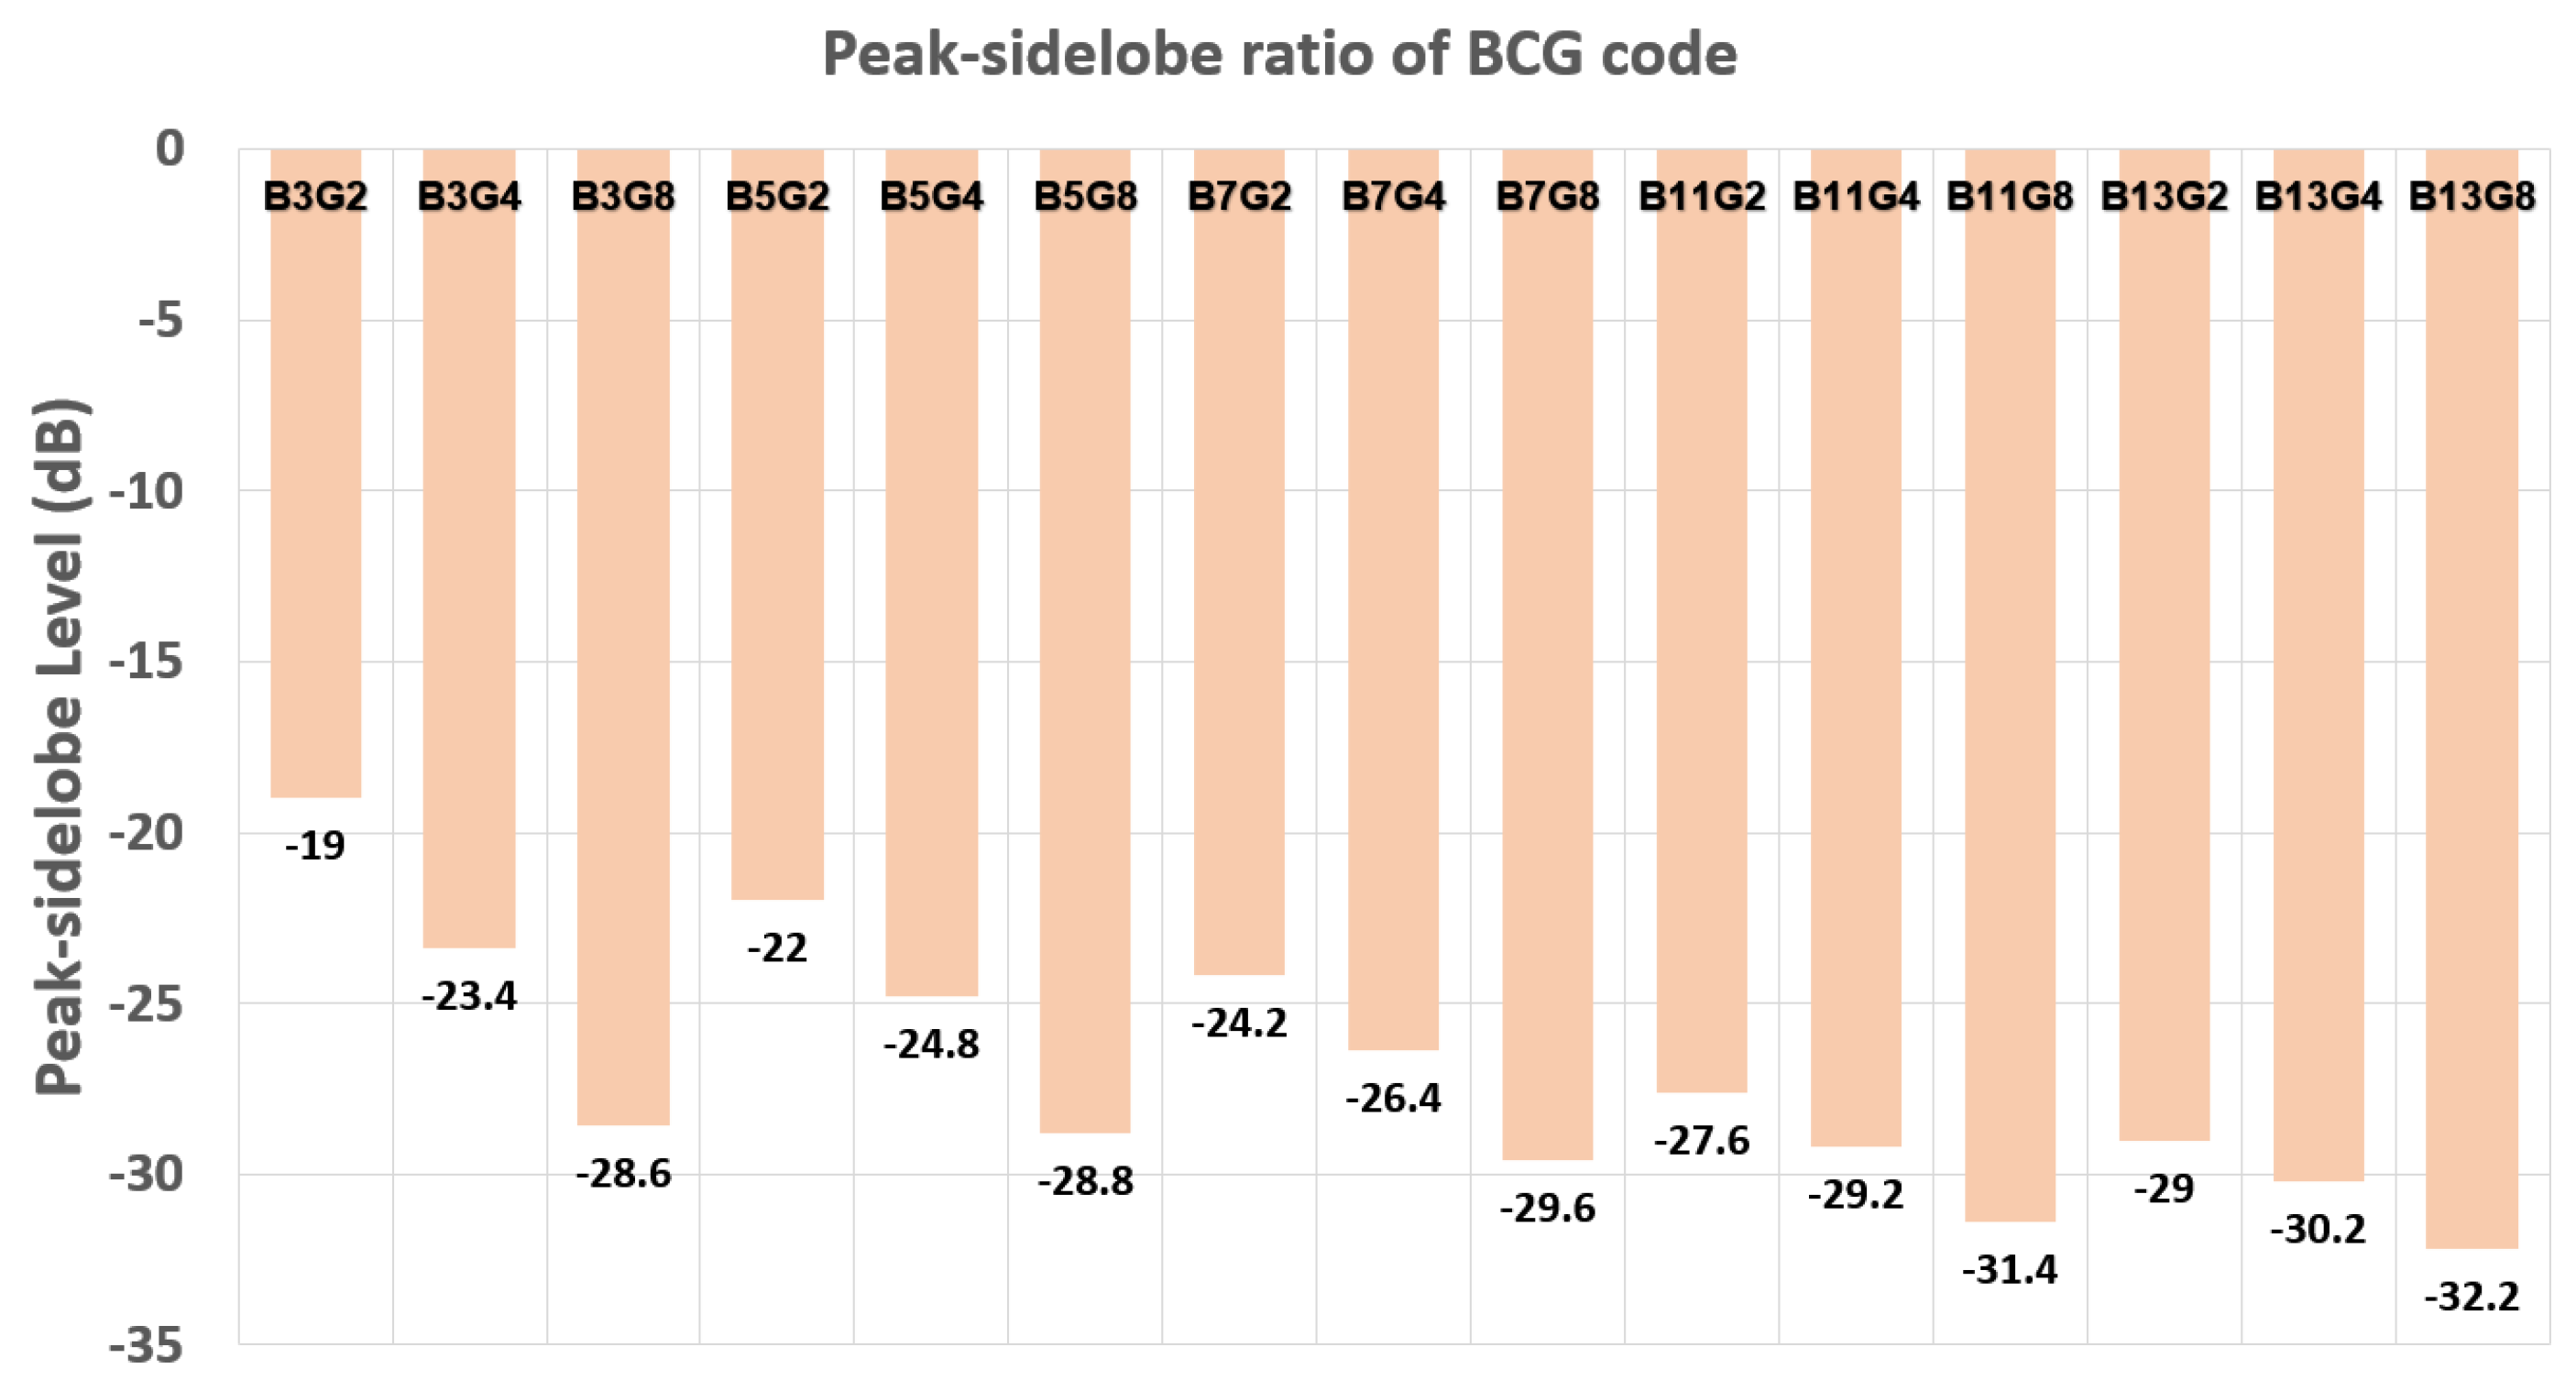
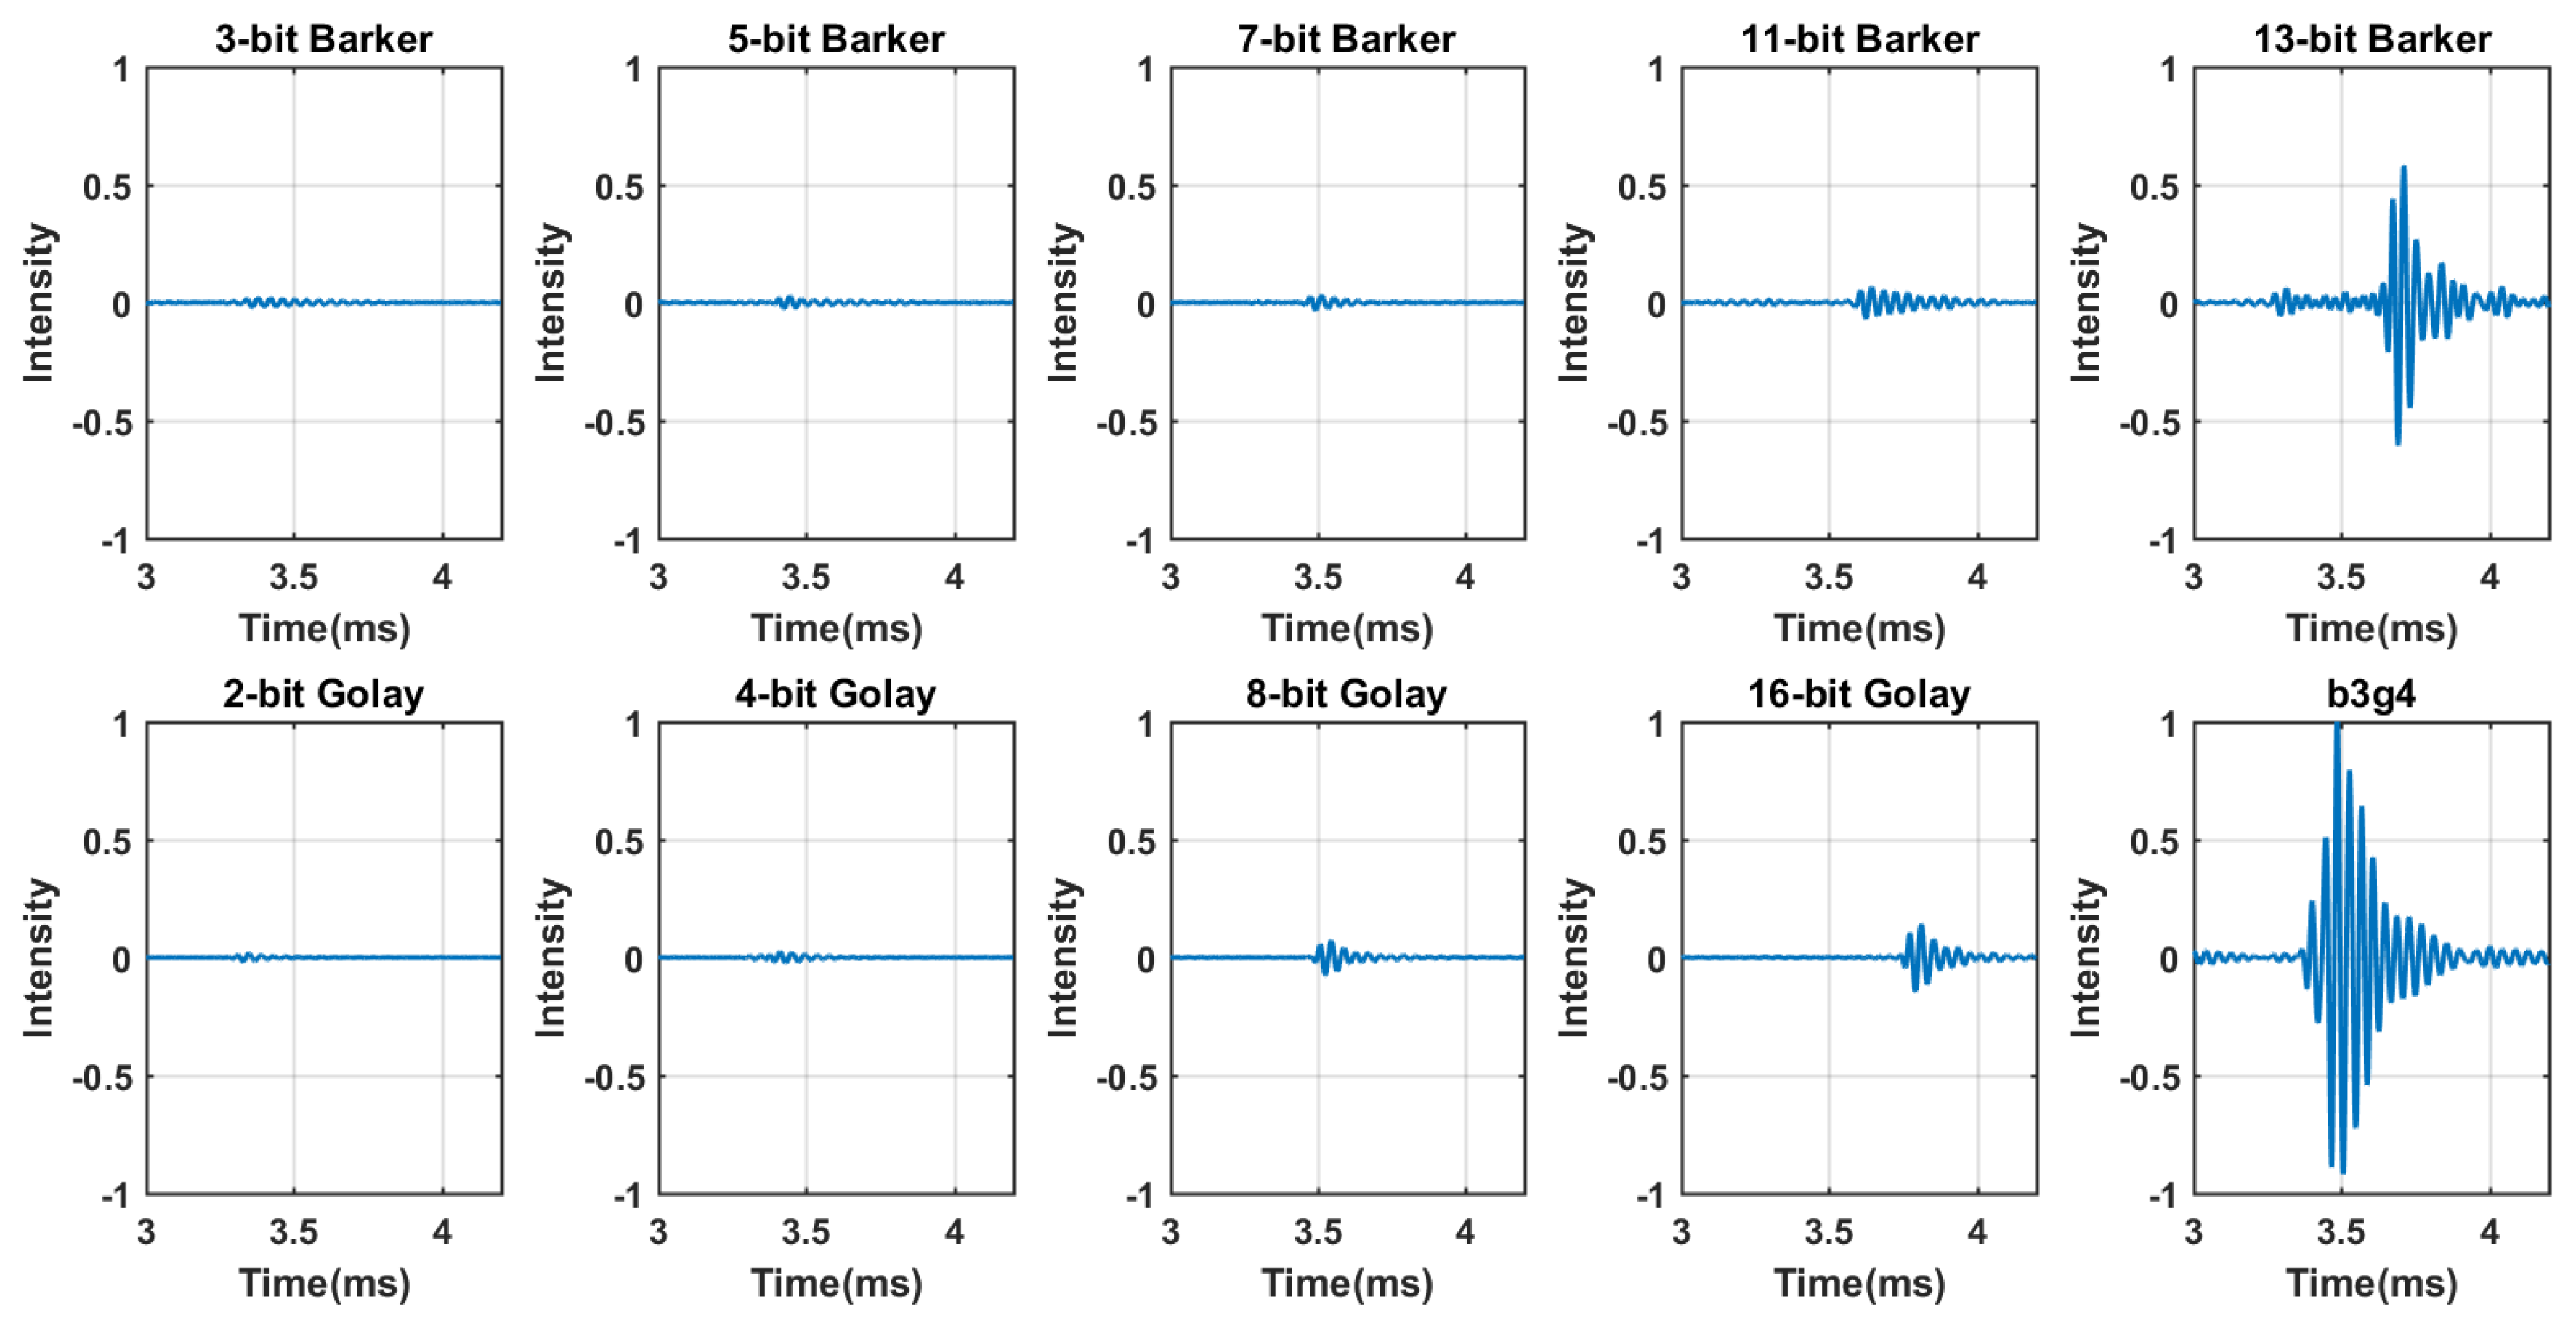
2.2. Code Generation and Compression

Generally, coded excitation is an ultrasound technique that has been used for ultrasound imaging systems in medical applications. The improvement of SNR is related to the sequence length. The features of the sequence of the conventional Golay codes and barker codes is infinite and finite, respectively, [25]. Theoretically, the longer code excitation sequence offers better performance of the SNR but a higher axial resolution depends on a shorter input signal wavelength. Therefore, the selection of the code excitation sequence length needs to be considered for accuracy and efficiency of defect detection under different applications.
Currently, the combined code excitation method is only applied to ultrasound imaging applications, and it has few selections for the combined code sequences available [5]. However, there is no existing literature and usage on the excitation of guided waves for long-range distance detection at low-frequencies. In this paper, this developed technique is successfully achieved to use on the guided wave generation and propagation for pipeline inspection theoretically and experimentally.
Golay codes and Barker codes are called their specific lengths and sequences. The BCG is convoluted by Golay code and Barker code, which may result in further improvement in signal intensity and adaptability for code length compared to the convention of Golay code pair or Barker code. The combined codes have an equivalent sidelobe intensity of the Baker code used. The main lobe intensity of the combined codes is similar to the sum of the main lobe intensity of Barker code and Golay code pair. Therefore, the developed BCG code sequence covers the advantages of the two codes including a high main lobe intensity of Barker code and Golay code pair without side lobes.
To excite a continuous signal, the BCG code needs to be modulated by a carrier wave (a bit like a sine wave). Transmit beamformer and electrical device are to generate and transmit the BCG coded signal. The electrical device will receive the echo signals from medium. Figure 2 shows the workflow how to generate the BCG codes and compress the echo. Firstly, the BCG code sequences are made by the convolution of the designed length of Barker code and the designed length of Golay code pair. Then, the BCG code sequences are modulated and transmitted to the medium to obtain a pair of echoes. Later, the echoes need to be compressed. There are two steps to compress the echoes. The primary step is to compress a pair of echo signals using the specific Golay code pair matched filter. The second step is to compress the signals processed in the previous step by the fitted Barker code matched filter. The compression result is the superposition of the processed echo signal pairs.
A BCG code pair, B C G a and B C G b , are built using the convolution of Golay sequence and Barker sequence and then modulated by a base pulse, as shown by the following equations.
B C G a ( n ) = G a ( n ) B ( n ) S ( n )
B C G b ( n ) = G b ( n ) B ( n ) S ( n )
where B ( n ) is a known Barker code sequence and G a ( n ) , G b ( n ) are the Golay code pairs. Defined the B C G a ( n ) and B C G b ( n ) as modulated BCG code signal. S ( n ) is a carrier sine wave. There is an example of transmitted b3g4 (Baker (n = 3) and Golay (n = 4)) code pair in Figure 3. It shows that the b3g4 code pair sequence is generated by the 3-bit Barker code and the 4-bit Golay code pair. To obtain a pair of transmission signals, the obtained complementary pair will be modulated by the sine wave.
To prove the feasibility of BCG code, the theoretical analysis based on synthetic input/output signals has been done. There are 15 different types of BCG codes to use for analysis. Three different types of pulses have been used: a simple pulse, 7-bit Barker code and 4-bit Golay code pair. The SNR gain is given by Equation (3). In this paper, the SNR gain can be calculated based on A s i g n a l as the main lobe of different methods intensity and A n o i s e is considered to be the main lobe of simple pulse intensity [14].
S N R = 20 l o g 10 ( A s i g n a l A n o i s e )
The PSL is a key parameter that describes a code’s properties [26] and it can be calculated based on the peak ( P p e a k ) and mean ( P m e a n ) power of lobe pulse, as shown in Equation (4).
P S L = 20 l o g 10 ( P p e a k P m e a n )
The PSL of the different BCG code lengths are shown in Figure 4. The PSL will decrease as the length of Barker code or Golay code increases. Both the Barker code and Golay code pair are longer, then the PSL becomes smaller in theory. However, a longer length of the transmitted code with an increased transmission period that can affect the inspection resolution. Therefore, similar lengths of coded signals are compared to each other to investigate their performance in improving SNR. Figure 5a shows the comparison of theoretical intensities of nine types BCG codes. Figure 5b shows that a 3-bit Barker code combined with 4-bit Golay code that compared to simple pulse, 7-bit Barker code, 11-bit Barker code, 4-bit Golay code and 8-bit Golay code. When comparing these codes, the sequence of the BCG code has a significant superiority in terms of main lobe intensity improvement. It is clear that the SNR will increase as the length of the code increases from the results. In experiments, similar-length codes will be used as transmitted signals for the excitation of guided waves. Generally, narrowband signals are used in a 5-cycle or 10-cycle Hanning window [27]. In this paper, a simple sine signal is chosen to better compare the SNR gain with other coded waveform functions.

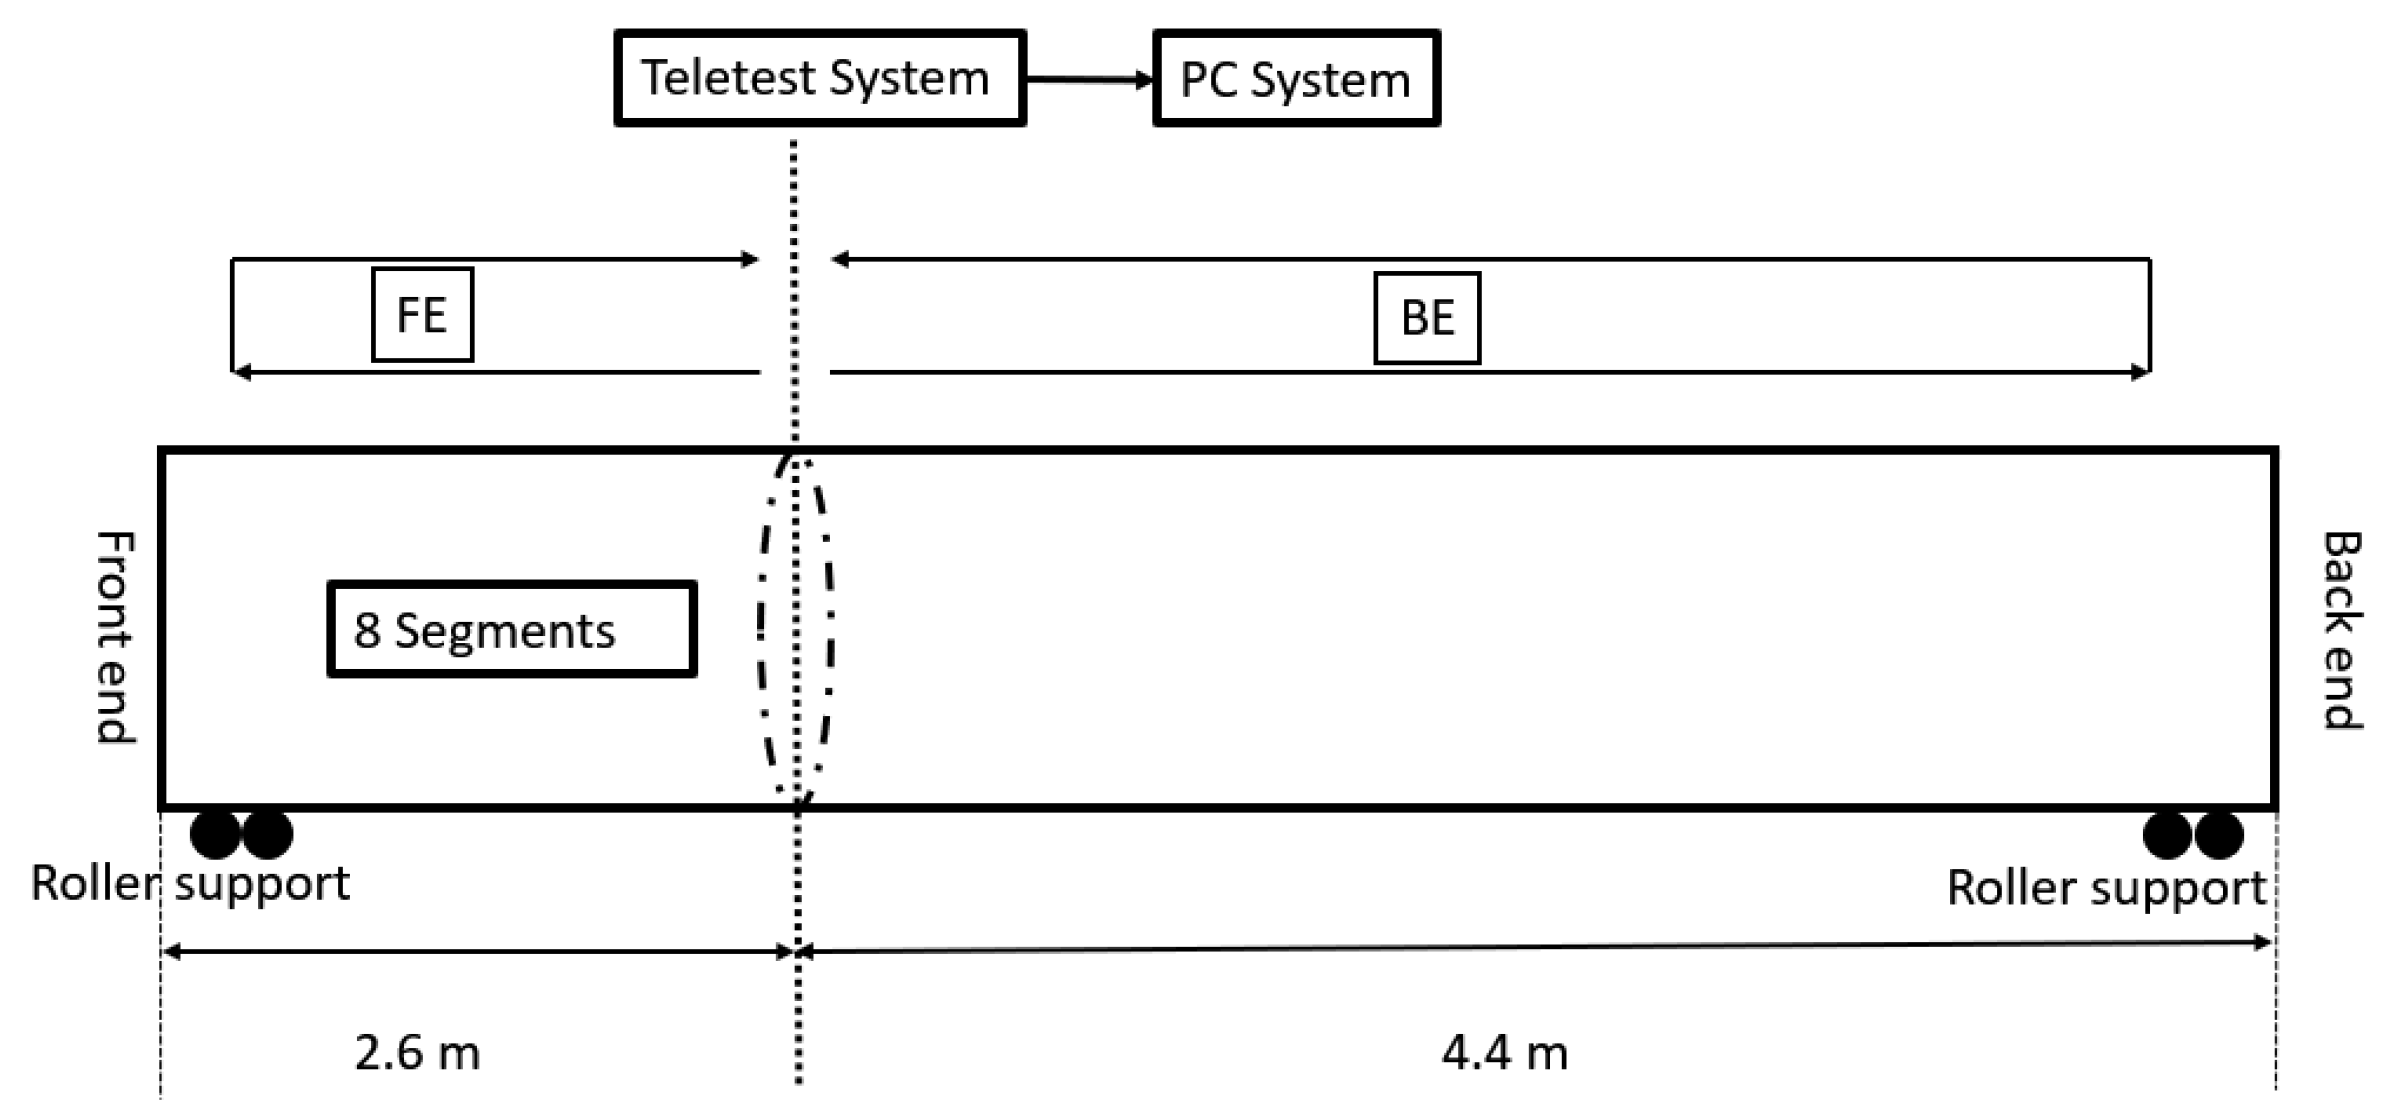
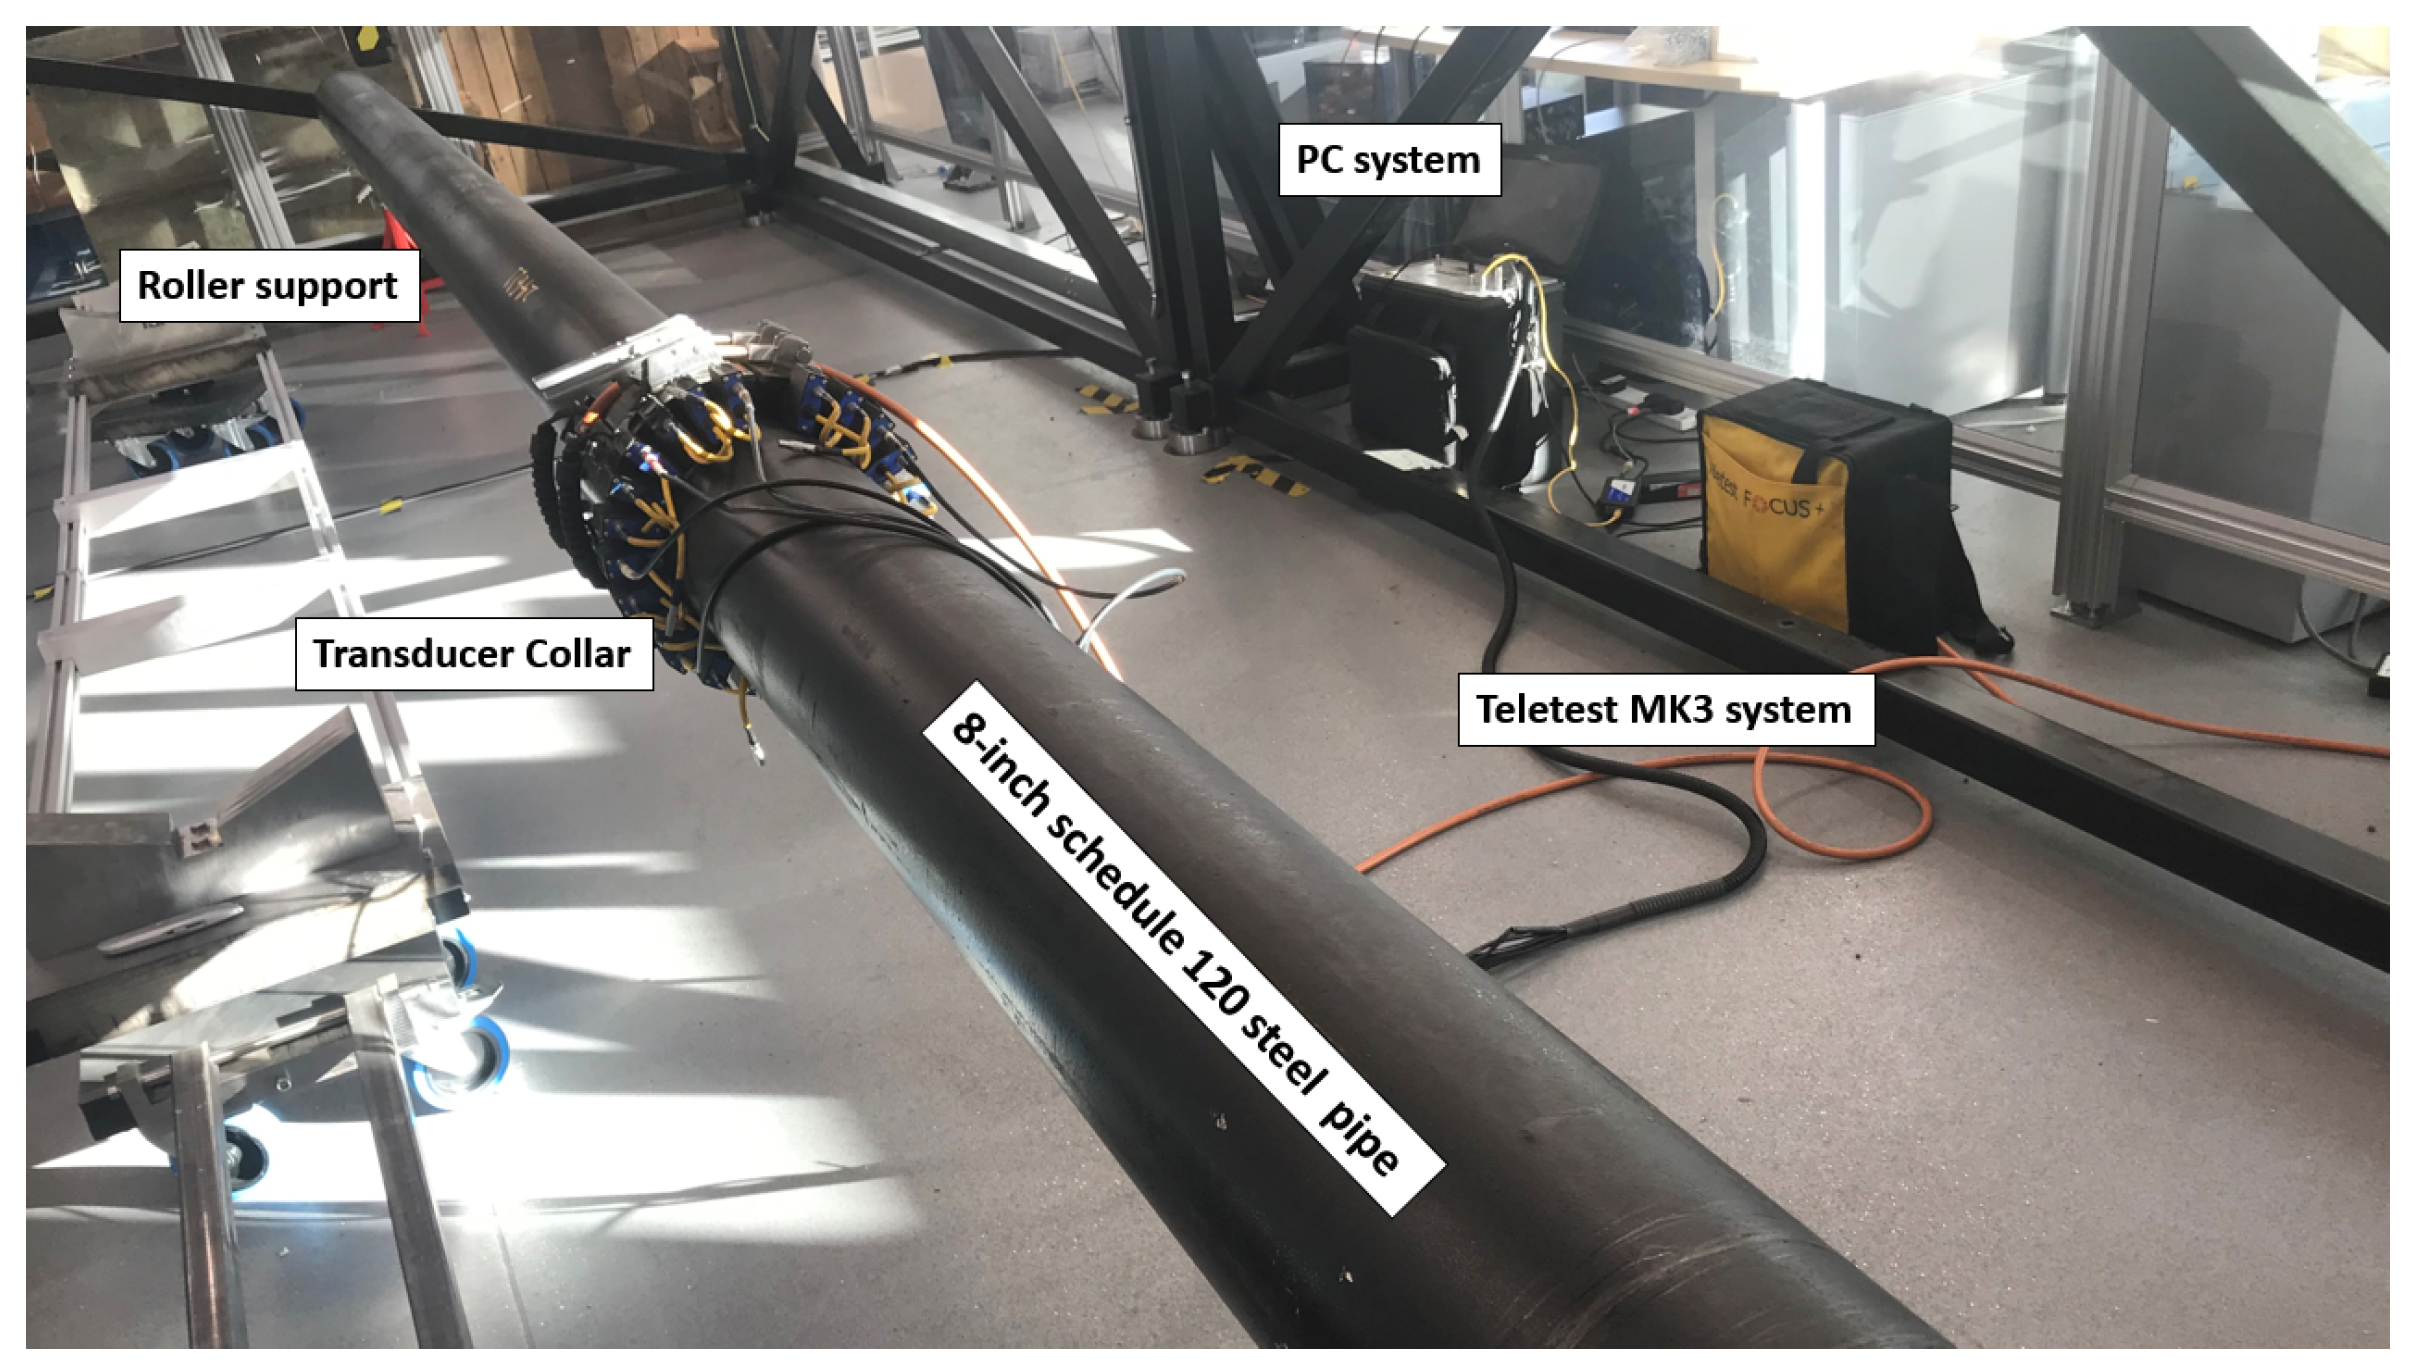
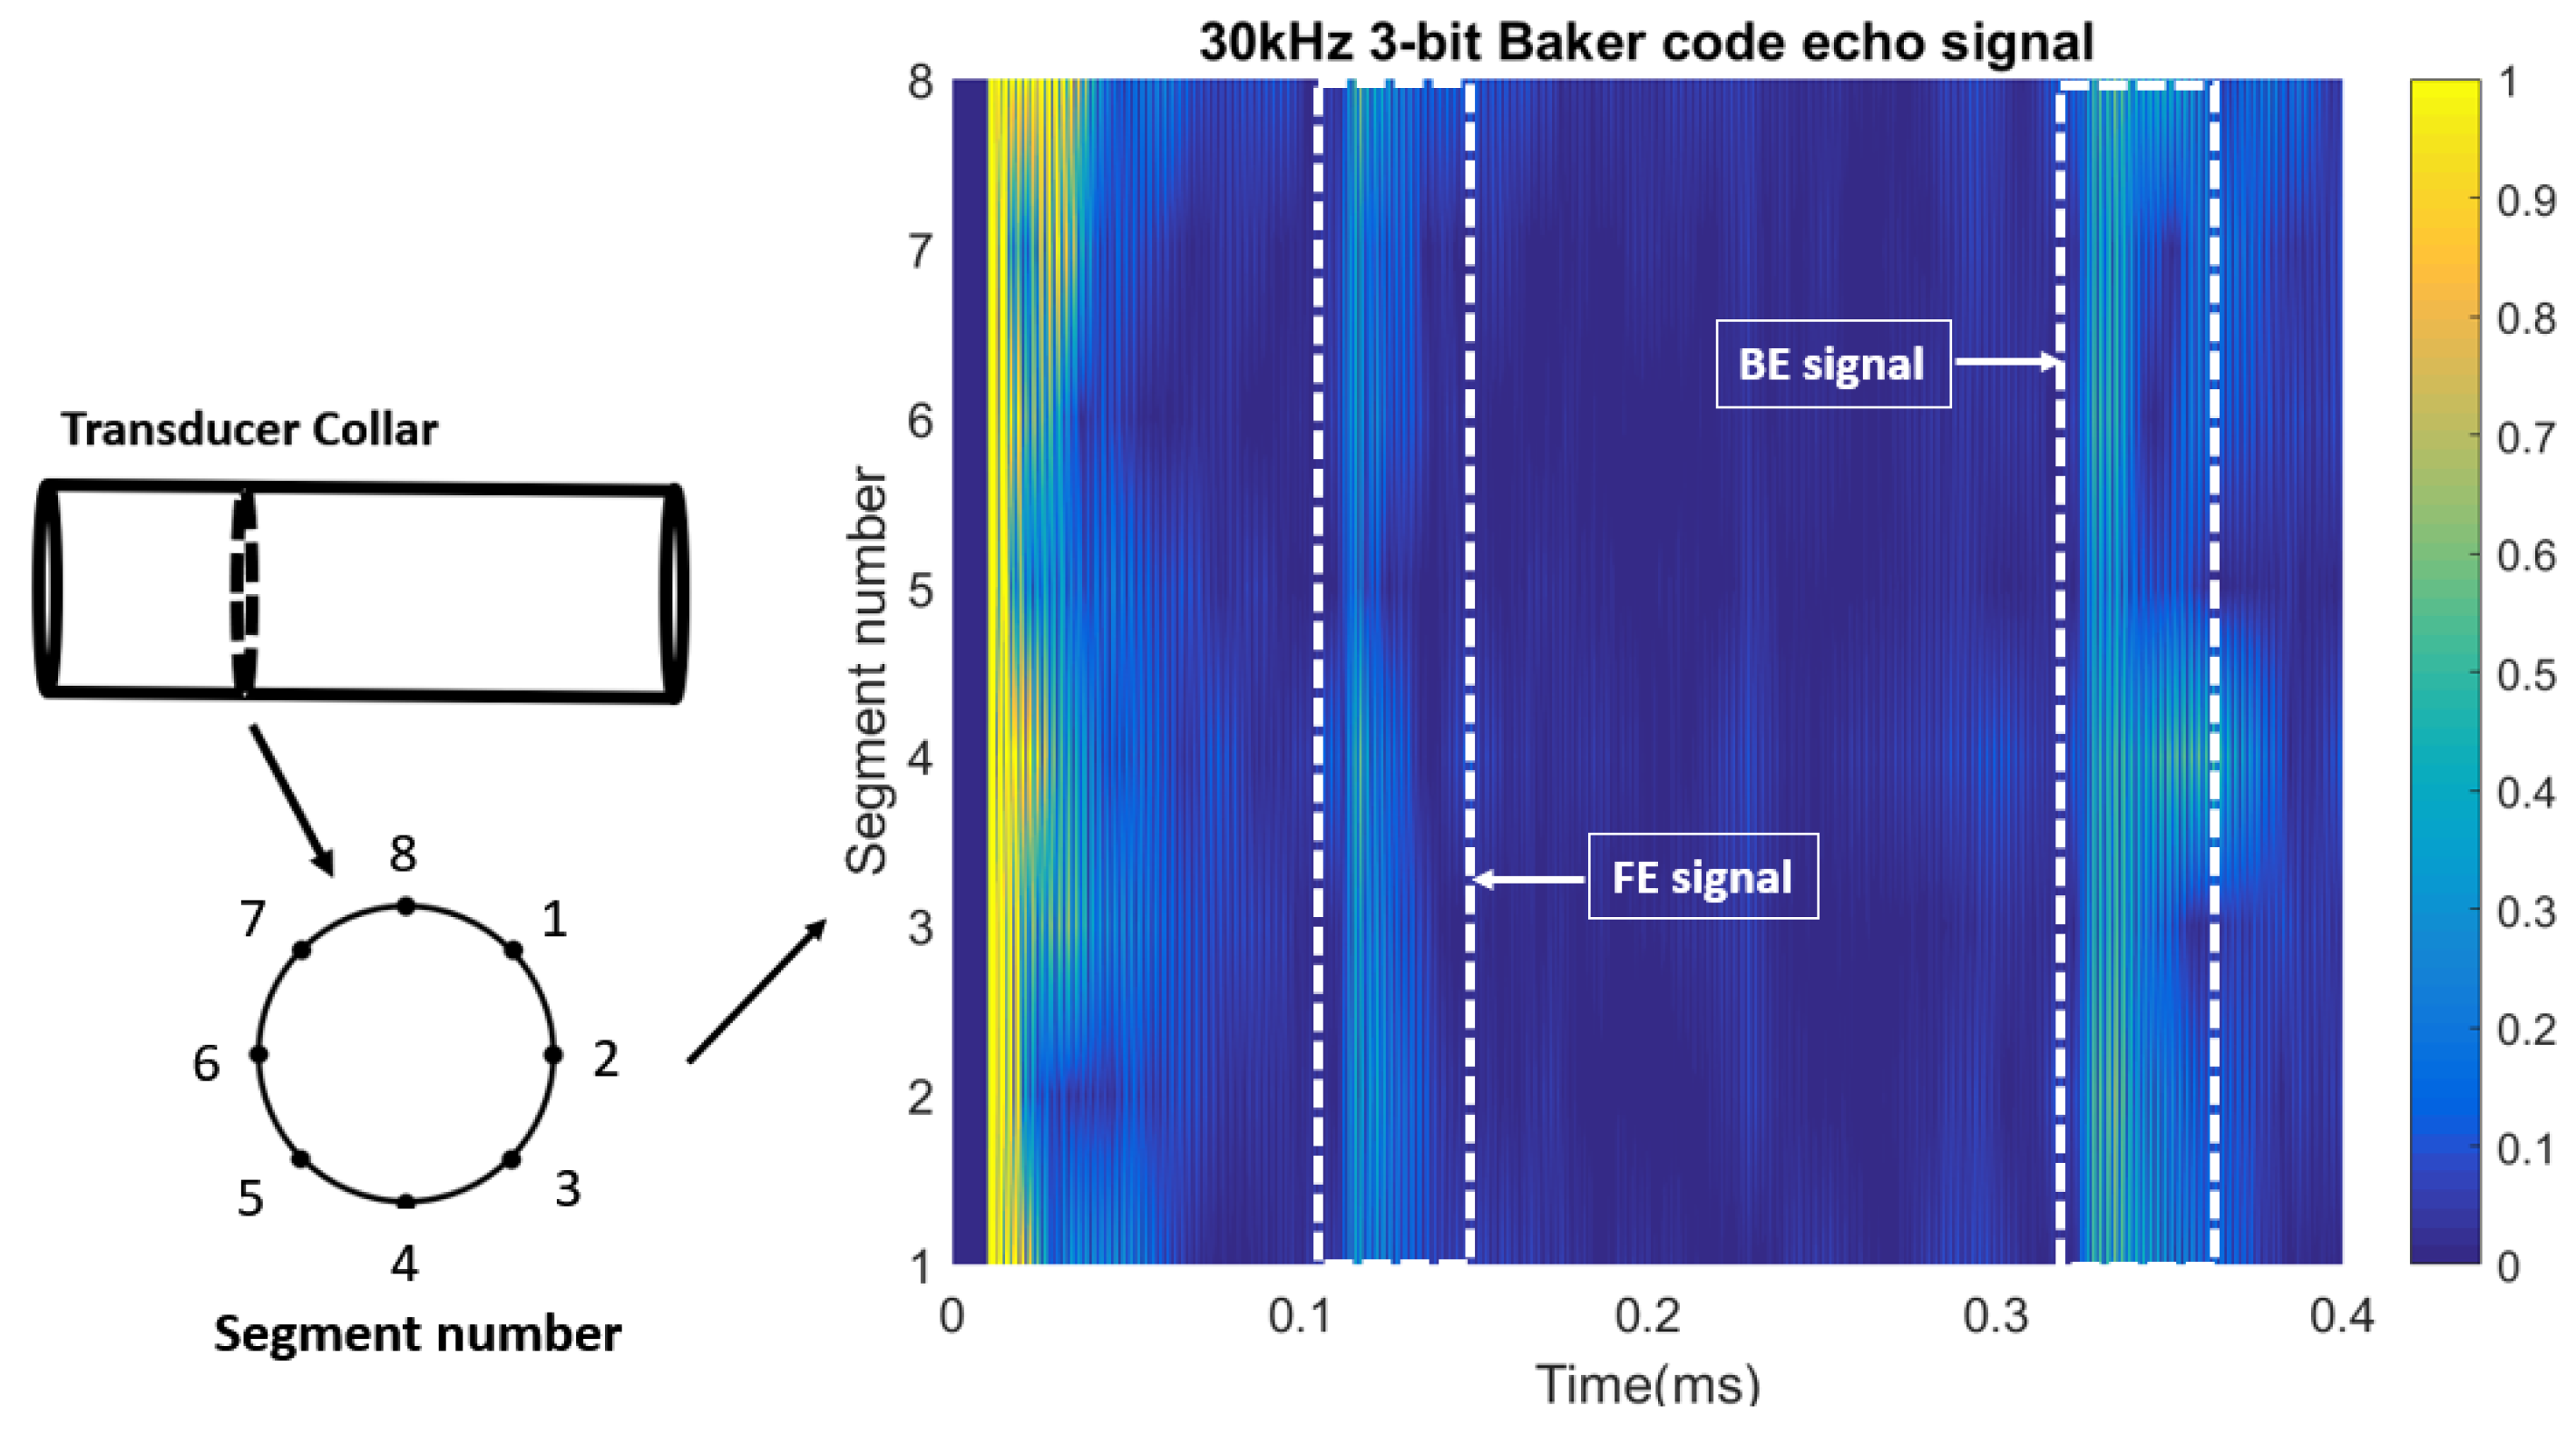
3. Laboratory Testing

An experiment was carried out on a 7 m long 8-inch schedule 40 steel pipe. The transducers driven by Teletest MK3 system device were located at around 2.6 m from the front end of the pipe. A detailed sketch of this experiment has been described, as shown in Figure 6. The experiment had been performed by The Welding Institute Ltd. as shown in Figure 7. The steel pipe was placed on roller supports. The received signal only contains two echoes reflected from the each pipe end.
The experiment used a 30 kHz sine signal, variable bits of 30 kHz Barker code, variable bits of 30 kHz Golay code pair and the BCG code pair at frequencies (from 30 kHz to 50 kHz) as excited signals. Guided torsional wave mode T(0,1) was excited by a transmitter. The experimental results were collected from a 7 m long steel pipe without any defect and picked up the data from eight segments in a circumferential transducer array using the Teletest MK3 interface. Due to the sine signal is relevant to the input waveform used generally by the Teletest system, all the selected input signals are modulated by the sine waveform as shown in Table 1.
Figure 8 shows an example of the raw echo signal that is a 3-bit Barker code at 30 kHz. This figure is a three-dimensional surface plot reconstructed from the echo signals received by eight segments. The echo signals from the front end (FE) and the echo signals from the back end (BE) have been marked in Figure 8. The cross-correlation results of echo signals from the front end are shown in Figure 9. Figure 9 contains the results of variable bits of Barker code at 30 kHz, variable bits of Golay code at 30 kHz and the BCG code at frequencies. It is obvious from the figure that the main lobe of the BCG code has the highest intensity as expect. The BCG code ability to increase the intensity of echo signal is much better than other codes.
In this paper, the work forced on the echo signal SNR and PSL. The method could also be used to investigate the information, such as axial resolution, dead zone, inspection range, etc. Table 2 indicates the increased SNR and PSL of Barker codes of different lengths at 30 kHz. The experimental data show that the length of Barker code increased can improve both the echo SNR and PSL. Therefore, the length of the code needs to be considered when the excitation code is selected.
The increments of echo SNR using a 3-bit Barker code signal from the front and back pipe ends are 16.7 dB and 19.1 dB compared to the sine wave at 30 kHz, and the peak sidelobe levels of this code signal are −11.8 dB and −13.3 dB, respectively. The increments of SNR and peak sidelobe level of 5-bit Barker code are better than that of 3-bit Barker code. The echo SNR is improved by 2.6 dB (FE) and 1.2 dB (BE), respectively. The peak sidelobe level is decreased by 2.8 dB (FE) and by 4.9 dB (BE). As the code length increases, 7-bit, 11-bit and 13-bit Barker codes have a significant improvement in SNR. The average increment of SNR for 7-bit, 11-bit and 13-bit Barker codes are 21.7 dB, 23.6 dB and 24.2 dB compared to that of sine wave, respectively. However, the peak sidelobe level of these codes has not significantly improved or even dropped. The reason for this may be influenced by the overlength of the bark code.
Table 3 shows the increased SNR of Golay code pairs of different lengths at 30 kHz. Due to the Golay code pair can eliminate side lobes, Table 3 only shows the SNR of different lengths Golay code pair. The increased SNR rises in lockstep with the length of the transmitted Golay code pair increased, as predicted by the theory.
The values of the increased SNR of Golay code pairs from the front and back pipe ends are almost the same in the experiment. From experimental results, the length of Golay code pair is increased exponentially, the improved SNR should increase with an approximate 3 dB increment that is consistent with the theoretical analysis results. When the sequence length of Golay code pair is 16, the improved SNR reached its maximum value of 28.3 dB.
Table 4 shows the increased SNR and PSL of the 3-bit Barker code convolution 4-bit Golay code pair at different frequencies. From the experimental data, it can be found that the frequency of 40 kHz is the best operational frequency to excite the torsional wave mode T(0,1) using the BCG code pair for pipe inspection.
The increment of echo SNR to the processed BCG code pair signal is 28.9 dB (FE) and 30.1 dB (BE) at 30 kHz compared to sine wave and the peak sidelobe level is −13.3 dB (FE) and −10.5 dB (BE). Since the FE and BE echoes are basically similar, the SNR and peak sidelobe level are also similar after echo signal processing. The increment of SNR of the code at 35 kHz is 2.5 dB (FE) and 2.3 dB(BE) higher than that at 30 kHz. The peak sidelobe level of the processed signal at 35 kHz is −27.9 dB (FE) and −24.3 dB (BE), respectively. The echo signal at 40 kHz shows the best performance among all coded signals. The increment of SNR at 40 kHz is 32 dB (FE) and 33.5 dB (BE) and the sidelobe level is −28.5 dB (FE) and −19.5 (BE). The performance of processed signal decreased at 45 kHz and 50 kHz. The decrements of echo SNR at 45 kHz and 50 kHz are 2.7 dB (FE)/3.7 dB (BE) and 5.3 dB (FE)/5.4 dB(BE) compared to the processed signal at 40 kHz, respectively. The average sidelobe levels at 45 kHz and 50 kHz are increased by 1.5 dB (FE) and 4.7 dB (FE) compared to the processed signal at 40 kHz, respectively.
The intensities of the signal echos from the front and back pipe ends are significantly increased after the echos are processed by fitted matched filter. The processed echo signal changes significantly at different frequencies by observing the echo signals, as indicated in Table 4.
Figure 10 shows the comparison of SNR and PSL results which contains all codes designed in the experiment. Figure 10a shows the comparison among the theoretical SNR results, the FE SNR results and the BE SNR results. Figure 10b shows the comparison among the theoretical PSL results, the FE PSL results and the BE PSL results. The changing trend of the experimental results is consistent with the theoretical results. The proposed code method has a higher SNR in experiment results than theoretical results (especially at the frequency of 40 kHz). The main reason is that the device sensor’s operational frequency is around 40 kHz, so the performance of exciting and receiving signals at this frequency is better than at other frequencies at a frequency range of interest. Meanwhile, From Figure 10, the all results show that theoretical calculations are close to experimental ones, especially the theoretical and experiential testing results of the SNR have a better agreement at 3.5 and 7-bit Baker codes 8 and 16 bit Golay code pairs, and 30 kHz b3g4 code pair when compared to others (see Figure 10a). In Figure 10b, the PSL results of 3.5 and 7-bit Barker codes due to their shorter code lengths, and b3g4 code pair at 35 kHz and 45 kHz have a better agreement than others. However, it also shows that there is a distinct difference (up to 10 dB) for the b3g4 code pair at 30 kHz and 40 kHz. The reason of that the higher order wave modes appearance as a coherent noise level leads to the non-dispersed travelling wavefield propagated with following some dispersive waves. The influenced effect for the PSL SNR could be more obvious when the echo signal is received from a longer distance at the operating frequency of 40 kHz (see Figure 10b) The relevant research and improvements were investigated in [23,28].
Overall, the BCG code has higher intensity of main lobe and lower intensity of peak sidelobe level than other coded excitation methods according to the signal quality criterion. Based on these results, there is a good agreement between theoretical and experimental results. From Figure 9, we can easily find that the developed BCG coded excitation method for a pure wave mode T(0,1) generation and prorogation has more effective behaviour in the circumferential direction.

4. Conclusions

A developed coded excitation method, which combined the phase coded excitation, is proposed in this paper. The method is successfully used for the improvement of the SNR and PSL of the oil and gas pipeline inspection system. The signal performance of the echo BCG coded method has been validated in experiments.
From experimental studies, some summaries are noted: the proposed method is a feasible method to excite the T(0,1) wave mode propagation with its significant purity for ultrasonic guided wave testing on pipes. This method can effectively improve the echo SNR when the inspection system device transmits the wave mode T(0,1). The increasing SNR of the BCG code has significant improvement and the PSL of the developed BCG code is smaller than Barker code. The performance of BCG code is much better than the traditional coded excitation without changing the code length. Therefore, the proposed coded method, as a developed technique, is able to be used in guided wave testing and many other potential applications for improving the echo SNR about the coherent or random noise level.

Author Contributions

Conceptualization, Z.F.; Data curation, X.N.; Funding acquisition, B.M.; Methodology, Z.F. and X.N.; Project administration, H.M.; Resources, X.N.; Software, Z.F.; Supervision, H.M.; Validation, Z.F. and X.N.; Writing—original draft, Z.F. and X.N.; Writing—review & editing, X.N., B.M. and H.M. All authors have read and agreed to the published version of the manuscript.

Funding

This research received no external funding.

Institutional Review Board Statement

Not applicable.

Informed Consent Statement

Not applicable.

Data Availability Statement

Not applicable.

Acknowledgments

This publication was made possible by the sponsorship and support of TWI Ltd. and Brunel University London. The work was enabled through, and undertaken at, the National Structural Integrity Research Centre (NSIRC), a postgraduate engineering facility for industry-led research into structural integrity established and managed by TWI through a network of both national and international Universities.

Conflicts of Interest

The authors declare no conflict of interest.

References

  1. Lowe, M.J.; Alleyne, D.N.; Cawley, P. Defect detection in pipes using guided waves. Ultrasonics 1998, 36, 147–154. [Google Scholar] [CrossRef]
  2. Mahal, H.N.; Mudge, P.; Nandi, A.K. Comparison of coded excitations in the presence of variable transducer transfer functions in ultrasonic guided wave testing of pipelines. In Proceedings of the 9th European Workshop on Structural Health Monitoring, Manchester, UK, 10–13 July 2018; pp. 10–13. [Google Scholar]
  3. Cawley, P.; Lowe, M.; Alleyne, D.; Pavlakovic, B.; Wilcox, P. Practical long range guided wave inspection-applications to pipes and rail. Mater. Eval 2003, 61, 66–74. [Google Scholar]
  4. Song, X.; Ta, D.; Wang, W. A base-sequence-modulated Golay code improves the excitation and measurement of ultrasonic guided waves in long bones. IEEE Trans. Ultrason. Ferroelectr. Freq. Control 2012, 59, 2580–2583. [Google Scholar]
  5. Fan, Z.; Rudlin, J.; Asfis, G.; Meng, H. Convolution of Barker and Golay Codes for Low Voltage Ultrasonic Testing. Technologies 2019, 7, 72. [Google Scholar] [CrossRef] [Green Version]
  6. Xu, X.; Karney, B. An overview of transient fault detection techniques. In Modeling and Monitoring of Pipelines and Networks; Springer: Cham, Switzerland, 2017; pp. 13–37. [Google Scholar]
  7. Meniconi, S.; Capponi, C.; Frisinghelli, M.; Brunone, B. Leak Detection in a Real Transmission Main Through Transient Tests: Deeds and Misdeeds. Water Resour. Res. 2021, 57, e2020WR027838. [Google Scholar] [CrossRef]
  8. Brunone, B.; Capponi, C.; Meniconi, S. Design criteria and performance analysis of a smart portable device for leak detection in water transmission mains. Measurement 2021, 183, 109844. [Google Scholar] [CrossRef]
  9. Joy, J.; Peter, S.; John, N. Denoising using soft thresholding. Int. J. Adv. Res. Electr. Electron. Instrum. Eng. 2013, 2, 1027–1032. [Google Scholar]
  10. Gan, T.; Hutchins, D.; Billson, D.; Schindel, D. The use of broadband acoustic transducers and pulse-compression techniques for air-coupled ultrasonic imaging. Ultrasonics 2001, 39, 181–194. [Google Scholar] [CrossRef]
  11. Takeuchi, Y. An investigation of a spread energy method for medical ultrasound systems: Part one: Theory and investigation. Ultrasonics 1979, 17, 175–182. [Google Scholar] [CrossRef]
  12. O’Donnell, M. Coded excitation system for improving the penetration of real-time phased-array imaging systems. IEEE Trans. Ultrason. Ferroelectr. Freq. Control 1992, 39, 341–351. [Google Scholar] [CrossRef]
  13. Jedwab, J.; Parker, M.G. A construction of binary Golay sequence pairs from odd-length Barker sequences. J. Comb. Des. 2009, 17, 478–491. [Google Scholar] [CrossRef]
  14. Kim, P.; Jung, E.; Bae, S.; Kim, K.; Song, T.K. Barker-sequence-modulated golay coded excitation technique for ultrasound imaging. In Proceedings of the 2016 IEEE International Ultrasonics Symposium (IUS), Tours, France, 18–21 September 2016; pp. 1–4. [Google Scholar]
  15. Wang, M.; Cong, S.; Zhang, S. Pseudo Chirp-Barker-Golay coded excitation in ultrasound imaging. In Proceedings of the 2018 IEEE Chinese Control and Decision Conference (CCDC), Shenyang, China, 9–11 June 2018; pp. 4035–4039. [Google Scholar]
  16. Hedayatrasa, S.; Poelman, G.; Segers, J.; Van Paepegem, W.; Kersemans, M. Novel discrete frequency-phase modulated excitation waveform for enhanced depth resolvability of thermal wave radar. Mech. Syst. Signal Process. 2019, 132, 512–522. [Google Scholar] [CrossRef]
  17. De Marchi, L.; Marzani, A.; Moll, J.; Kudela, P.; Radzieński, M.; Ostachowicz, W. A pulse coding and decoding strategy to perform Lamb wave inspections using simultaneously multiple actuators. Mech. Syst. Signal Process. 2017, 91, 111–121. [Google Scholar] [CrossRef]
  18. MUDEG, P. Field application of the Teletest; Long-range ultrasonic testing technique. Insight 2001, 43, 74–77. [Google Scholar]
  19. Lowe, M.; Cawley, P. Long Range Guided Wave Inspection Usage–Current Commercial Capabilities and Research Directions; Department of Mechanical Engineering, Imperial College London: London, UK, 2006. [Google Scholar]
  20. Silk, M.; Bainton, K. The propagation in metal tubing of ultrasonic wave modes equivalent to Lamb waves. Ultrasonics 1979, 17, 11–19. [Google Scholar] [CrossRef]
  21. Guan, R.; Lu, Y.; Duan, W.; Wang, X. Guided waves for damage identification in pipeline structures: A review. Struct. Control Health Monit. 2017, 24, e2007. [Google Scholar] [CrossRef]
  22. Wilcox, P.D. A rapid signal processing technique to remove the effect of dispersion from guided wave signals. IEEE Trans. Ultrason. Ferroelectr. Freq. Control 2003, 50, 419–427. [Google Scholar] [CrossRef]
  23. Niu, X.; Duan, W.; Chen, H.P.; Marques, H. Excitation and propagation of torsional T (0, 1) mode for guided wave testing of pipeline integrity. Measurement 2019, 131, 341–348. [Google Scholar] [CrossRef]
  24. Duan, W.; Kirby, R. A numerical model for the scattering of elastic waves from a non-axisymmetric defect in a pipe. Finite Elem. Anal. Des. 2015, 100, 28–40. [Google Scholar] [CrossRef]
  25. Chiao, R.Y.; Hao, X. Coded excitation for diagnostic ultrasound: A system developer’s perspective. IEEE Trans. Ultrason. Ferroelectr. Freq. Control 2005, 52, 160–170. [Google Scholar] [CrossRef]
  26. Török, I.; Seller, R. Pulse compression in search radar. Period. Polytech. Electr. Eng. 1998, 42, 391–408. [Google Scholar]
  27. Ghavamian, A.; Mustapha, F.; Baharudin, B.; Yidris, N. Detection, localisation and assessment of defects in pipes using guided wave techniques: A review. Sensors 2018, 18, 4470. [Google Scholar] [CrossRef] [PubMed] [Green Version]
  28. Niu, X.; Tee, K.F.; Marques, H.R. Superposition model of mode shapes composed of travelling torsional guided waves excited by multiple circular transducer arrays in pipes. Ultrasonics 2021, 116, 106507. [Google Scholar] [CrossRef] [PubMed]
Figure 1. Group velocity dispersion curves for a 8-inch, schedule 40 steel pipe.
Applsci 12 00777 g001
Figure 2. The process of generation and compression of the sequence of a Barker code combined with Golay code pair.
Applsci 12 00777 g002
Figure 3. The BCG code pair modulated by sine wave.
Applsci 12 00777 g003
Figure 4. The peak-side lobe level of different BCG codes from numerical simulations.
Applsci 12 00777 g004
Figure 5. The theoretical analysis results. (a) The 3-bit Barker code combined 4-bit Golay code compared to simple pulse, 7-bit Barker code, 11-bit Barker code, 4-bit Golay code and 8-bit Golay code. (b) The theoretical intensity comparison of nine different sequences of BCG codes.
Applsci 12 00777 g005
Figure 6. Schematic diagram of pipe experiential set-up composed of roller support, Teletest MK3 system and PC system.
Applsci 12 00777 g006
Figure 7. Experimental set-up to use different coded excitation for the torsional wave mode T(0,1) generation.
Applsci 12 00777 g007
Figure 8. The raw experimental echo signals of a 3-bit Barker code at 30 kHz from eight segments of the pipeline inspection system. Notes: the experimental setup detail of the pipeline is shown in Figure 6.
Applsci 12 00777 g008
Figure 9. Comparison of results for the intensity of the Barker codes, Golay codes and BCG codes in the time domain. Please noted: The average power of the input signal for all excitation methods is the same.
Applsci 12 00777 g009
Figure 10. Comparison of SNR and PSL (dB) results (a) Comparison of the theoretical SNR results from Figure 5, front side SNR results and back side SNR results (b) Comparison of theoretical PSL results from Figure 4, front side PSL results and back side PSL results.
Applsci 12 00777 g010
Table 1. The excitation sequences characteristics.
Excitation SequenceCharacteristics
Carrier Frequency (kHz)Duration (μs)Binary Code
1-cycle sine3033-
3-bit Barker3010011-1
5-bit Barker30160111-11
7-bit Barker30230111-1 -11-1
11-bit Barker30360111-1-1-11-1-11-1
13-bit Barker3043011111-1-111-11-11
2-bit Golay306611 & 1-1
4-bit Golay30132111-1 & 11-11
8-bit Golay30264111-111-11 & 111-1-1-11-1
16-bit Golay30528111-111-11111-1-1-11-1
111-111-11-1-1-1111-11
6-bit b3g430198121-1-21 & 12-1-12-1
6-bit b3g435171121-1-21 & 12-1-12-1
6-bit b3g440150121-1-21 & 12-1-12-1
6-bit b3g445133121-1-21 & 12-1-12-1
6-bit b3g450120121-1-21 & 12-1-12-1
Table 2. The SNR and PSL of Barker codes of different lengths at 30 kHz from the front and back pipe ends.
Code BitFront SNR (dB)Front PSL (dB)Back SNR (dB)Back PSL (dB)
316.7−11.819.1−13.3
519.3−14.620.3−18.2
720.9−18.722.4−20.8
1122.9−18.224.3−21.2
1323.6−19.124.8−22
Table 3. The SNR of Golay code pair of different lengths from the FE and BE at 30 kHz.
Code BitFront SNR (dB)Back SNR (dB)
218.219.4
421.222.4
824.325.5
1627.228.3
Table 4. The SNR and PSL of b3g4 code from FE and BE at different frequencies.
FrequencyFront SNR (dB)Front PSL(dB)Back SNR (dB)Back PSL (dB)
30 kHz28.9−13.330.1−10.5
35 kHz31.4−27.932.4−24.3
40 kHz32−28.533.5−19.5
45 kHz29.3−2229.8−22.9
50 kHz26.7−21.728.1−16.9
Publisher’s Note: MDPI stays neutral with regard to jurisdictional claims in published maps and institutional affiliations.

