Article

Ultrasonic Inspection for Welds with Irregular Curvature Geometry Using Flexible Phased Array Probes and Semi-Auto Scanners: A Feasibility Study

1
Department of Mechanical Engineering, Graduate School, Seoul National University of Science and Technology, Seoul 01811, Korea
2
NDT Research Center, Seoul National University of Science and Technology, Seoul 01811, Korea
3
Department of Mechanical and Automotive Engineering, Seoul National University of Science and Technology, Seoul 01811, Korea
*
Author to whom correspondence should be addressed.
Appl. Sci. 2022, 12(2), 748; https://doi.org/10.3390/app12020748
Submission received: 6 December 2021 / Revised: 28 December 2021 / Accepted: 5 January 2022 / Published: 12 January 2022
(This article belongs to the Special Issue Applications on Ultrasonic Wave ‖)

Abstract

:
Pipes of various shapes constitute pipelines utilized in industrial sites. These pipes are coupled through welding, wherein complex curvatures such as a flange, an elbow, a reducer, and a branch pipe are often found. Using phased array ultrasonic testing (PAUT) to inspect weld zones with complex curvatures is faced with different challenges due to parts that are difficult to contact with probes, small-diameter pipes, spatial limitations due to adjacent pipes, nozzles, and sloped shapes. In this study, we developed a flexible PAUT probe (FPAPr) and a semi-automatic scanner that was improved to enable stable FPAPr scanning for securing its inspection data consistency and reproducibility. A mock-up test specimen was created for a flange, an elbow, a reducer, and a branch pipe. Artificial flaws were inserted into the specimen through notch and hole processing, and simulations and verification experiments were performed to verify the performance and field applicability of the FPAPr and semi-automatic scanner.

1. Introduction

Pipelines utilized in industrial sites are composed of various pipes. These pipes are coupled through welding, and radiographic testing (RT) is commonly conducted for the non-destructive inspection of weld zones. However, ultrasonic testing (UT) has been replacing RT due to safety issues such as radiation exposure. Generally, UT is inadequate for detecting and calculating flaws with directionality since inspection results are calculated with one angle from a single element. Therefore, a probe with various forms of elements, such as in phased array ultrasonic testing (PAUT), is being developed and fabricated to supplement this limitation and improve the probability of detection (POD). The PAUT technology is advantageous compared to general UT that applies a single element or coupled element for applying various angles through time delay, beam property adjustment, and electronic scanning [1,2].
A flange, an elbow, a reducer, and a branch pipe that are inspected in pipelines, often have complex curvatures, as shown in Figure 1. Pipeline weld PAUT is generally performed by combining the ultrasound probe and a wedge for propagating ultrasound to the target object. However, applying PAUT to weld on various curvatures is confronted with numerous challenges on account of parts that are difficult to contact with probes, small pipe-diameters, and spatial limitations due to adjacent structures [3,4]. Consequently, impaired access rather than an accord in contact between the phased array (PA) probe and surface, as shown in Figure 2, results in ultrasound beam distortion, sensitivity loss, and difficulty in quantitative flow analysis and assessment [5,6,7,8]. Numerous institutions investigated enabling easy access for the PA probe on test specimens with a curvature [9,10,11,12,13,14,15,16,17,18]. However, previous studies were based on simple concave or convex curvatures, and most were verified through simulations rather than experiments. No precedents were found regarding experimental verifications performed for various complex curvatures found in actual pipelines.
In this study, we developed a flexible PAUT probe (FPAPr) that could effortlessly approach complex pipeline curvatures. Additionally, a semi-automatic scanner, which is an improvement of the existing low-profile scanner, was developed to enable stable scanning for securing inspection data consistency and reproducibility. A commonly used device (Olympus’s Omniscan MX2 or Zetec’s Topaz) with high field availability was used as an inspection device exclusively for acquiring signals, and mock-ups that incorporated a notch, hole, and flaws that could be generated during welding, were fabricated as test specimens for the experiment [19]. This work validated the performance and field applicability of the developed FPAPr and the semi-automatic scanner.

2. FPAPr Design and Fabrication

2.1. Basic Principles of Phased Array Probe

The basic principles of the PAUT originate from Huygen’s principle, which is a theory on the wave nature of light. When applied to non-destructive inspections, Huygen’s principle mainly supports the description of ultrasound refraction, reflection, and diffraction. When electric pulses are exerted with a time lag on an arrayed element, the element becomes a wave source that generates spherical waves. The spherical waves interfere with each other due to the time lag and form a wavefront shape associated with this interference. The time delay refers to the time lag implemented on the element. In the PAUT, the time delay is electronically adjusted for exerting electric pulses to the element, which could electronically regulate ultrasonic beam steering, focus position, and injection angle. Figure 3 illustrates the beam focus position and direction according to the time lag for an ultrasonic beam at a perpendicular incidence. The associated equation is expressed as Equation (1), where t i indicates the time delay implemented on the element, c is the ultrasonic pulse velocity, a is the distance between elements, and μ is the distance between the probe and focus [20,21,22,23].
Δ t i = 1 c ( a 2 + μ 2 μ )
The focusing performance of the PA probe is determined by various parameters, thus requiring a distinct definition of each parameter feature. Figure 4 summarizes the probe design parameters. Generally, beam focusing with phased array ultrasound occurs within the near-field, and the Fresnel Region of the phased array ultrasound probe is determined by the probe aperture and wavelength (λ), as shown in Equation (2). Therefore, the larger the aperture and the larger the number of piezoelectric elements, the larger the Fresnel Region ( N ), which, in turn, enhances the focusing performance.
N = A 2 4 λ
Additionally, the range of angle of dispersion ( θ ), which can be acquired from the frequency and the probe aperture, widens as the size decreases and wavelength increases, which is the opposite of the Fresnel Region equation. The angle of dispersion of the ultrasonic probe is calculated as shown in Equation (3) [24,25,26].
s i n θ = 0.5 λ A

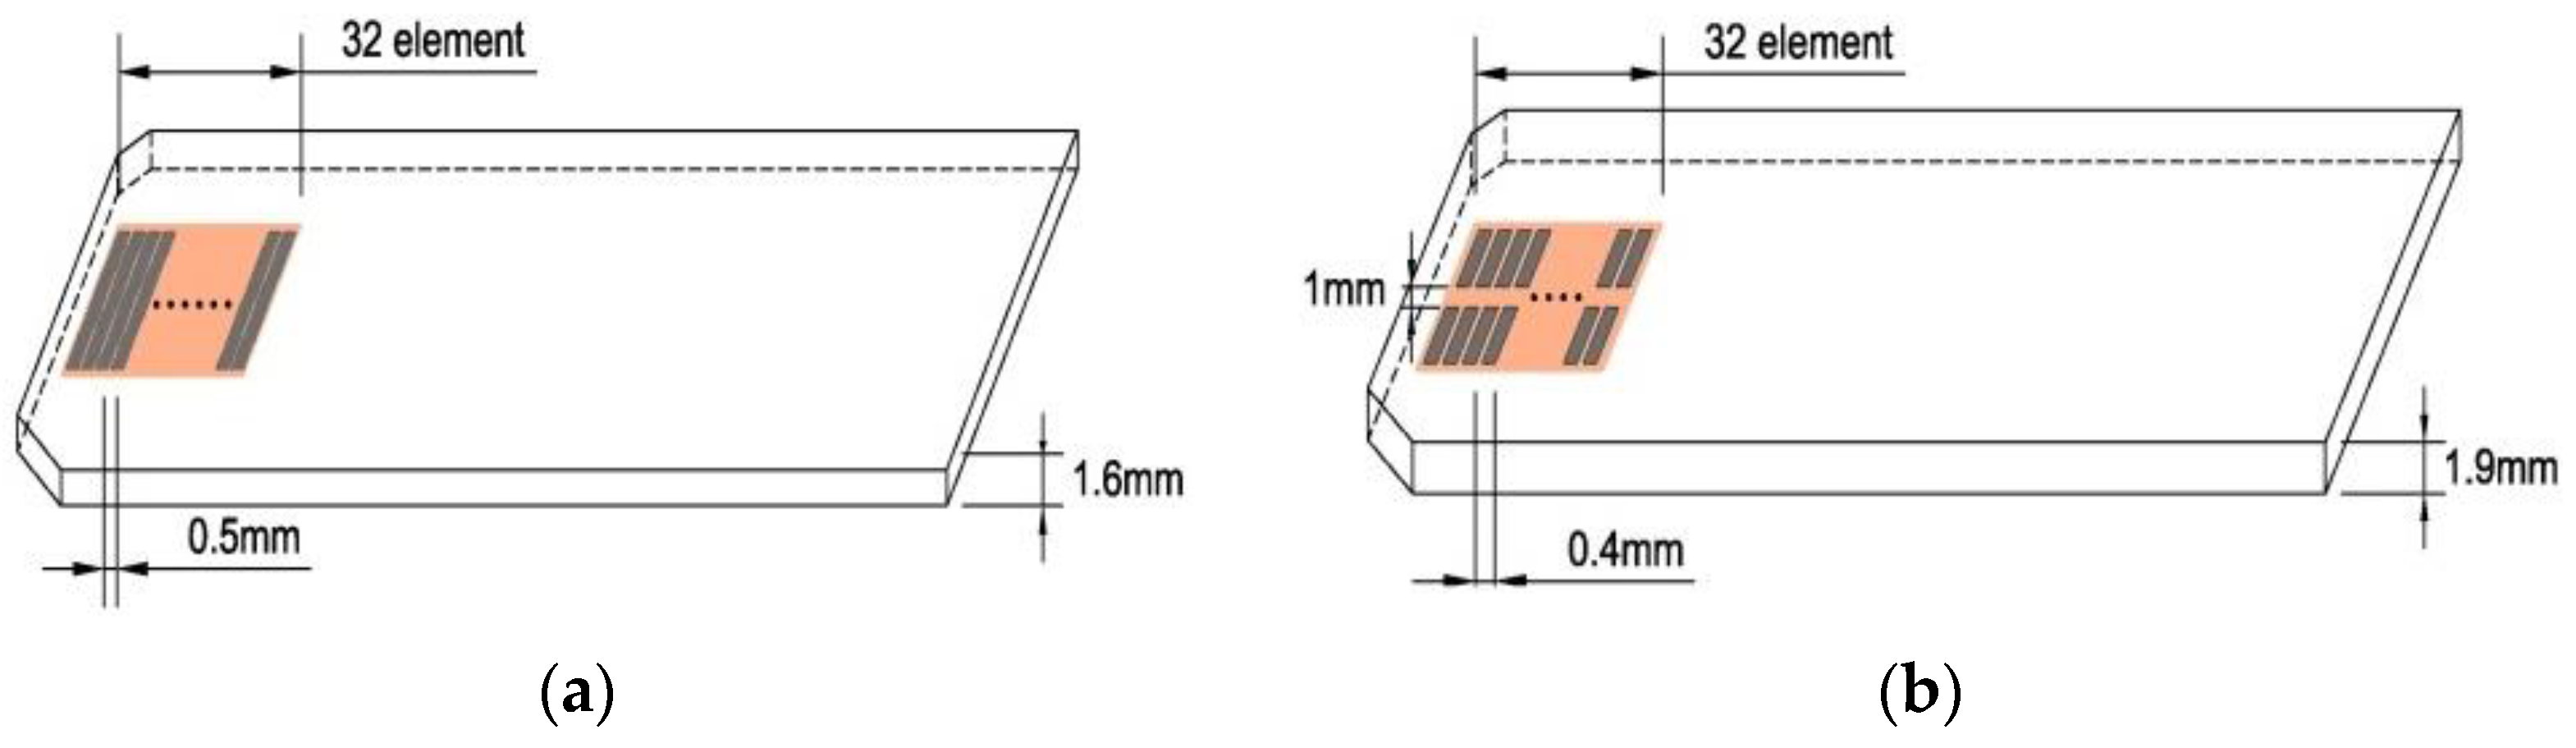
2.2. The Custom Linear FPAPr Design

Two types of FPAPrs were designed, as shown in Figure 5, for an effective application of the PAUT on irregular curvature surfaces or slopes found in field pipelines. The strategic points for the designs were as follows: First, in FPAPr, the element was placed at the probe-end to minimize limited access during weld zone inspection. Second, a transmission–reception (T/R) type element arrayed in a split-type structure was additionally fabricated to allow the application to thin pipes, in contrast to the pulse-echo (P/E) type. When the pulse duration of each piezoelectric element becomes smaller, the grass echo is lowered due to the broadband characteristics, thus improving the SNR [27,28,29]. Third, it was designed to allow stable contact of the PA probe with the curvature surface by adding a flexibility function. The bending property of the probe was thus maintained in different surface curvature shapes [30,31,32,33,34,35]. Lastly, the PA probe design considered the generation of side lobes. The PA probe element was arrayed with a constant pitch. Ultrasound elements propagate rectilinearly, wherein the radiation beam varies according to the pitch, size, gap, and aperture of the element. The side lobe refers to the beam radiated in directions other than the main beam. Particularly, the side lobe generated from an adjacent element could interfere with the main beam, which degrades the ultrasound detection sensitivity or changes the direction of radiation. Such a phenomenon could result in a false signal assessment from the PAUT. In the PA probe design, the pitch must be equal to or lower than half the wavelength ( λ ) to prevent the generation of side lobes [36,37]. Therefore, two types of FPAPr were designed considering the above factors, and their specifications are summarized in Table 1.

2.3. Simulation

In this study, before fabricating the FPAPr, we verified their applicability through a simulation of a weld zone with an irregular shape. The simulation was performed using CIVA, which is mainly used for ultrasonic propagation behavior [38]. The four types of commonly used, irregularly shaped pipes were modeled to perform the simulation, as shown in Figure 6. Table 2 summarizes the data and material properties of the used specimens.
Figure 7 illustrates the scan plans for the simulation. Transverse waves were used for the inspection wave mode, and the 1-skip technique was used to detect defects by reflecting once on the bottom surface for defect detection. Flaws (notch, side drilled hole (SDH), etc.) that could be generated in reality at the irregularly shaped weld zones were modeled by reflecting actual experimental conditions. The probe modeling parameters were identical to the FPAPr fabrication specifications, and the sweep angle was maintained between 35 and 75 ° to allow the control volume to encompass the entire weld zone [39,40,41,42,43,44,45].
Figure 8 shows the simulation results of applying the FPAPr on the flange–elbow, tapered elbow, and branch pipe. The signal sensitivity was a factor that could be used to examine the FPAPr contact wherein the contact and signal sensitivity are proportional to each other. A relatively adequate signal sensitivity was observed from the overall simulation result, which indicated reliable FPAPr contact. Additionally, the location and size of the flaw could be assessed by calculating and applying a suitable focal law.

2.4. FPAPr Fabrication

The FPAPr was fabricated using a composite material consisting of lead zirconate titanate (PZT) and epoxy resin, as illustrated in Figure 9, which was combined with a polyamide film that included a connector for transferring data. The piezoelectric element was fabricated in a neoprene rubber layer housing. Flexibility and bending functions for closely adhering to the curvature-shaped weld zone enabled accurate inspection data acquisition and scanning. The elements were designed to place their matched layer and damper at the end of one side to maintain sufficient accessibility at the weld zone [46,47,48,49,50]. Figure 10 shows the shape of the fabricated FPAPr. The two types of probes were fabricated as a one-dimensional (1D) linear structure P/E type and a dual linear structure T/R type, as shown in Figure 10a,b, respectively.
The FPAPr was designed as a broadband system by widening the frequency bandwidth to a center frequency of 5 MHz to increase the flaw detection resolution above a certain sensitivity. Then, the frequency of the designed FPAPr was analyzed. The center frequency and the frequency bandwidth of each element were analyzed, and the result was presented as an average value for all channels. Figure 11 shows the frequency spectrum and the radio frequency (RF) signal received at the element for analyzing the FPAPr frequency. The JPR-50p from Japan Probe Co., Ltd. was used to analyze the frequency spectrum, wherein the device settings were 0.2 MHz and 100 MHz for the high-pass filter and sampling frequency, respectively [51]. Additionally, the signal was acquired by perpendicularly propagating an ultrasonic beam from a 25 mm thick carbon steel. Figure 11b,d present the 16th channel frequency analysis results from the P/E type and T/R type, respectively, where the center frequencies were 5.4 MHz and 4.6 MHz, respectively [52,53]. The bandwidths of the frequencies were greater than or equal to 110% and exhibited broadband features.
The center frequencies measured in all channels were plotted on a graph in Figure 12. The results show similar center frequencies for all channels. The P/E type average center frequency was about 5.4 MHz, and the T/R type average center frequency was about 4.6 MHz. This satisfies the ISO 18563-2 standard of permission of ±10%. The difference between the average center frequency and each element frequency was a maximum of 6.5% and minimum −7.0%, which satisfies the ±10% standard of permission of the same standard.
The fabricated FPAPr had probes with 32 arrays where each channel was required to show a constant amplitude. This was because flaw detection and quantitative size evaluation are only possible when the amplification rate is constant with the time axis linearity and amplitude linearity for each channel. Figure 13 shows the measured amplitude of each channel. The sensitivity deviation of the P/E and T/R type FPAPr were found to be 2.8 dB and 1.5 dB, respectively. They satisfied the ISO 18563-2 standard of permission of ±3 dB. Table 3 summarizes the aforementioned results and the FPAPr specifications.

3. Experiments

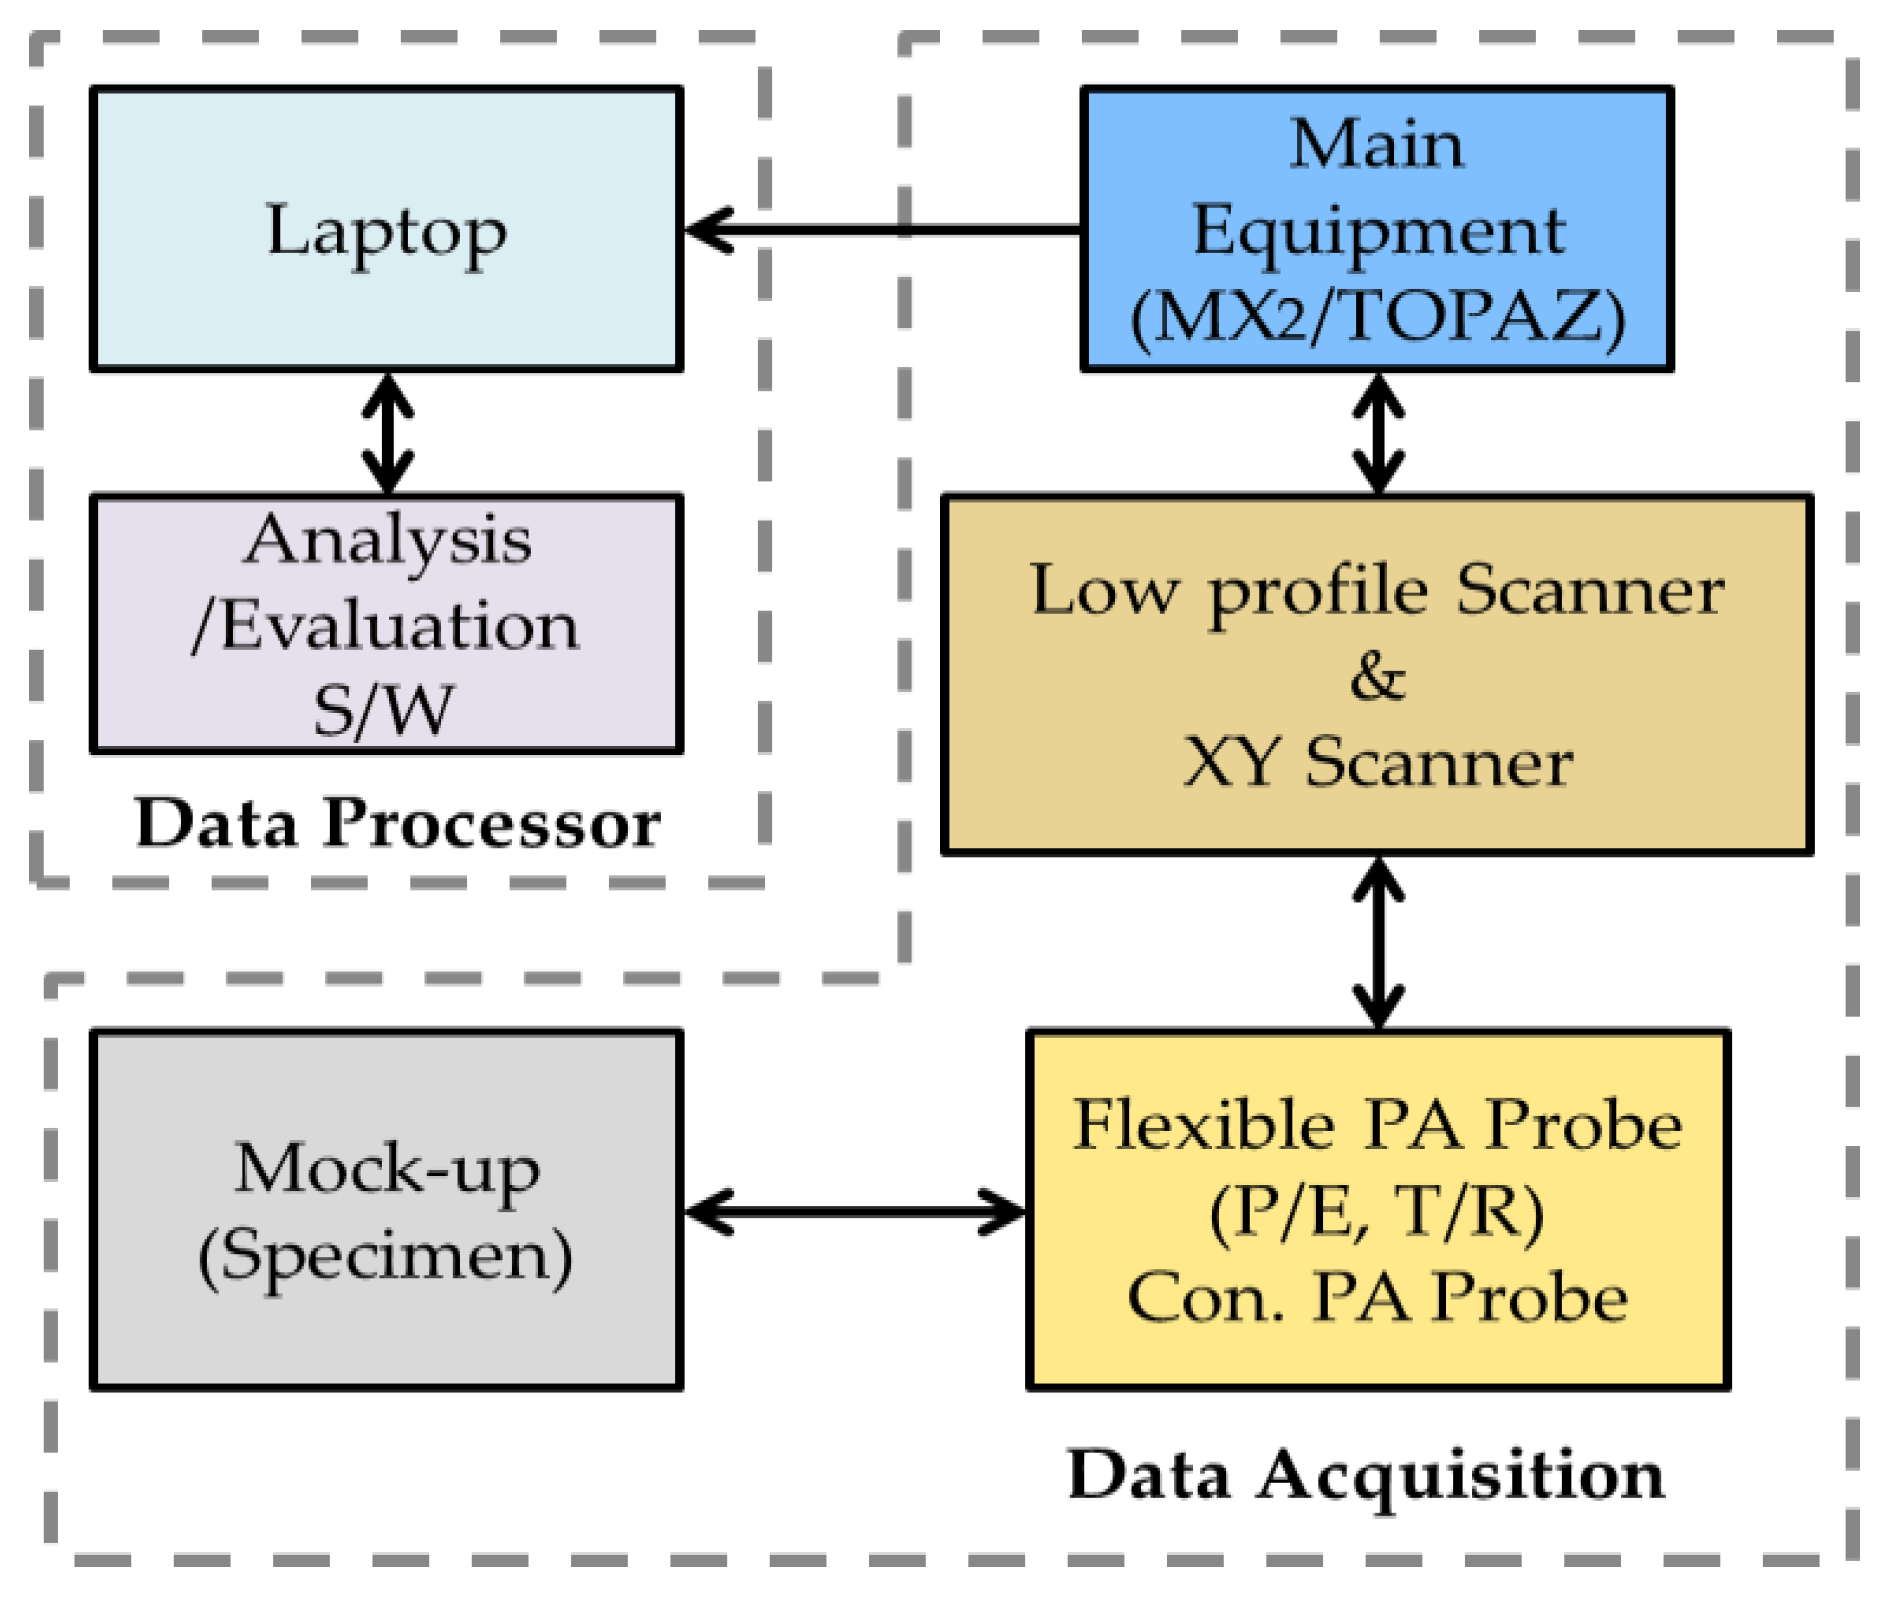
3.1. Experimental Setup

A commercialized PAUT device, namely Topaz/MX2, with a 32/128 channel pulse/receiver function was used for data collection. The experiment was performed as illustrated in Figure 14. First, a mock-up curvature shape specimen was fabricated, and a low-profile scanner that could be attached to the FPAPr was fabricated to obtain consistent data. The collected data were temporarily stored at the main inspection device, followed by signal processing using an internal signal analysis software storage and evaluation [54,55,56].
The FPAPr performance was compared with that of the conventional wedge conclusive type PA probe, and the results were verified. A commercial PA probe that could adhere to a curvature-shaped weld zone was selected as the minimum-probe size for a general PA probe specification, and transverse waves of 4 MHz and 5 MHz (similar to the center frequency of the P/E type FPAPr) were applied for the experiment as specified in Table 4.

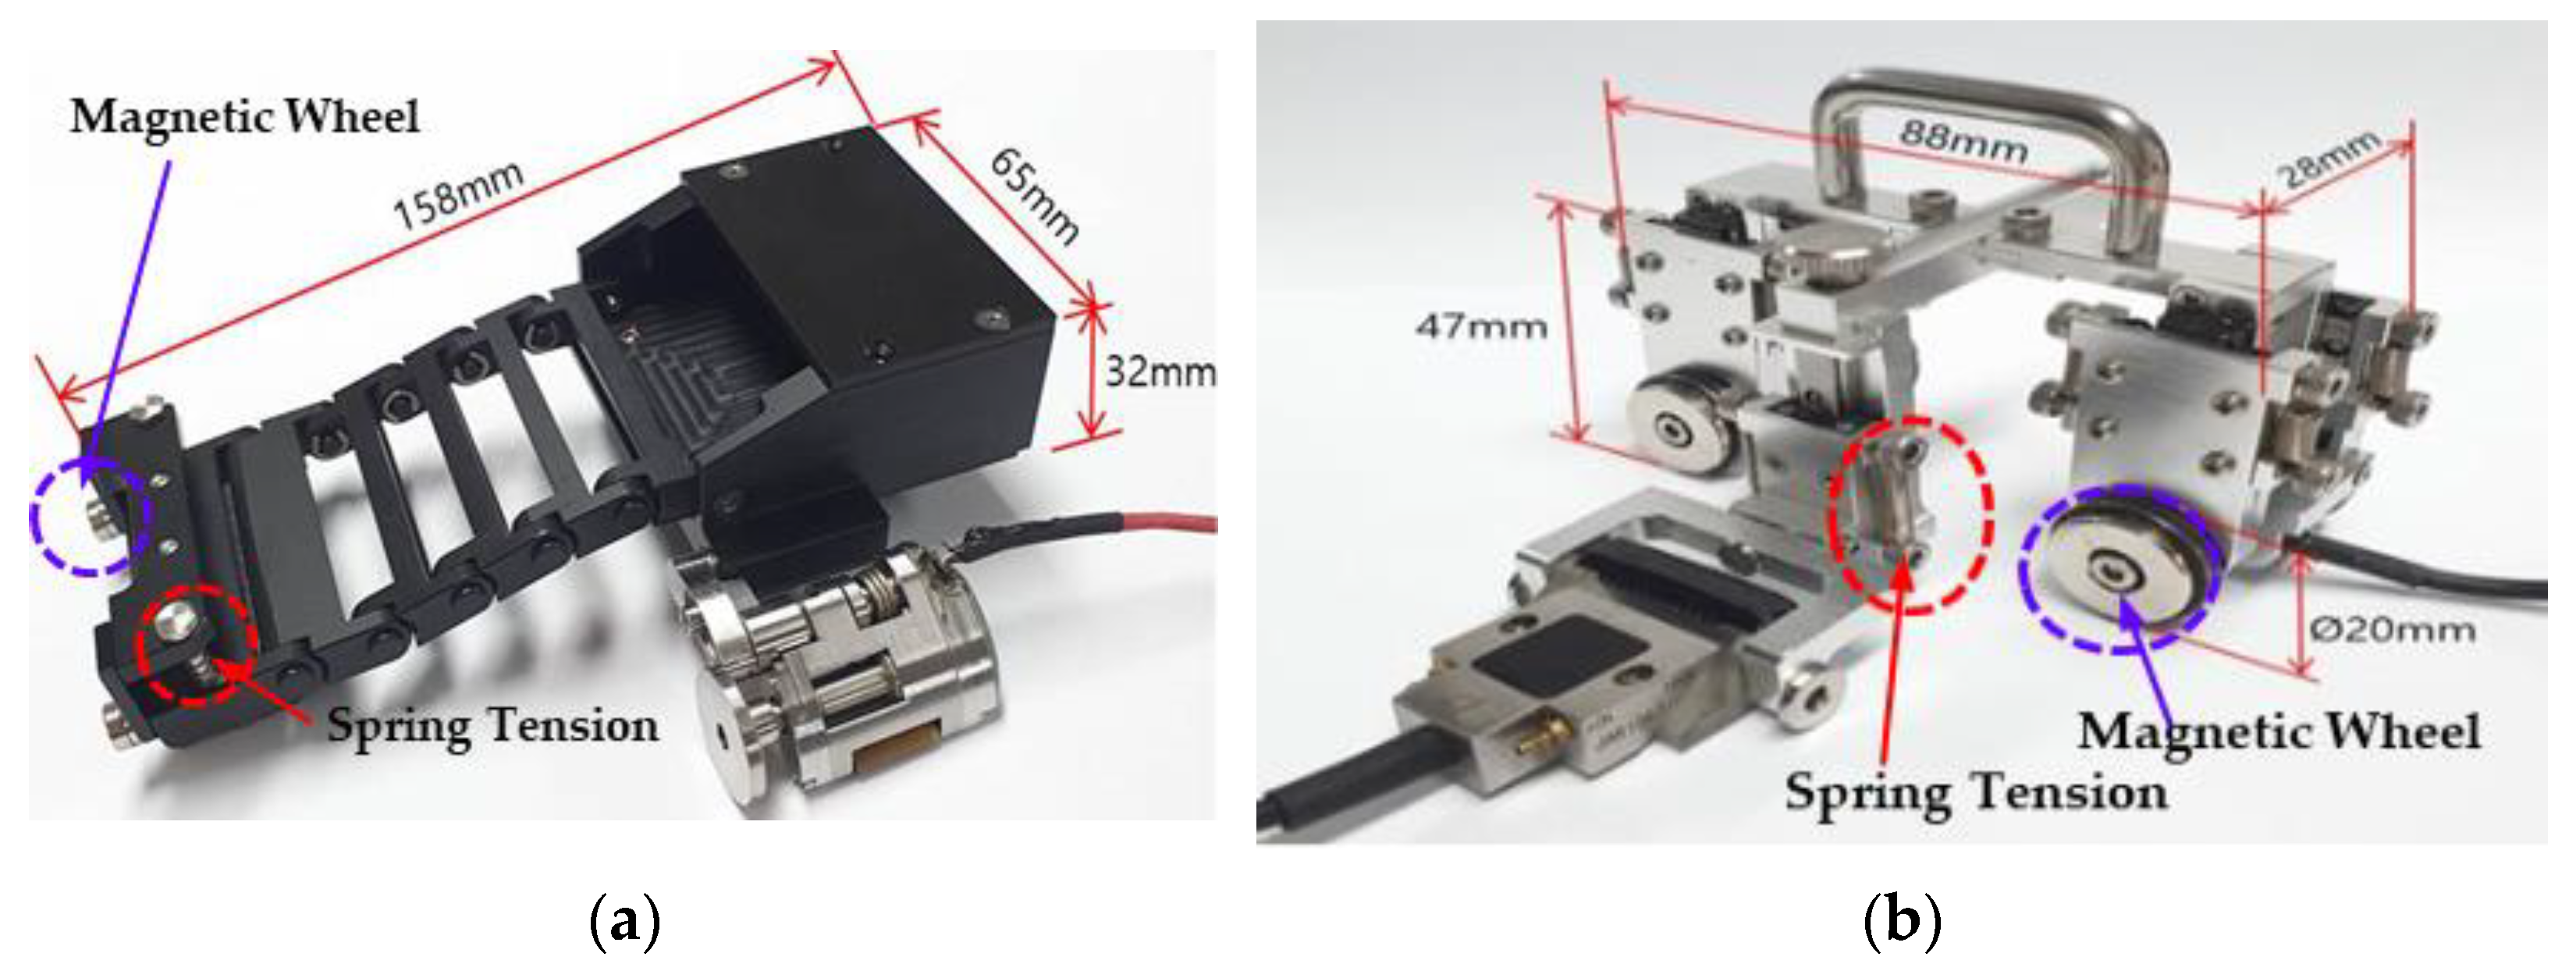
3.2. The Custom Semi-Auto Scanner
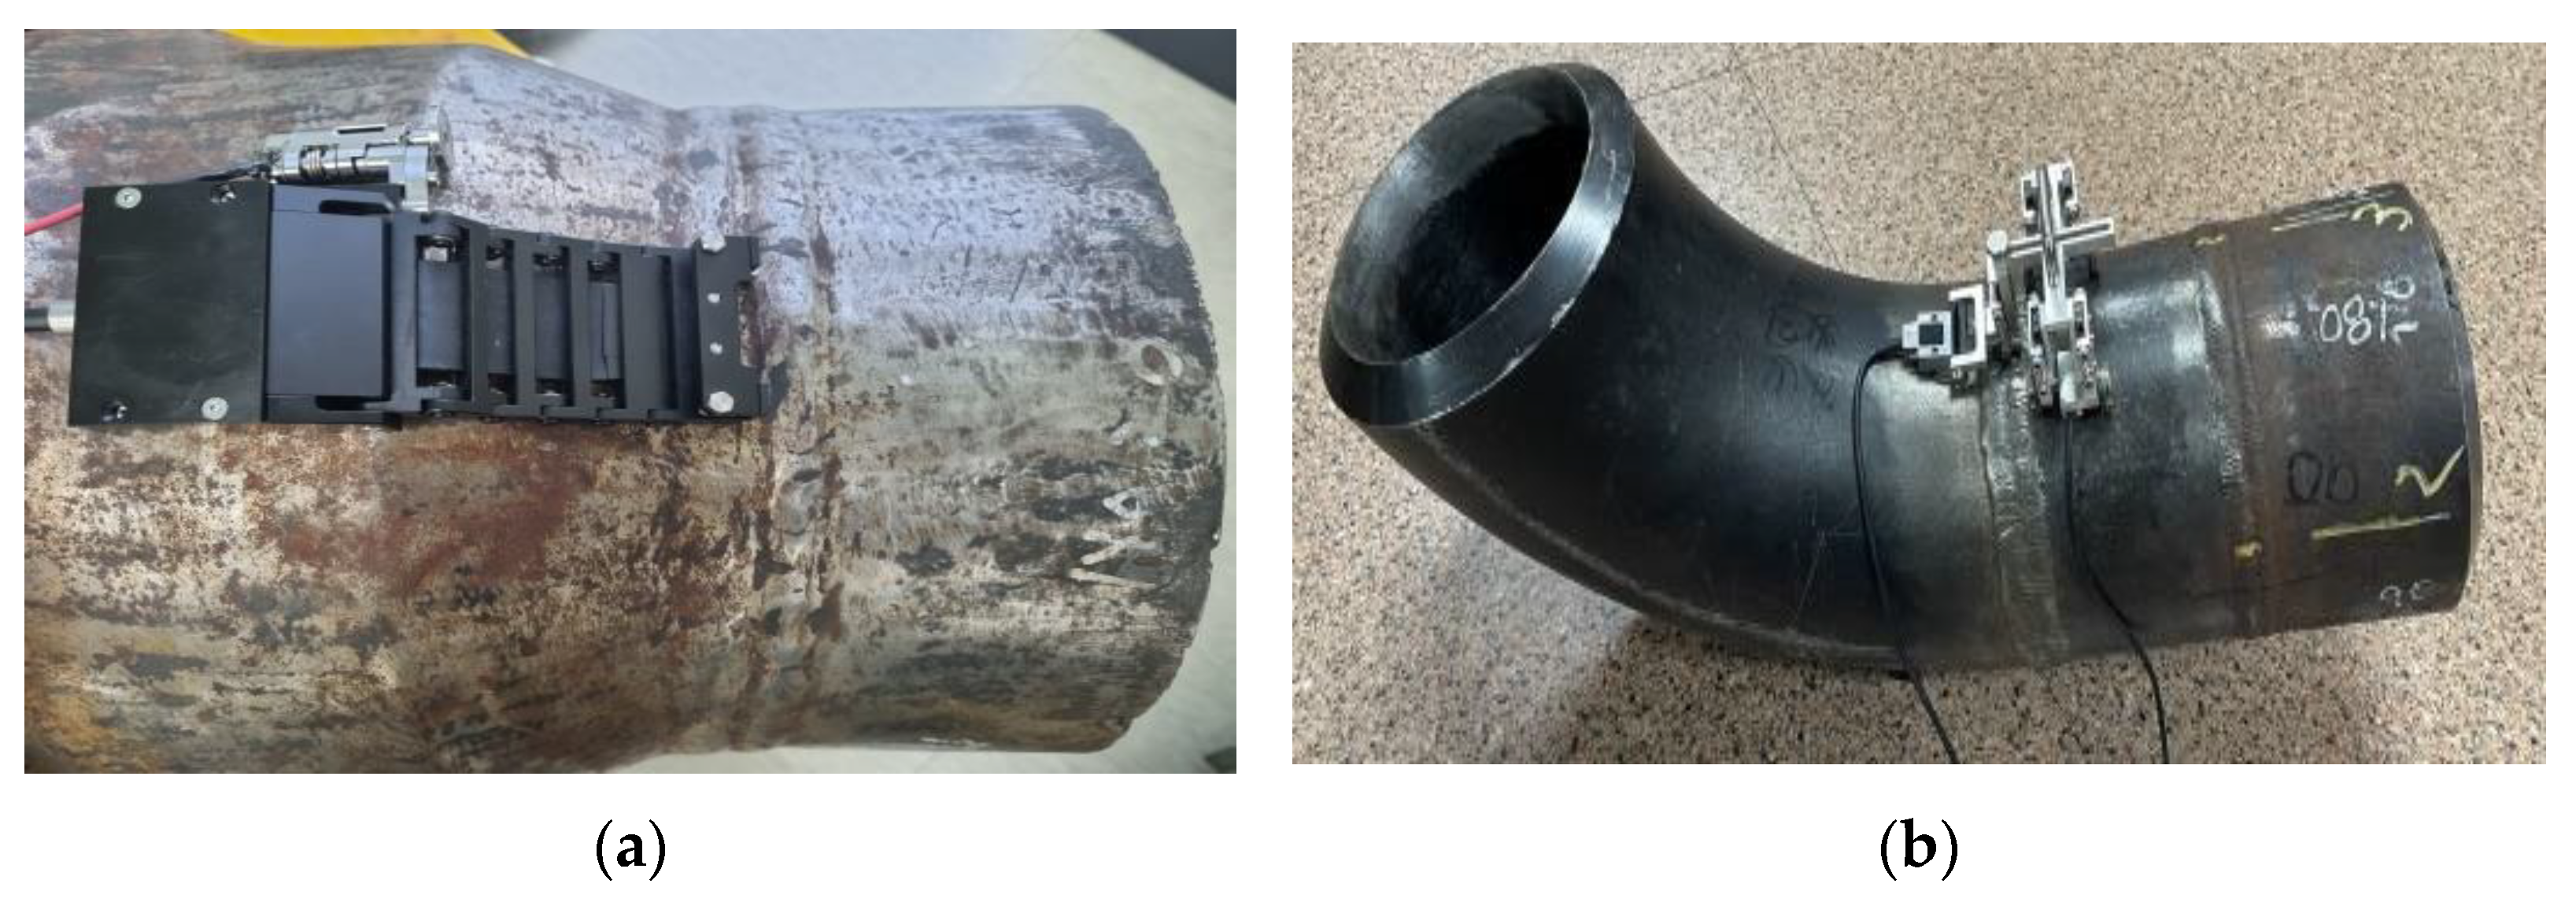
A detail to be considered while using a general scanner is applying uniform pressure on the probe during scanning along the specimen surface. The pressure applied to the probe must vary according to the curvature to maintain a constant surface contact despite the irregular curvature area. Moreover, maintaining constant surface contact despite the curvature change is necessary for obtaining useful signals, which is impossible to achieve using a manual grip. Therefore, a scanner was designed and fabricated to apply a vertical tension function to the element, using a spring such that the FPAPr could acquire data with a stable contact to the pipe curvature. Figure 15a,b shows a low-profile encoder scanner that could use the FPAPr and a semi-automatic XY scanner that could use the existing PA probe, respectively. Additionally, the wheel and body of the scanner had magnetic properties, which could prevent falling during scanning. The design allowed for the selective use of the scanner, depending on the material and curvature shape of the target object.
Consistency and reproducibility were critical while obtaining PAUT inspection data. An encoder is necessary for reproducibility, and hence, an encoder and probe were attached to the semi-automatic scanner. Two semi-automatic scanners, as shown in Figure 16, were employed on the specimens in the experiment.

3.3. Specimens

Figure 17 shows the four specimens used in this experiment. Pipe curvatures that are commonly found in industrial sites were imitated for the irregular shapes of the specimens. Figure 17a,b shows the specimens designed as flange–elbow and flange–reducer, respectively, where each specimen included two weld zones. Additional experiments were conducted on an elbow, a counter-bore, and a branch pipe, as shown in Figure 17c,d, respectively.
Artificial flaws were inserted on the specimens to verify the utility of the fabricated FPAPr and examine its detectability through a verification experiment. The types of flaws implemented were an electrical discharge machine (EDM) notch, an SDH, a lack of fusion (LoF), and a lack of penetration (LoP), and Table 5 lists the specific flaw dimensions of each flaw. A total of 42 types of artificial flaws were fabricated on the five specimens. Figure 18 shows the distribution of flaws according to their types.

4. Results and Discussion

4.1. Comparison of Simulation and Experimental Results

Figure 19 shows the results of the experiment conducted under the same conditions as the simulation (Section 2.3). All flaws were presented as sector-scan (S-scan) images, and no particular skill was applied for flaw characterization. Figure 19a,c shows the results of the upper notch experiment, and Figure 19b shows the results of the improved surface LoF experiment. Generally, a weld overlay is inserted on the resulting image from a PAUT inspection to simplify the assessment of the flaw position. Meanwhile, as shown by the solid line in Figure 19, the restructured weld overlay that considered the actual curvatures in the weld zone could accurately detect the flaw position. Thus, the results were in agreement with the simulation results, and the FPAPr contact at the specimens with curvatures was valid.

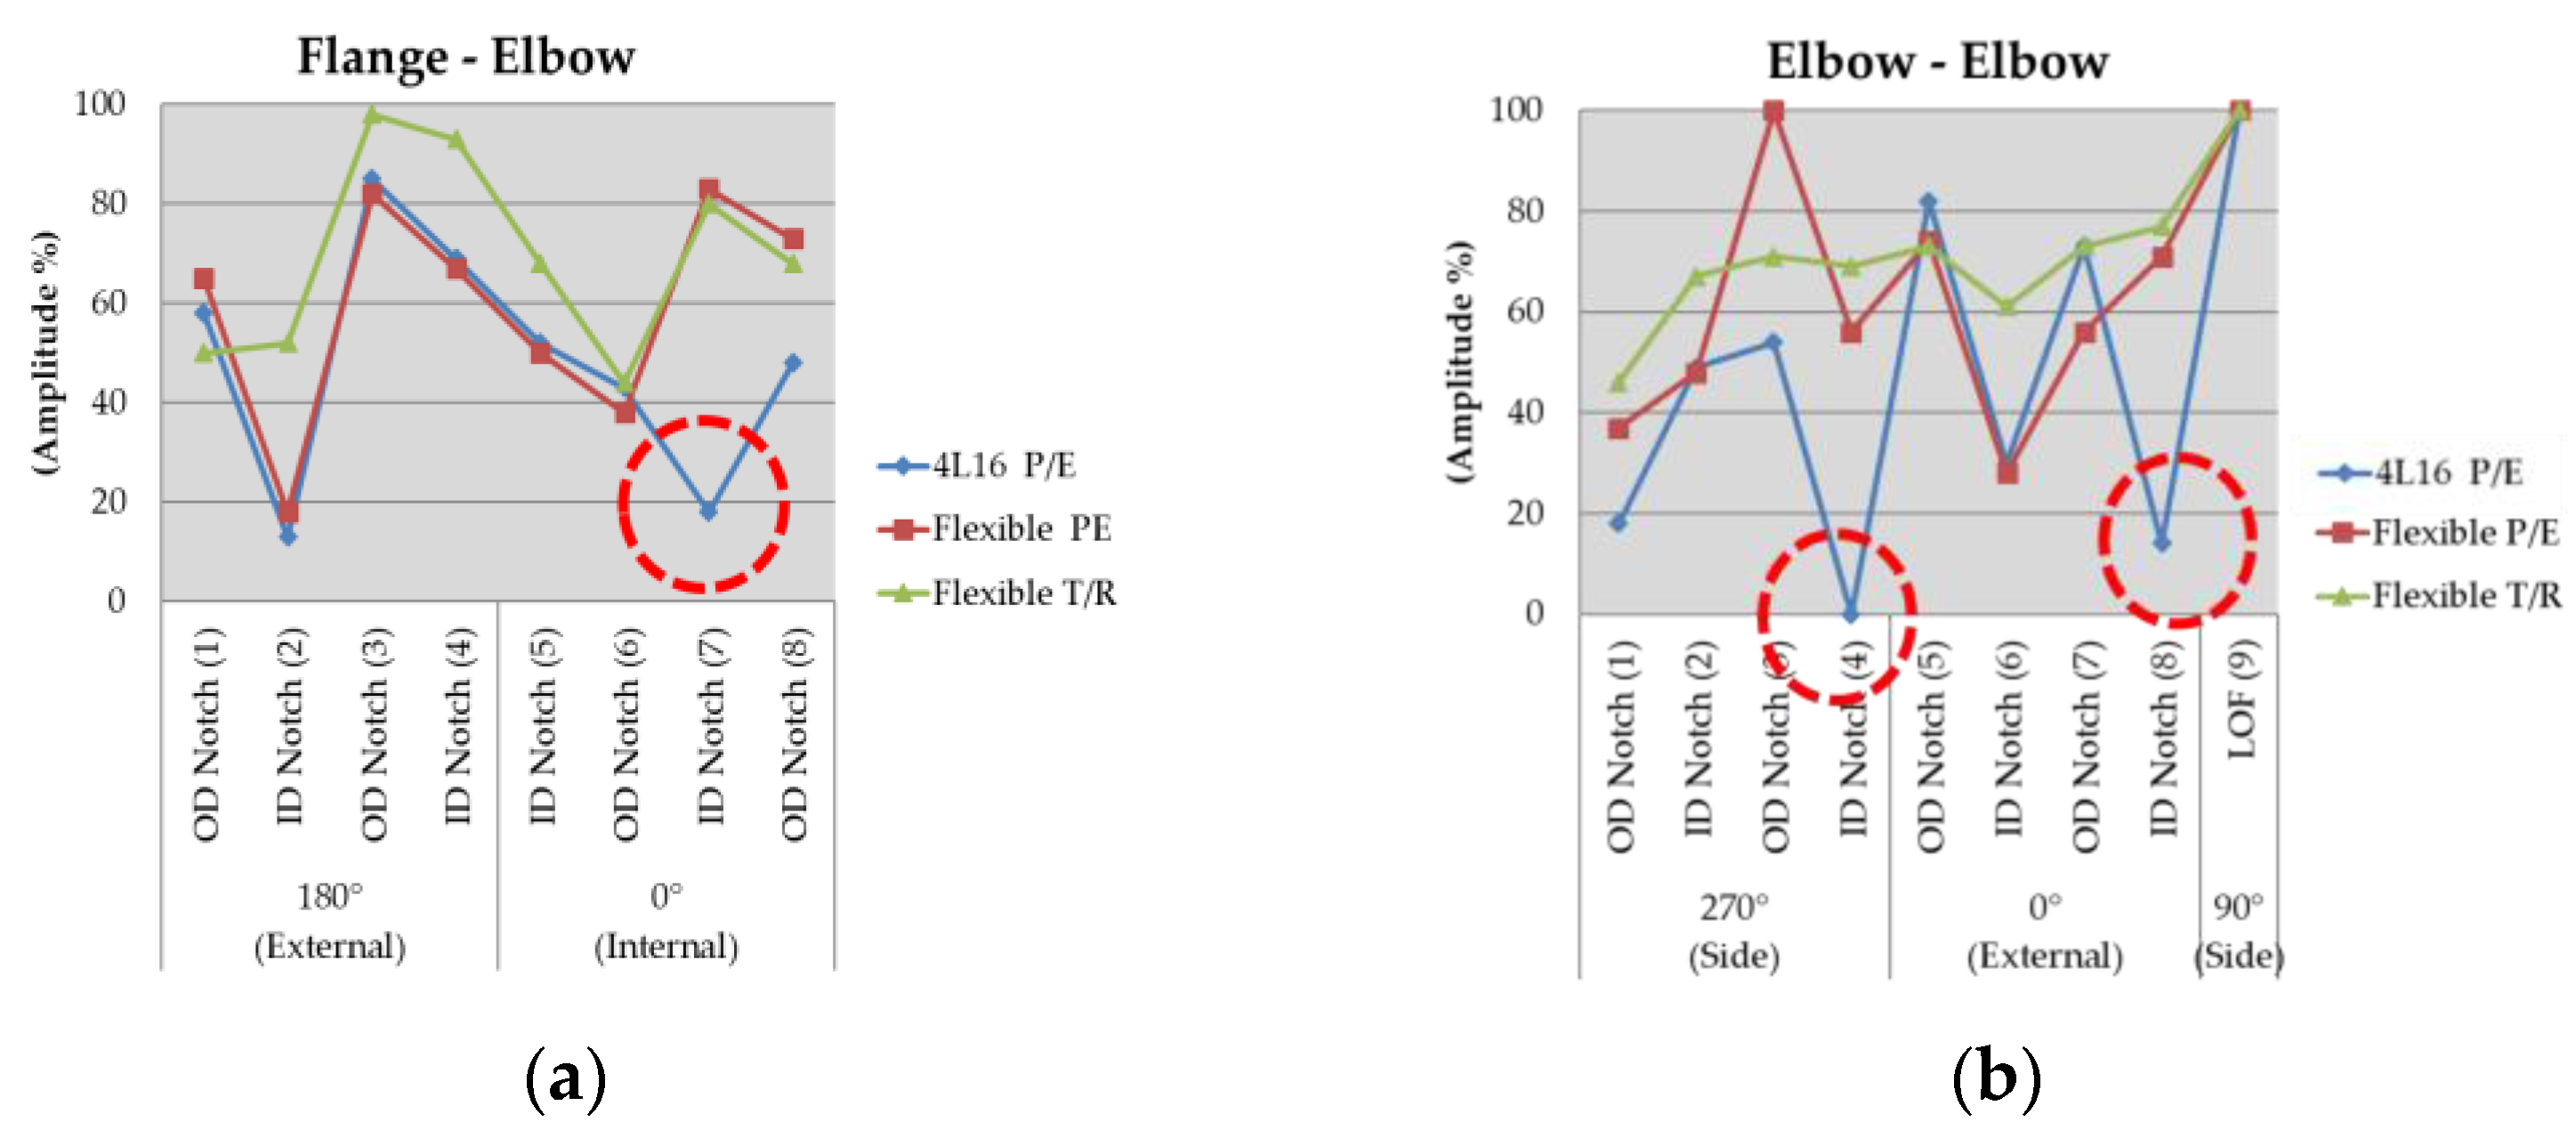
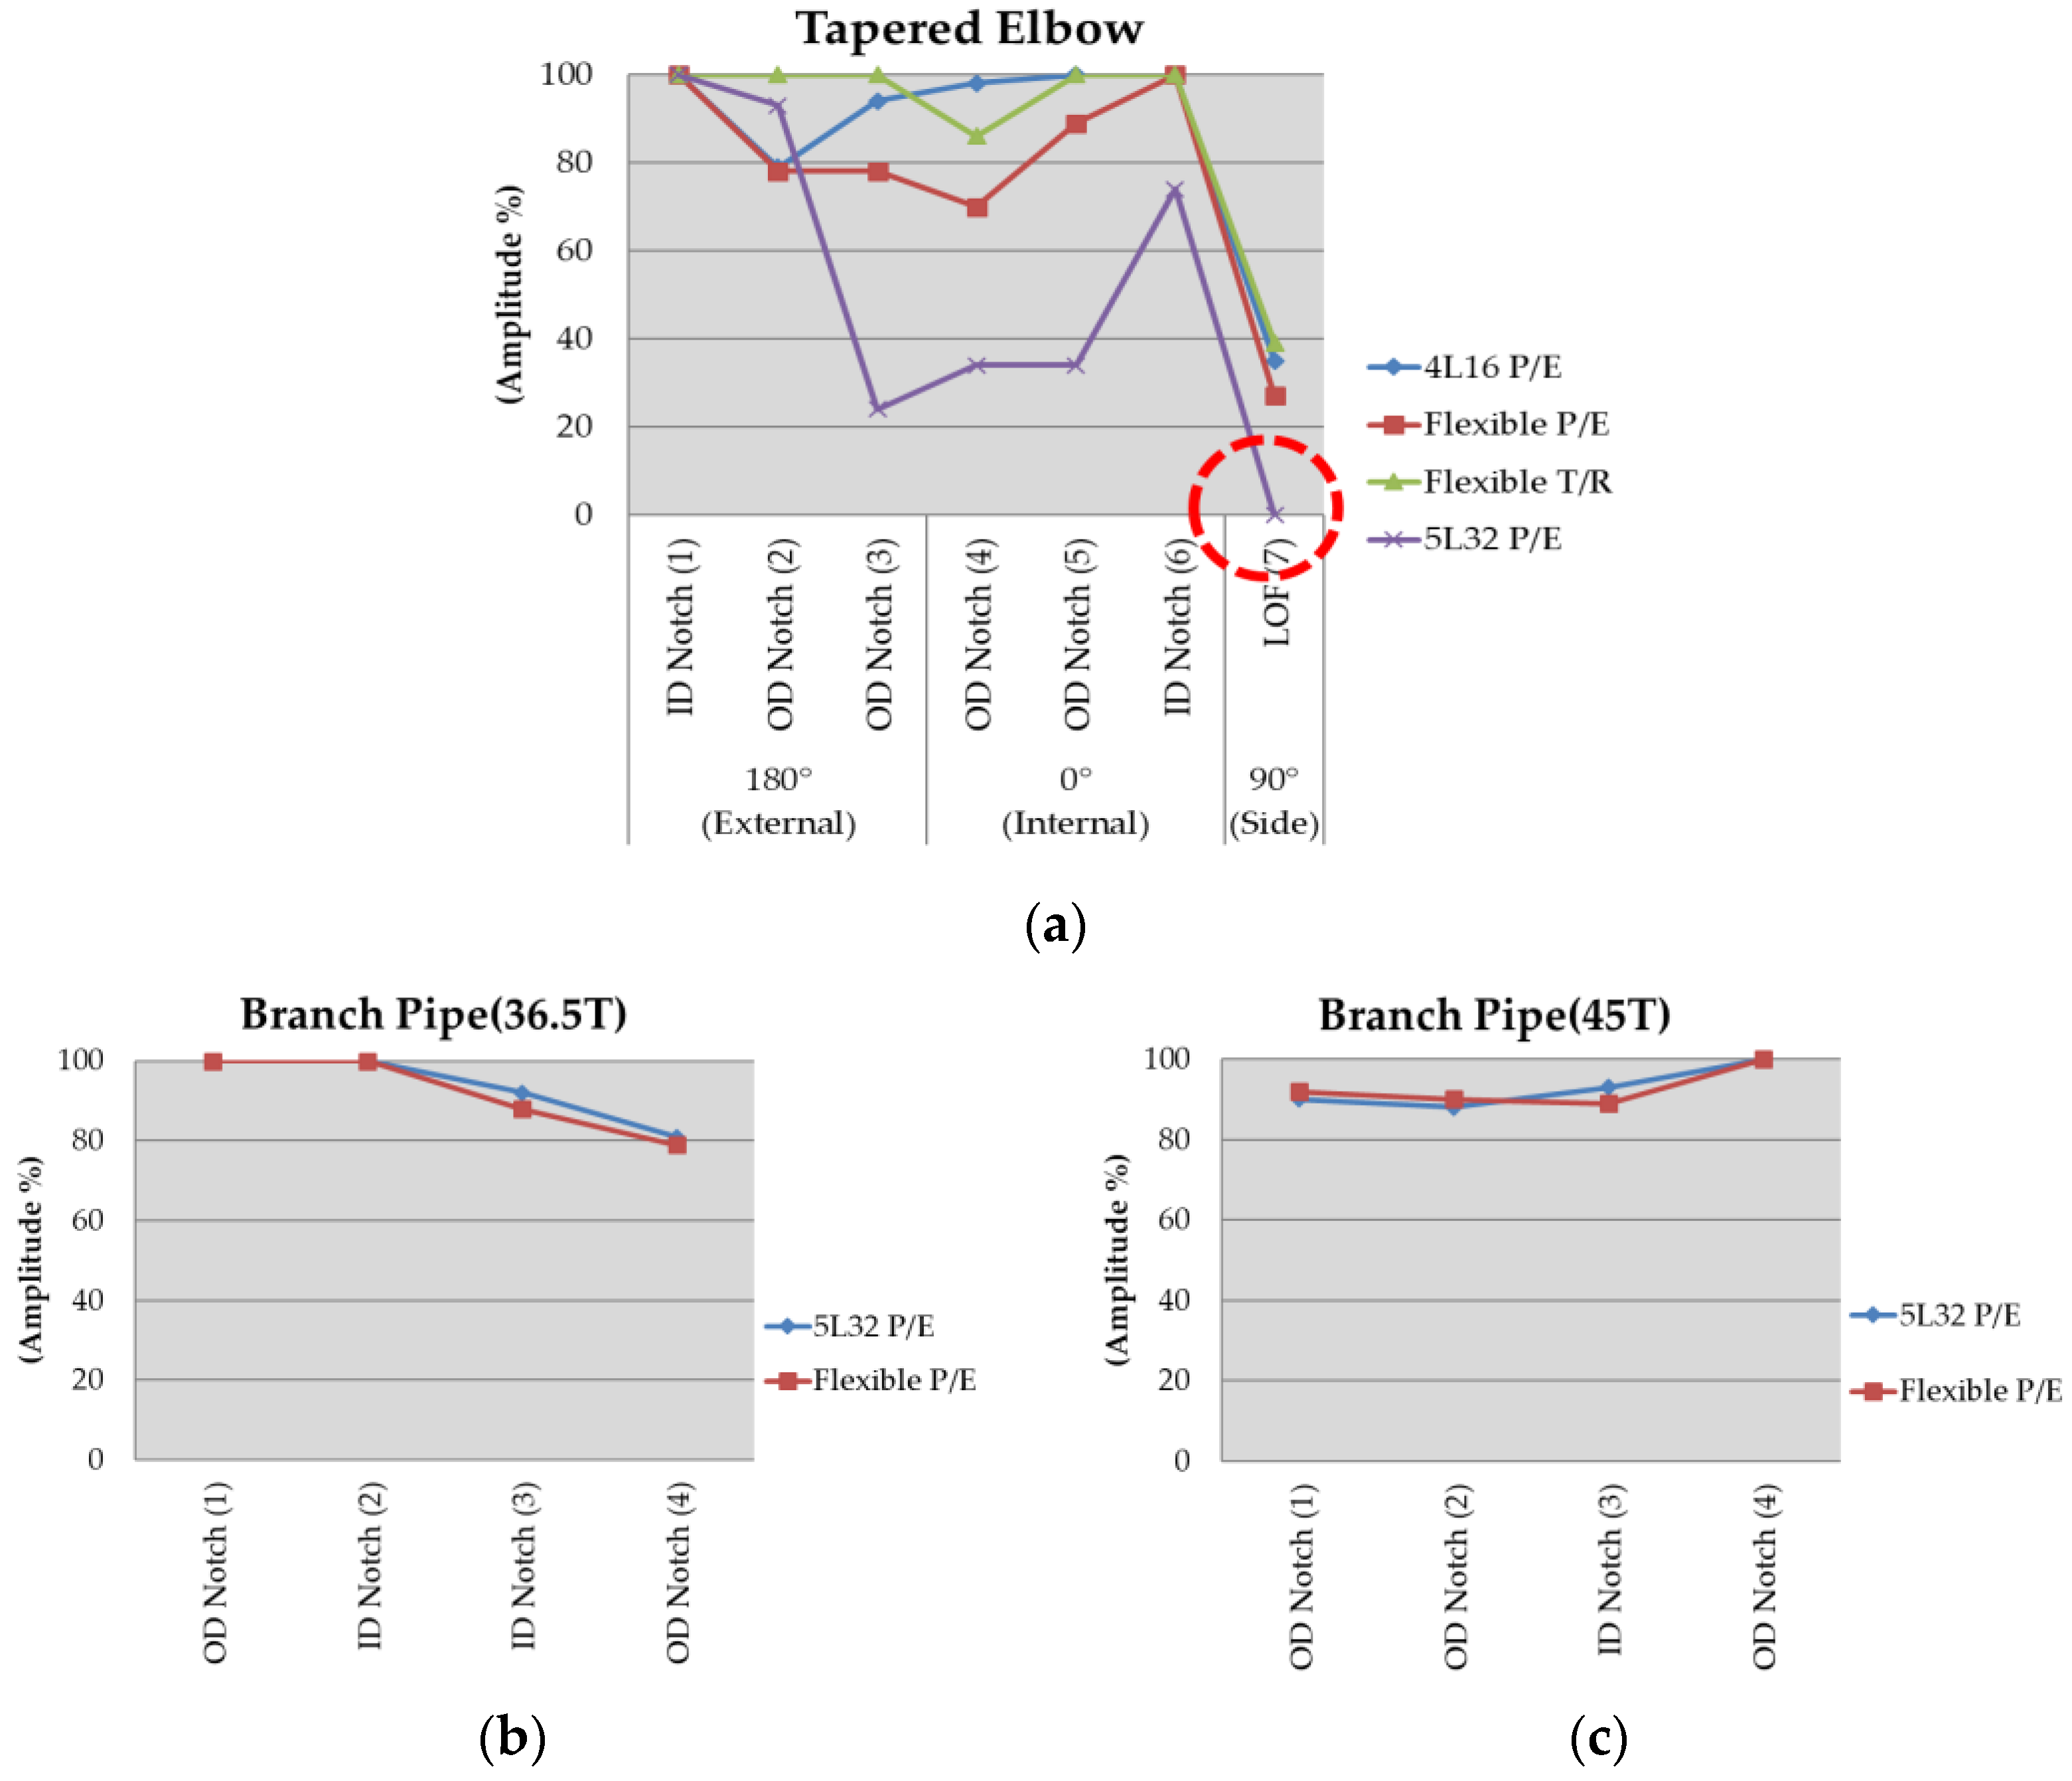
4.2. Comparison of FPAPr and Conventional PA Probe

The FPAPr and conventional PA probe flaw detection sensitivities were compared to verify the performance of the FPAPr, and the results were expressed in terms of their amplitudes. In Figure 20, the angles for each inspection position are specified, as specimens with various curvatures had different contact surfaces depending on the inspection position. All experiments were performed based on a bidirectional inspection. However, data acquisition from the conventional PA probe inspection was problematic, owing to unstable curvature surface contact. Therefore, the data were obtained from the one side that could be inspected. Additionally, a scanner that suited each purpose was used in all the experiments.
Figure 21 shows the amplitude comparison between a total of 17 flaws on the flange–elbow–elbow specimen. A relatively small 4 MHz probe and the FPAPr were used for the flange–elbow–elbow specimen with a large curvature and a small outer diameter (OD). The bidirectional inspection was performed in the experiment, but the general probe was only able to inspect one side due to the curvature at the bending near the flange–elbow (0 ° ) and the overall area of the elbow–elbow. Therefore, low sensitivity at the flaw and flaw detection failure was observed in Figure 21a (7) and Figure 21b (4) and (8), respectively.
Figure 22 shows the amplitude comparison between a total of 12 flaws on the flange–reducer–elbow specimen. Similar to the flange–elbow–elbow inspection, a 4 MHz probe and the FPAPr were used. Near the 0 ° of the flange–reducer and the 180 ° and 270 ° of the reducer–elbow, only one side could be inspected with the general PA probe due to the specimen curvature. Experimental results were similar for the three types of probes. Despite inspecting only one side of the specimen, the PA probe showed results similar to those of the FPAPr.
Figure 23 shows the results for the tapered elbow and branch specimens. A 32-channel 5 MHz probe with a long near field was added to the PA probe. The relatively large 5 MHz probe showed low amplitudes due to the specimen curvatures, as shown in Figure 23a. In flaw (7), flaw detection failed in both directions due to poor contact. Contrarily, for the branch specimen in Figure 23b,c, the FPAPr showed results similar to those of the PA probe because there was devoid of surface curvatures. Therefore, this implied that the FPAPr was applicable in general specimen environments.

5. Conclusions

In this study, we developed a flexible array probe and semi-auto scanner based on novel concepts to enhance the efficiency of non-destructive inspection of complex curvature-shaped specimens that are coupled by welding. In the FPAPr design, the element was placed at one edge of the FPAPr, to minimize the contact area with the target object and maximize the access to the weld zone. Before the fabrication, simulations were conducted to examine the applicability of the FPAPr on specimens with curvature shapes. The simulations were based on models that reflected actual conditions that the designed FPAPr would be applied. It was concluded that adequate FPAPr contact was obtained on the specimens with curvatures when an appropriate focal law was employed, which led to the implication that quantitative assessment of flaws is possible.
The detectability of the FPAPr and PA probe were compared through experiments to verify the FPAPr performance. Artificial flaws were inserted to fabricate specimens with curvature-shaped weld zones, which were inspected by the semi-automatic scanner. The conventional PA probe could partially detect the flaws, and it could classify and characterize the flaws (45% of all specimens). Contrarily, the FPAPr accurately measured the flaw positions in all specimens and successfully classified and characterized the flaws; therefore, all inspection devices were functionally efficient. In conclusion, the FPAPr outperformed the PA probe in terms of flaw detection sensitivity and resolution. Specifically, outstanding results were obtained from the T/R type FPAPr. The use of the semi-automatic scanner was advantageous because artificial factors could be avoided while obtaining inspection results, and the raw data were consistently obtained.
In this study, the reliability of flaw detectability was enhanced by implementing a series of design and fabrication processes, which could secure quality and integrity with the efficient use of RT replacement technology for industrial fields. Furthermore, these inspection devices could serve as more effective tools for complex inspections in industrial sites such as nuclear power, aviation industry, thermal power generation, and plant industry. In this study, the FPAPr and scanner applications were limited to certain curvature pipe shapes used in industrial fields, but future research shall expand the inspection range to various array designs and further improvements.

6. Patents

Patent registration: semi-automatic scanner for branch weld zone ultrasonic inspection (application number: 10-2019-0096631, registration number: 10-2088704).
Pending patent: scanner with flexible probe (application number: 10-2020-0151836).

Author Contributions

Writing, performing experimental work and simulation, original draft preparation and conceptualization, S.J.L. Writng, Formal analysis and simulation, Y.L.K. Validation, S.C. Review and editing supervision, I.K.P. All authors have read and agreed to the published version of the manuscript.

Funding

The Korea Institute of Energy Technology Evaluation and Planning (KETEP), and the Ministry of Trade, Industry, and Energy (MOTIE) of Korea (Grant No. 20181510102130, 20217410100100) supported this work.

Institutional Review Board Statement

The study did not require ethical approval.

Informed Consent Statement

Not applicable.

Data Availability Statement

Data sharing is not applicable.

Conflicts of Interest

The authors declare no conflict of interest.

References

  1. Olympus NDT. Advances in Phased Array Ultrasonic Technology Applications; Olympus NDT: Waltham, MA, USA, 2007; pp. 7–18. [Google Scholar]
  2. Ginzel, E. Phased Array Ultrasonic Technology, 2nd ed.; Eclipse Scientific Products Inc.: Waterloo, ON, Canada, 2013; pp. 23–37. [Google Scholar]
  3. Casual, O.; Poidevin, C.; Cattiaux, G.; Dumas, P. Control of Complex Components with Smart Flexible Phased Arrays. Ultrasonics 2006, 44, e647–e651. [Google Scholar] [CrossRef] [PubMed]
  4. Casula, O.; Toullelan, G.; Roy, O.; Dumas, P. Ultrasonic Nondestructive Testing of Complex Components with Flexible Phased-Array Transducers. In Proceedings of the 10th European Conference on Non-Destructive Testing, Moscow, Russia, 7–11 June 2010. [Google Scholar]
  5. Shin, H.J.; Song, S.J.; Jang, Y.H. Nondestructive Inspection of Steel Structures Using Phased Array Ultrasonic Technique. J. Korean Soc. Nondestruct. Test. 2000, 20, 538–544. [Google Scholar]
  6. Lee, S.; Moon, Y.; Jung, N. Feasibility Study of Flexible Phased Array Ultrasonic Technology Using Irregular Surface Specimen. J. Korean Soc. Nondestruct. Test. 2015, 35, 52–60. [Google Scholar] [CrossRef] [Green Version]
  7. Yoon, B.S.; Yang, S.H.; Kim, Y.S.; Lee, H.J. Procedure Development and Qualification of the Phased Array Ultrasonic Testing for the Nuclear Power Plant Piping Weld. Korean Soc. Nondestruc. Test. 2010, 5, 317–323. [Google Scholar]
  8. Hunter, A.; Drinkwater, B.; Wilcox, P. Autofocusing Ultrasonic Imagery for Non-Destructive Testing and Evaluation of Specimens with Complicated Geometries. NDT E Int. 2010, 43, 78–85. [Google Scholar] [CrossRef]
  9. Jayasinghe, V. Application of Flexible PAUT Probes for Small Diameter Flow Assisted Corrosion Elbow Inspection. In ASNT Annual Conference Paper Summaries; The American Society for Nondestructive Testing, Inc.: Columbus, OH, USA, 2015; pp. 82–86. [Google Scholar]
  10. Chatillon, S.; Cattiaux, G.; Serre, M.; Roy, O. Ultrasonic Non-Destructive Testing of Pieces of Complex Geometry with a Flexible Phased Array Transducer. Ultrasonics 2000, 38, 131–134. [Google Scholar] [CrossRef]
  11. Moran, T.L.; Prowant, M.; Nove, C.A.; Pardini, A.F.; Carwford, S.L.; Cinson, A.D.; Anderson, M.T. Applying Ultrasonic Testing in Lieu of Radiography for Volumetric Examination of Carbon Steel Piping; U.S.NRC: Rockville, MD, USA, 2015; pp. 1–57. [Google Scholar]
  12. Nagai, M.; Lin, S.; Fukutomi, H. Determination of Shape Profile by Saft for Application of Phased Array Technique to Complex Geometry Surface. AIP Conf. Proc. 2012, 1430, 849–856. [Google Scholar]
  13. Shi, K.; Que, K.; Guo, D. Flexible Ultrasonic Phased-Array Probe. Tsinghua Sci. Technol. 2004, 9, 574–577. [Google Scholar]
  14. Lhémery, A.; Calmon, P.; Lecœur-Taıbi, I.; Raillon, R.; Paradis, L. Modeling Tools for Ultrasonic Inspection of Welds. NDT E Int. 2000, 44, 499–513. [Google Scholar] [CrossRef]
  15. Roy, O.; Mahaut, S.; Casula, O. Control of the Ultrasonic Beam Transmitted Through an Irregular Profile Using a Smart Flexible Transducer: Modelling and Application. Ultrasonics 2002, 40, 243–246. [Google Scholar] [CrossRef]
  16. Long, R.; Cawley, P. Further Development of a Conformable Phased Array Device for Inspection over Irregular Surfaces. Am. Inst. Phys. 2008, 975, 754–761. [Google Scholar]
  17. Casula, O.; Poidevin, C.; Cattiaux, G.; Fleury, G. A Flexible Phased Array Transducer for Contact Examination of Components with Complex Geometry. In Proceedings of the 16th World Conference on Nondestructive Testing, Montreal, QC, Canada, 30 August–3 September 2004; pp. 80–87. [Google Scholar]
  18. Lane, C.J. The Inspection of Curved Components Using Flexible Ultrasonic Arrays and Shape Sensing Fibres. Case Stud. Nondestruct. Test. Eval. 2014, 1, 13–18. [Google Scholar] [CrossRef] [Green Version]
  19. Tremblay, P.; Enenkel, L.; Berlanger, J.; Maes, G.; Poirier, J. A Turnkey Weld Inspection Solution Combining PAUT & TOFD. In Proceedings of the NDT in Canada 2014 Conference, Toronto, ON, Canada, 16–18 June 2014. [Google Scholar]
  20. Drinkwater, B.W.; Wilcox, P.D. Ultrasonic Arrays for Non-destructive. Ultrasonic 2006, 39, 525–541. [Google Scholar]
  21. Lemon, D.K.; Posakony, G.J. Linear Array Technology in NDE Applications. Mater. Eval. 1980, 38, 34–37. [Google Scholar]
  22. Bardouillet, P. Application of Electronic Focussing and Scanning Systems to Ultrasonic Testing. NDT Int. 1984, 17, 81–85. [Google Scholar] [CrossRef]
  23. Wooh, S.C.; Shi, Y. Influence of Phased Array Element size on Beam Steering Behavior. Ultrasonic 1998, 36, 737–749. [Google Scholar] [CrossRef]
  24. Azar, L.; Shi, Y.; Wooh, S.-C. Beam Focusing Behavior of Linear Phased Arrays. NDT E Int. 2000, 33, 189–198. [Google Scholar] [CrossRef]
  25. Wooh, S.C.; Shi, Y. Optimization of Ultrasonic Phased Array. In Review of Progress in Quantitative Nondestructive Evaluation; Springer: Berlin/Heidelberg, Germany, 1999; Volume 17, pp. 883–890. [Google Scholar]
  26. Schmerr, L.W. Fundamentals of Ultrasonic Nondestructive Evaluation; Plenum Press: New York, NY, USA, 1988. [Google Scholar]
  27. Usamentiaga, R.; Ibarra-Castanedo, C.; Maldague, X. More than fifty shades of grey: Quantitative characterization of defects and interpretation using SNR and CNR. J. Nondestruct. Eval. 2018, 37, 1–17. [Google Scholar] [CrossRef]
  28. Olympus NDT. Introduction to Phased Array Ultrasonic Technology Applications; Olympus NDT: Waltham, MA, USA, 2004; pp. 61–64. [Google Scholar]
  29. American Society for Nondestructive Testing. Nondestructive Testing Handbook, 3rd ed.; American Society for Nondestructive Testing: Columbus, OH, USA, 2007; Volume 7, pp. 90–91, 144–145. [Google Scholar]
  30. Wooh, S.C.; Shi, Y. Optimum Beam Steering of Linear Phased Array. Wave Motion 1999, 29, 245–265. [Google Scholar] [CrossRef]
  31. Liu, W.; Zhu, C.; Wu, D. Flexible and Stretchable Ultrasonic Transducer Array Conformed to Complex Surfaces. IEEE Electron Device Lett. 2021, 42, 240–243. [Google Scholar] [CrossRef]
  32. Puel, B.; Lesselier, D.; Chatillon, S.; Calmon, P. Optimization of Ultrasonic Arrays Design and Setting Using a Differential Evolution. NDT E Int. 2011, 44, 797–803. [Google Scholar] [CrossRef]
  33. Wooh, S.C.; Shi, Y. A Simulation study of the Beam Steering Characteristics for Linear Phased Arrays. J. Nondestruct. Eval. 1999, 18, 39–57. [Google Scholar] [CrossRef]
  34. Schmerr, L.W. A Multi Gaussian Ultrasonic Beam Model for High Performance Simulations on a Personal Computer. Mater. Eval. 2000, 58, 882–888. [Google Scholar]
  35. Nakahata, K.; Kono, N. 3-D modeling of an ultrasonic Phased Array Transducer and its Radiation Properties in solid. In Ultrasonic Waves; Intech: London, UK, 2012; pp. 60–80. [Google Scholar]
  36. Jung, M.J.; Park, B.C.; Lim, C.O.; Lee, J.C.; Shin, S.C. Selection of PAUT Probes for Submarine Pressure Hull Integrity Assessment. Int. J. Naval Archit. Ocean Eng. 2020, 12, 578–595. [Google Scholar] [CrossRef]
  37. Jing, H.; She-yu, Z.; Shi-guan, Z.; Pei-wen, Q. Characteristic Research on Focused Acoustic Field of Linear Phased Array Transducer. In Proceedings of the 2009 9th International Conference on Electronic Measurement & Instruments, Beijing, China, 16–19 August 2009; pp. 792–795. [Google Scholar]
  38. Schumacher, E.; Roth, D. CIVA Simulation Software for NDT Applications. In Proceedings of the NDT in Canada 2009 National Conference, London, ON, Canada, 25–27 August 2009. [Google Scholar]
  39. Mendelsohn, Y.; Wiener-Avnear, E. Simulations of Circular 2D Phased-Array Ultrasonic Imaging Transducers. Ultrasonics 2002, 39, 657–666. [Google Scholar] [CrossRef]
  40. Dheeraj, P.R.; Mohsin, I.; Mohiuddin, S.K.; Masroor, S.H. Effect of Focal Law Parameters on Probability of Detection in Phased Array Ultrasonic Testing Using a Simulation and Case Study Approach. Mater. Eval. 2016, 74, 1574–1591. [Google Scholar]
  41. Roy, O.; Chatillon, M.S. Ultrasonic Inspection of Complex Geometry Component Specimen with a Smart Flexible Contact Phased Array Transducer: Modeling and Application. In Proceedings of the 2000 IEEE Ultrasonics Symposium, San Juan, PR, USA, 22–25 October 2000; pp. 763–766. [Google Scholar]
  42. Tremblay, P.; Verspeelt, D. Design&Validation of a Semi-Flexible PAUT Probe for the Manufacturing Inspections of Large Forged Rotors. In Proceedings of the 9th International Conference on NDE in Relation to Structural Integrity for Nuclear and Pressurized Components, Seattle, WA, USA, 22–24 May 2012; pp. 371–379. [Google Scholar]
  43. Ahmad, R.; Kundu, T.; Placko, D. Modeling of Phased Array Transducers. Acoust. Soc. Am. 2005, 117, 1762–1776. [Google Scholar] [CrossRef] [PubMed]
  44. Jen, C.K.; Kobayashi, M. Flexible Ultrasonic Transducers. IEEE Trans. Ultrason. Ferroelectr. Freq. Control 2006, 53, 1478–1486. [Google Scholar]
  45. Lim, S.; Park, I.; Park, T. Application of Stainless Steel with Weld Curvature. J. Korean Soc. Nondestruc. Test. 2020, 40, 139–144. [Google Scholar] [CrossRef]
  46. Shih, J.L.; Wu, K.T.; Jen, C.K.; Chiu, C.H.; Tzeng, J.C.; Liaw, J.W. Applications of Flexible Ultrasonic Transducer Array for Defect Detection at 150 °C. Sensors 2013, 13, 975–983. [Google Scholar] [CrossRef]
  47. Taheri, H.; Hassen, A.A. Nondestructive Ultrasonic Inspection of Composite Materials: A comparative Advantage of Phased Array Ultrasonic. Appl. Sci. 2019, 9, 1628. [Google Scholar] [CrossRef] [Green Version]
  48. Kino, G.S. Acoustic Waves: Devices, Imaging and Analog Signal Processing; Prentice-Hall: Englewood Cliffs, NJ, USA, 1987; pp. 4–8. [Google Scholar]
  49. Schwartz, H.P. Development of a Divided-Ring Array for Three-Dimensional Beam Steering in Ultrasonic Nondestructive Testing: Theoretical and Experimental results of a Prototype. Mater Eval. 1987, 45, 951–957. [Google Scholar]
  50. Lei, X.; Wirdelius, H.; Rosell, A. Experimental Validation of a Phased Array Probe Model in Ultrasonic. Ultrasonics 2020, 108, 1–9. [Google Scholar] [CrossRef] [PubMed]
  51. Japan Probe JPR-50p Specifications. Available online: http://www.jp-probe.com/en/product/up_img/1406701067-594654_f1.pdf (accessed on 5 December 2021).
  52. Markel, J. FFT pruning. IEEE Trans. Audio Electroacoust. 1971, 19, 305–311. [Google Scholar] [CrossRef]
  53. Holmberg, P. Robust ultrasonic range finder-an FFT analysis. Meas. Sci. Technol. 1992, 3, 1025. [Google Scholar] [CrossRef]
  54. Vezzetti, D.J. Propagation of Bounded Ultrasonic beams in Anisotropic media. J. Acoust. Soc. Am. 1985, 78, 1103–1108. [Google Scholar] [CrossRef]
  55. Maes, G.; Berlanger, J.; Reilly, D.; Richard, D. Advanced 3D Visualization and Analysis of Phased Array UT Inspection Data; ZETEC: Quebec, QC, Canada, 2012; pp. 859–868. [Google Scholar]
  56. Holmes, C.; Drinkwater, B.W.; Wilcox, P.D. Advanced Post-Processing for Scanned Ultrasonic Arrays: Application to Defect Detection and Classification in Non-Destructive Evaluation. Ultrasonic 2008, 48, 636–642. [Google Scholar] [CrossRef] [PubMed]
Figure 1. Piping and fitting with various curvature structures: (a) elbow; (b) flange and reducer.
Applsci 12 00748 g001
Figure 2. Images of the geometry of the accessibility limitation and non-contact by standard wedge PA probes on elbow curvature of pipe: (a) non-contact image by solid wedge fastening to conventional smallest PA probe in flange–elbow curved pipe; (b) difficulty in surface contact as the size of the rigid wedge mounted to the PA probe increases.
Applsci 12 00748 g002
Figure 3. Beam steering according to time delay in PAUT.
Applsci 12 00748 g003
Figure 4. Phased array probe parameters.
Applsci 12 00748 g004
Figure 5. Images of phased array probe with a flexible structure geometry excluding solid wedge: (a) 32channel(ch), P/E, pitch 0.5 mm; (b) 32ch × 2, T/R, pitch 0.4 mm.
Applsci 12 00748 g005
Figure 6. Actual specimens applied to the simulation; (a) a pipe with 100 mm diameter flange–elbow structure; (b) a pipe with 150 mm diameter tapered elbow structure; (c) a pipe with 300 mm diameter tapered upper structure.
Applsci 12 00748 g006
Figure 7. Scan plan drawing for simulation; (a) index offset 8 mm, sweep angle 35–75 ° assigned for the flange–elbow structure; (b) index offset 20 mm, sweep angle 35–70 ° assigned for tapered elbow structure; (c) index offset 62 mm, sweep angle 35–70 ° assigned for tapered upper structure.
Applsci 12 00748 g007aApplsci 12 00748 g007b
Figure 8. Simulation results from various curvature specimens; (a) upper notch of the flange–elbow specimen; (b) lack of fusion of the tapered elbow specimen; (c) upper notch of the upper-tapered specimen.
Applsci 12 00748 g008
Figure 9. Images of phased array probe with a flexible structure geometry: The cross-section of T/R probe.
Applsci 12 00748 g009
Figure 10. Images of phased array probe excluding solid wedge; (a) a photo of an FPAPr manufactured in P/E type; (b) a photo of an FPAPr manufactured in T/R type.
Applsci 12 00748 g010
Figure 11. Results of 16th channel frequency analysis: (a) echo pattern of P/E type FPAPr; (b) fast Fourier transform (FFT) analysis results of P/E type FPAPr; (c) echo pattern of T/R type FPAPr; (d) FFT analysis results of T/R type FPAPr.
Applsci 12 00748 g011aApplsci 12 00748 g011b
Figure 12. Center frequency for every FPAPr elements: (a) P/E type FPAPr; (b) T/R type FPAPr.
Applsci 12 00748 g012
Figure 13. FPAPr amplitudes of elements: (a) P/E type FPAPr; (b) T/R type FPAPr.
Applsci 12 00748 g013
Figure 14. Schematic diagram of experimental setup.
Applsci 12 00748 g014
Figure 15. Schematic diagram of scanners designed to be driven on pipe curvature: (a) low-profile scanner with flexible PA probe; (b) encoded XY scanner for wedge.
Applsci 12 00748 g015
Figure 16. Semi-automatic scanner employed an actual specimen: (a) scanner with FPAPr and encoder attached; (b) scanner with PA probe and encoder attached.
Applsci 12 00748 g016
Figure 17. Actual mock-ups utilized to obtain experimental data: (a) 100 mm curvature pipe with elbow–flange construction geometry; (b) 75 mm, 100 mm curvature pipe with elbow–flange–reducer construction geometry; (c) 150 mm curved pipe with tapered elbow construction geometry; (d) heavy wall pipe with taper formed on the surface of a 300 mm, 400 mm specimen.
Applsci 12 00748 g017
Figure 18. Distribution of flaws according to each specimen.
Applsci 12 00748 g018
Figure 19. S-scan image results of flaws detected by the FPAPr on the pipe specimens: (a) flange–elbow weld zone surface notch flaw image; (b) tapered elbow weld interior LoF flaw image; (c) upper-tapered weld upper notch flaw image.
Applsci 12 00748 g019aApplsci 12 00748 g019b
Figure 20. Angles for each inspection position on the experimental welding test pieces: (a) 100 mm curvature pipe with elbow–flange construction geometry; (b) 75 mm, 100 mm curvature pipe with elbow–flange–reducer construction geometry.
Applsci 12 00748 g020
Figure 21. Flange–elbow–elbow specimen inspection results: (a) flange to elbow; (b) elbow to elbow.
Applsci 12 00748 g021
Figure 22. Flange–reducer–elbow specimen inspection results: (a) flange to reducer; (b) reducer to elbow.
Applsci 12 00748 g022
Figure 23. Tapered elbow and branch specimen inspection results: (a) tapered elbow, (b) branch pipe, (c) branch pipe.
Applsci 12 00748 g023
Table 1. Specifications of the two types of FPAPr.
Probe TypeFPAPr(P/E)FPAPr(T/R)
Total Elements (ch)3232 × 2
Nominal frequency
(MHz)
55
Aperture (mm)1612.8
Elevation (mm)105
Pitch (mm)0.50.4
Gap (mm)0.10.1
Table 2. Specifications of the curved pipes used in the simulation.
TypeElbow–Flange–ReducerTapered Elbow to PipeUpper-Tapered Pipe
MaterialCarbon SteelCarbon SteelCarbon Steel
Longitudinal Velocity 5900   m / s 5900   m / s 5900   m / s
Transverse
Velocity
3230   m / s 3230   m / s 3230   m / s
Density7.8 × 103 kg/m37.8 × 103 kg/m37.8 × 103 kg/m3
A diameter100 mm150 mm300, 350 mm
Thickness8 mm14.8, 20.0 mm36.5, 51 mm
Table 3. Specifications of the FPAPr probes applied to the experiment.
Probe TypeFPAPr (P/E)FPAPr (T/R)
Total elements (ch)3232 × 2 (64)
Center Frequency (MHz)5.44.5
Center Frequency Dispersion (%)Max + 4.2%
Min − 7.0%
Max + 6.5%
Min − 2.7%
Sensitive Dispersion (dB)2.8 dB1.5 dB
Rel.BW (%)114113
Table 4. Specifications of the commercially available PA probes mounted on rigid solid wedges.
Probe Type
(Mounted Rigid Wedge)
Conventional PA(P/E)
4L165L32
Total elements (ch)1632
Nominal center frq.(MHz)45
Rel.BW (%)13191
Pitch (mm)0.51
Aperture (mm)832
Elevation (mm)1010
Table 5. The dimension of the defects presents inside each specimen.
Flaw TypeLength (mm)Width (mm)Height (mm)
Notch6, 10~301~20.6~2
LoP10~20, 522~3
LoF6~10, 1222~2.5
SDH25-2
Publisher’s Note: MDPI stays neutral with regard to jurisdictional claims in published maps and institutional affiliations.

