Article

BIM for Landscape Design Improving Climate Adaptation Planning: The Evaluation of Software Tools Based on the ISO 25010 Standard

Department of Design Engineering and Mathematics, Faculty of Science and Technology, Middlesex University London, London NW4 4BT, UK
*
Author to whom correspondence should be addressed.
Appl. Sci. 2022, 12(2), 739; https://doi.org/10.3390/app12020739
Submission received: 9 November 2021 / Revised: 27 December 2021 / Accepted: 5 January 2022 / Published: 12 January 2022

Abstract

:
This paper investigates the capabilities and limitations of different software tools simulating landscape design adaptability. The evaluation of tools is based on the ISO 25010 framework, which investigates software functionality, reliability, performance efficiency, usability, compatibility, and information quality. These quality characteristics of software are analysed during objective experiments where five software tools are used for a case study project at the conceptual design phase. These experiments reveal that the existing software tools for climate adaptation planning are focused on different aspects of climate adaptability, generating different types of information. Moreover, all tools deal with some limitations in terms of compatibility, performance efficiency, and functional operations. The ISO 25010 quality model provides a comprehensive framework to compare the capabilities of different software tools for climate adaptation planning. This paper is part of a wider study including an analysis of the needs of project stakeholders regarding climate adaptation software tools. However, this article focuses on technical capabilities of current climate adaptation software tools.

1. Introduction

Climate change plays a significant role in the discipline of landscape architecture in terms of climate adaptation. Climate change causes higher frequency and intensity of floods and storms, leading to increased financial losses [1]. According to the EU [2], the consequences of climate change caused damage to facilities amounting to €95 billion between 2002 and 2012. It is predicted that the EU will amass €20 billion in annual losses if the temperature increases by 2.5 °C- and €65 billion if it increases by 5.4 °C [3]. Therefore, climate change challenges societies and planners efficiently and effectively design adaptable cities to solve problems related to floods and heatwaves. This paper addresses climate change characteristics such as temperature, precipitation and droughts. The Intergovernmental Panel on Climate Change [4] describes climate adaptation as adjustment to the actual or expected effects of climate change, and moderation of the damage or exploitation of valuable opportunities. However, the effectiveness of planned climate adaptation measures depends on other unexpected non-climatic aspects, such as social-ecological systems [5]. Therefore, adaptation to climate change is highly complex and requires innovative tools supporting climate services.
Currently, the possibilities of digital technologies for climate adaption planning are not fully realised in practice. The BIM (Building Information Modelling) concept, based on data-rich models [6], currently makes little or no contribution to landscape design with deep environmental concerns. Software tools simulating and calculating the impact of climate adaptation measures, including rainwater management systems and green services, are rarely implemented in practice. Some of the main barriers to the implementation of climate adaptation planning tools include lack of expertise and insufficient data proving the benefits of adaptive planning design [7]. A further issue is the lack of knowledge of software tools supporting climate adaptation planning. However, the digitalisation of climate adaptive planning can improve efficiency in natural resource planning, and can support the decision-making process [8]. Moreover, it can help create innovative solutions to the challenges caused by climate change, as climate adaptation software tools can analyse climate conditions on-site, generate a large amount of data, calculate complex climate variables, evaluate the impact of planning decisions on climate change, and visualise various scenarios. Therefore, digitalisation in climate adaptation planning would make progress towards data-based planning while reducing the risk of failure and increasing planning efficiency. However, digital tools currently make little contribution to the process of climate adaptation planning, as these tools are rarely used in practice. Therefore, this research investigates the tools for climate adaptation planning during objective experiments which are executed with five different tools implemented in the conceptual design of a sustainable neighbourhood in the south of Germany. Objective experiments observe software behaviour, evaluating software capabilities and limitations using the ISO 25010 framework. The evaluation of these tools leads to the identification of the most suitable software tool for the study project. The case study represents a sustainable neighbourhood in the fast-expanding city of Ulm. The conceptual design of the area integrates nature-based solutions against climate change threats such as floods and droughts. Therefore, in this project it was decided to analyse the design decisions with various software tools. Additionally, these neighbourhoods are highly vulnerable to climate change due to sensitive social structures.
Firstly, this paper will describe the materials and methods used for the research—Including objective experiments and the ISO 25010 software quality model, which was adjusted for the evaluation of climate adaptation software tools. Secondly, the results of objective experiments with five different software tools, evaluating their functional suitability, reliability, performance efficiency, operability, compatibility and information quality, will be described. Lastly, the results of the research will be summarised, discussing the integration of the ISO quality model, challenges in implementing climate adaptation software tools, future research and a SWOT analysis. Figure 1 presents the structure of this paper.

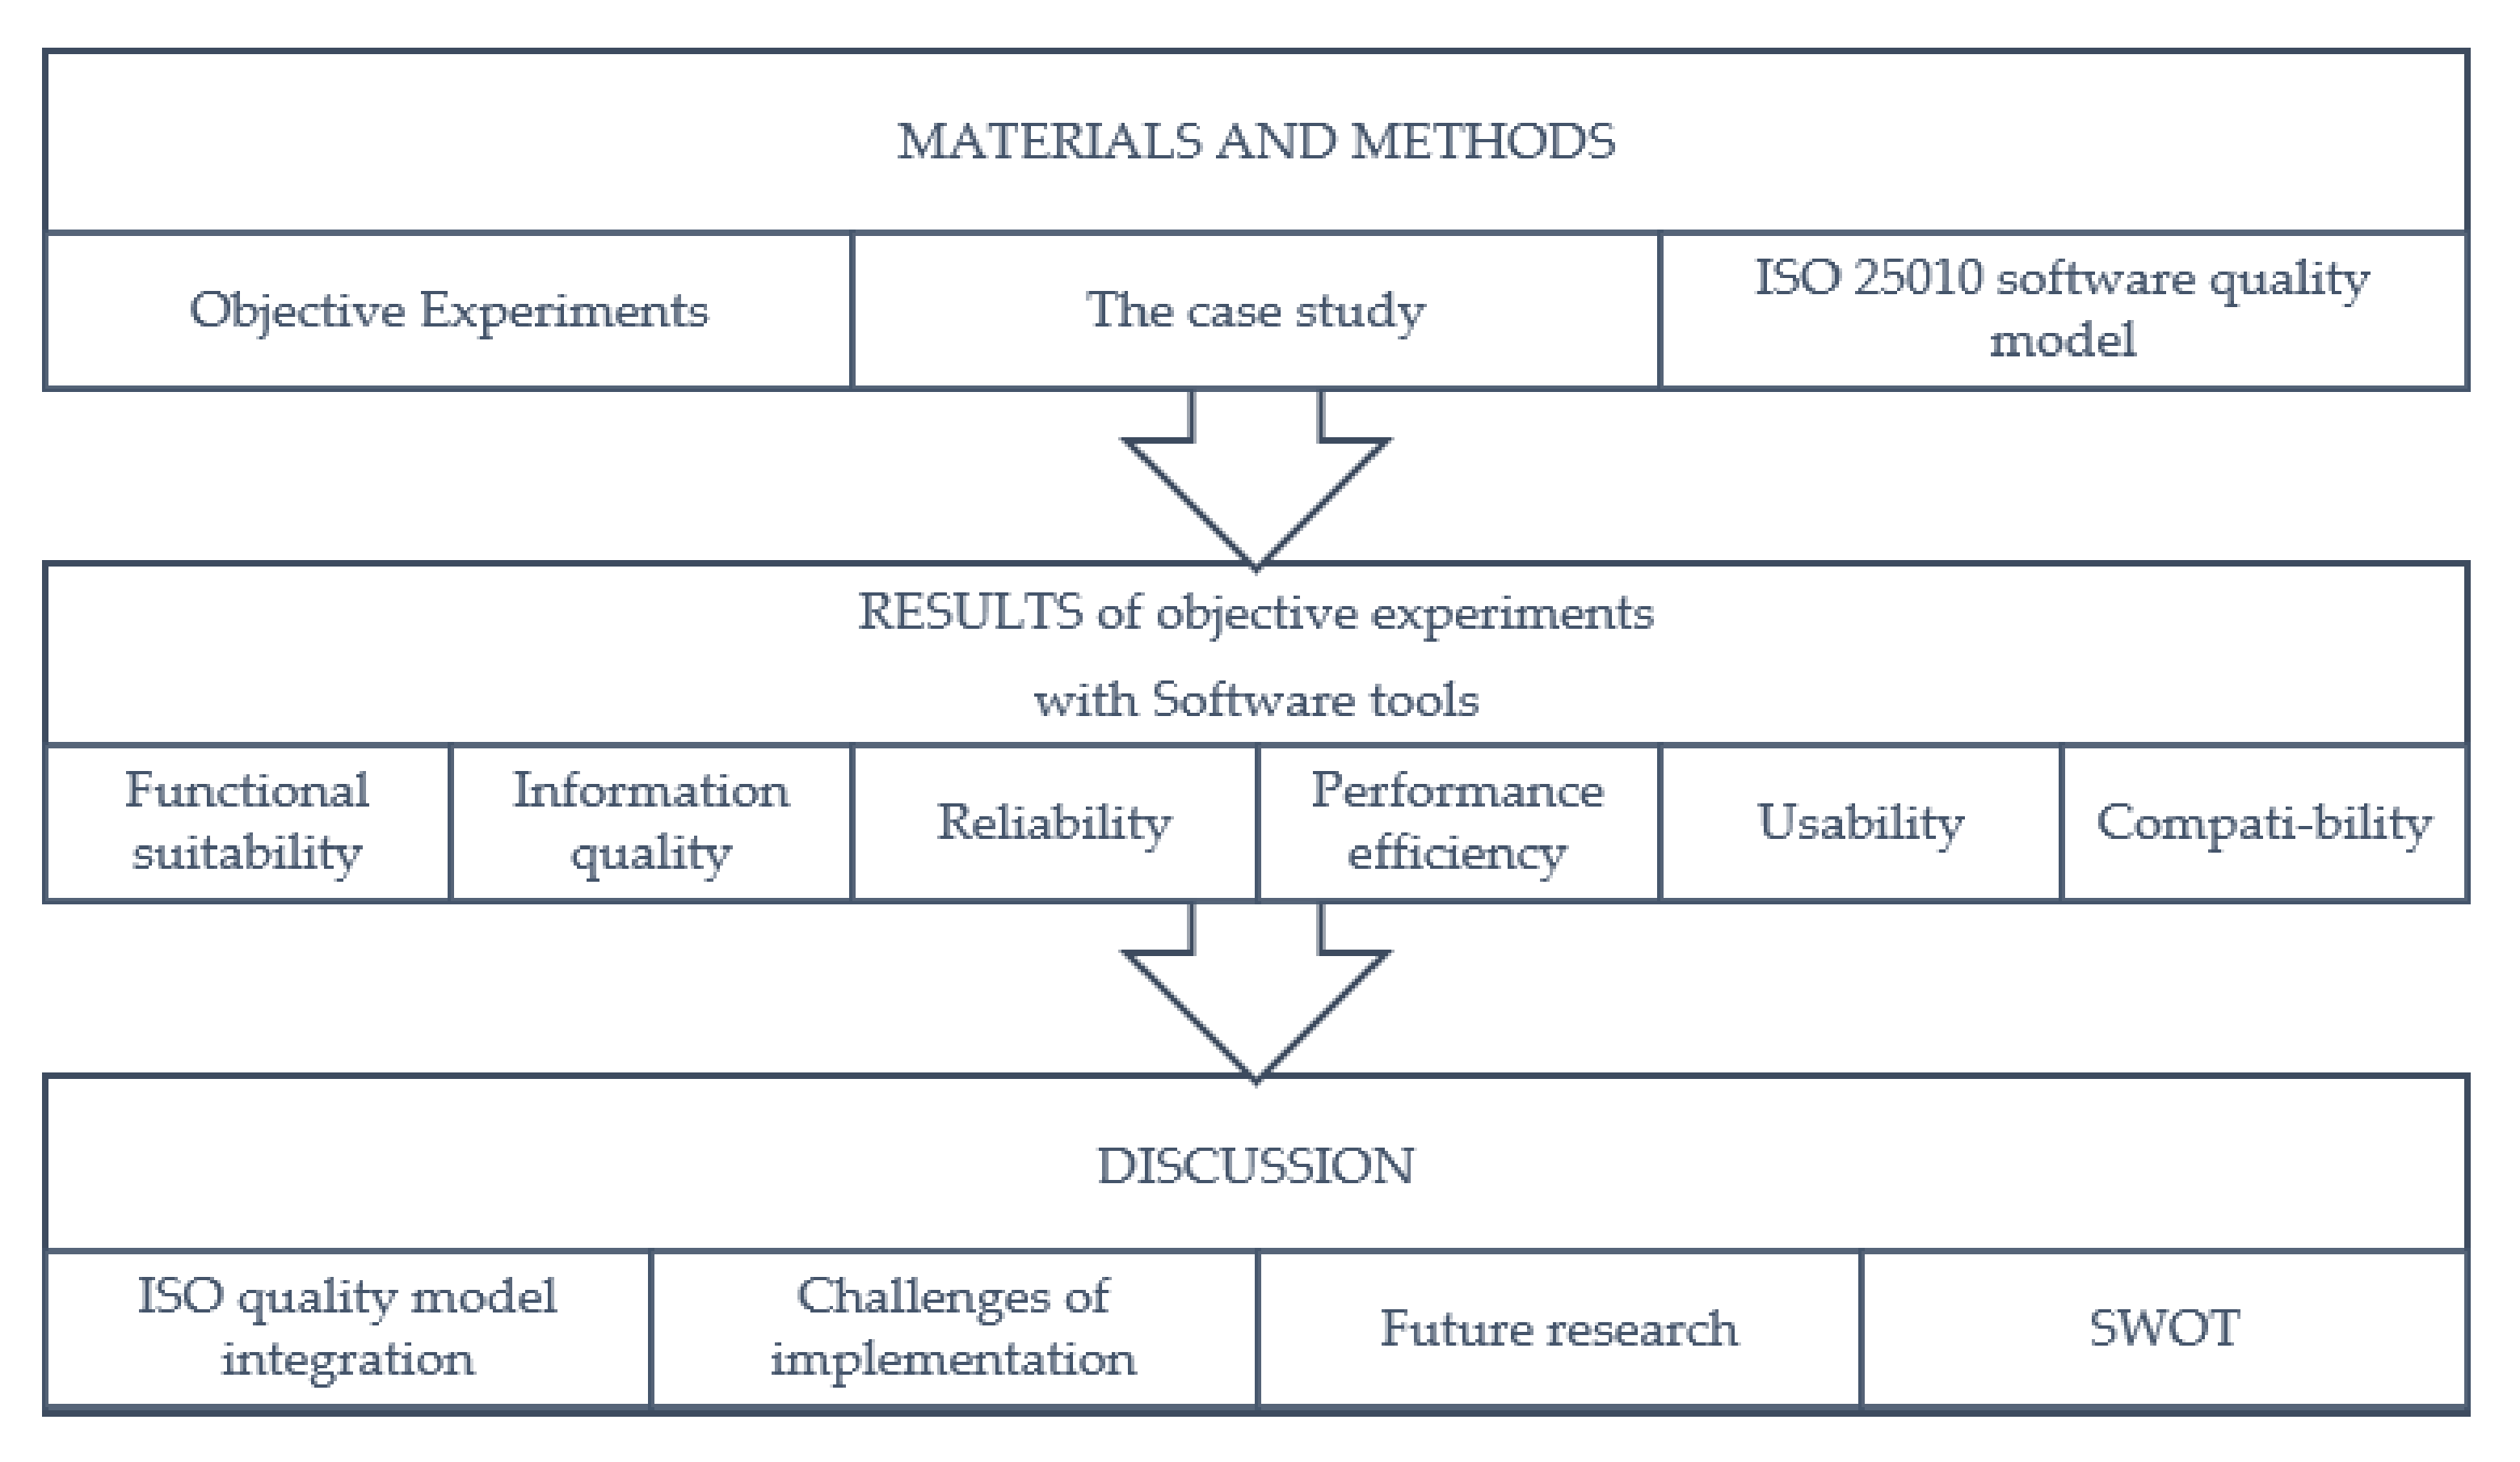
2. Materials and Methods

This paper implements the inductive method to investigate different software tools for the adaptation of landscape design to climate change. The inductive approach observes multiple facts without a focus on pre-defined hypotheses; however, it does not prove the accuracy of observed findings [9]. This paper seeks to find new and unexpected patterns between various software tools; therefore, the inductive method is chosen to conduct the research.
The research examines different software tools based on the ISO 25010 framework to define the characteristics for evaluation. These are measured during objective experiments, which proceed with five software tools. In order to observe the different parameters of the tools, qualitative research methods are introduced, which are mostly appropriate for experiments seeking to find unexpected observations. The main difference between qualitative methods and quantitative methods is that qualitative methods focus on the observed effect, while quantitative methods seek to measure the effect itself [10].
Additionally, various control levels define the types of experiments: controlled, observational and quasi-experiments [11]. This research integrates observational methods to perform objective experiments with software tools. Observational methods including project monitoring, case study, assertion and field study were used to collect the data in the development of the project [12]. The case study collects data while monitoring certain attributes and their measures, which are defined using the ISO framework. The project chosen to perform experiments is a neighbourhood on the outskirts of the city of Ulm, which integrates various climate adaptation measures. Figure 2 illustrates its site plan, with retention swales, green infrastructure and a water retention pond to handle 100-year climate events. Currently, living quarters are vulnerable to climate events due to the social structure requiring innovative and effective decisions.
The data is collected by performing objective experiments with a low level of control of variables, taking into consideration human factors, and their impact on results. Technical variables are eliminated by performing experiments with the same computer device, wherebythe impact of different operating systems, and computer parameters are reduced. Nonetheless, simulations are calculated for the same time and date (19 July) using the same weather data to achieve consistency for the comparative analysis. The experiments are performed on a conceptual design from a case study project using the same 3D model in SketchUp. The model was prepared with the use of a standard layer structure based on different categories of objects and materials. The SketchUp software was chosen due to its suitability for the conceptual design phase and its popularity among landscape architects. Furthermore, five different climate adaptation software tools including ENVI-met, Ladybug, GreenScenario, CitySim, and AST (Adaptation Support Tool) were selected to conduct objective experiments. Extensive research was done to define current tools supporting climate adaptation planning for landscape projects. However, some software tools could not be included in the research due to low accessibility.
The software tools are compared using the ISO 25010 standard which defines the characteristics and sub-characteristics of the product quality model which was chosen to evaluate the capabilities of software tools. The ISO product quality model integrates the evaluation of functional suitability, performance efficiency, compatibility, usability, reliability, security, maintainability, and portability [13]. This model was adjusted for objective experiments with climate adaptation software tools. Firstly, the evaluation of climate adaptation software tools excludes technical aspects relevant to software developers—such as security, maintainability, and portability. Secondly, this study excludes the analysis of functional correctness and focuses instead on functionality compliant with sustainability requirements such as BREEAM, LEED, and DGNB. Additionally, the analysis of software capacity and maturity is excluded due to the high complexity of measurements. Furthermore, some aspects such as appropriateness, recognisability, and user interface aesthetics are excluded due to a high level of subjectivity. Nonetheless, some aspects—including learnability and time behaviour—Deal with a high level of individual capabilities but are important guidelines that can be objectively evaluated. However, the ISO quality model does not include information quality in the quality assessment, which is an important aspect in evaluating climate simulation software tools. Therefore, the ISO quality model was refined by adding information quality, which is assessed considering the accuracy of simulations or calculations and suitability for climate adaptation planning related to the data to be used in the simulations [14].
Moreover, this research seeks to achieve objectivity in observing the defined quality aspects. Therefore, the targets and measures for each quality characteristic to be observed were identified during the experiments. Table 1 summarises the descriptions of quality measures alongside the main targets and measures observed during objective experiments. Functionality is evaluated by observing available analytical features for different climate adaptation measures, including green and blue infrastructure and climatic and economic analysis. Functional appropriateness evaluates process maps and time registers. Compliance with sustainability requirements analyses the ability of software tools to cover aspects of various sustainability certifications. Information quality compares visual and digital information processed with the software tools, evaluating consistency with climate adaptation targets. Reliability focuses on incidents and error registers. Performance efficiency evaluates the time register and the list of resources used to perform simulations. Usability observes training duration and software complexity, while compatibility focuses on the software implementation process maps and the time spent to implement the software, identifying issues related to data loss.

3. Results

The results section describes the ISO quality measures observed during the experiments.

3.1. Functional Suitability

Functional suitability focuses on the functional completeness of software for climate adaptation projects, functional appropriateness, and compliance with sustainability certifications. This section explains how these parameters are evaluated and measured.

3.1.1. Functional Completeness

Functional completeness analyses the main functions of software tools in terms of the tasks and objectives of climate adaptability. The experiment with different software tools revealed a range of climate adaptation parameters in different software tools. Table 2 gives an overview of functional completeness and defines the measures of different software tools based on several categories, including green and blue measures, climate analysis and economic impact. Software tools tested in the objective experiments revealed a different focus on climate adaptation. For instance, ENVI-met and Ladybug can simulate a wide range of climate aspects including sun, temperature, radiation, wind and thermal comfort, whereas GreenScenario and AST evaluate green and blue measures as well as economic impact. CitySim covers the fewest climate adaptability aspects for outdoor spaces, producing simulations of shaded areas, surface temperature and radiation.

3.1.2. Functional Appropriateness

Firstly, functional appropriateness, according to ISO 25010, is focused on the efficient accomplishment of a task without taking unnecessary steps. Therefore, functional appropriateness evaluates the number of steps used to perform a task. On the contrary, the duration of each task is separately assigned to performance efficiency, as the ISO quality model proposes. Table 3 summarises the results of objective experiments using the information from the process maps and time register, assessing functional appropriateness and performance efficiency. The tasks to perform simulations can be divided into five main phases: importation of the SketchUp model used for experiments; adjustments of model or remodelling; settings to perform simulations; simulating time; and results.
The results show that the most efficient software tools were AST, GreenScenario and CitySim. However, the results revealed that CitySim was very inefficient during the simulation process, which was longer than 98 hours. Ladybug is based on the visual script used to perform simulations; however, a new script is needed for a different type of analysis. The most steps were used by the ENVI-met software, which is more complex than the others and allows various microclimate simulations to be created. These results show that the compatibility of the software with SketchUp has a great impact on the final results of functional appropriateness.

3.1.3. Compliance with Sustainability Requirements

The requirements of different sustainability programs reveal light interpretations of climate adaptation measures. This section analyses climate adaptation aspects included in the sustainability certification programs for neighbourhoods.
BREEAM (Building Research Establishment Environmental Assessment Methodology) defines the standards for communities expressing the following climate adaptation sustainability topics [15]:
-
rainwater assessment;
-
site-specific flood risk assessment and management ensuring water run-off capabilities to deal with a 100-year flood event;
-
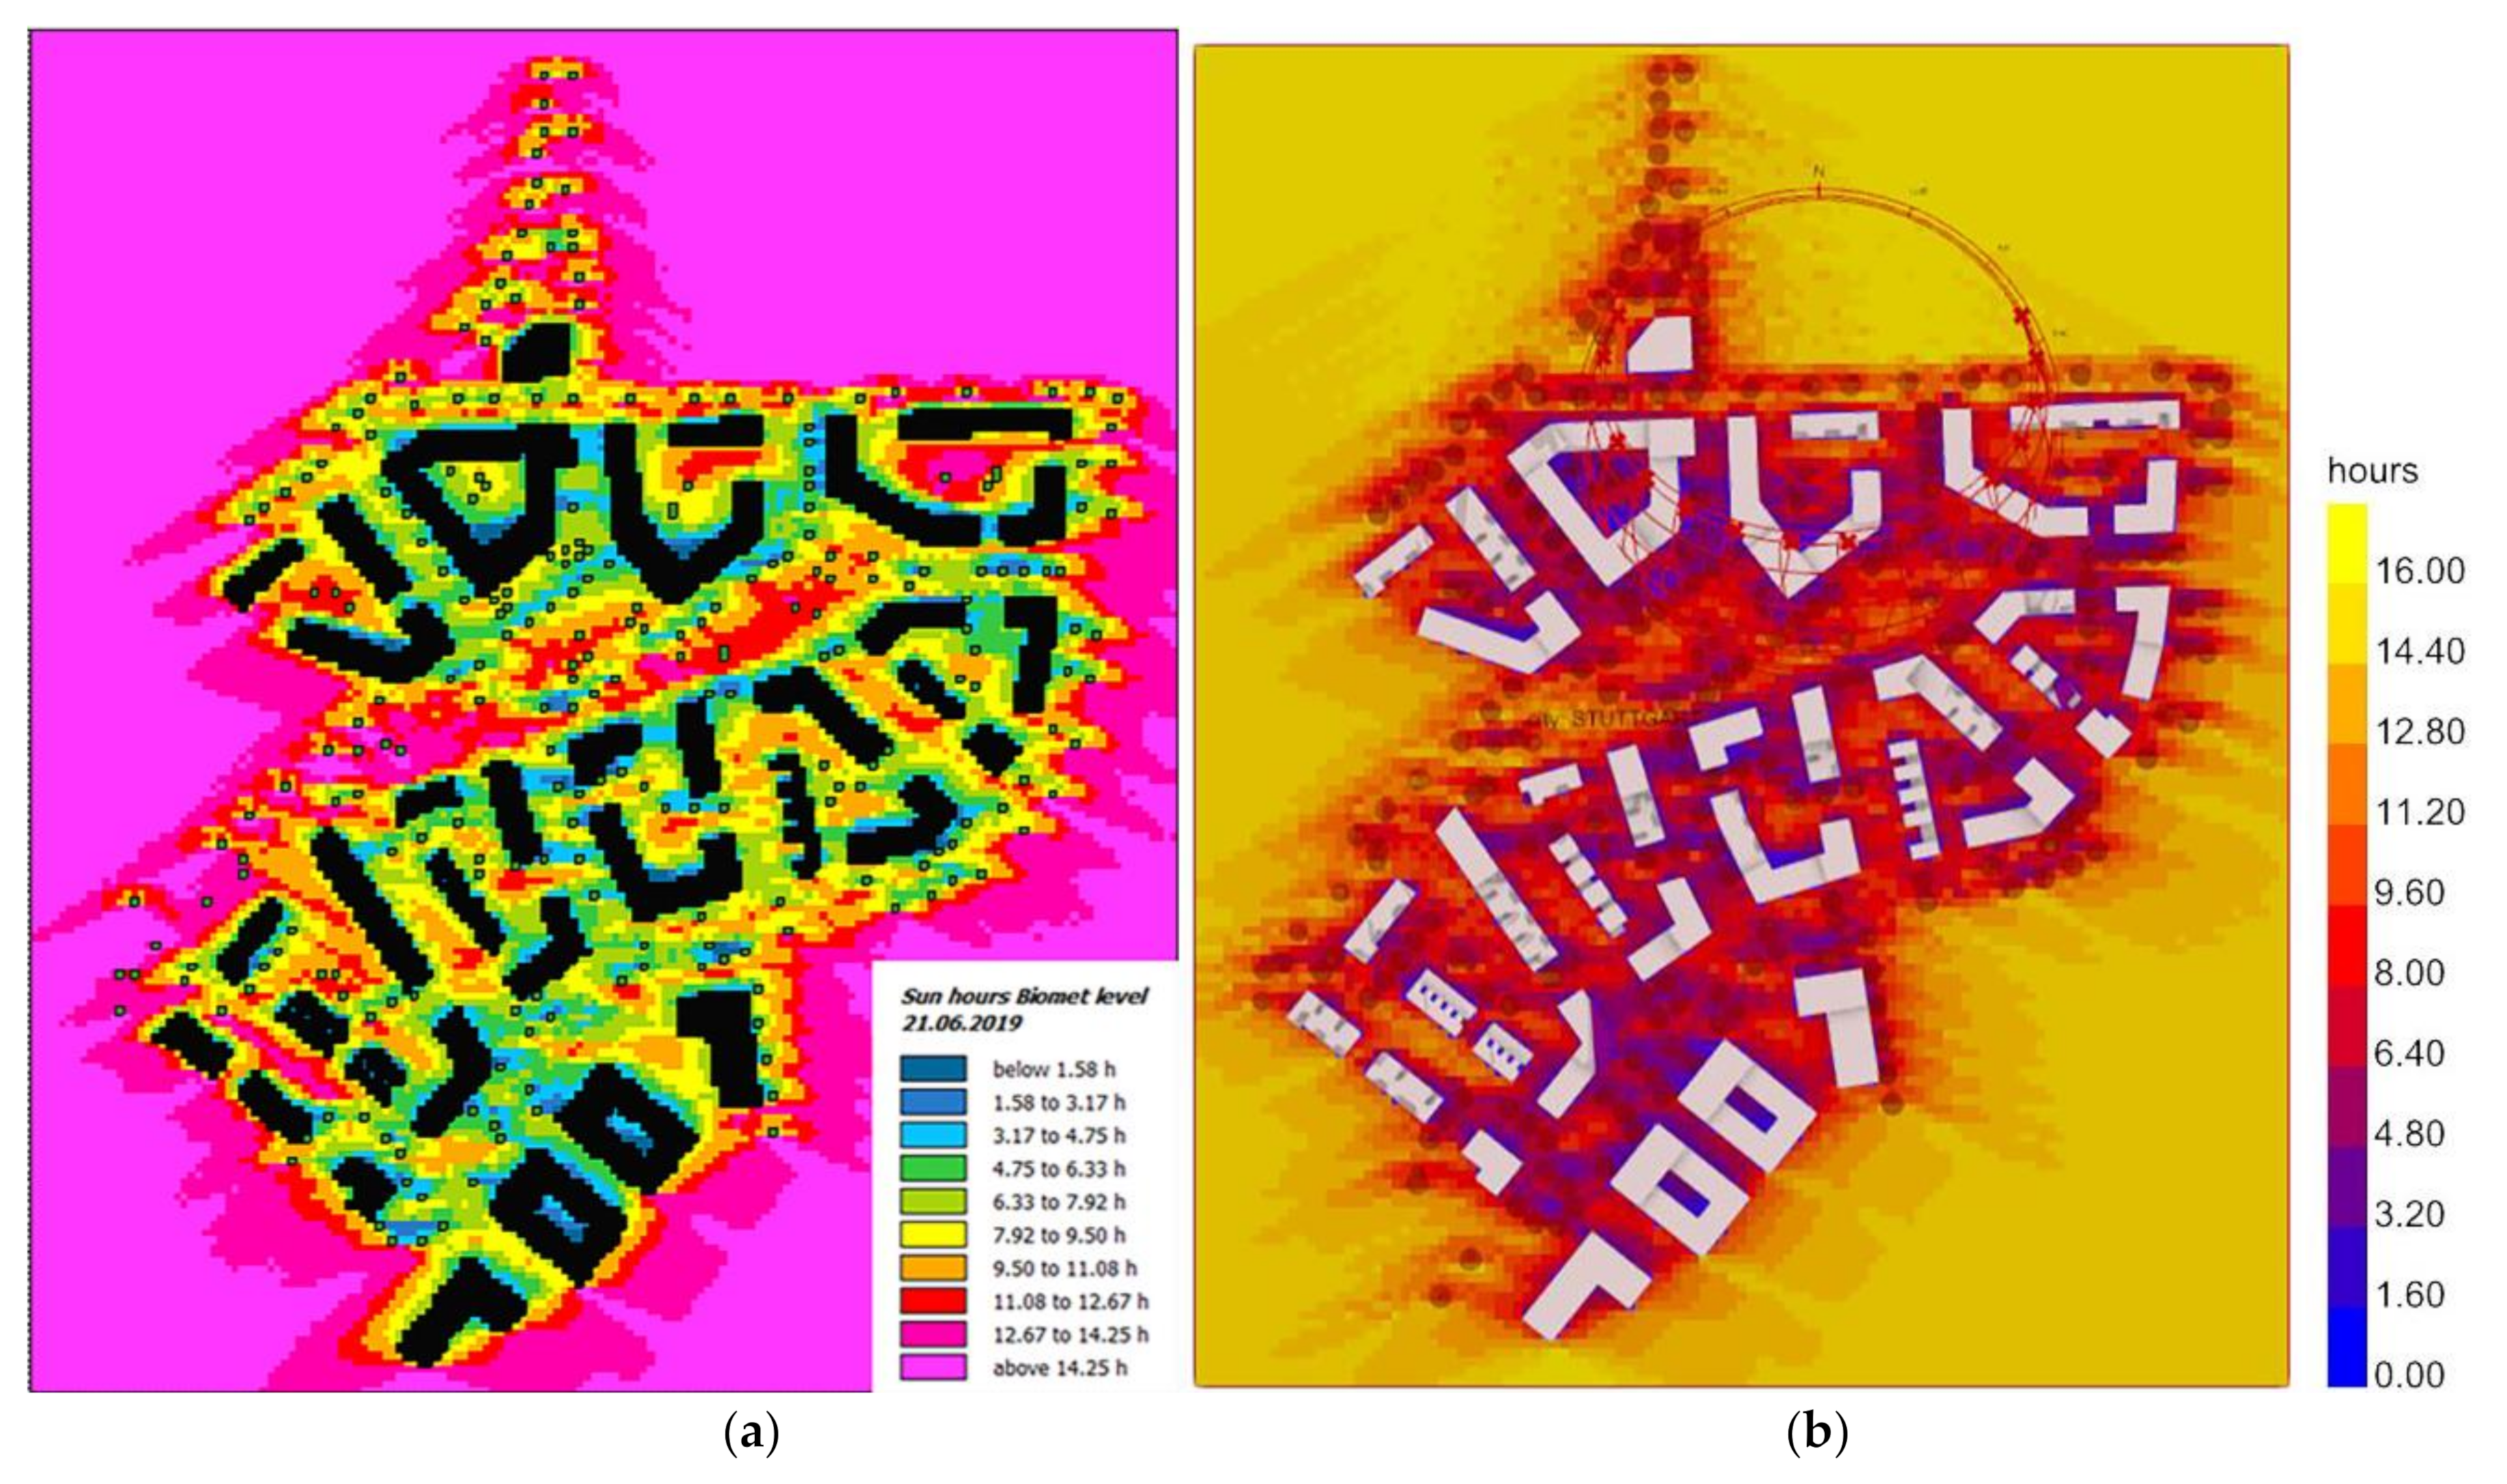
microclimate simulations illustrating the effect of urban morphology on air temperature, solar exposure, air movement, air pollution, and acoustics;
-
a climate adaptation plan considering the predicted climate change impact;
-
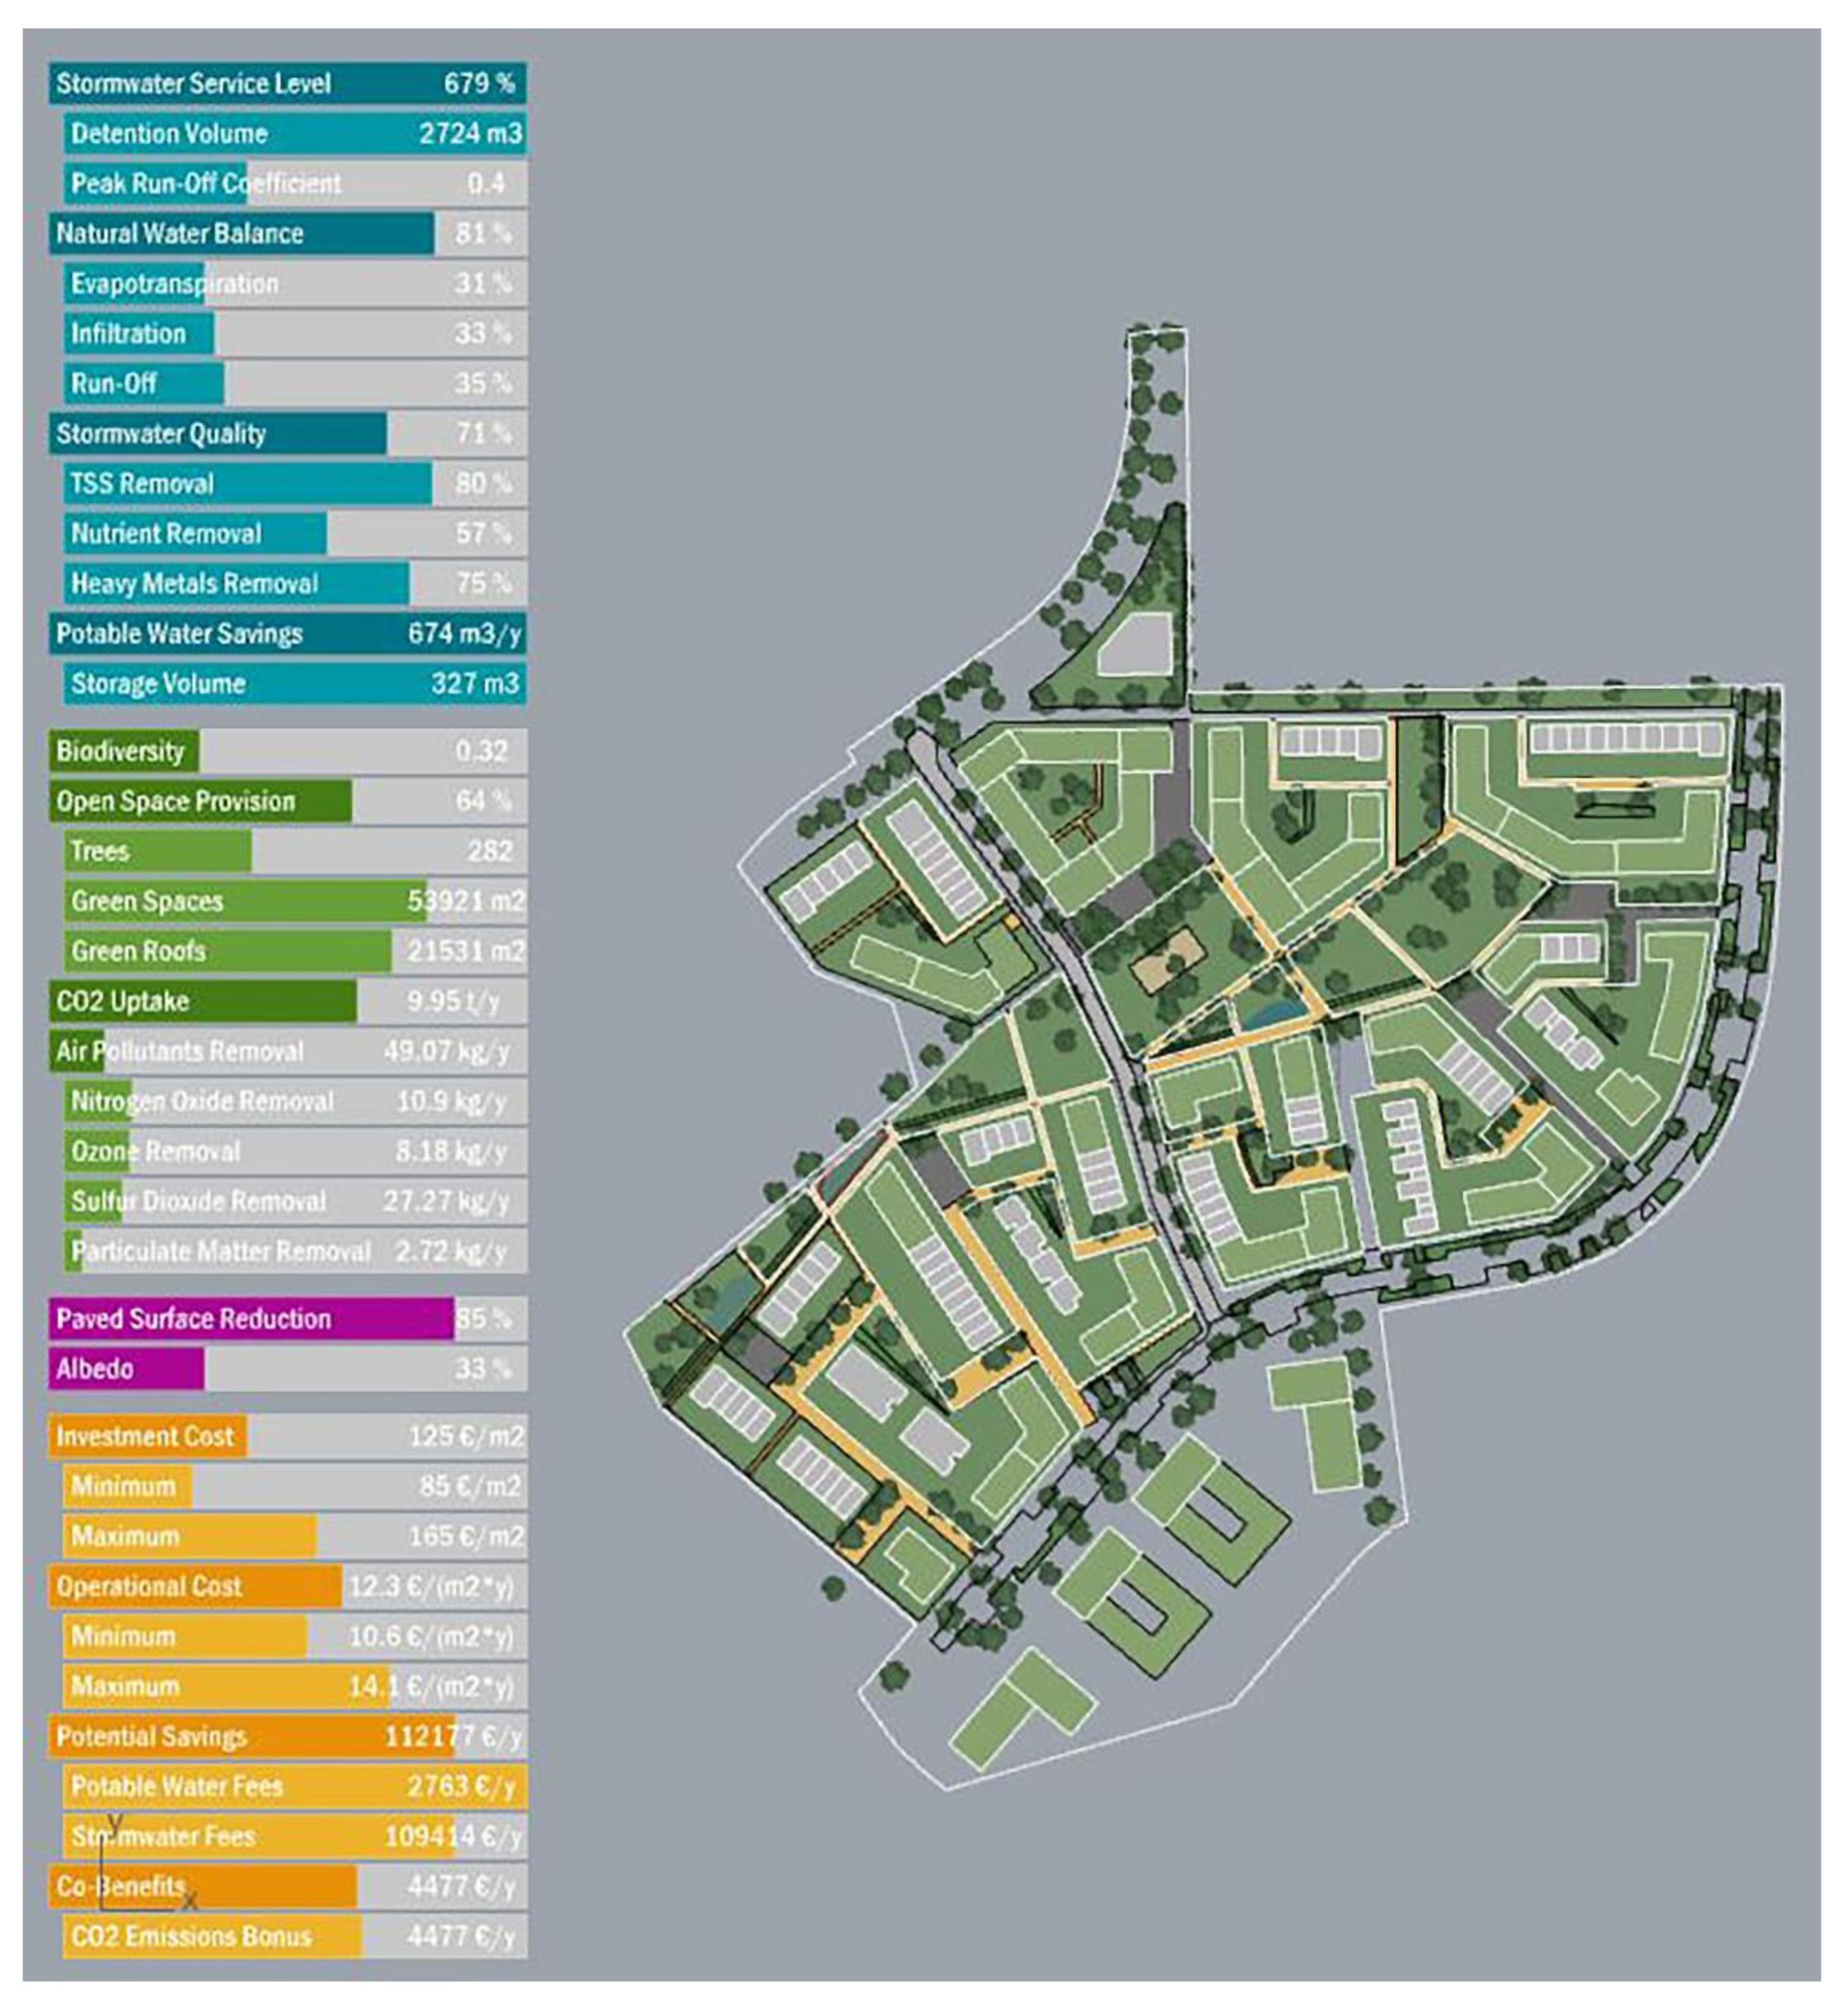
green infrastructure and high quality of open space;
-
ecological plans creating aesthetic value, ensuring social wellbeing, and adaptation to climate change.
LEED (Leadership in Energy and Environmental Design) for neighbourhood includes aspects relevant to climate change such as [16]:
-
floodplain avoidance;
-
rainwater management;
-
green infrastructure;
-
heat island reduction;
-
ecological services considering habitats and wetlands.
However, the LEED framework is focused more on buildings rather. than neighbourhoods, and excludes climate adaptation as a separate assessment field.
The DGNB (Deutsche Gesellschaft für Nachhaltiges Bauen) for new urban quarters defines the categorisation of quality aspects. Each category includes the climate adaptation measures listed below [17]:
-
ecological qualities: climate change in the district and water and soil protection;
-
economic qualities: life cycle costs and economic effects on the community;
-
social-cultural qualities: environmental impacts;
-
technical qualities: rainwater management;
-
process qualities: participation.
The DGNB differs from BREEAM and LEED by adding social and economic aspects of climate adaptation planning, such as life cycle costs and financial effects on the community. However, some aspects—such as participation and the estimation of economic effect on the community—are too complex for current climate adaptation software tools.
Table 4 summarises the main climate adaptation aspects covered in the sustainability certifications and considers which aspects can be analysed with different software tools. These results show that GreenScenario and AST tools address the largest number of requirements. This evaluation considers only the ability of each piece of software to cover each aspect from different sustainability certifications. However, wider research could be performed to evaluate how well each piece of software can perform analysis on each aspect considering sustainability levels.

3.2. Information Quality

Functional suitability for climate adaptation projects, as analysed in the previous chapter, shows high variations within functionalities and in terms of focus on climate adaptation. This chapter further investigates the information gathered from different software tools, which can be divided into visual and digital information. ENVI-met and Ladybug generate visual information through simulations, while GreenScenario and AST produce calculations based on climate adaptation measures. Information quality evaluates the accuracy of information and suitability for climate adaptation planning.

3.2.1. Visual Information

he comparison of the simulations of sun hours, radiation and the UTCI (Universal Thermal Climate Index) produced by Ladybug and ENVI-met show significant differences between the simulated values. For instance, Ladybug indicates the lowest radiation of 109 W/m2, whereas ENVI-met indicates only 69.4 W/m2 (see Figure 3). These variations might be a result of different calculation methods, as the results of Ladybug are based on the visual scripting method developed by the user, and ENVI-met has a built-in formula. However, these results can be compared visually when evaluating sun hours and shaded areas (Figure 4) and the most radiation-exposed areas (see Figure 3). Both programs show the lowest radiation levels in the shaded areas around buildings and trees. CitySim can produce visual information on radiation and sun hours; however, the accuracy of this information depends on the triangulation of the surfaces and the model. In the objective experiments, CitySim generates the least informative simulations regarding climate adaptation planning. Furthermore, Figure 5 illustrates UTCI values that are highly complex. Therefore, ENVI-met can produce more accurate simulations than Ladybug. Moreover, in other papers [18,19,20] ENVI-met is introduced as accurate and trustworthy software that is often used to verify visual scripts in Ladybug.

3.2.2. Digital Information

AST and GreenScenario present digital results on climate adaptation performance. Both software tools provide calculations of the impact of climate adaptation measures on climate by estimating rainwater management, evapotranspiration, heat reduction, and costs. GreenScenario has an advantage over AST as it presents information viavisually attractive dashboard (see Figure 6). Moreover, itscalculations present the impact of the whole design, while AST gives an overview of the impact of each climate adaptation measure (see Table 5). Due to different calculation objects, values, and the low precision of the AST tool, these results are hardly comparable: GreenScenario calculates 125 e/m2 for construction and 12.3 e/m2*y for maintenance, while AST calculates 27.5 e/m2 and 2 e/m2*y, respectively. However, AST deals with a high level of inaccuracy in the drawings. Therefore, GreenScenario can produce more accurate assessments, allowing different climate adaptation goals to be compared in a visually attractive manner.

3.3. Reliability

The reliability of different software tools includes software availability, fault tolerance and recoverability.
Software availability evaluates the accessibility of software, ensuring its consistent functioning without incidents. To evaluate software availability, incidents of ‘not responding’ are calculated from the error register. Moreover, connection and software stability are assessed. The only software that encountered the ‘not responding’ issue during the experiment was Ladybug. This issue occurred when setting high-quality simulations. Another software with low stability is AST, which relies on an internet connection. CitySim often lagged due to the large number of calculations required to perform simulations. Other software tools were rather stable, as no incidents were recorded during experiments.
Fault tolerance considers errors and failures as the main aspects indicating software faults. The most severe faults were encountered when using CitySim, as the file could not be reopened due to errors in the model. The ENVI-met application for SketchUp also faced issues while reopening the files, leading to information and data loss. Ladybug and GreenScenario identified some errors in the scripts based on the visual script method. Although AST did not face any errors or failures, it does not integrate the function helping to identify errors.
Recoverability analyses whether the software can recover data in case of interruption. AST software does not integrate a function allowing a project to be saved; therefore, data recovery is not possible. CitySim revealed issues while reopening files. ENVI-met had no failures or issues with data loss; however, the SketchUp application could not recover information after reopening the file. GreenScenario and Ladybug, which are based on the Rhino interface, can recover files in case of failure.

3.4. Performance Efficiency

Performance efficiency includes time behaviour and resource utilisation according to ISO 25010. The evaluation of on-time behaviour is based on the time register illustrated in Table 3, which provides information on time resources used for an objective experiment per task. These results revealed that overall time resources were the highest for CitySim and the lowest for Ladybug and AST. Moreover, CitySim required the most resources to proceed with simulations such as expert consultations. The majority of software tools require additional files with climate information, such as .epw files for Ladybug and ENViENVI-met, .dly for GreenScenario, and .cli and .hor for CitySim. The least resources and training materials were used by the AST software.

3.5. Usability

Usability includes the analysis of learnability, operability, and user error protection.
Learnability defines the ability to learn the software, which can be easily operated after having been learnt. The evaluation of learnability is based on the time register, marking the time for training. The easiest software to learn was AST due to its simplicity and clarity. Further, CitySim also has a simple interface, requiring less time than ENVI-met. The most complicated software tools were GreenScenario and Ladybug, as they require knowledge of visual scripting.
Operability evaluates how the software operates after the learning phase. The most complex software tool is ENVI-met as it integrates several applications and complex settings and requires knowledge of climatology. Similarly, Ladybug requires knowledge of climate calculation formulas, which has a high impact on results. GreenScenario has an integrated formula to calculate the results from the model. The CitySim and AST software tools can be distinguished as the easiest to use.
User error protection evaluates the software’s protection against errors by employing the model checker function. ENVI-met integrates the model checking function comprehensively to analyse the failures in the model before the simulation is started. CitySim scans for potential model failures when reopening the file. Ladybug and GreenScenario have an automatic error finder for the failures in the script, but not in the model. Meanwhile, AST does not contain error protection measures.

3.6. Compatibility

Compatibility evaluates co-existence with other software tools and interoperability. Interoperability evaluates the importation process; the steps and time resources are detailed in Table 3. In this case, objective experiments were performed using the same 3D SketchUp model. The results revealed that each software tool requires different types of files and models for successful model importation. Although the results from objective experiments highly depend on software compatibility with SketchUp, other software tools such as Autodesk Revit and ArchiCAD have comparable issues with information loss. Climate adaptation tools currently support the importing of climate-specific information such as materiality. Therefore, the importation process relies on compatible formats adding climate relative information in climate adaptation software tools.
Firstly, Ladybug and GreenScenario are mostly compatible as both are based on the Rhino interface, which is compatible with a number of other planning software tools—From Autodesk to Graphisoft. However, GreenScenario requires a 2D file with closed and grouped polylines, which are extruded when assigning information of materials, levels of each building and vegetation. CitySim is compatible with AutoCAD software, requiring a model compounded from 3D faces. In this case, the SketchUp model was exported to AutoCAD, where the faces were converted to 3D faces and saved as .dxf files. ENVI-met is the only software that suggests a plug-in for SketchUp, which allows files to be prepared for export. However, the experiment revealed some inefficiencies causing errors and information loss leading to the necessity of remodelling. The AST tool fails to integrate the SketchUp model, and is rather designed for renovation projects than for new developments. Therefore, the design had to be redrawn due to failure to achieve precision.

3.7. Overview of Evaluation Results

The results from the objective experiments revealed the limitations of each software tool. The evaluation of software quality according to ISO 25010 uses a five-grade system to rank software tools. Table 6 gives an overview of the software tools that meet most of the ISO requirements. Scores are given in a comparative manner, ranking five software tools from the highest score, 5, to the lowest, 1. The highest score was given to the GreenScenario tool, and the lowest score was given to CitySim. However, there was only a small difference between Ladybug, AST and ENVI-met. Nonetheless, overall scores do not reflect the capabilities and limitations of each software tool. Therefore, Figure 7 presents a comparative analysis of the capabilities and limitations of software tools based on the ISO 25010 framework. The results reveal that functional suitability is the strength of GreenScenario and AST, while ENVI-met is the strongest in information quality. Despite the strength in performance and operability, ENVI-met and AST reveal some limitations regarding incompatibility and reliability. Due to its simplicity, AST can be efficiently used for climate adaptation scenarios; however, the results on information are rather limited. To conclude, these results show that the time invested to produce simulations ensures better information quality.

3.8. Limitations of Results

The results of this research are limited to a case study project in the south of Germany at the conceptual design phase. Moreover, this research investigates the performance of software tools supporting outdoor simulations and calculations for landscape projects—Excluding mono-functional and elementary software tools. Additionally, this research includes only accessible software tools and the tools which were shared for this research.
The analysis of the compliance with the requirements of sustainability certifications such as LEED, BREEAM and DGNB excludes a broad examination of how well the software can cover sustainability levels. These results are rather constrained to the sustainability categories defined in different certifications, analysing the capability of the software to cover each category.
Nonetheless, objective experiments deal with a high level of objectivity as they are limited to a single user. Therefore, some ISO 25010 quality aspects are excluded due to the strong impact of objectivity regarding personal preferences and choices. Further research could include more users to verify results.

4. Discussion

4.1. ISO Quality Model Evaluation for Software Tools

This research is focused on the evaluation of climate adaptation software tools for landscape projects based on the ISO 25010 framework. Integration of the ISO framework provided a comprehensive and structured guideline for software evaluation. The most important aspects, such as software functionality, reliability, performance, usability and compatibility, were evaluated using the definitions and guidelines from ISO. However, one of the most important aspects in data-rich models—Information quality—Is missing in the ISO framework [14]. This paper analysed information quality by comparing the final output produced with different software tools in the same case study project. This comparative analysis identified different types of information, including visual and digital outcomes produced with different software tools. The literature review presented the notion that the majority of papers focus on a single simulation tool and one climate adaptation measure, such as green roofs [21], vegetation arrangement [22,23,24,25,26] or materials [27]. This paper gives an overview of the simulation processes and the final results of different tools. Nonetheless, this paper compares the performance efficiency of different software tools with regard to time resources used for the tasks to perform simulations. These results show that high-quality simulations often require more time resources for simulation production, and require time to learn the software.
The ISO framework allows the capabilities of different software tools to be compared using a standard structure covering the most important aspects for software users. However, the ISO framework is rarely used for the comparison of climate adaptation software tools in other papers, as they cover different aspects. For instance, Vidmar and Roset [28] focused on functionality, usability, user interface and ease of use. According to the ISO framework, their paper covers only two categories: functionality and usability. Extensive research on thermal comfort outdoors compared eight different software tools, seeking to find the best tool for outdoor performance simulations [29]. The aforementioned paper compares general software features including user interface, software reliability, information accuracy, compatibility, graphics and the comfort prediction index. ISO defines user interface as part of software usability analysis. This paper excludes the evaluation of the user interface to avoid subjectivity in the evaluation phase, as this depends on personal preferences. Other papers add other essential aspects for consideration that are not included in the ISO framework, such as the price of software and the flexibility to adjust to individual projects [30]. Price and software flexibility are often the main criteria for software selection in individual companies; nonetheless, software flexibility is highly influenced by software functionality and features.
Functional suitability, information quality and performance efficiency are the most critical aspects when choosing software, as functional suitability represents the adjustability of tools to climate adaptation projects, allowing the value created for climate adaptation projects to be estimated. Moreover, the comparison of software output gives an overview of software capabilities and functionality. Other aspects, such as software compatibility, reliability and usability, have a direct impact on software performance. Software reliability and compatibility can improve performance efficiency while reducing the risk of rework. Nonetheless, the ISO framework has a broad applicability, which can be adapted to individual projects by choosing the most important aspects for analysis. However, most papers are limited to the analysis of simulations with a focus on particular software features [29,31,32,33]. Other papers have compared simulations between different software tools to validate their results [32] and to define the differences between calculation rules [33]. This paper seeks to analyse the simulations performed with different software tools for the same climate adaptation project to compare software capabilities.

4.2. Challenges of the Implementation of Climate Adaptation Software

Currently, the integration of software tools simulating climate adaptation design is rather uncommon. There are a number of barriers reducing the adaptability of climate adaptation software tools for landscape projects. Firstly, adaptability can cause additional costs for software and for the time spent to proceed with simulations. Therefore, the performance efficiency of these tools plays a significant role. The analysis shows that precise simulations require time for training, modelling and simulating. Additionally, low compatibility with planning tools causes remodelling and rework. However, the issues regarding software performance have not been well researched in the literature so far, as more focus is placed on other aspects such as user interfaces or graphical information. Moreover, this paper identified different functional abilities, as each software tool measures different climate adaptation parameters. This might lead to the need to combine the information from different software tools to cover the main aspects of climate adaptation planning. In practice, planners seek one tool covering diverse aspects with the potential to adapt to different projects [30]. This paper informs stakeholders of the capabilities, limitations and functions of climate adaptation software tools, helping them to choose the software that best meets their expectations. Moreover, the implementation of the ISO quality framework illustrates how software tools can be evaluated using quality characteristics.
However, the value of software tools for climate adaptation planning has not been widely researched so far. One paper analyses the effect of tools on planning, comparing design results by using both tools and a tool-free approach in the workshop based on collaborative planning [34]. The results revealed that the tools used in the experimental workshop had a significant impact on the learning process, collaboration and communication, and the final planning results. The simulations in this research show how the planning process can be improved using these tools. For instance, the simulation of temperature revealed how different arrangements of vegetation and buildings could significantly reduce heat island effects. Currently, most climate adaptation designs are focused on the reduction of temperature in urban areas. However, climate adaptation has more measures, including rainwater management, ecological quality and economic effect on the community [17]. The main criteria for climate adaptation planning can be reflected in software tools. This research revealed that climate adaptation software tools focus on a different aspect of climate adaptation. Some tools include analysis of the environment, but only a few consider the ecological and social benefits of climate adaptation planning. One of the main problems is the lack of standardisation of climate adaptation measures, as sustainability certifications such as LEED, DGNB and BREEAM identify different dimensions for climate adaptation planning.

4.3. Future Research

Further studies on climate adaptation software tools that implement more experiments with different planners could help to verify the results of this paper, as this research is limited to the performance of experiments by one person. Therefore, the comparison of the results of different persons could help achieve higher objectivity. This research removes the evaluation of some quality aspects from the ISO framework due to a high risk of subjectivity. The elimination of personal preferences and choices can be better achieved if experiments are performed with more individuals.
Moreover, other research could investigate the necessity of implementing climate adaptation software tools in different planning phases. Experiments and interviews with planners would help to compare the impact of software tools on the planning process and final design. The analysis of this data could define the influence that software tools have on the choice of design scenarios. Moreover, research investigating the impact of software tools on dialogue with clients would answer the question of how different visualisations of climate adaptation information influence the choices of design concepts. Furthermore, this kind of research would help to identify the extent of the visual informativeness of the simulations of climate adaptation planning for different types of clients.

4.4. SWOT

The SWOT method was applied to define the strengths, weaknesses, opportunities and threats of this paper. A summary of these results is reflected in Table 7.
Firstly, one of the strengths of this paper is the adaptation of the ISO 25010 framework to software quality evaluation by integrating standardised procedures. The majority of other papers analyse software tools using different aspects, so that integrity and comprehensiveness are lost. Moreover, the objective experiments were conducted by one person, helping to reduce variables such as diverse operating systems and device properties. This paper analyses five different software tools, showing the process and different outputs using the same project.
The weaknesses of the paper include the level of individualisation and specific context. Firstly, software tools are used for a specific project without consideration of wider applicability to different climate adaptation projects. Moreover, the results, especially learnability and performance efficiency, are highly influenced by the capabilities of an individual person. Nonetheless, the objective experiments in this research were performed without any software knowledge of the tested tools. However, some tools were not included in the research due to low public accessibility.
This paper informs software developers of the demand for climate adaptation needs and issues within current software tools, and creates the potential for improvement. The revision of the limitation of climate adaptation planning tools can lead to an improved planning process and informed decisions by planners and clients.
One of the main threats to the implementation of climate adaptation projects on a larger scale is a different understanding of climate adaptation concepts, measures and impact. Moreover, low awareness about software tools and the need for the digitalisation of climate adaptation planning lead to low integration of software tools.

5. Conclusions

This paper analyses software tools for climate adaptation planning based on the ISO 25010 software quality model. Objective experiments were performed to analyse the capabilities and limitations of different tools and to identify the best tool for the case study project. The ISO framework helped to define the characteristics for the analysis of software tools. This paper identified the limitations of the tools and the main differences between them. The most common issues were concerned with software interoperability, data loss, functionality and low interactivity. Low interoperability with the planning tools requires the adjustment of models to perform experiments, or remodelling. Moreover, the results of simulations showed that different tools cover different functions of climate adaptation planning. Therefore, the combination of these tools can bring more value to the project.

Author Contributions

Conceptualisation, E.K. and H.S.; Methodology, E.K.; Formal analysis, E.K.; Investigation, E.K.; Resources, E.K.; Data curation, H.S., Writing—original draft preparation, E.K.; Writing—review and editing, H.S.; Visualisation, E.K.; Supervision, H.S. All authors have read and agreed to the published version of the manuscript.

Funding

This research received no external funding.

Institutional Review Board Statement

Not applicable.

Informed Consent Statement

Not applicable.

Data Availability Statement

Restrictions apply to the availability of these data. Data was obtained from Ramboll Studio Dreiseitl and are available from the authors with the permission of Ramboll Studio Dreiseitl.

Acknowledgments

The authors are thankful to the colleges of Ramboll Studio Dreiseitl for ideas and support in providing plan data and model. Thanks to the software co mpanies for sharing the materials of the software tools used for experiments, including ENVI-met, GreenScenario and CitySim.

Conflicts of Interest

The authors declare no conflict of interest.

Nomenclature

BIMBuilding Information Modeling
BREEAMBuilding Research Establishment Environmental Assessment Methodology;
DGNBDeutsche Gesellschaft für Nachhaltiges Bauen (en. German Sustainable Building Council);
ISOInternational Organization for Standardization;
LEEDLeadership in Energy and Environmental Design;
UTCIUniversal Thermal Climate Index

References

  1. Explainer: Are Natural Disasters on the Rise? Available online: http://theconversation.com/explainer-are-natural-disasters-on-the-rise-39232 (accessed on 7 November 2021).
  2. Towards an EU Research and Innovation Policy Agenda for Nature-Based Solutions & Re-Naturing Cities Final Report of the Horizon 2020 Expert Group on Nature-Based Solutions and Re-Naturing Cities. Available online: https://op.europa.eu/en/publication-detail/-/publication/fb117980-d5aa-46df-8edc-af367cddc202 (accessed on 7 November 2021). [CrossRef]
  3. Ciscar, J.-C.; Iglesias, A.; Feyen, L.; Szabó, L.; Van Regemorter, D.; Amelung, B.; Nicholls, R.; Watkiss, P.; Christensen, O.B.; Dankers, R.; et al. Physical and economic consequences of climate change in Europe. Proc. Natl. Acad. Sci. USA 2011, 108, 2678–2683. [Google Scholar] [CrossRef] [PubMed] [Green Version]
  4. Intergovernmental Panel on Climate Change (IPCC). Climate Change 2014: Impacts, Adaptation and Vulnerability. Part A: Global and Sectoral Aspects. In Fifth Assessment Report of the Intergovernmental Panel on Climate Change; Cambridge University Press: Cambridge, UK; New York, NY, USA, 2014; Available online: https://www.ipcc.ch/report/ar5/wg2/ (accessed on 11 April 2021).
  5. Moser, S.C.; Ekstrom, J.A. A framework to diagnose barriers to climate change adaptation. Proc. Natl. Acad. Sci. USA 2010, 107, 22026–22031. [Google Scholar] [CrossRef] [PubMed] [Green Version]
  6. Associated General Contractors of America. The Contractor’s Guide to BIM, 1st ed.; AGC Research Foundation: Las Vegas, NV, USA, 2005. [Google Scholar]
  7. Ernst, C.; Blaha, K. Decision support tools for climate change planning. In The Trust for Public Land’s Climate-Smart Cities Program; San Francisco, CA, USA. 2016. Available online: https://www.tpl.org/decision-support-tools-climate-change-planning (accessed on 7 November 2021).
  8. Balogun, A.-L.; Marks, D.; Sharma, R.; Shekhar, H.; Balmes, C.; Maheng, D.; Arshad, A.; Salehi, P. Assessing the Potentials of Digitalization as a Tool for Climate Change Adaptation and Sustainable Development in Urban Centres. Sustain. Cities Soc. 2020, 53, 101888. [Google Scholar] [CrossRef]
  9. Lodico, M.G.; Spaulding, D.T.; Voegtle, K.H. Types of Approaches Used in Educational Research. In Methods in Educational Research: From Theory to Practice, 1st ed.; Jossey-Bass: San Francisco, CA, USA, 2006; Volume 1, pp. 10–21. [Google Scholar]
  10. Hasselbring, W.; Giesecke, S. Integration of Qualitative and Quantitative Methods. Res. Methods Softw. Eng. 2006, 1, 61–81. [Google Scholar]
  11. Easterbrook, S.; Singer, S.; Damian, D. Selecting Empirical Methods for Software Engineering Research. In Guide to Advanced Empirical Software Engineering; Shull, F., Singer, J., Sjøberg, D.I.K., Eds.; Springer: London, UK, 2008. [Google Scholar] [CrossRef]
  12. Zelkowitz, M.; Wallace, D. Experimental Models for Validating Technology. Comput. J. 1998, 31, 23–31. [Google Scholar] [CrossRef] [Green Version]
  13. BS ISO/IEC 25010:2011; Systems and Software Engineering —Systems and Software Quality Requirements and Evaluation (SQuaRE)—System and Software Quality Models. The British Standards Institution: London, UK, 2011. Available online: https://www.iso.org/obp/ui/#iso:std:iso-iec:25010:ed-1:v1:en (accessed on 8 January 2022).
  14. Lew, P.; Olsina, L.; Zhang, L. Quality, Quality in Use, Actual Usability and User Experience as Key Drivers for Web Application Evaluation. In Proceedings of the Web Engineering, 10th International Conference (ICWE 2010), Vienna, Austria, 5–9 July 2010; Benatallah, B., Casati, F., Kappel, G., Rossi, G., Eds.; LNCS 6189. Springer: Berlin/Heidelberg, Germany, 2010; pp. 218–232. [Google Scholar] [CrossRef] [Green Version]
  15. BREEAM. BREEAM Communities Technical Manual. BRE. 2017. Available online: https://www.breeam.com/communitiesmanual/#resources/otherformats/output/10_pdf/20_a4_pdf_screen/sd202_breeam_communities_1.2_screen.pdf (accessed on 7 November 2021).
  16. LEED. LEED v4 for Neighborhood Development. 2018. Available online: https://www.usgbc.org/resources/leed-v4-neighborhood-development-current-version (accessed on 7 November 2021).
  17. DGNB. DGNB Neubau Stadtquartiere (NSQ)—Kriterien. 2011. Available online: https://static.dgnb.de/fileadmin/dgnb-ev/de/_archiv/Aktuell/presseinfos/2011/111004_1A_Ausgezeichnete_Stadtquartiere_Kriterien.pdf (accessed on 7 November 2021).
  18. Ibrahim, Y.; Kershaw, T.; Shepherd, P. Improvement of the Ladybug-tools microclimate workflow: A verification study. In Proceedings of the Building Simulation and Optimization, Loughborough, UK, 9–10 September 2020. [Google Scholar]
  19. Wu, Z.; Chen, L. Optimizing the spatial arrangement of trees in residential neighborhoods for better cooling effects: Integrating modeling with in-situ measurements. Landsc. Urban Plan. 2017, 167, 463–472. [Google Scholar] [CrossRef]
  20. Liu, Z.; Zheng, S.; Zhao, L. Evaluation of the ENVI-Met Vegetation Model of Four Common Tree Species in a Subtropical Hot-Humid Area. Atmosphere 2018, 9, 198. [Google Scholar] [CrossRef] [Green Version]
  21. Scharf, B.; Kraus, F. Green Roofs and Greenpass. Buildings 2019, 9, 205. [Google Scholar] [CrossRef] [Green Version]
  22. Chatzinikolaou, E.; Chalkias, C.; Dimopoulou, E. Urban microclimate improvement using ENVI-Met climate model. ISPRS Int. Arch. Photogramm. Remote. Sens. Spat. Inf. Sci. 2018, XLII-4, 69–76. [Google Scholar] [CrossRef] [Green Version]
  23. Zheng, S.; Zhao, L.; Li, Q. Numerical simulation of the impact of different vegetation species on the outdoor thermal environment. Urban For. Urban Green. 2016, 18, 138–150. [Google Scholar] [CrossRef]
  24. Lee, H.; Mayer, H.; Chen, L. Contribution of trees and grasslands to the mitigation of human heat stress in a residential district of Freiburg, Southwest Germany. Landsc. Urban Plan. 2016, 148, 37–50. [Google Scholar] [CrossRef]
  25. El-Bardisy, W.M.; Fahmy, M.; El-Gohary, G.F. Climatic Sensitive Landscape Design: Towards a Better Microclimate through Plantation in Public Schools, Cairo, Egypt. Procedia Soc. Behav. Sci. 2016, 216, 206–216. [Google Scholar] [CrossRef] [Green Version]
  26. Morakinyo, T.E.; Lam, Y.F. Simulation study on the impact of tree-configuration, planting pattern and wind condition on street-canyon’s micro-climate and thermal comfort. Build. Environ. 2016, 103, 262–275. [Google Scholar] [CrossRef]
  27. Müller, N.; Kuttler, W.; Barlag, A.-B. Counteracting urban climate change: Adaptation measures and their effect on thermal comfort. Theor. Appl. Climatol. 2013, 115, 243–257. [Google Scholar] [CrossRef] [Green Version]
  28. Vidmar, J.; Roset, J. Evaluation of Simulation Tools for Assessment of Urban Form Based on Physical Performance; Faculty of Architecture: Ljubljana, Slovenia, 2013. [Google Scholar]
  29. Al-Bdour, M.; Baranyai, B. An overview of microclimate tools for predicting the thermal comfort, meteorological parameters and design strategies in outdoor spaces. Pollack Period. 2019, 14, 109–118. [Google Scholar] [CrossRef]
  30. Diéguez, A.P.; Duckart, C.; Coccolo, S. Urban Thermal Comfort Study. Available online: https://whitearkitekter.com/wp-content/uploads/2018/07/Thermal-Comfort-Analysis-Kiruna-White-Arkitekter.pdf (accessed on 7 November 2021).
  31. Fabbri, K.; Di Nunzio, A.; Gaspari, J.; Antonini, E.; Boeri, A. Outdoor Comfort: The ENVI-BUG tool to Evaluate PMV Values Output Comfort Point by Point. In Proceedings of the 8th International Conference on Sustainability in Energy and Buildings (SEB-16), Turin, Italy, 11–13 September 2016. [Google Scholar] [CrossRef]
  32. Ibrahim, Y.; Kershaw, T.; Shepherd, P. A methodology for Modelling Microclimates: A Ladybug-tools and ENVI-met verification study. In Proceedings of the 35th PLEA Conference. Planning Post Carbon Cities, Coruña, Spain, 1–3 September 2020. [Google Scholar]
  33. Naboni, E.; Meloni, M.; Coccolo, S.; Kaempf, J.; Scartezzini, J.L. An overview of simulation tools for predicting the mean radiant temperature in an outdoor space. In Proceedings of the CISBAT 2017 International Conference—Future Buildings & Districts—Energy Efficiency from Nano to Urban Scale (CISBAT 2017), Lausanne, Switzerland, 6–8 September 2017. [Google Scholar] [CrossRef]
  34. McEvoy, S. Planning Support Tools in Urban Adaptation Practice. Ph.D. Thesis, Delft University of Technology, Delft, The Netherlands, 2019. [Google Scholar] [CrossRef]
Figure 1. Structure of the paper (source: authors).
Applsci 12 00739 g001
Figure 2. Site plan of the case study project (source: Ramboll Studio Dreiseitl).
Applsci 12 00739 g002
Figure 3. Comparison of radiation simulations: (a) ENVI-met; (b) Ladybug (source: authors).
Applsci 12 00739 g003
Figure 4. Comparison of the simulations of sun hours: (a) ENVI-met; (b) Ladybug (source: authors).
Applsci 12 00739 g004
Figure 5. Comparison of UTCI simulations: (a) ENVI-met; (b) Ladybug (source: authors).
Applsci 12 00739 g005
Figure 6. Final climate adaptation plan using GreenSceario (source: authors).
Applsci 12 00739 g006
Figure 7. Comparison of software tools concerning different ISO 25010 aspects (source: authors).
Applsci 12 00739 g007
Table 1. Software evaluation framework for climate adaptation software based on ISO 25010 standard (source: authors).
ISO RequirementsDescriptionTargetsMeasures
Functional Suitability
Functional completenessAnalysis of various aspects of climate adaptation covered in the softwareEvaluation of the software’s functionsObservations
Functional appropriatenessAccomplishment of the task excludes unnecessary stepsEvaluation of process mapsProcess maps and time register
Compliance with sustainability certificationsThe analysis of the aspects of sustainability coveredEvaluation of the
Software’s compliance with sustainability standards
Aspects defined in sustainability certifications
Information Quality
AccuracyHow accurate the simulations or calculations areEvaluation of the accuracy of simulationsVisual and digital comparisons
SuitabilityHow the software informs on the climate adaptation performanceEvaluation of how the results inform on climate adaptation planningClimate adaptation targets
Reliability
Software AvailabilityEvaluation of the software’s reliabilityCalculation of incidents of the software ‘not responding’Incidents register
Fault toleranceEvaluation of the software’s operation despite hardware or software faultsCalculation of errors and failuresError register
RecoverabilitySoftware can recover data in case of interruptionEvaluation of recovered data in case of system errorObservations
Performance efficiency
Time -behaviorTime needed for task processing and simulationsCalculation of time used per taskTime register
Resource utilisationResources needed for tasks (excludes productivity)Evaluation of the resources (expert consultations, training material, other files and software tools) needed to perform the taskList of resources
Usability
LearnabilityTime to learn to use the software for climate adaptation functionsCalculation of the time for training Training time register
OperabilityThe software can be easily operated after having been learnt.Evaluation of the software’s complexity Observations
User error protectionSoftware can help users to avoid errorsEvaluation of error identificationObservations
Compatibility
Co-existenceSoftware performs efficiently, sharing a common environment and resources with other software toolsEvaluation of how the software is compatible with other softwareImplementation process maps and time register
InteroperabilitySoftware can exchange and use the information from other softwareEvaluation of the data lost or geometrical issues in the exportation and importationObservations
Table 2. Comparison of functional completeness of different software tools (source: authors).
ParameterENVI-MetLadybugCitySimGreenScenarioAST
GREEN MEASURES
Green factor +
Biodiversity +
Shaded area+++
BLUE MEASURES
Rainwater management ++
Evapotranspiration+ ++
CLIMATE ANALYSIS
Solar analysis++
Surface temperature+ +
Radiation+++
Air pollution +
Wind analysis++
Thermal comfort++
Thermal load+
Thermal storage+
Heat island reduction++ +
CO2 reduction+ +
ECONOMIC IMPACT
Maintenance costs ++
Construction costs ++
11p.6p.3p.8p.5p.
Table 3. The comparison of the functional appropriateness and performance efficiency of different software tools (source: authors).
ENVI-MetLadybugASTGreenScenarioCitySim Pro
Importation
Compatibility
1 Model Preparation using SketchUp INX
Duration: 1 h 30 min
1 Import SketchUp to Rhino
Duration: 2 min
No compatibility1 Clean 3D model
Duration: 20 min
2 Export to AutoCAD
Duration: 3 min
1 Export to AutoCAD;
Duration: 2 min
2 Prepare DXF model
Duration: 5 min
2 Exportation to ENVI-met Spaces
Duration: 5 min
3 Export dwg to Rhino
Duration: 2 min
3 Import DXF into SIM
Duration: 2 min
3 Solving errors
Duration: 2 h
Model adjustments/
remodelling
4 Adjustments in ENVI-met Spaces/Albero
Duration: 1 h
1 Assign the project location and boundary;
Duration: 5 min
2 Define the characteristics of the area;
Duration: 2 min
3 Define climate adaptation goals;
Duration: 5 min
4 Choose climate adaptation measures;
Duration: 2 min
5 Draw the measures on the map;
Duration: 2 h
6 Generate the final design;
Duration: 10 min
4 Extrude the buildings and trees;
Duration: 1 h 15 min
5 Assign materials to surfaces;
Duration: 2 h 20 min
Settings5 Setting up the simulation
Duration: 5 min
2 Setting the Simulation 1 (visual scripting method)
Duration: 45 min
3 Setting the Simulation 2
Duration: 30 min
4 Setting the Simulation 3
Duration: 30 min
-6 Prepare visual script;
Duration: 15 min
4 Prepare cli. and hor. Files;
5 Set up the attributes of materials;
Duration: 5 min
Simulations6 Simulating
Duration: 21 h
5 Simulating Simulation 1
Duration: 2 min
6 Simulating Simulation 2
Duration: 2 min
7 Simulating Simulation 3
Duration: 2 min
- 6 Simulation
Duration: 98 h
Results7 Illustration of simulation results
Duration: 30 min
-
8 Running BIOMET simulations (additional)
Duration: 1 h 20 min
--
Overall Duration: 27 h 30 min
Steps: 8
Overall Duration: 2 h 23 min
Steps: 7 (depends on the number of simulations)
Overall Duration: 2 h 24 min
Steps: 6
Overall Duration:
4 h 12 min
Steps: 6
Overall Duration:
98 h 14 min
Steps: 6
Table 4. The compliance of different software tools with sustainability requirements (source: authors).
RequirementENVI-MetLadybugCitySimGreenScenarioAST
BREEAM
Rainwater assessment ++
Flood risk assessment and management +
Microclimate analysis+++
Green infrastructure analysis+ ++
Ecological value analysis ++
LEED
Floodplain analysis ++
Rainwater analysis ++
Green infrastructure analysis+ ++
Impact on heat island++ +
Ecological analysis (habitats) ++
DGNB
Climate change analysis +
Water and soil analysis ++
Life cycle costs
Environmental impact+++++
Rainwater management ++
5p.3p.2p.10p.13p.
Table 5. Impact on climate and costs calculated with AST (source: authors).
MeasureSurfaceStorage Capacity (m3)Return Time Factor
(-)
Groundwater Recharge
(mm/y)
Evapotrans-Poration
(mm/y)
Heat Reduction
(°C)
Cool Areas
(-)
ConstructionMaintenance
Adding trees to streetscape14,004.097003.5267600.3118159,64754
Bioswale (with drainage)962.113373.092700.02072,158722
Green roofs19,8061981.510130.4402,376,720118,836
Urban forest10,895.09217912.627300.24210,895545
Permeable pavement systems (infiltration)7384.417386.9162200738,4413101
Rainwater detention pond (wet pond)435.081313.081300.01017,40387
Table 6. Software evaluation based on ISO 25010 (source: authors).
Quality Characteristics
and Sub-Characteristics
ENVI-MetGreenScenarioLadybugCitySim ProAST
Functional suitability
Functional appropriateness14235
Functional completeness54312
Compliance with sustainability requirements34215
Reliability
Software availability55132
Fault tolerance23315
Recoverability35521
Performance Efficiency
Time behaviour23514
Resource utilization23415
Usability
Learnability31145
Ease of use13245
User error protection53341
Compatibility
Co-existence25541
Interoperability24531
Information Quality
Accuracy 53412
Suitability54213
OVERALL4654473447
Table 7. SWOT analysis (source: authors).
HelpfulHarmful
Internal originStrengthsWeaknesses
Implementation of the ISO framework to the research helped to standardise software evaluation process;
Objective experiments were conductedby one person on the same device, reducing the level of variables;
The most suitable tools for climate adaptation projects were tested by comparing the output of different tools and processes.
Software tools were evaluated based on the findings of one project;
The research excludes the considerations on wider software applicability;
The research findings are partly influenced bythe individual capabilities;
Some software tools could not be tested due to low public accessibility.
External originOpportunitiesThreats
The development of software tools can meet climate adaptation planning needs;
Software tools can improve the planning process for planners based on informed decisions.
Different understanding of climate adaptation;
A low number of planners pursuing climate adaptation projects;
Low integration of software tools in climate adaptation planning process.
Publisher’s Note: MDPI stays neutral with regard to jurisdictional claims in published maps and institutional affiliations.

