1. Introduction
A composite waterproofing system is a method of laminating sheet waterproofing material and waterproofing membrane coating. Modified asphalt sheet, synthetic polymeric sheet, and butyl rubber sheets have mainly been applied as sheet waterproofing materials, while cured membrane materials such as polyurethane, acrylic rubber, polyurea and rubberized asphalt, and uncured membrane materials including synthetic rubber polymer gel and bituminous emulsion mastic (BEM) have been used as waterproofing membrane coatings [
1]. Particularly among uncured membrane materials, bituminous emulsion mastic (BEM) has excellent waterproofing performance and stability, and superior behavior responsiveness. It is also more economical compared to the composite waterproofing system using rubberized asphalt and polyurethane based on its flexibility and flowability. For this reason, it has been actively applied in South Korea since the 2000s [
2].
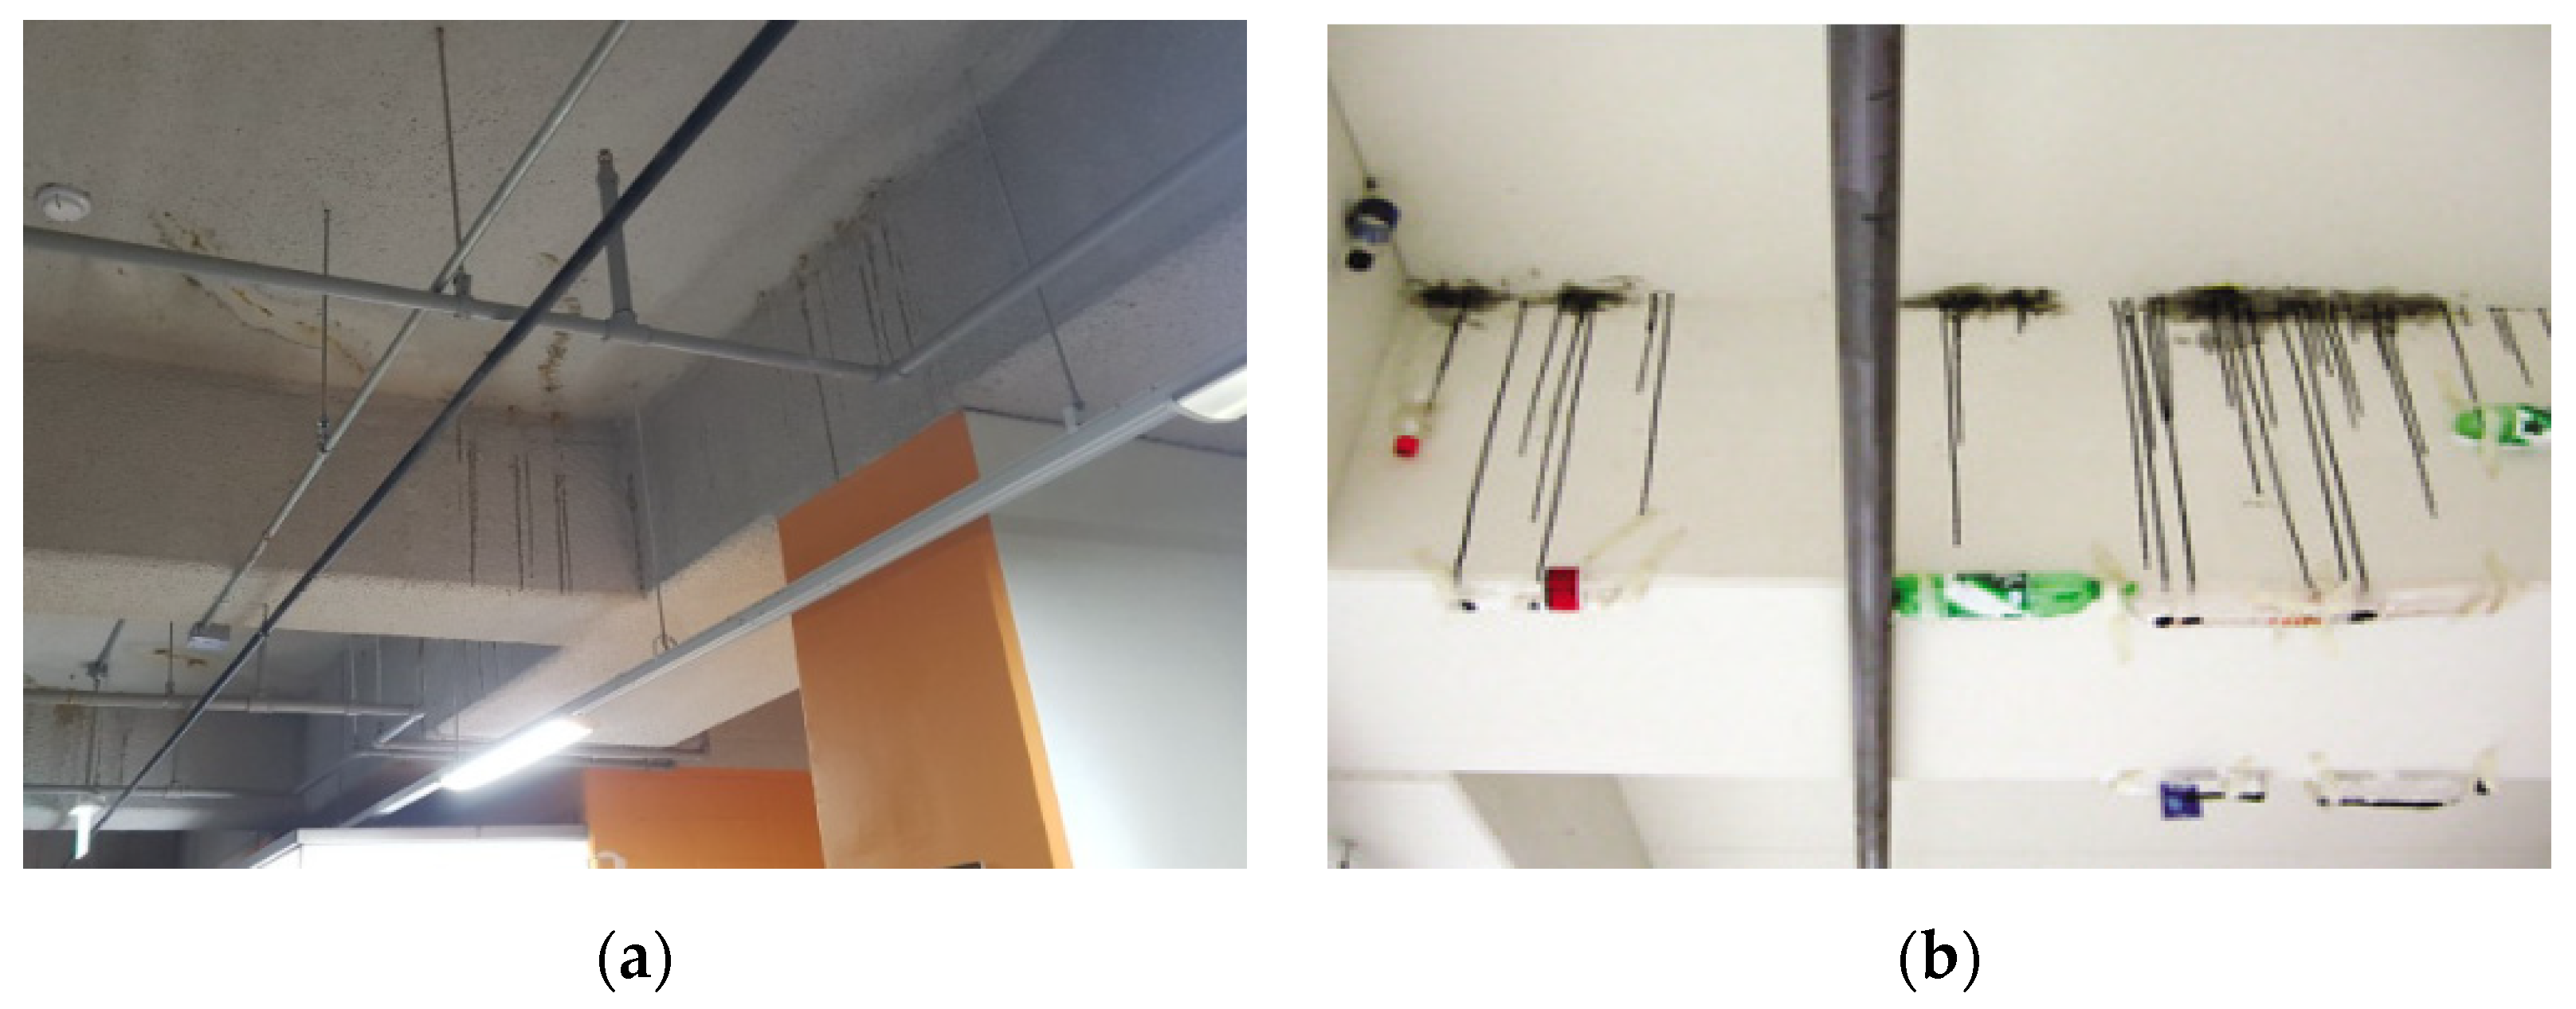
However, oil leakage, a phenomenon in which the oil component of BEM leaks to the cracked area of concrete as shown in
Figure 1, occurred at the site where BEM was applied as a waterproofing material. This oil leakage problem resulted in environmental and property damage, and led to controversy about the defects of the waterproofing method using BEM. In addition, the need to examine the material stability of BEM has been raised because the oil leakage phenomenon of BEM may cause the degradation of waterproofing performance due to the cross-sectional loss of the waterproofing layer [
3].
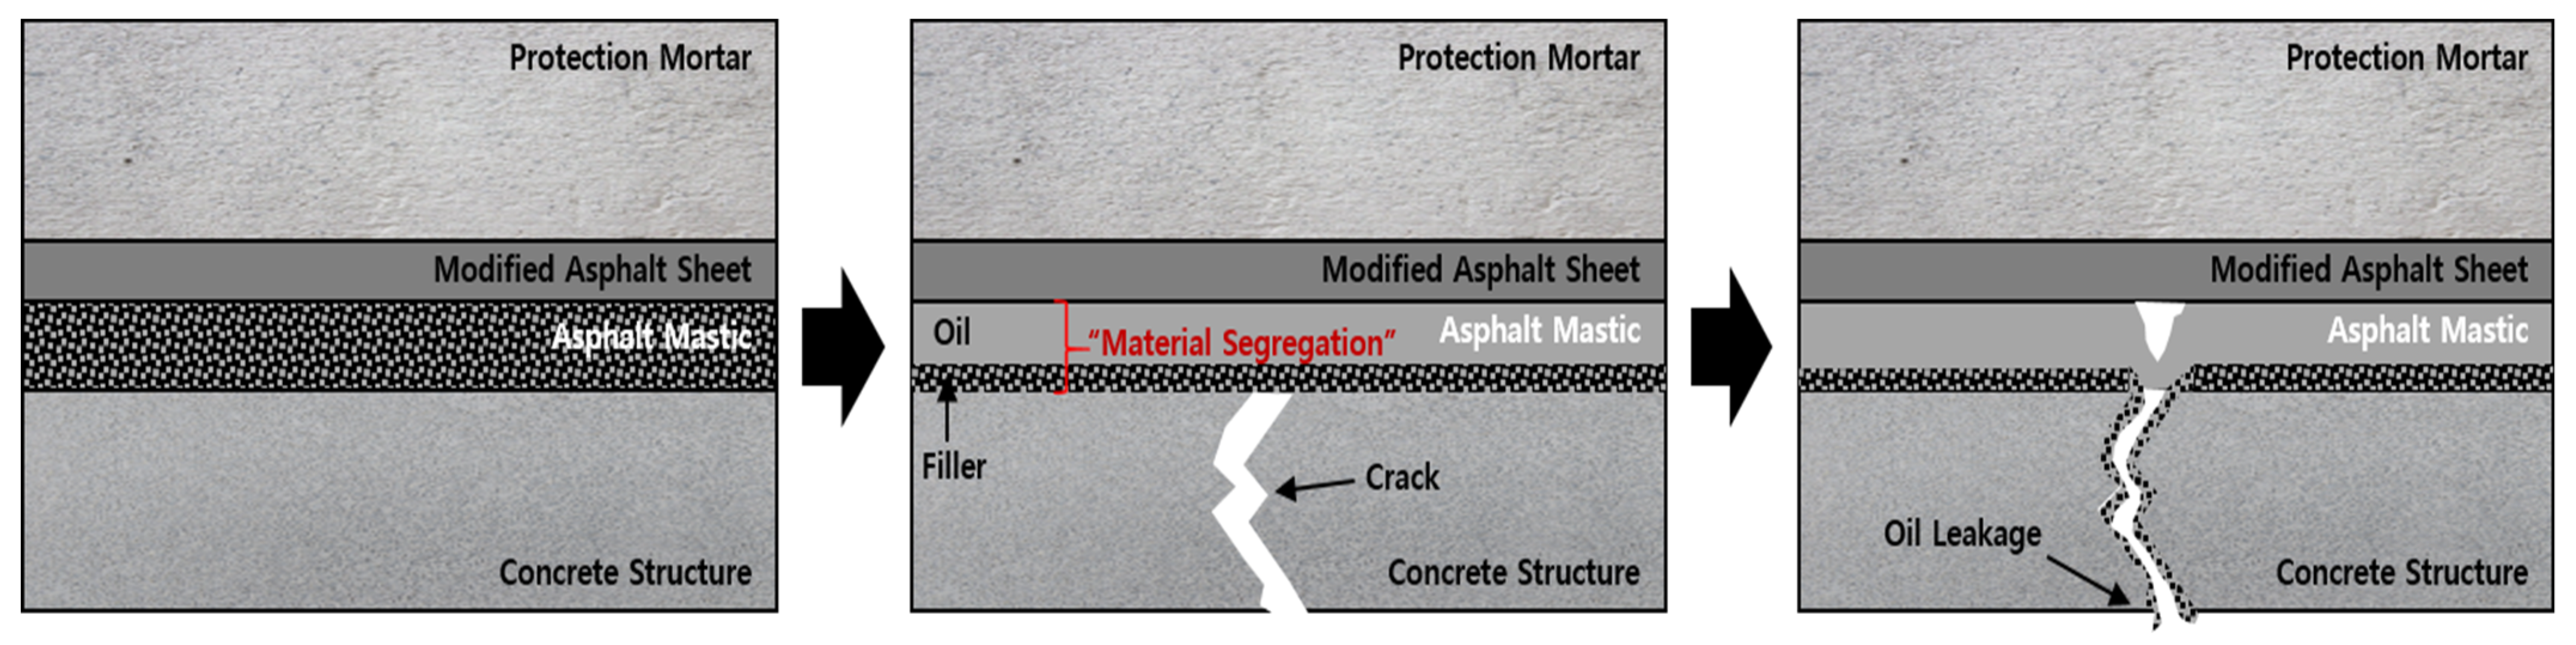
In this regard, research was conducted regarding the causes of oil leakage in BEM, and the results revealed that the biggest cause of oil leakage in BEM is material segregation due to the difference in specific gravity between the constituent materials. In relation to previous studies regarding BEM, Park [
4] analyzed the causes of oil leakage in BEM and revealed that oil leakage in BEM is caused by material segregation due to the difference in specific gravity between organic and inorganic extenders among constituent materials. The mechanism of oil leakage described in the research is that a composite waterproofing system using BEM forms a solid waterproofing layer and performs its original function as a waterproofing layer in the early stages after installation. However, as time passes, organic additives with a relatively low specific gravity float to the top of the BEM layer, whereas inorganic additives with a relatively high specific gravity settle to the bottom. In this way, the BEM layer is separated, and then cracking occurs in the concrete structure, when the inorganic additive layer formed on the bottom of the BEM layer collapses along with the cracks, and the organic additive flows to the outside through the cracks [
4]. The conceptual diagram of the oil leakage mechanism is shown in
Figure 2.
At present, there is no systematic material improvement research of BEM to address the oil leakage problem. In addition, even if relevant research has been done, it has failed to provide clear improvement plans because quantitative and systematic data accumulation and analysis were not made as the research focused on the experience of producers in the actual production plant [
4,
5]. Therefore, research was required to solve the oil leakage problem of waterproofing materials using BEM, and through this, material stability was attempted to be secured.
In this study, analysis was performed using the average particle size and content of CaCO3 (CA) and anti-sedimentation (ASE), which are directly involved in material segregation among the raw materials of BEM, as variables with focus on the fact that the cause of oil leakage in BEM is material segregation between the constituent materials. After the fabrication of samples for each mix design according to the set variables, the correlation was analyzed through viscosity and oil leakage stability evaluations to establish quantitative data, and a mix design method capable of ensuring oil leakage stability was proposed based on the data.
2. Understanding of BEM and Research Trends
BEM, the subject of this study, is a bituminous material incorporating process oil, rubber, inorganic fillers and other functional additives with straight asphalt and blown asphalt as the main raw materials. It is an uncured waterproofing membrane coating material that has excellent elasticity and flexibility, and maintains a gel state that is not completely cured after the installation of waterproofing layer.
Table 1 summarizes the general properties of BEM.
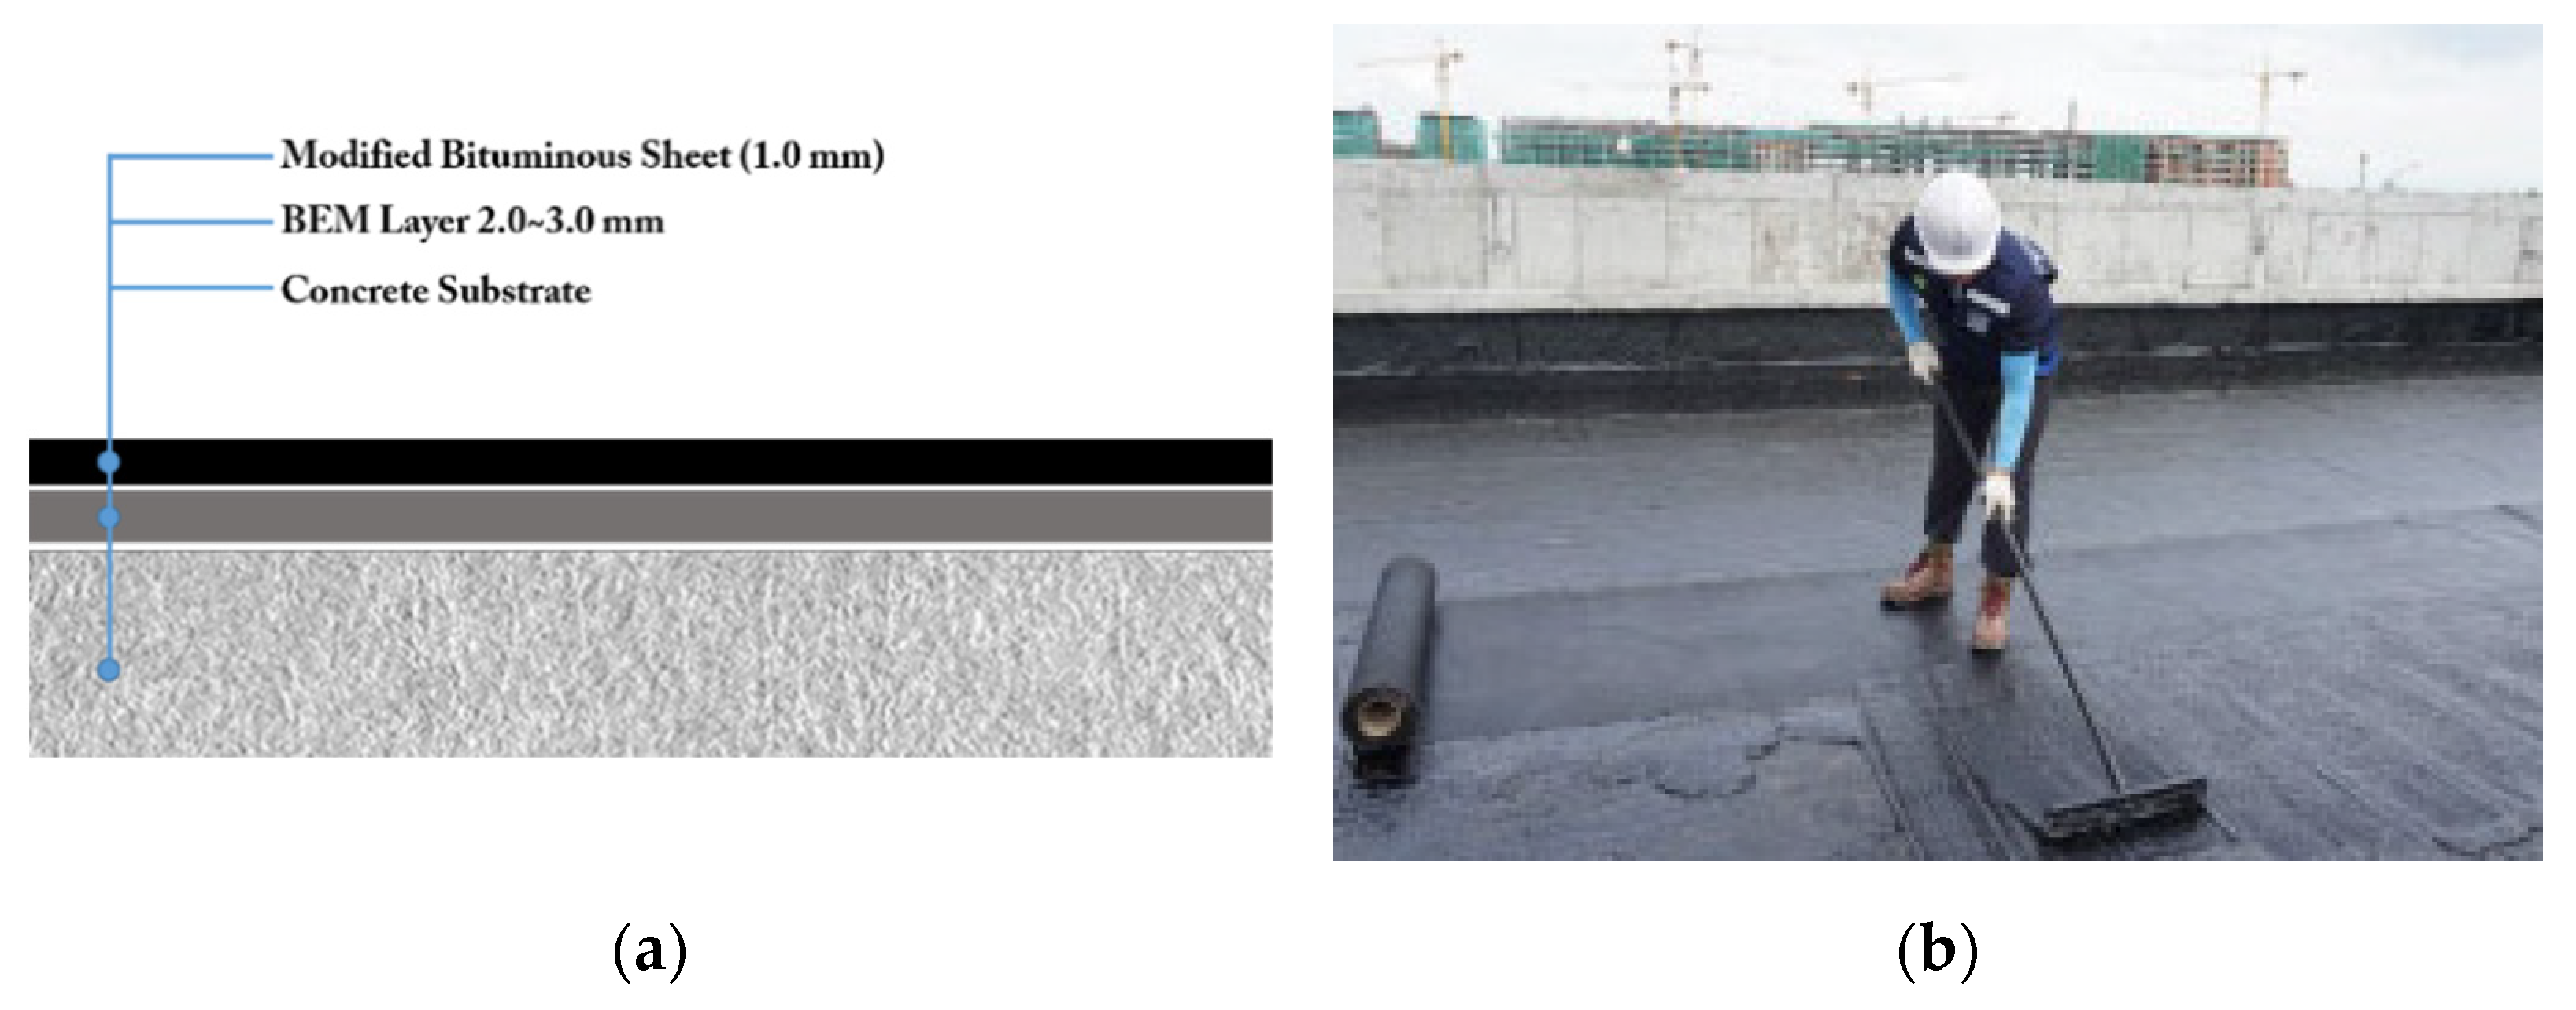
The composition of a composite waterproofing system using BEM is largely divided into the top sheet waterproofing layer and the bottom BEM layer as shown in
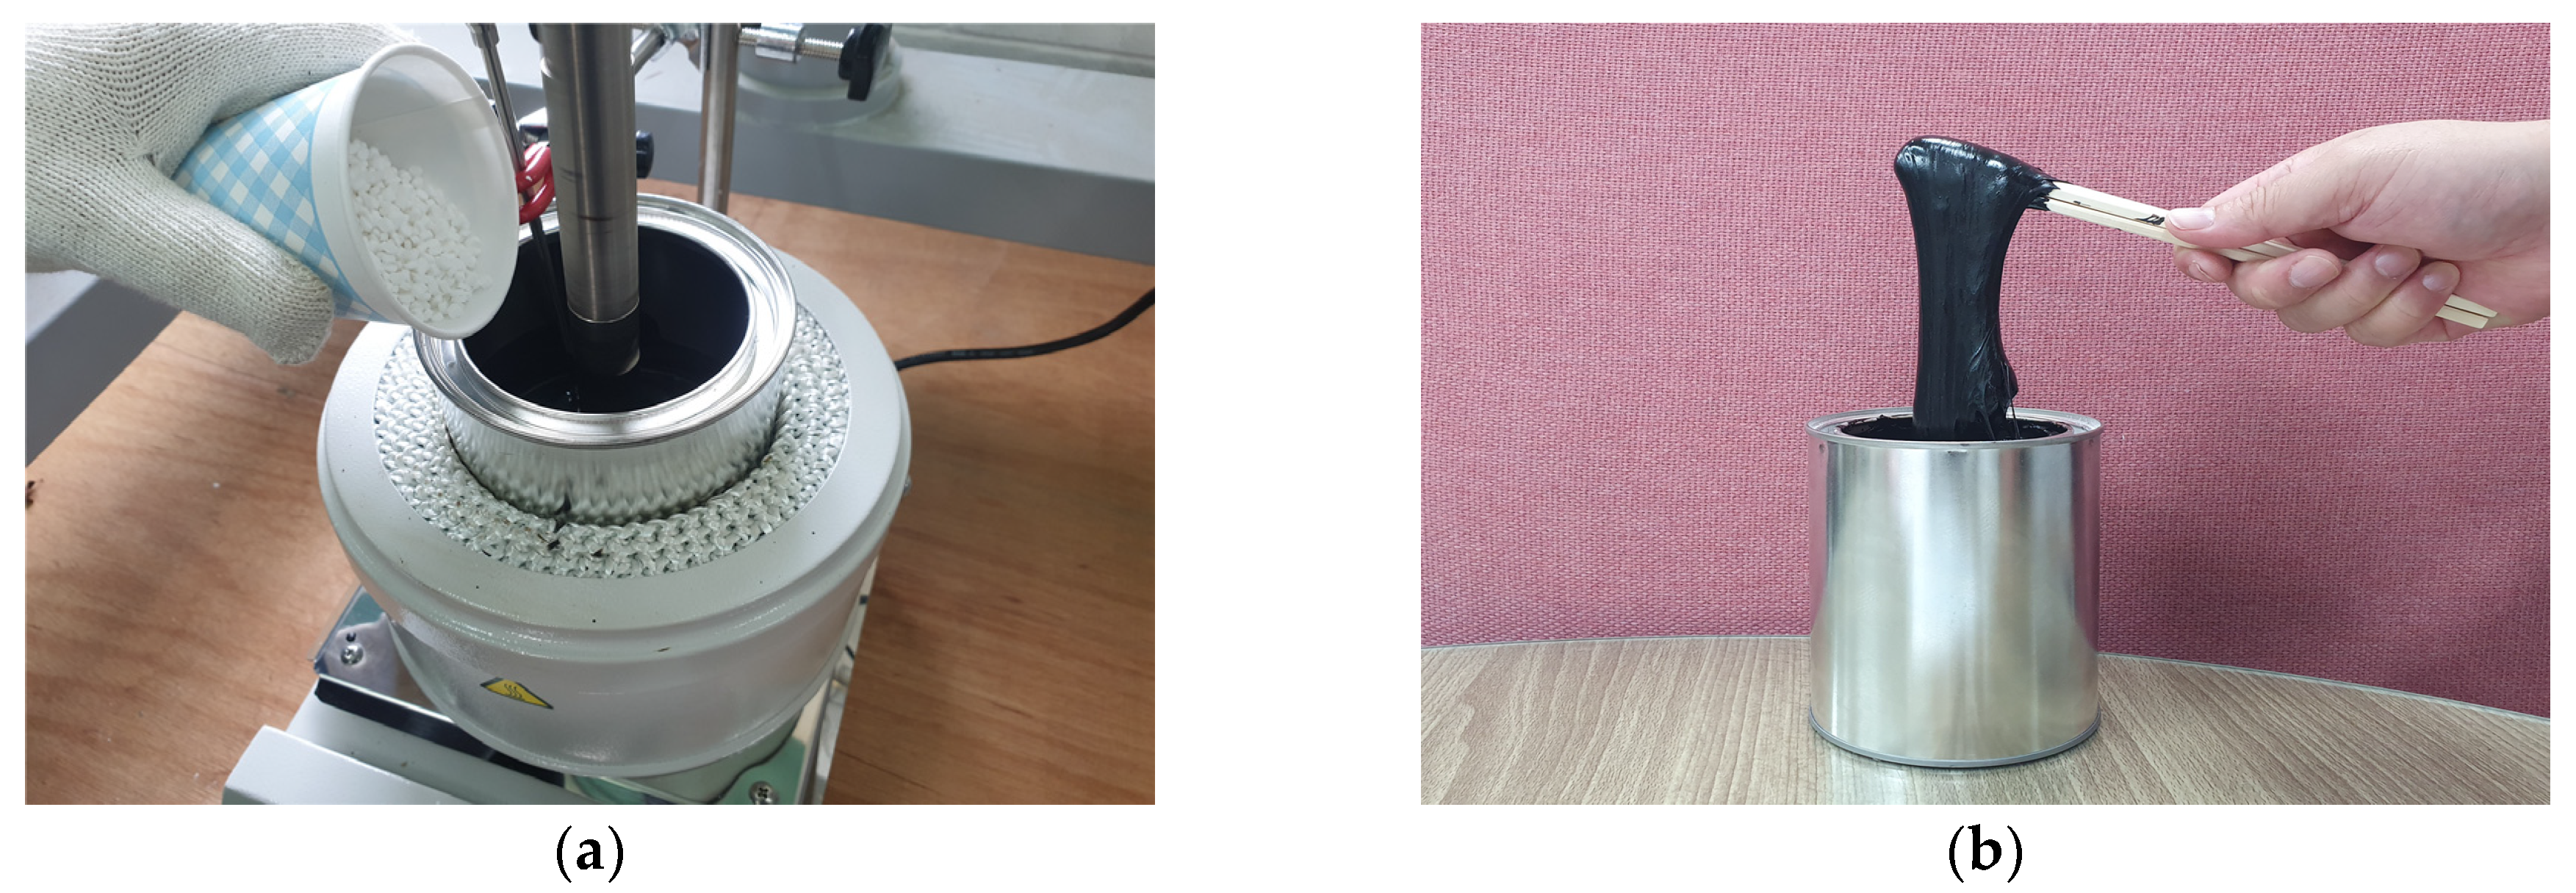
Figure 3a. The sheet waterproofing material on the top of the waterproofing layer ensures waterproofing performance and protects the BEM, while the bottom BEM layer helps bond the waterproofing layer to the concrete substrate and secure waterproofing performance and behavior responsiveness to form a stable waterproofing layer. In addition, BEM has an advantage in that it can be easily constructed using squeegees as shown in
Figure 3b. Among the basic physical properties of BEM, viscosity is used as a workability indicator. In general, proper workability can be achieved within the viscosity range of about 5 × 10
5 mPa·s [
6].
3. Experimental Design and Method
3.1. Experimental Subjects
The details of material composition for BEM used in this study are summarized in
Table 2 [
6].
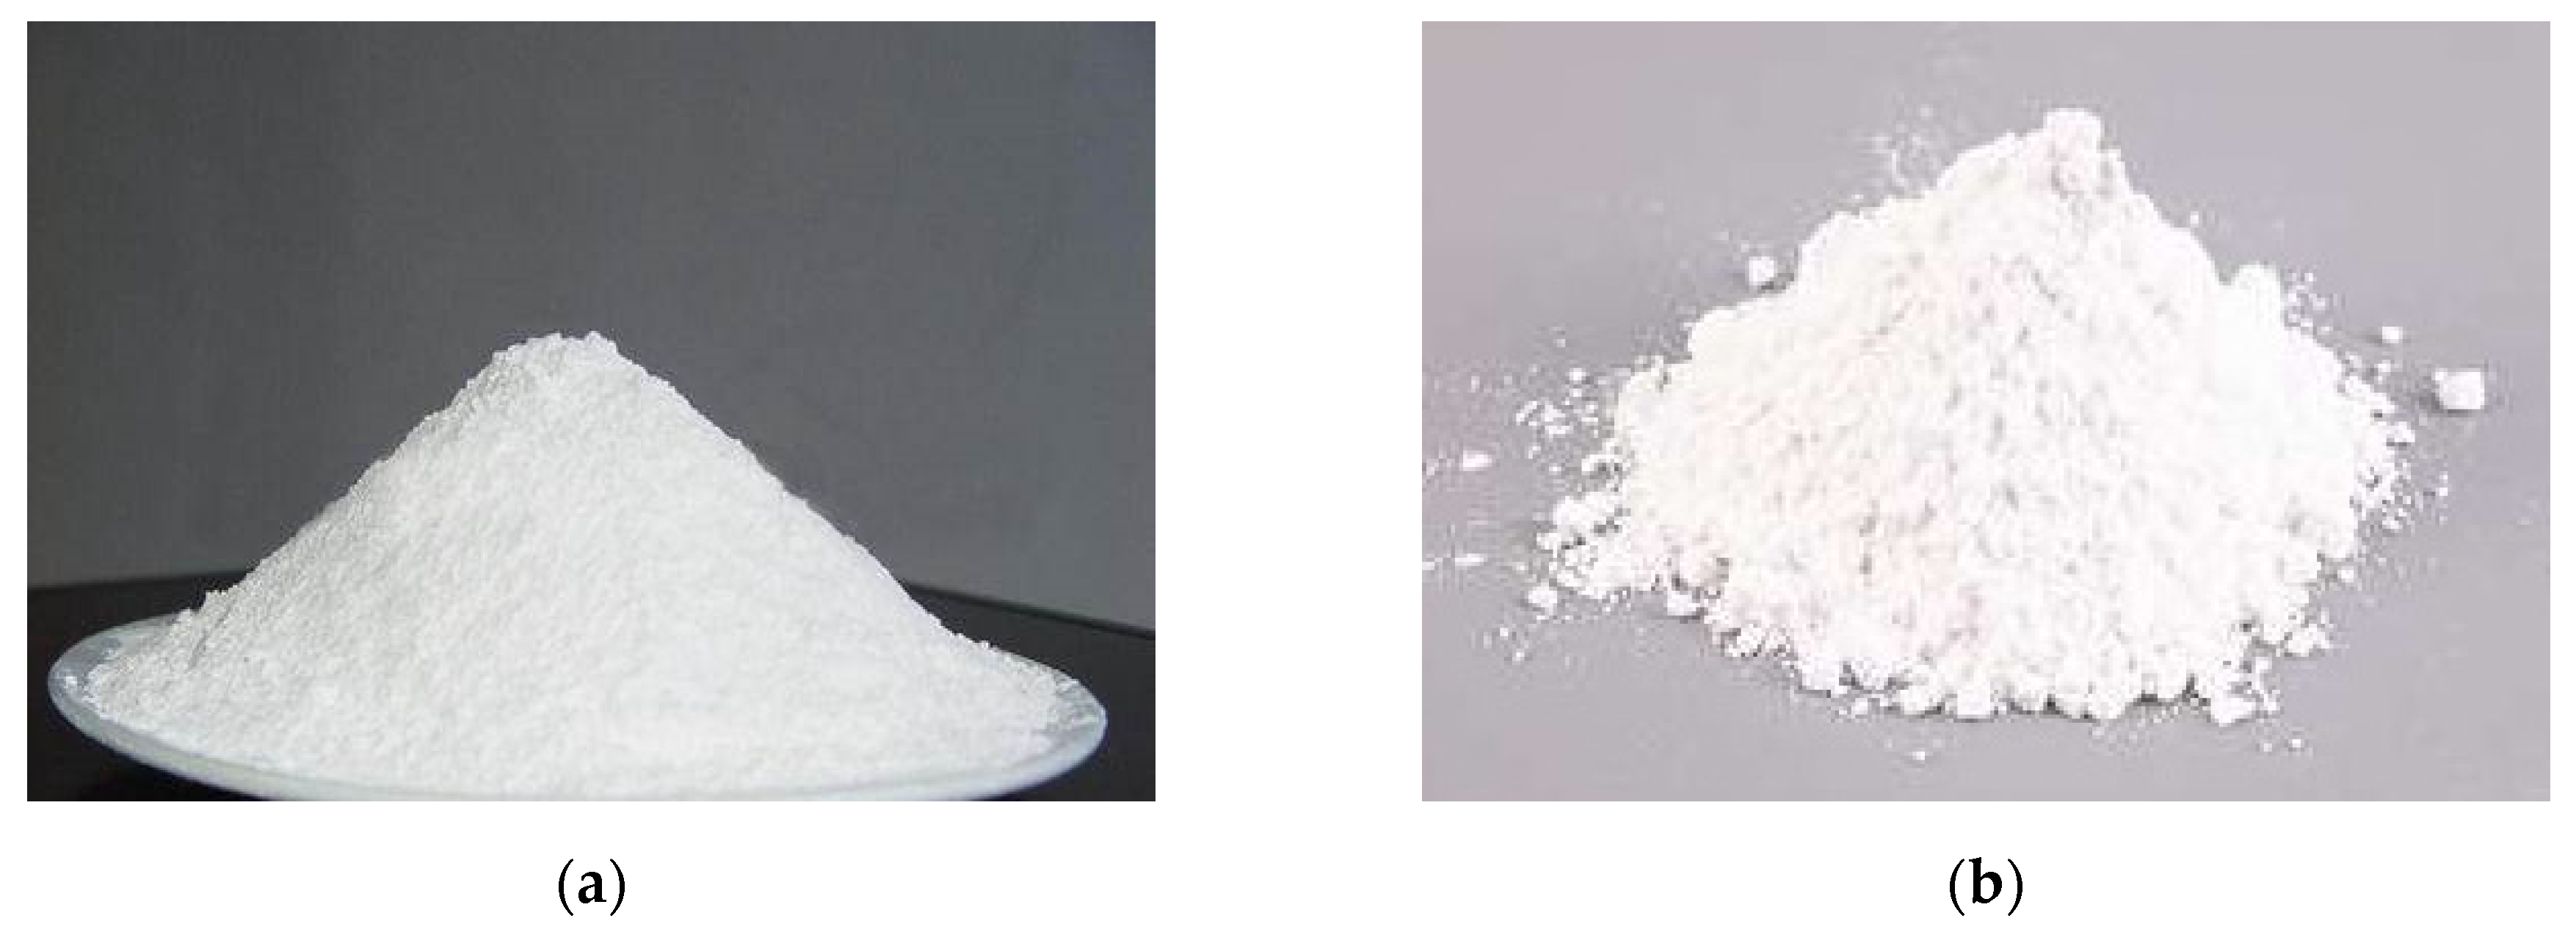
Among the constituent materials of asphalt mastic, straight asphalt (AP) is a typical raw material constituting asphalt mastic, and blown asphalt (BA) is used to improve the physical strength of AP. Process oil (PO) serves as a plasticizer to improve processability and flexibility, and butyl rubber (BR) is involved in improving mechanical properties, increasing durability and imparting adhesion property. Pulp (PP) is used to improve physical bond strength, and talc (AS) increases its resistance to flow. A conditioning agent (V) promotes the uniform dispersion of raw materials during the mixing process, and wollastonite (WS) and sepiolite (SS) improve bond strength through volume change and oil absorption. Solvent (SV) is added to improve mixability and workability. The raw materials CA and ASE, which are variables in this study, are usually in the form of power as shown in
Figure 4. CA is a mineral-based raw material that accounts for a large proportion among the raw materials constituting BEM, and its oil absorption property improves the storage ability of an added plasticizer to prevent separation between materials. Meanwhile, ASE uses bentonite, and through the gelling properties of bentonite, it prevents precipitation between raw materials and material segregation by adsorption between organic and inorganic raw materials [
6].
3.2. Experimental Design
3.2.1. Outline
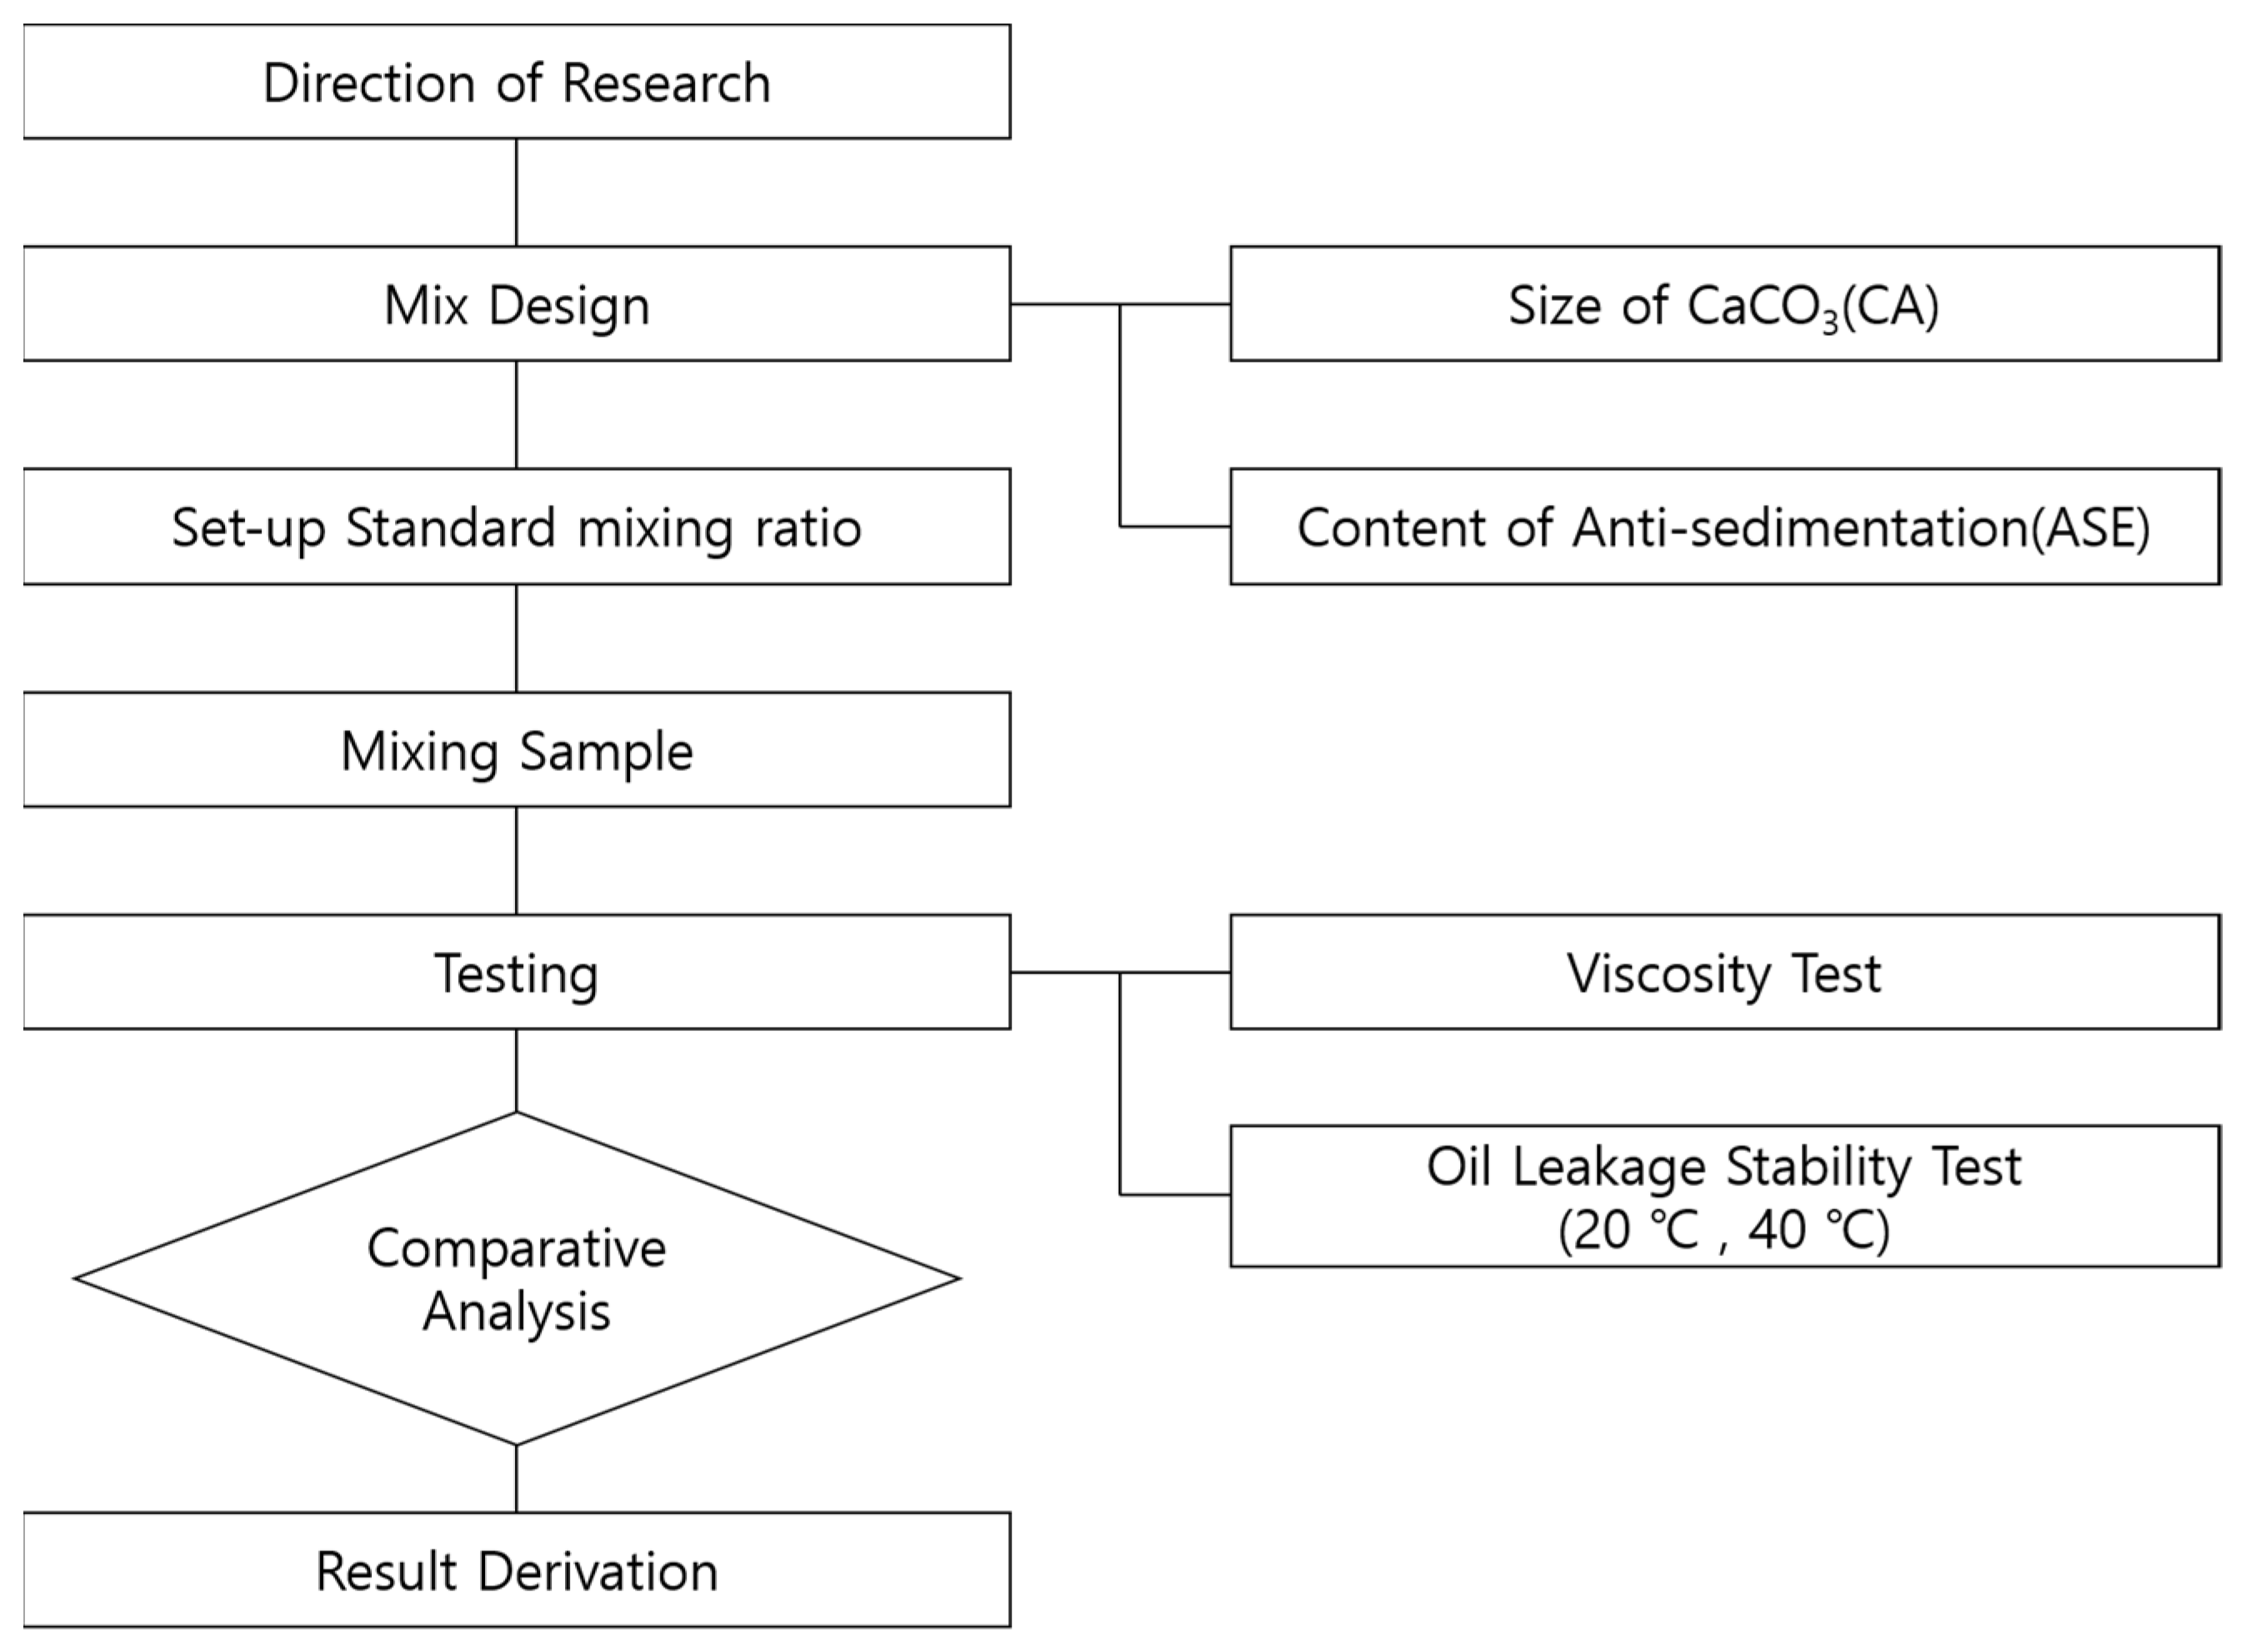
In this study, the fabrication of samples was done by adjusting the ASE for each CA average particle size to a predetermined content, and viscosity and oil leakage stability tests were conducted on the fabricated specimens to analyze the correlation and propose a mix design method capable of ensuring workability and oil leakage stability. The overall process of this study is shown in
Figure 5.
3.2.2. Mix Design
With regard to mix design, the CA average particle size (diameter) was set to 16 μm, 5.0 μm, 2.0 μm, 1.4.0 μm and 1.0 μm in consideration of the particle size ranges used by BEM manufactures, while the ASE content for each CA average particle size was planned to increase 2 times, 3 times, 4 times, 5 times and 6 times the content determined in the standard mixing ratio. The fabrication of samples according to the mix design was done with a capacity of 2 L, and a total of 30 specimens were fabricated according to the planned mix design, as shown in
Table 3. The fabrication process of samples and detail is shown in
Figure 6 and
Table 4.
3.3. Experimental Method
3.3.1. Viscosity Measurement
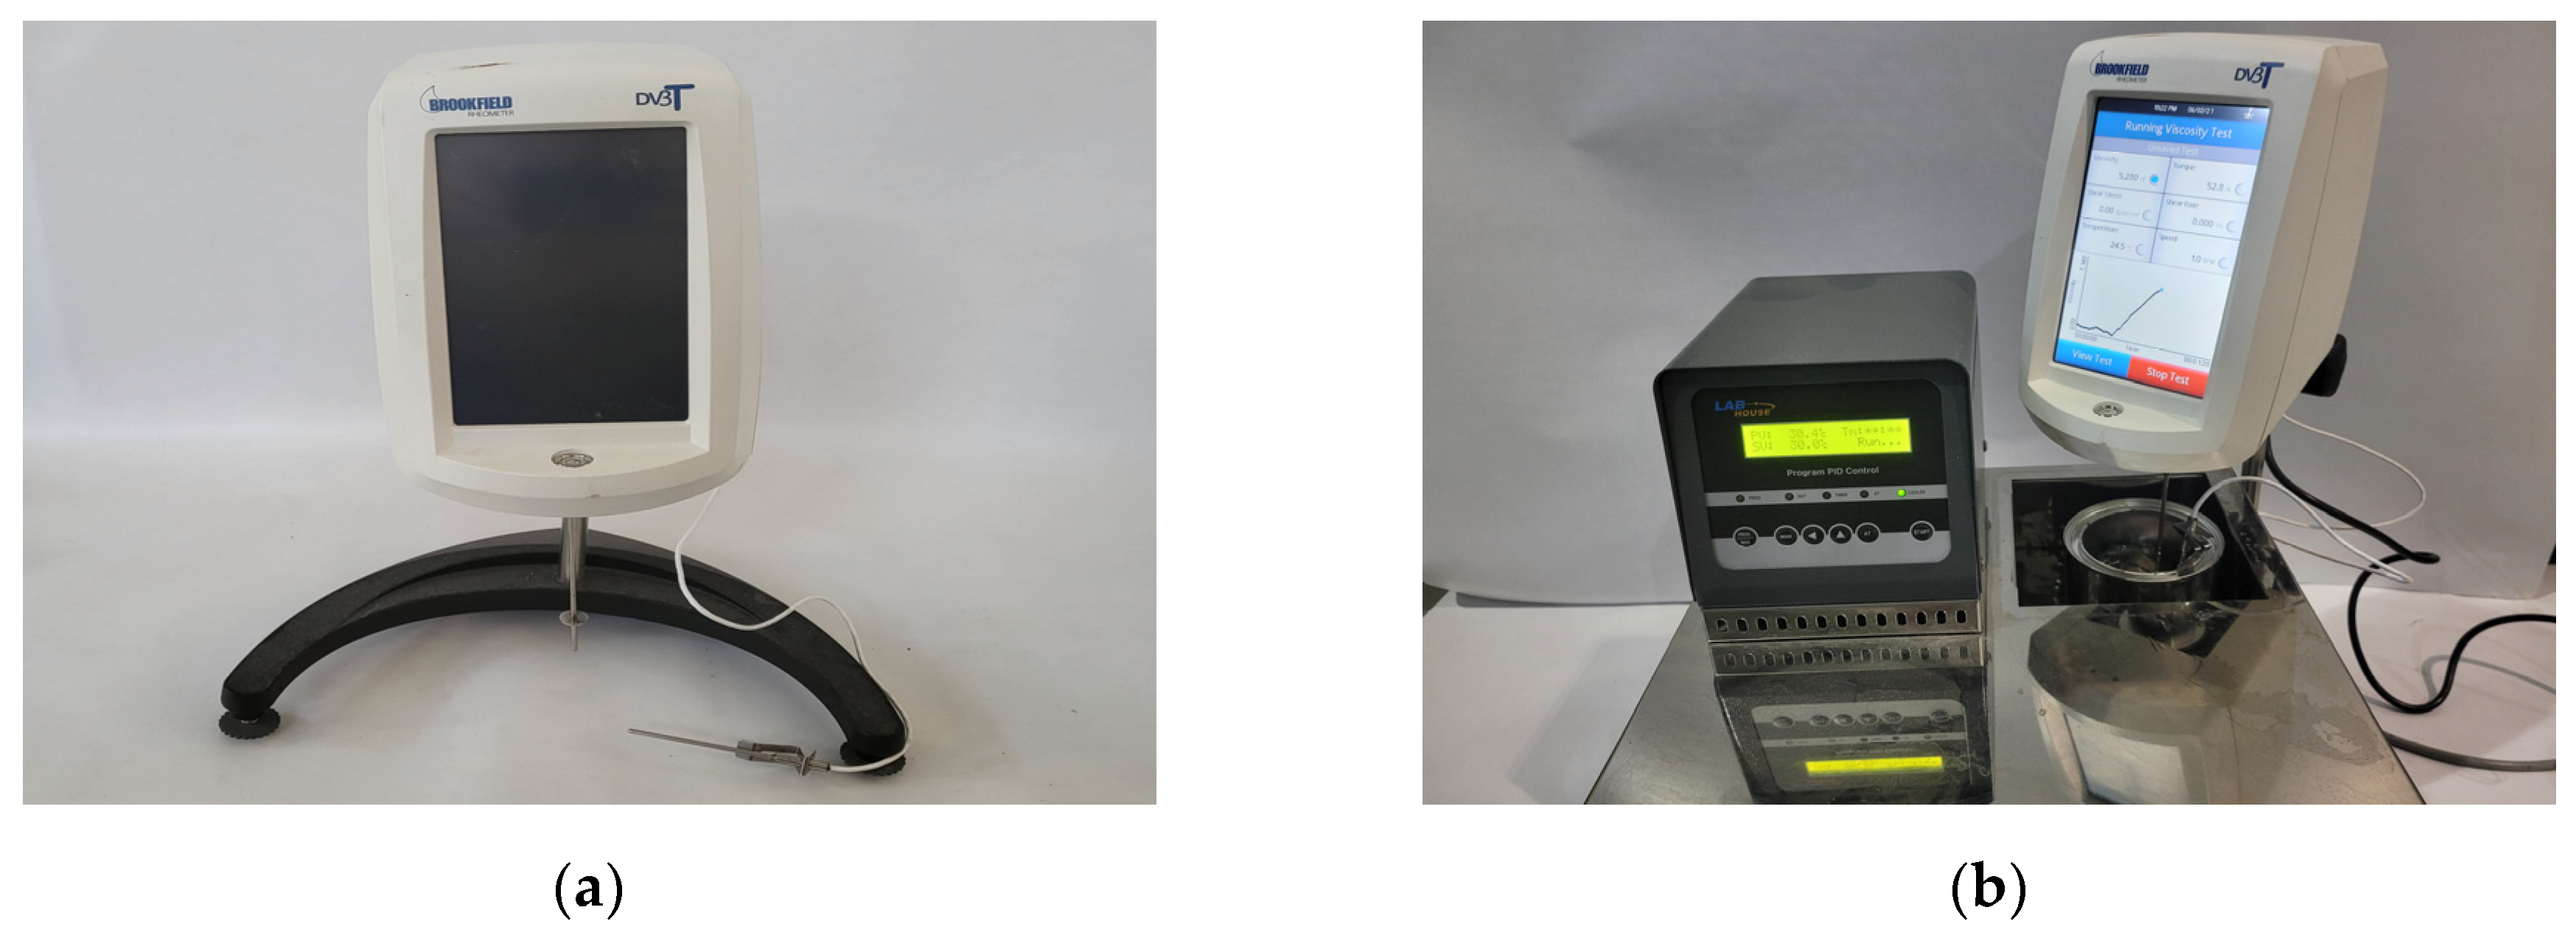
The viscosity was measured in accordance with ‘KS M ISO 2555 Plastics-Resins in the liquid state or as emulsions or dispersions-Determination of apparent viscosity by the Brookfield Test method’. The measurement device and status are shown in
Figure 7. The temperature of the sample was maintained at 20 ± 1 °C, and the viscosity was measured using the No. 6 spindle (Sp.6) at a speed of 1 rpm for 60 s [
7].
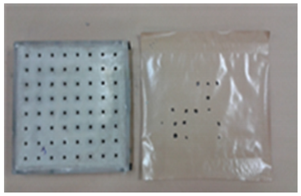
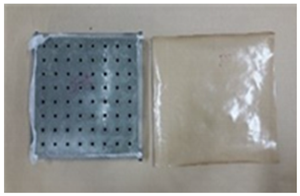
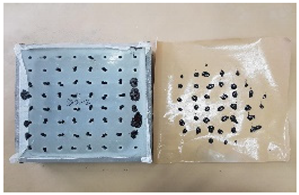
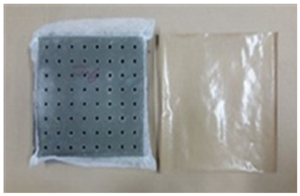
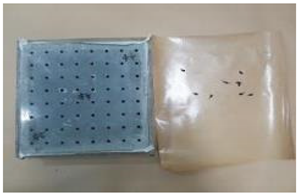
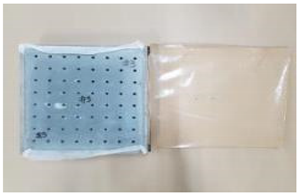
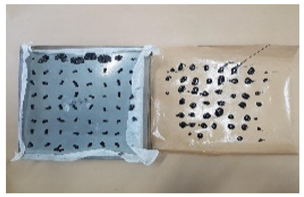
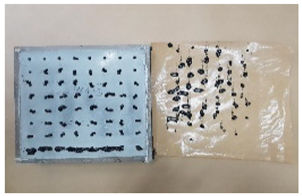
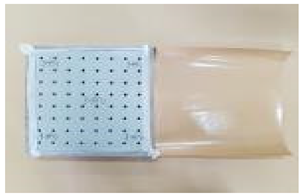
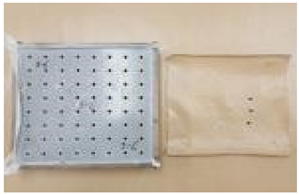
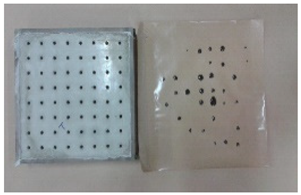
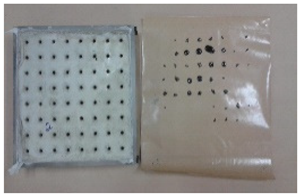
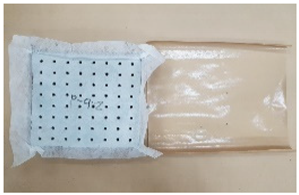
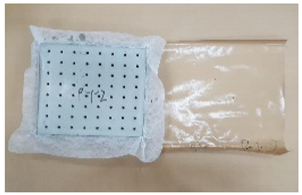
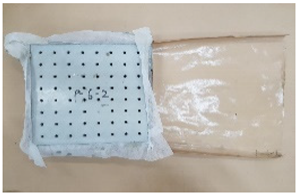
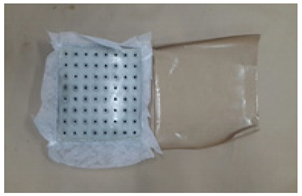
3.3.2. Oil Leakage Stability Test
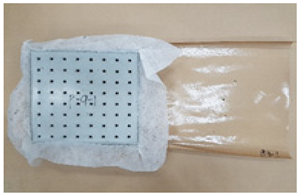
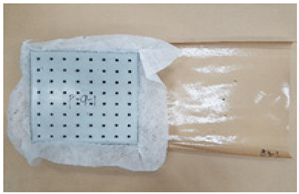
The oil leakage stability test was carried out in accordance with the test method suggested in previous research conducted by Kim [
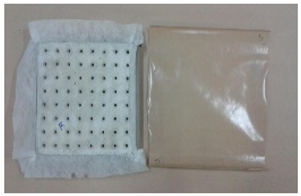
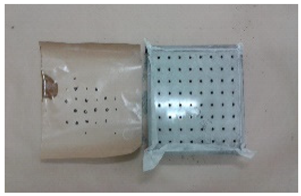
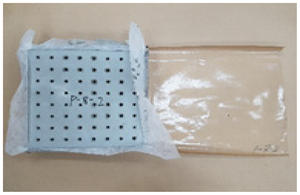
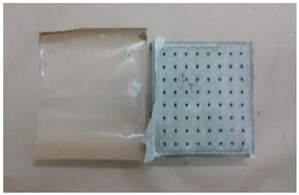
5]. The specimen fabrication and test methods are summarized in
Table 5. The temperature conditions were set to 20 °C and 40 °C for the test [
8], given that when the outside temperature is 30 °C, the internal temperature of the soil is maintained at 20 °C from 0.5 below the soil depth [
9], and the summer temperature due to heatwave reaches up to 40 °C. In addition, the test was conducted under a temperature condition at 20 °C, and then the specimen with oil leakage was excluded from the evaluation of 40 °C conditions. This is because BEM is an asphalt-based material, and its characteristic is that the viscosity decreases significantly with increasing temperature, which accelerates material segregation.
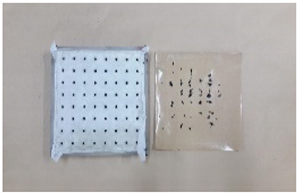
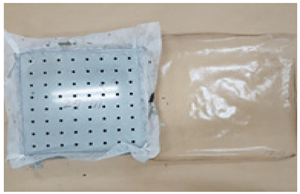
3.3.3. Oil Leakage Amount Measurement Method
Prior to the test, the initial weight (FA) of the film installed to contain oil leakage in the lower part of the specimen is measured, and the weight (FB) of the film containing oil leakage is then measured if oil leakage occurs after the completion of the test. The amount of oil leakage (A) is obtained by subtracting the initial weight of the film (FA) from the film weight after the test (FB).
where:
FA: initial film weight;
FB: film weight after oil leakage stability test;
A: amount of oil leakage.
4. Experimental Results and Analysis
4.1. Viscosity Measurement Results
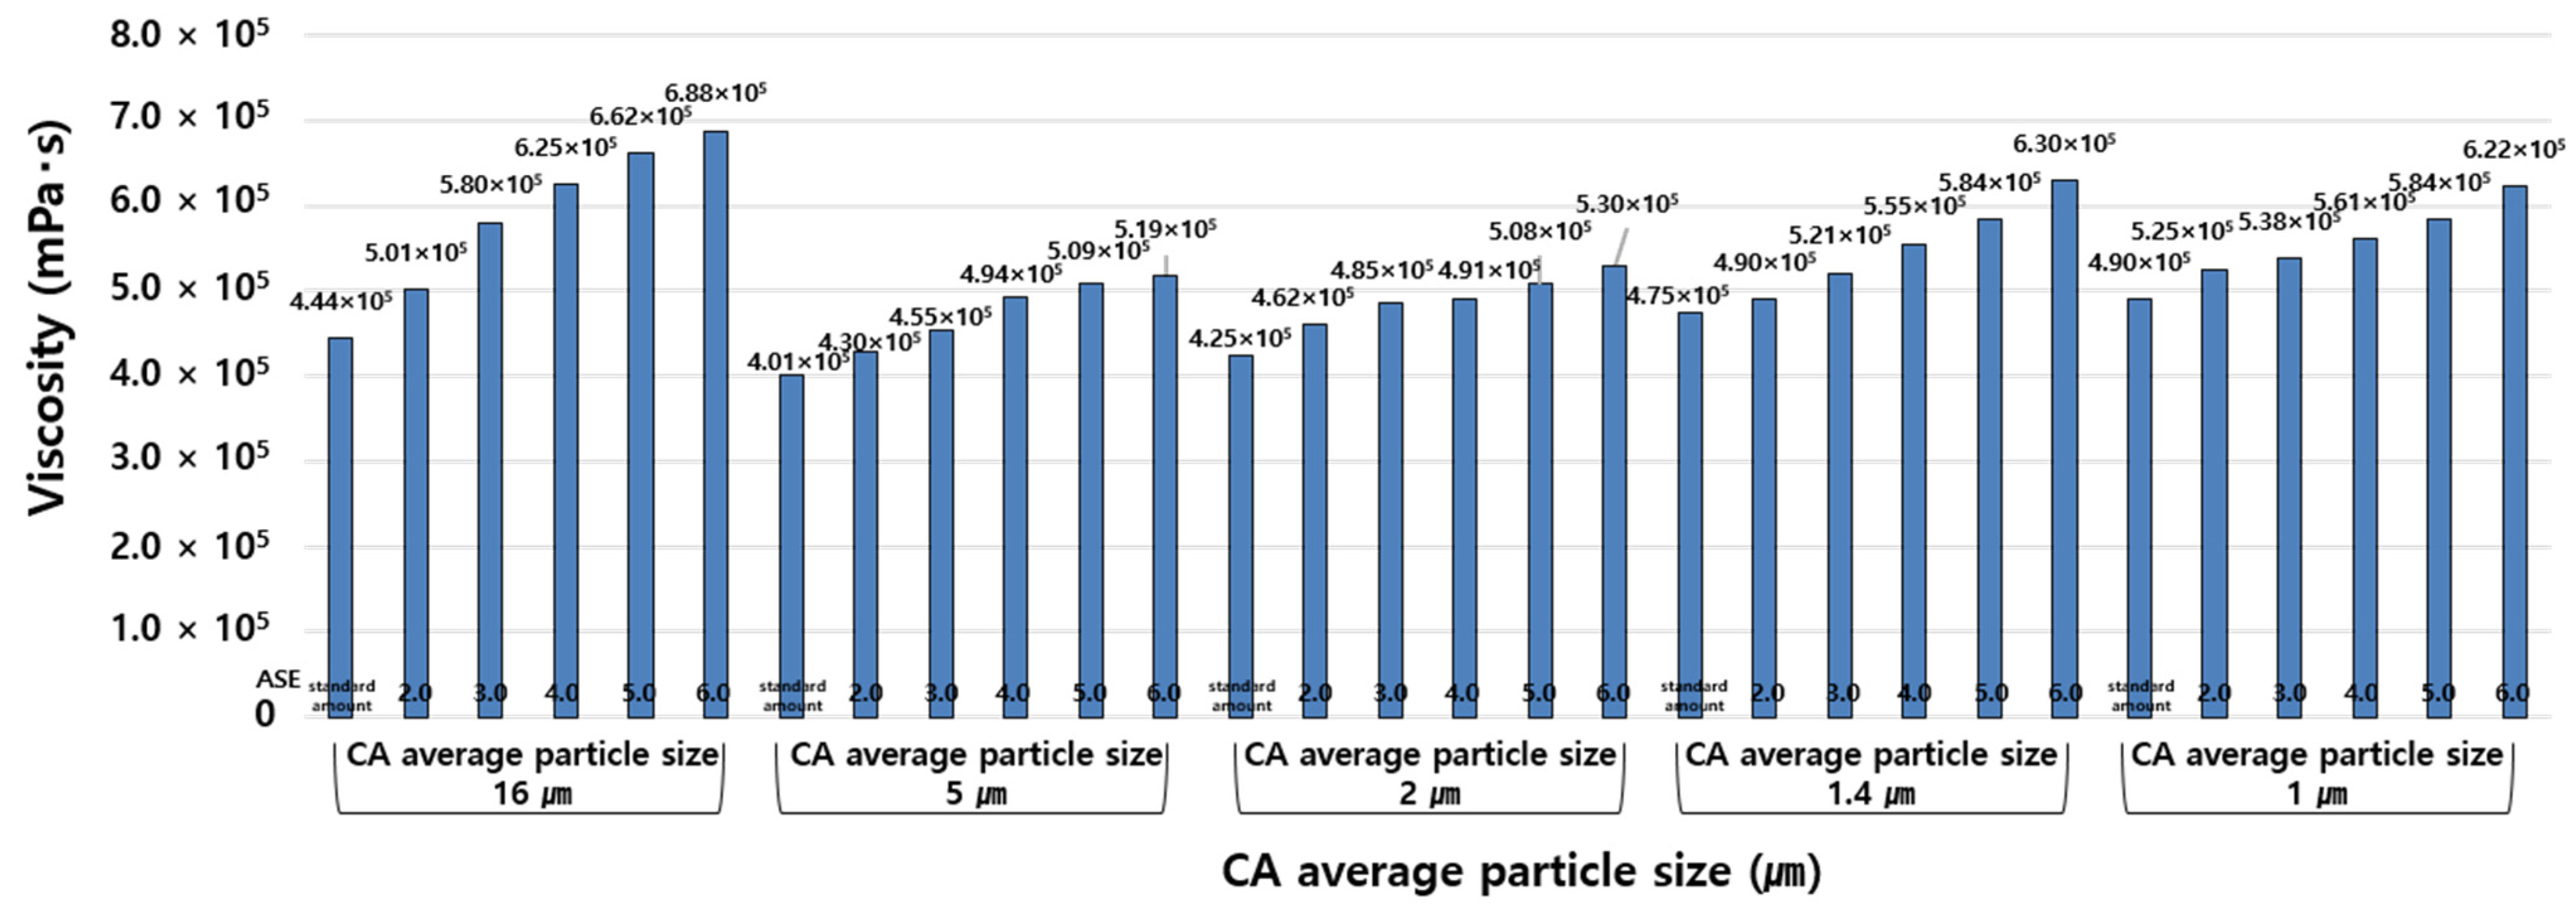
Table 6 and
Figure 8 shows the viscosity measurement results according to the ASE content for each CA average particle size.
The viscosity measurement results confirmed that regardless of the CA average particle size, the viscosity of BWM increases as the ASE content increases. This suggests that an increase in the ASE content prevents precipitation and segregation in raw material components and suppresses flow-ability, thus resulting in increased viscosity. In addition, it was confirmed that the CA average particle size of 16.0 μm has the highest viscosity, and the specimen applied with the particle size ranging from 5.0 μm to 1.0 μm except for the CA average particle size of 16.0 μm exhibits the characteristic that the viscosity increases as the CA average particle size decreases. This is because plasticizer absorption and friction increase when the surface area of contact between the CA and other raw materials increases as the CA average particle size decreases.
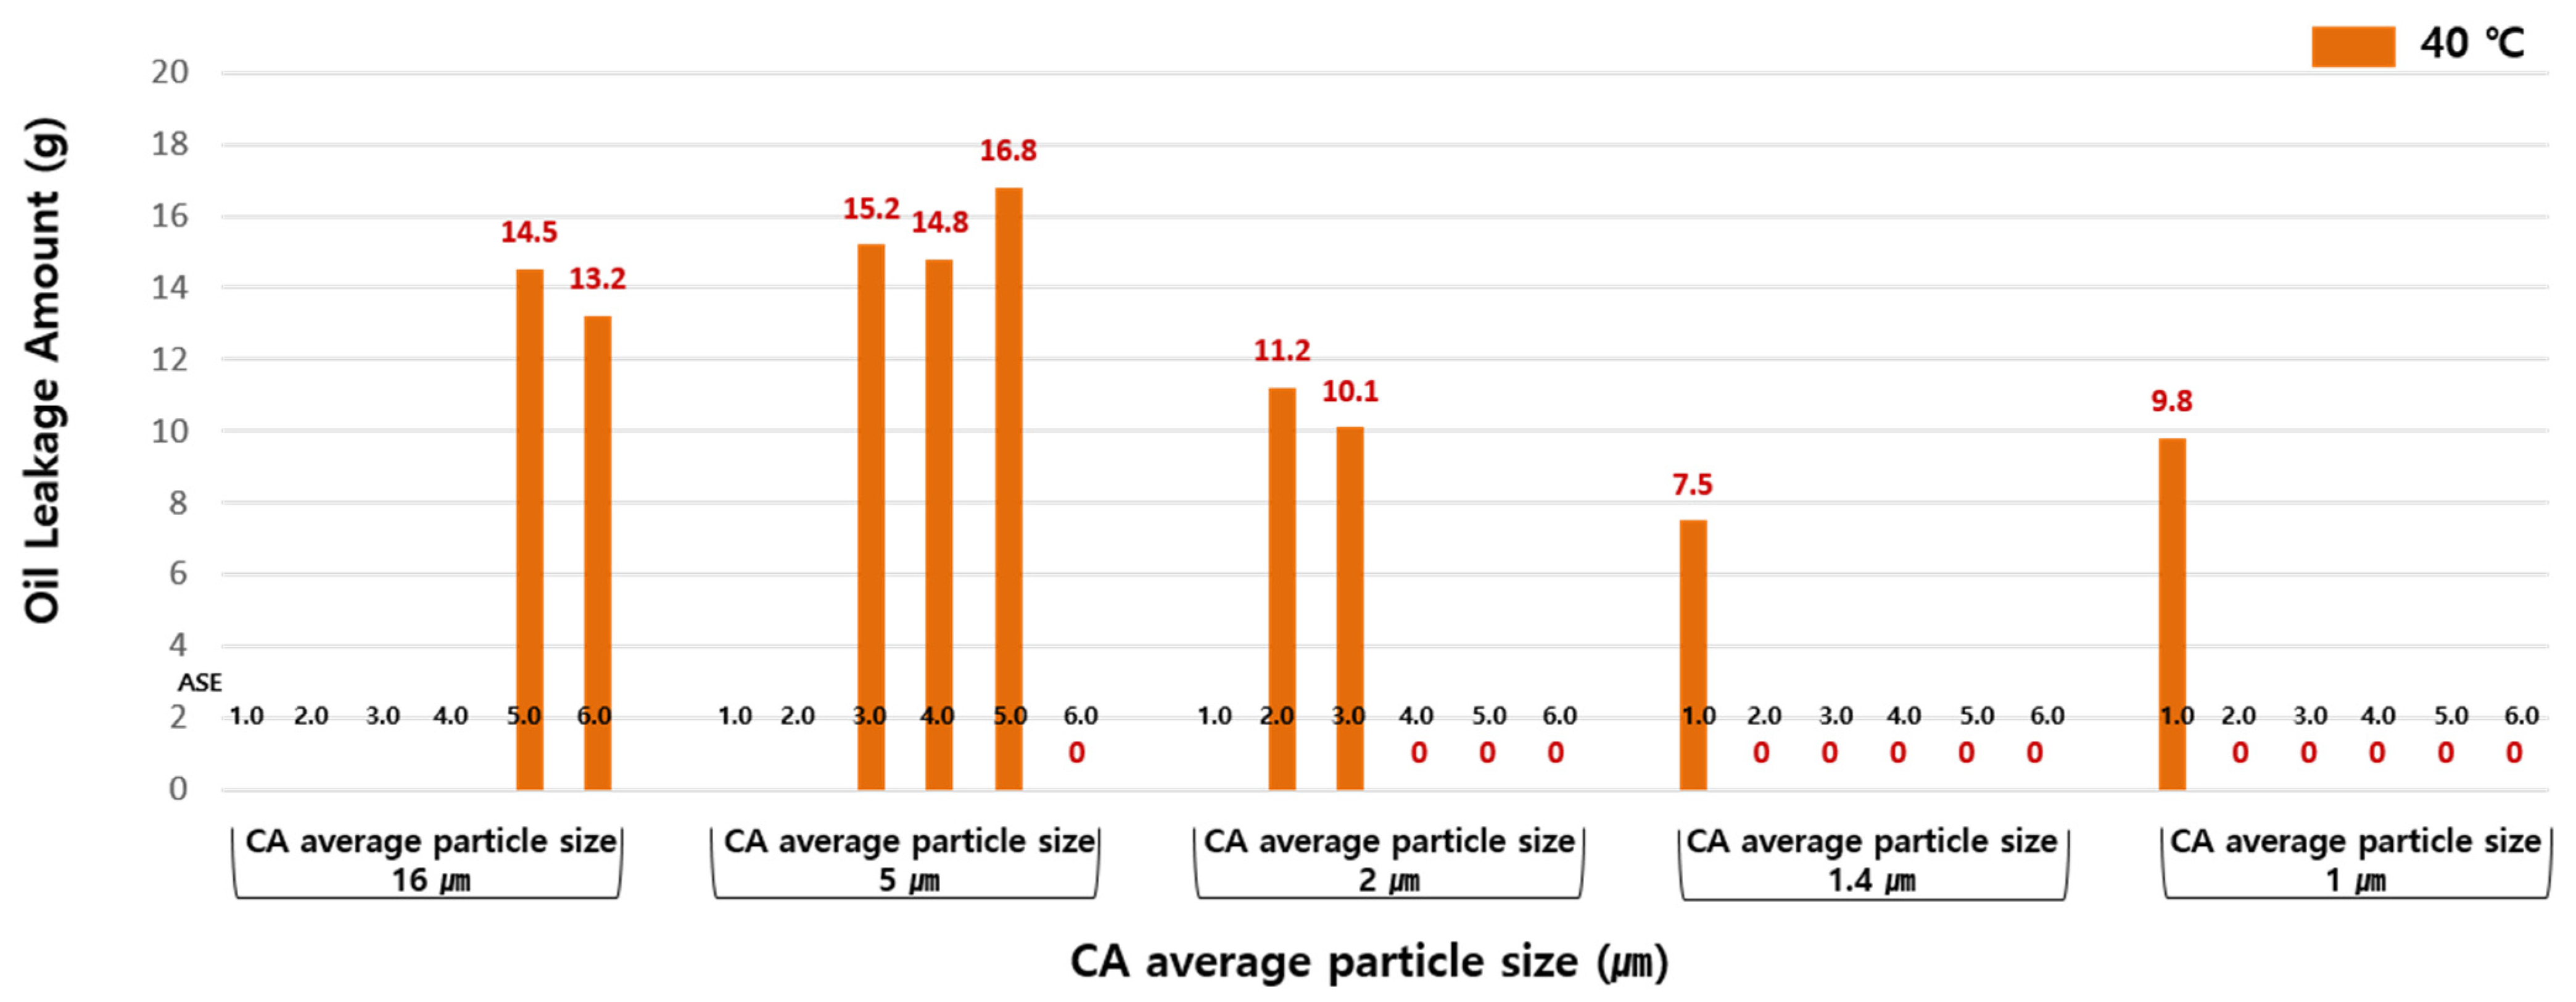
4.2. Oil Leakage Stability Test Results
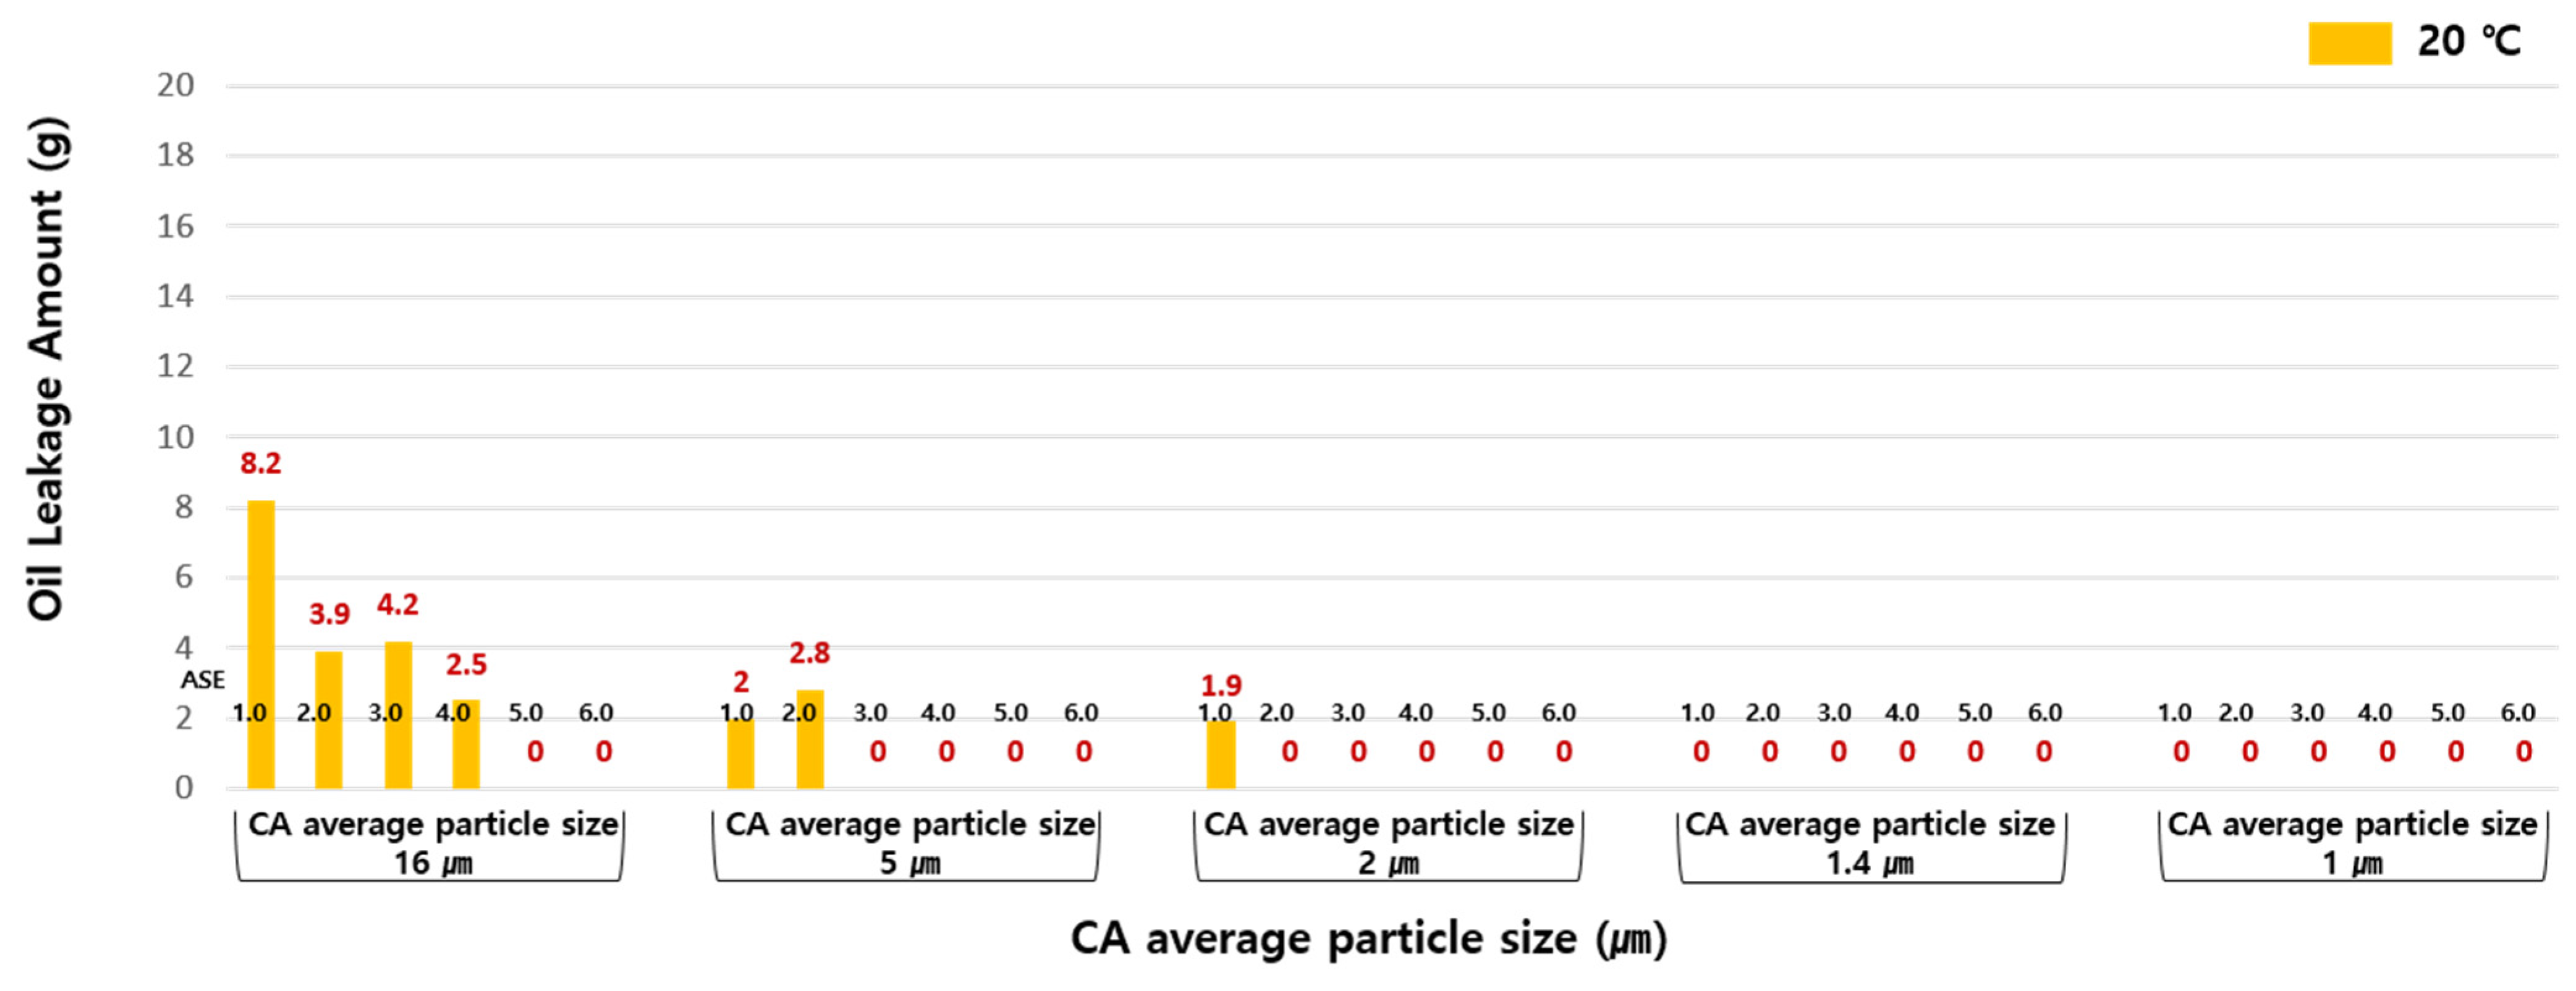
The oil leakage stability test results confirmed that relatively little oil leakage occurred in the samples with smaller particle sizes of 1.4 μm and 1.0 μm compared to the CA average particle sizes of 16.0 μm, 5.0 μm and 2.0 μm, and the amount of oil leakage was also relatively small. This result suggests that the specimen with a small CA average particle size is more advantageous in achieving oil leakage stability. In addition, it was confirmed that in the samples with particle sizes of 2.0 μm, and 1.4 μm and 1.0 μm, oil leakage stability was further improved as the ASE content increased. This is the same result as in the viscosity measurement result, which indicates that the effects of precipitation and segregation prevention of inorganic raw materials in BEM is improved as the ASE content increases. However, given that the effect of oil leakage stability according to an increase in the ASE content arises only from the CA average particle size of 2.0 μm or less, there is a need to increase the ASE content and reduce the CA average particle size at the same time in order to ensure the oil leakage stability of BEM.
4.3. Analysis of Experimental Results
4.3.1. Analysis of Correlation between ASE Content and Oil Leakage Stability by CA Average Particle Size of BEM
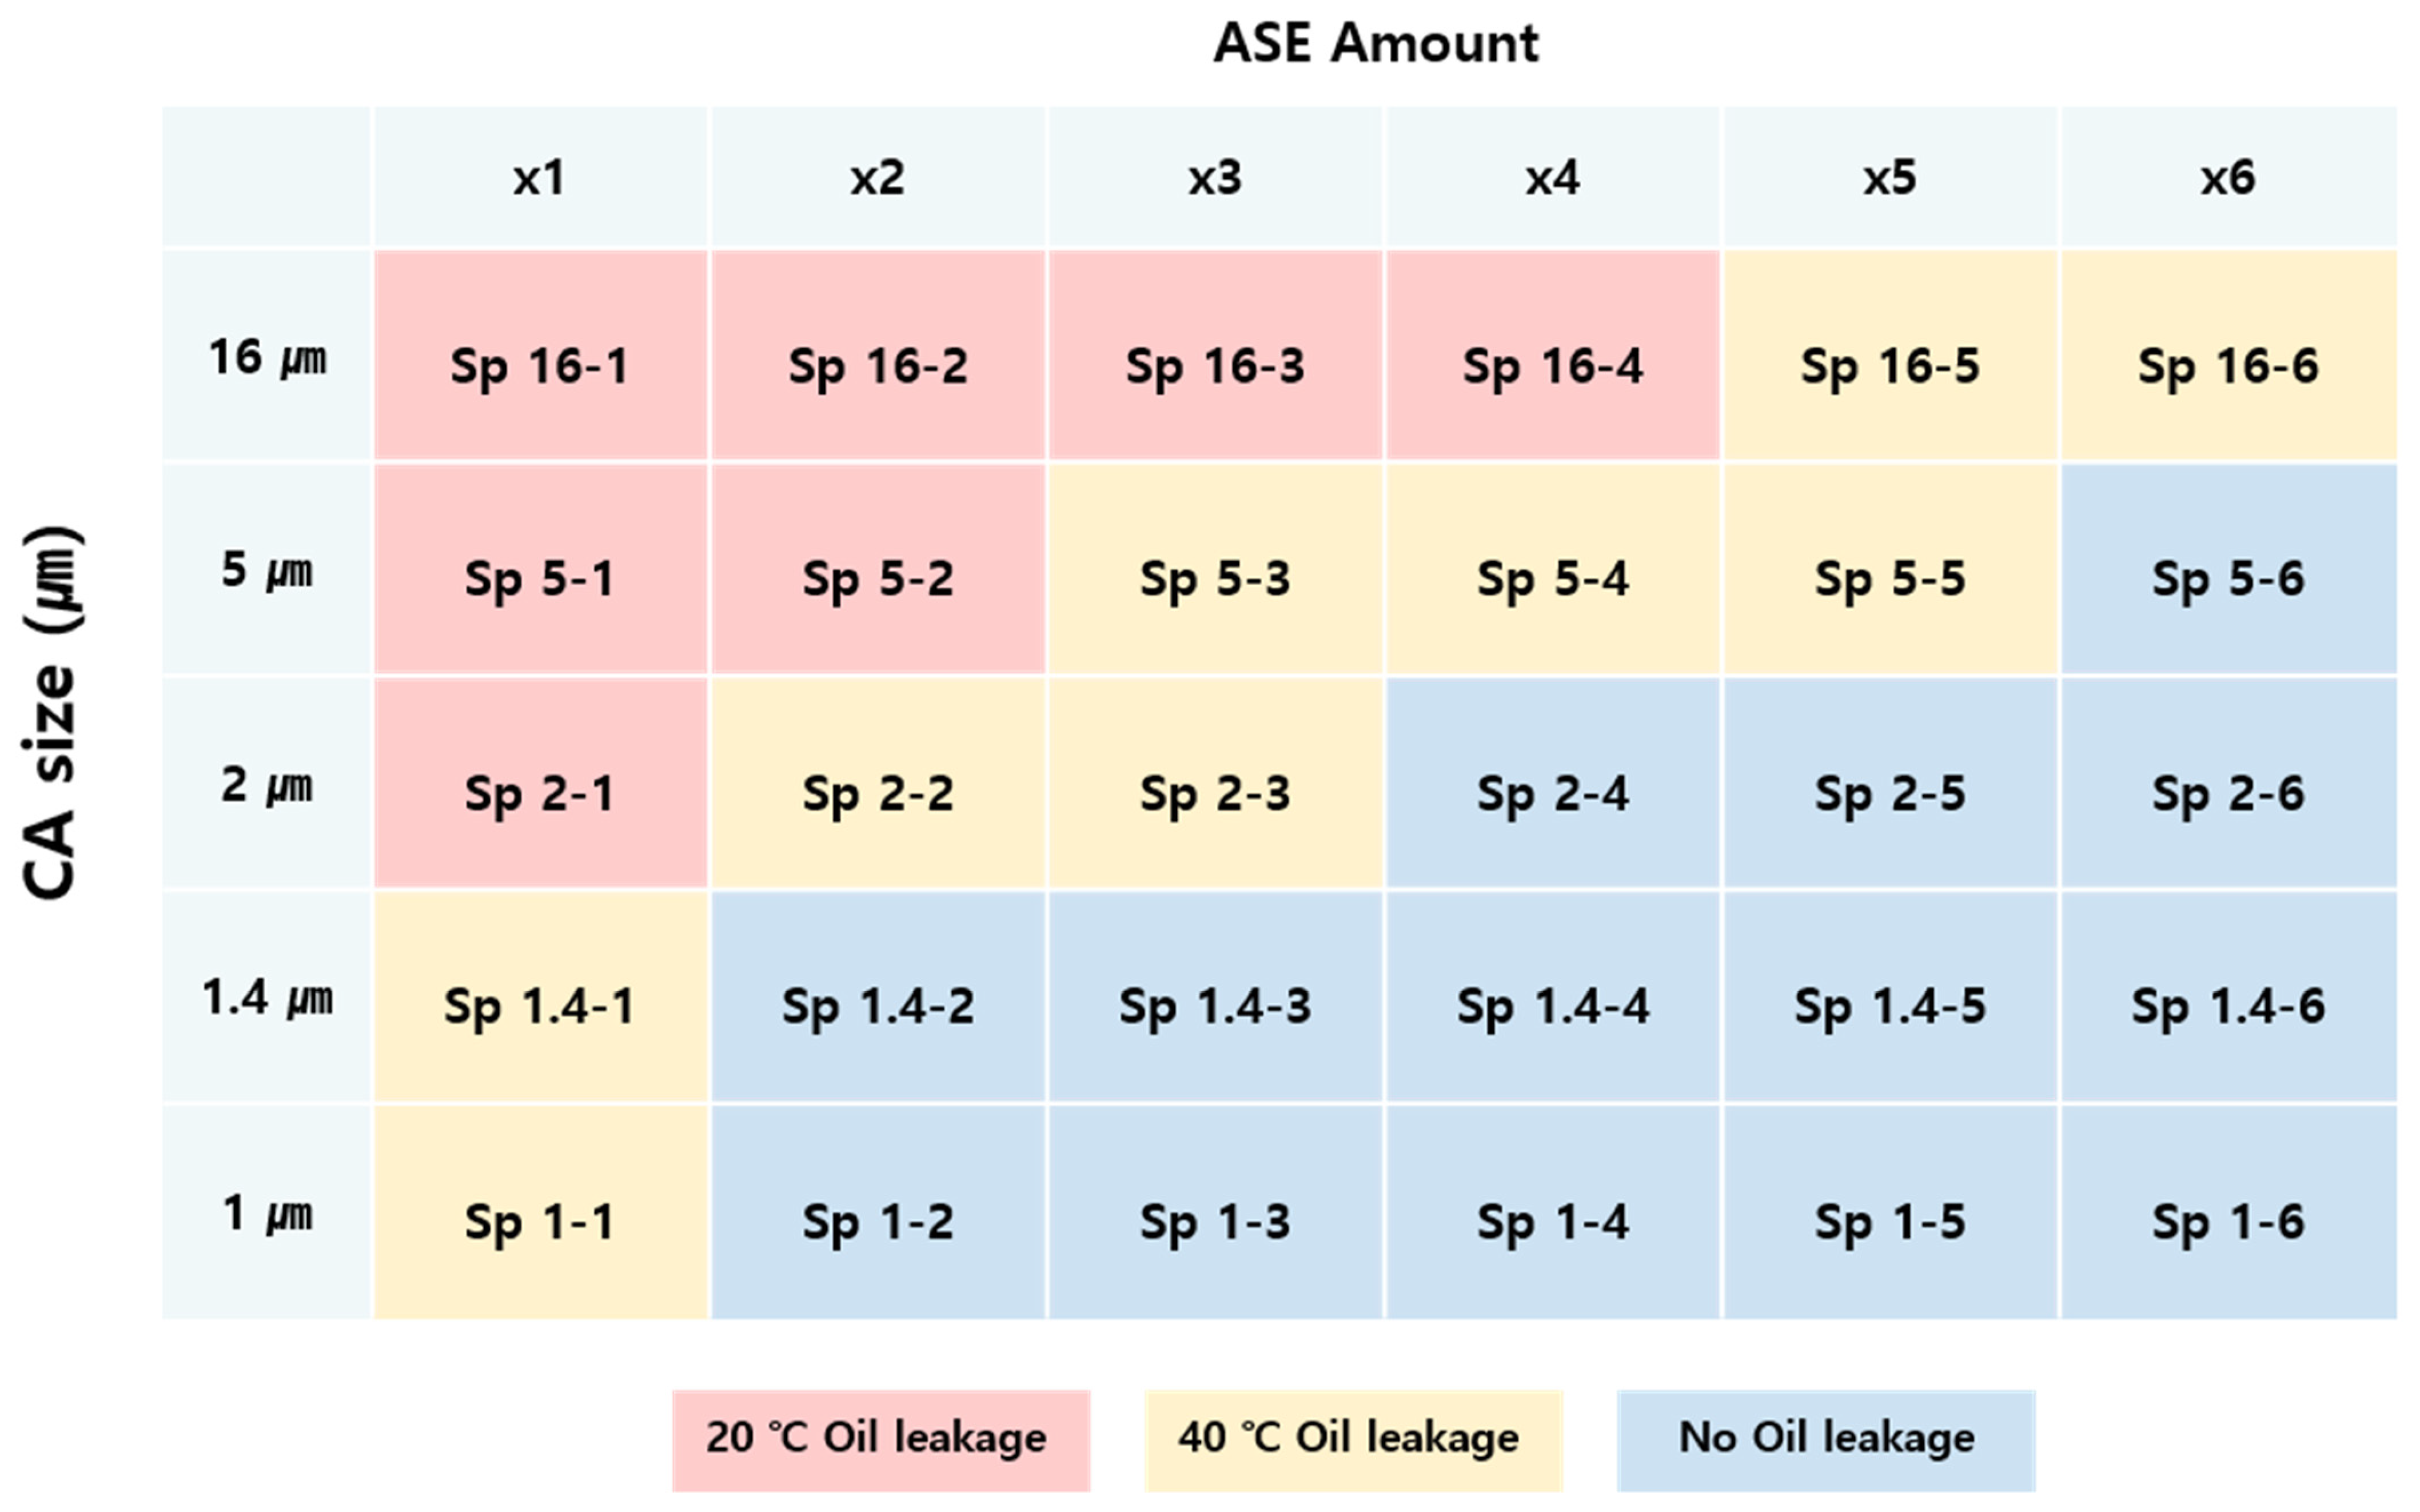
The analysis of correlation between ASE content and oil leakage stability by CA average particle size of BEM found that in relation to oil leakage stability at 40 °C, oil leakage occurred in some of the samples confirmed to have achieved oil leakage stability at 20 °C, and oil leakage stability was improved as the CA average particle size decreased, or the ASE content increased as in the temperature of 20 °C. It was also found that in a temperature environment at 20 °C, the CA average particle sizes of 1.0 μm and 1.4 μm have oil leakage stability regardless of an increase in the ASE content, but in a temperature environment at 40 °C, the stability of oil leakage was achieved only when the ASE content was added at least twice the standard. In addition, it was confirmed that in the CA average particle sizes of 2.0 μm and 5.0 μm, more than 4 times the ASE content should be added to ensure oil leakage stability. In the CA average particle size of 16.0 μm, oil leakage stability was achieved when more than 5 times the ASE content was incorporated at a temperature of 20 °C. However, at a temperature of 40 °C, oil leakage decreased in all specimens. To help understand these results more intuitively,
Figure 11 shows the correlation between ASE content and oil leakage stability by CA average particle size of BEM. In
Figure 11, red indicates that oil leakage occurs at 20 °C, while yellow indicates that oil leakage does not occur at 20 °C, but oil leakage occurs at 40 °C. Blue indicates that oil leakage stability is achieved because no oil leakage occurs at both 20 °C and 40 °C. The analysis of color distribution found that the oil leakage stability is significantly improved as the CA average particle size decreases, and the ASE content increases.
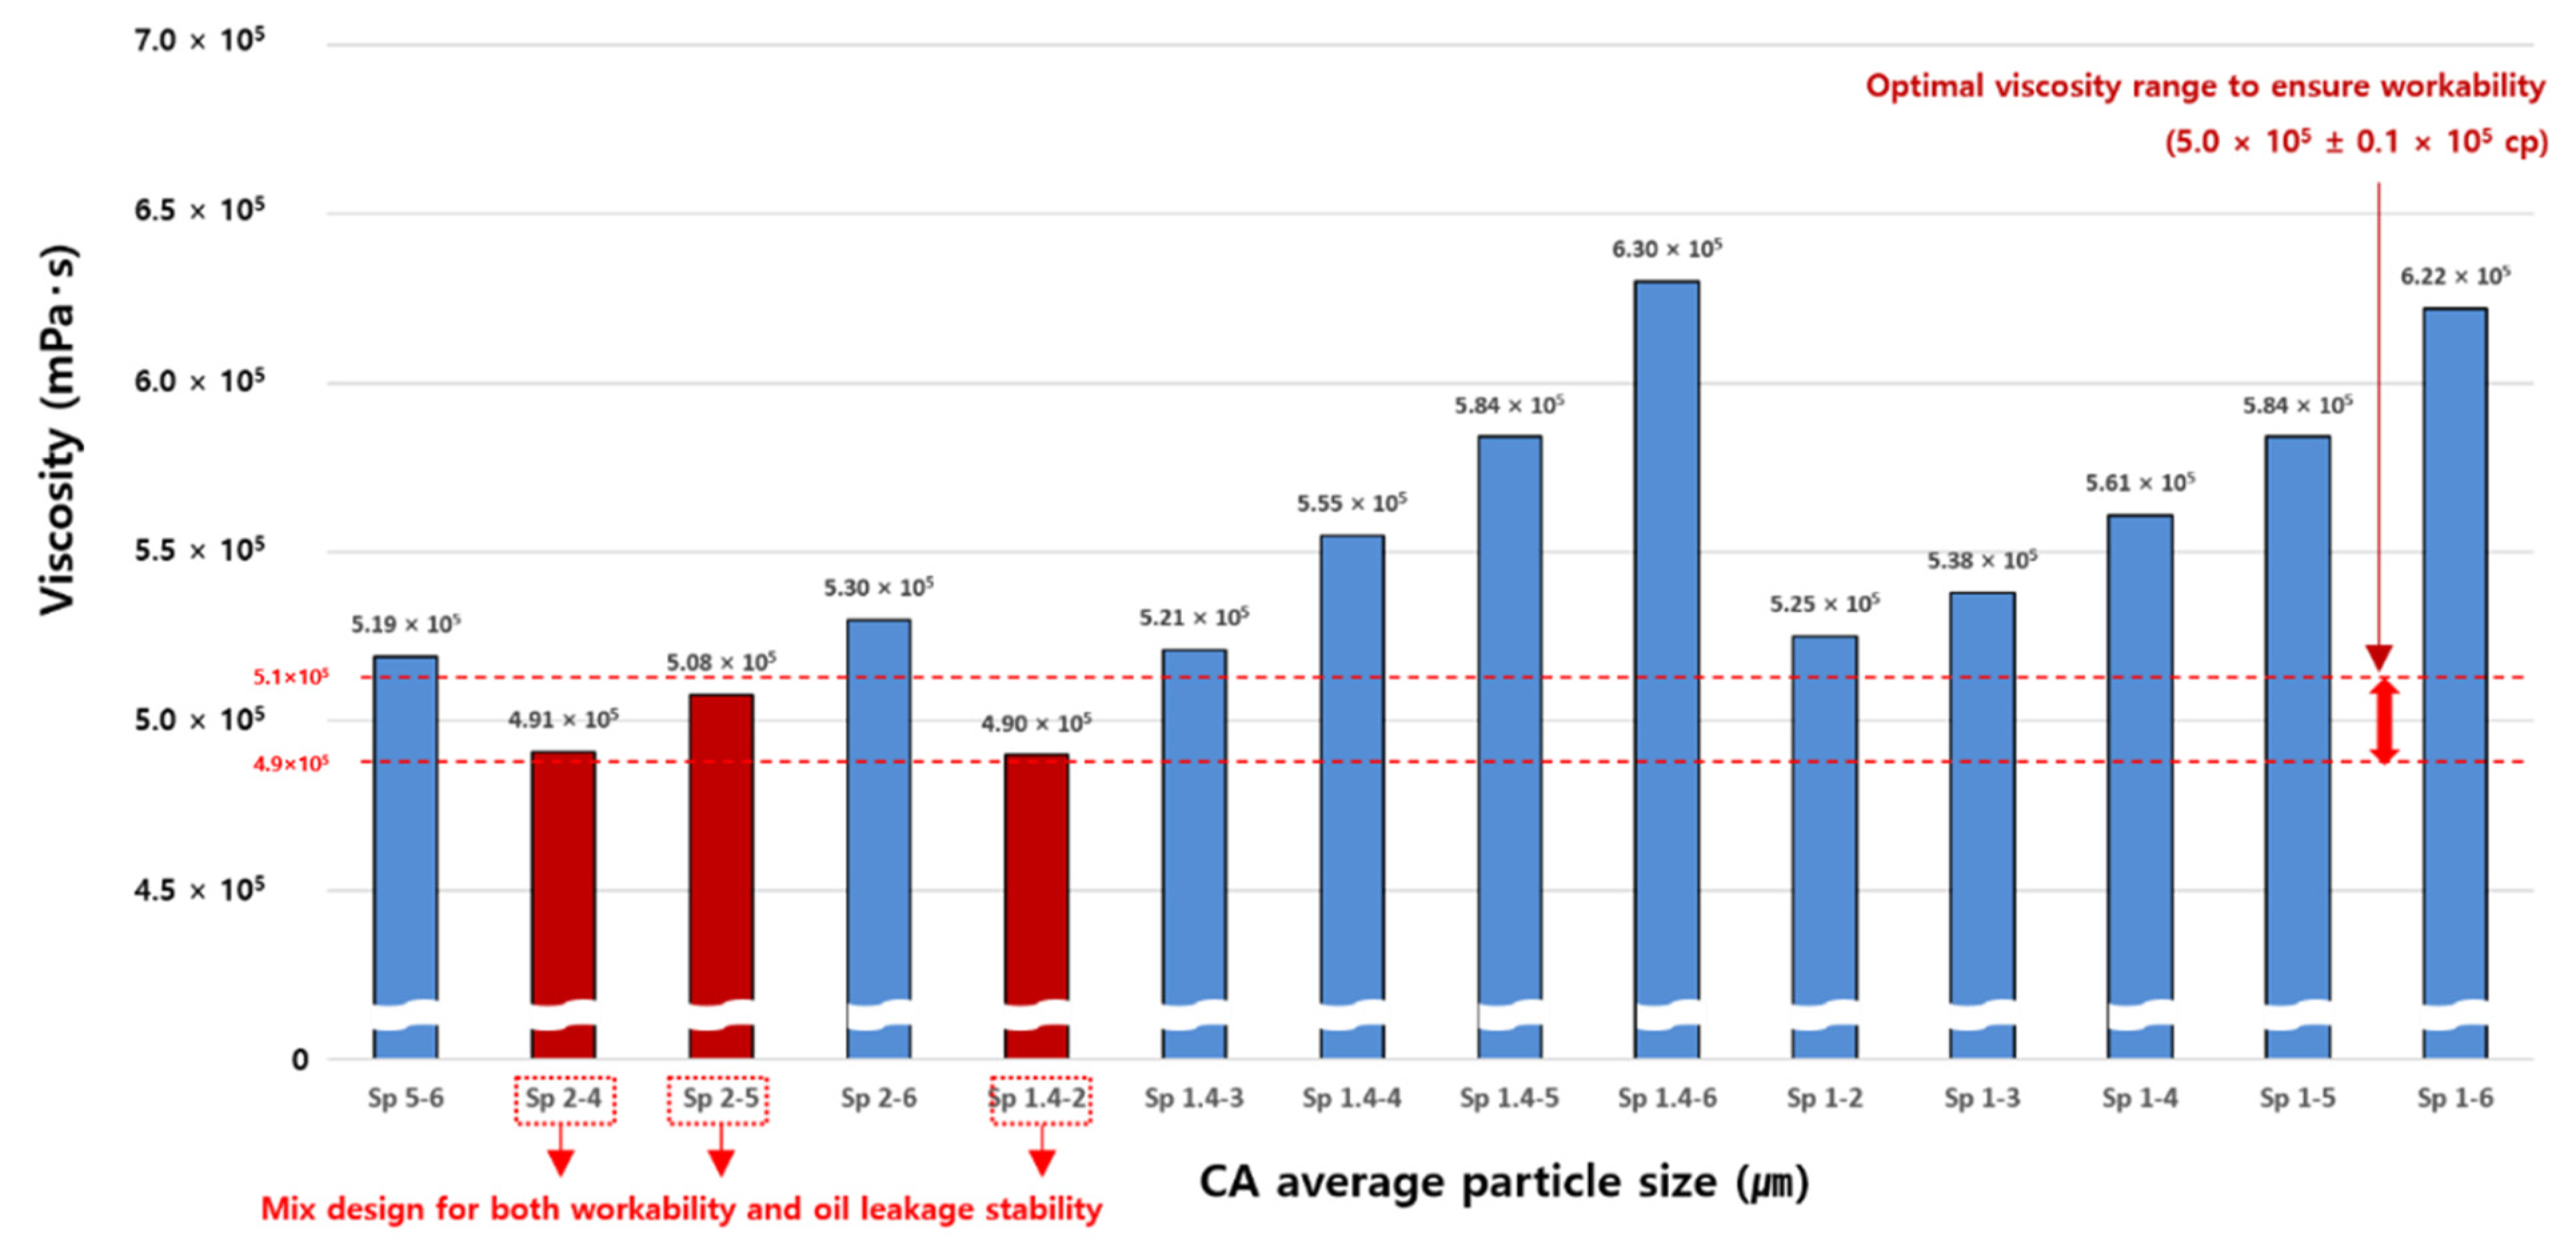
4.3.2. Suggestion of Optimal Mix Design Method Considering Workability and Oil Leakage Stability
In order to achieve the practical material improvement of BEM, not only oil leakage stability but also workability should be considered together with proper viscosity. Accordingly, the BEM applied to the actual sites is produced to have a proper viscosity range of about 5 × 10
5 mPa·s. Therefore, the viscosity measurement was conducted on a total of 14 samples that achieved oil leakage stability under 20 °C and 40 °C conditions in the oil leakage stability test, and the measurement results were reanalyzed as shown in
Figure 12.
The possibility of ensuring workability was analyzed by setting the proper viscosity standard to 5.0 × 10
5 mPa·s, a typical BEM production viscosity, and a total of three specimens (Sp 2-4, Sp 2-5, Sp 1.4-2) were found to ensure both workability and oil leakage stability. The analysis results are summarized in
Table 9.
5. Conclusions
This study aimed to find a solution to the oil leakage problem arising from BEM in terms of material. To this end, the CA average particle size and the ASE content, components closely related to material segregation, the cause of oil leakage in BEM, were adjusted. The correlation with oil leakage stability was then analyzed based on objective evaluations. The conclusions drawn from this study are as follows.
The viscosity and oil leakage stability tests were performed by adjusting the ASE content for each CA average particle size, and the results confirmed that regardless of the CA average particle size, the viscosity increases as the ASE content increases, and the specimen applied with the CA average particle sizes of 2.0 μm, 1.4 μm and 1.0 μm is more advantageous in achieving oil leakage stability, as compared to that with the CA average particle sizes of 16.0 μm and 5.0 μm. Based on the results, it can be confirmed that the oil leakage stability of BEM is improved when the CA average particle size decreases, and the ASE content increases.
In addition, the viscosity was analyzed to evaluate the workability of 14 samples derived from the oil leakage stability evaluation, and the analysis found that the optimal mix design ranges that can meet both workability and oil leakage stability conditions were the CA average particle size 2.0 μm, 4 to 5 times the ASE content, and the CA average particle size 1.4 μm, twice the ASE content.
This study is expected to be utilized as basic data for material composition design in the development of BEM that solves the oil leakage problem. In addition, it is judged that this will facilitate the development and research of BEM. However, this study has limitations in that a comprehensive correlation with other constituent materials was not provided as the scope of experiment was limited to the ASE content and CA particle size. For future research, additional correlation analysis is needed to find a complete solution to the oil leakage problem in BEM.
Author Contributions
S.-K.O., J.-S.P. and S.-Y.C. conceived and designed the experiments; S.-Y.C. and D.-B.K. performed the experiments; S.-Y.C. and W.-G.P. analyzed the data; and S.-Y.C. and D.-B.K. wrote the paper. All authors have read and agreed to the published version of the manuscript.
Funding
This research was carried out by the research fund support (21CTAP-C151778-03) of the Ministry of the Land, Infrastructure, and Transport’s Ministry of the Land, Infrastructure, and Transport Technology Promotion Research Project.
Institutional Review Board Statement
Not applicable.
Informed Consent Statement
Not applicable.
Data Availability Statement
The data presented in this study are available in this article.
Conflicts of Interest
The authors declare no conflict of interest. The founding sponsors had no role in the design of the study, in the collection, analyses, or interpretation of data, in the writing of the manuscript, or in the decision to publish the results.
Abbreviations
| BEM | Bituminous Emulsion Mastic |
| ASE | Anti-sedimentation |
| CA | CaCO3 |
| KS | Korean Industrial Standards |
Appendix A
Table A1.
Oil leakage stability evaluation results.
References
- Jang, S.J. Advanced Technology of Waterproofing. J. Archit. Inst. Korea 2005, 49, 57–60. [Google Scholar]
- Jo, G.S.; Park, W.Y. The rooftop waterproof of public facilities and the study of improvement way–urethane rubber film waterproof. J. Korea Inst. Build. Constr. 2012, 12, 86–87. [Google Scholar]
- Park, J.S. Field Evaluation of Synthetic Polymer Rubber Gel through Filler Content and Oil Leakage Mass Measurement. Appl. Sci. 2018, 8, 896. [Google Scholar] [CrossRef] [Green Version]
- Park, J.S.; Kim, D.B.; Park, W.G.; Oh, S.K. Analysis on the Causes of the Oil Leakage Phenomenon for Complex Waterproofing Methods of Asphalt Mastic and Modified Asphalt Sheet. J. Korea Inst. Build. Constr. 2018, 18, 337–345. [Google Scholar]
- Kim, D.B. Oil Leakage Evaluation for Selection of Emulsion-Based Non-Curable Synthetic Polymer Rubberized Gel (ENC-SPRG) as Waterproofing Material in Underground Structures. Materials 2019, 12, 3816. [Google Scholar] [CrossRef] [PubMed] [Green Version]
- Park, J.S. A Study of the Quality of Improvement of Asphalt Mastic through the Analysis of the Causes of the Oil Leakage Phenomenon and Development of the Test Method. Ph.D. Thesis, Seoul National University of Science & Technology, Seoul, Korea, 2019. [Google Scholar]
- KS M ISO 2555, Plastics-Resins in the Liquid State or as Emulsions or Dispersions-Determination of Apparent Viscosity by the Brookfield Test Method, Korean Standard. Available online: http://www.standard.go.kr (accessed on 1 December 2017).
- Park, J.S.; Kim, D.B.; Park, W.G. Development of Oil Leakage Stability Evaluation for Composite Aterproofing Methods using Asphalt Mastic and Modified Asphalt Sheet in Concrete. J. Korea Inst. Build. Constr. 2019, 19, 19–30. [Google Scholar]
- Kim, H.L.; Jang, S.D. Condensation of Architecture: Cause and Effect; GOLD: Seoul, Korea, 2008; p. 303. [Google Scholar]
Figure 1.
Oil leakage phenomenon and contamination status in underground parking lots: (a) oil leakage from slab in underground parking lot; (b) oil leakage from slab in underground parking lot.
Figure 1.
Oil leakage phenomenon and contamination status in underground parking lots: (a) oil leakage from slab in underground parking lot; (b) oil leakage from slab in underground parking lot.
Figure 2.
Oil leakage mechanism of asphalt mastic.
Figure 2.
Oil leakage mechanism of asphalt mastic.
Figure 3.
Installation method and status using BEM: (a) composite using BEM waterproofing system composition diagram; (b) BEM installation status.
Figure 3.
Installation method and status using BEM: (a) composite using BEM waterproofing system composition diagram; (b) BEM installation status.
Figure 4.
CA and ASE used in this study: (a) CaCO3 (CA); (b) anti-sedimentation (ASE).
Figure 4.
CA and ASE used in this study: (a) CaCO3 (CA); (b) anti-sedimentation (ASE).
Figure 5.
Research flow chart.
Figure 5.
Research flow chart.
Figure 6.
BEM sample fabrication process: (a) BEM mix status; (b) mix complete BEM.
Figure 6.
BEM sample fabrication process: (a) BEM mix status; (b) mix complete BEM.
Figure 7.
Viscosity measurement device and status: (a) viscosity measurement device; (b) viscosity measurement status.
Figure 7.
Viscosity measurement device and status: (a) viscosity measurement device; (b) viscosity measurement status.
Figure 8.
Graph of viscosity measurement results.
Figure 8.
Graph of viscosity measurement results.
Figure 9.
Graph of oil leakage stability test results (20 °C).
Figure 9.
Graph of oil leakage stability test results (20 °C).
Figure 10.
Graph of oil leakage stability test results (40 °C).
Figure 10.
Graph of oil leakage stability test results (40 °C).
Figure 11.
Comparison of oil leakage stability characteristics under temperature conditions according to ASE content by CA average particle size.
Figure 11.
Comparison of oil leakage stability characteristics under temperature conditions according to ASE content by CA average particle size.
Figure 12.
Results of workability analysis on samples with oil leakage stability.
Figure 12.
Results of workability analysis on samples with oil leakage stability.
Table 1.
General Properties of BEM.
Table 1.
General Properties of BEM.
| Samples | Specific Gravity (g/mL) | Viscosity (mPa·s)
(20 °C, Sp.6) | Composition (%) |
|---|
| Solids | Non-Solid |
|---|
Filler
Content | Binders | Others |
|---|
| Properties | About 1.04~1.2 | 3 × 10⁵~5 × 10⁵ | 22~29 | 47~61 | 10~25 |
Table 2.
Material composition of asphalt mastic.
Table 2.
Material composition of asphalt mastic.
| Division | Raw Materials | Ingredient | Composition (%) | Functions | Manufacturer | Symbols |
|---|
| 1 | Straight Asphalt | Non-Solid | 10~15 | Main ingredient of asphalt mastic waterproofing membrane coating | DongNam Petrochemical (Seoul, Korea) | AP |
| 2 | Blown Asphalt | Non-Solid | 30~40 | Main ingredient of asphalt mastic waterproofing membrane coating | DongNam Petrochemical (Seoul, Korea) | BA |
| 3 | Process Oil | Non-Solid | 0~5 | Plasticizer | Samsung oil (Seoul, Korea) | PO |
| 4 | Butyl Rubber | Non-Solid | 5~10 | Tackifier | 1675 N (Brookfield, WI, USA) | BR |
| 5 | Pulp | Non-Solid | 1~2 | Fiber filler (viscosity control) | - | PP |
| 6 | Anti-sedimentation | Solids | 2~4 | Sedimentation preventive agents (Coupling agent) | Zhejiang Camp-Shinning New Material Co., Ltd. (Hangzhou, China) | ASE |
| 7 | Talc | Solids | 0~30 | Anti-Slide | Ilshin Chemical Co., Ltd. (Goryeong, Korea) | AS |
| 8 | Conditioning Agent | Solids | 0.5~1.5 | Conditioning Agent | - | V |
| 9 | CaCO3 | Solids | 0~30 | Filler | Seongshin Minefield Co., Ltd. (Seoul, Korea) | CA |
| 10 | Wollastonite | Solids | 0~30 | Filler | Dalian Gaoteng International Co., Ltd. (Dalian, China) | WS |
| 11 | Sepiolite | Solids | 0~30 | Filler | LI DOU (Neixiang, China) | SS |
| 12 | Solvent | Non-Solid | 15~25 | Solvent, improvement flowability | DongNam Petrochemical (Seoul, Korea) | SV |
Table 3.
Mix design according to ASE content and CA particle size.
Table 3.
Mix design according to ASE content and CA particle size.
| Mix Desgin | ASE Content (1×) |
|---|
| Once | Twice | Three Times | Four Times | Five Times | Six Times |
|---|
CA average
particle size
(μm) | 16.0 | Sp 16-1 | Sp 16-2 | Sp 16-3 | Sp 16-4 | Sp 16-5 | Sp 16-6 |
| 5.0 | Sp 5-1 | Sp 5-2 | Sp 5-3 | Sp 5-4 | Sp 5-5 | Sp 5-6 |
| 2.0 | Sp 2-1 | Sp 2-2 | Sp 2-3 | Sp 2-4 | Sp 2-5 | Sp 2-6 |
| 1.4 | Sp 1.4-1 | Sp 1.4-2 | Sp 1.4-3 | Sp 1.4-4 | Sp 1.4-5 | Sp 1.4-6 |
| 1.0 | Sp 1-1 | Sp 1-2 | Sp 1-3 | Sp 1-4 | Sp 1-5 | Sp 1-6 |
Table 4.
Detail of fabrication process for mix BEM.
Table 4.
Detail of fabrication process for mix BEM.
| RPM | Temperature (°C) | End Time (min) | Total Volume (mL) |
|---|
| 400 | 180 | 120 | 1000 |
Table 5.
Oil leakage stability test specimen fabrication and test method.
Table 6.
Viscosity measurement results (mPa∙s).
Table 6.
Viscosity measurement results (mPa∙s).
| Division | ASE Content |
|---|
| Once | Twice | Three Times | Four Times | Five Times | Six Times |
|---|
CA average
particle size
(μm) | 16.0 | 4.44 × 10⁵ | 5.01 × 10⁵ | 5.80 × 10⁵ | 6.25 × 10⁵ | 6.62 × 10⁵ | 6.88 × 10⁵ |
| 5.0 | 4.01 × 10⁵ | 4.30 × 10⁵ | 4.55 × 10⁵ | 4.94 × 10⁵ | 5.09 × 10⁵ | 5.19 × 10⁵ |
| 2.0 | 4.25 × 10⁵ | 4.62 × 10⁵ | 4.85 × 10⁵ | 4.91 × 10⁵ | 5.08 × 10⁵ | 5.30 × 10⁵ |
| 1.4 | 4.75 × 10⁵ | 4.90 × 10⁵ | 5.21 × 10⁵ | 5.55 × 10⁵ | 5.84 × 10⁵ | 6.30 × 10⁵ |
| 1.0 | 4.90 × 10⁵ | 5.25 × 10⁵ | 5.38 × 10⁵ | 5.61 × 10⁵ | 5.84 × 10⁵ | 6.22 × 10⁵ |
Table 7.
The 20 °C oil leakage stability test results (g).
Table 7.
The 20 °C oil leakage stability test results (g).
| Division | ASE Content |
|---|
| Once | Twice | Three Times | Four Times | Five Times | Six Times |
|---|
CA average
particle size
(μm) | 16.0 | 8.2 | 3.9 | 4.2 | 2.5 | 0 | 0 |
| 5.0 | 2.0 | 2.8 | 0 | 0 | 0 | 0 |
| 2.0 | 1.9 | 0 | 0 | 0 | 0 | 0 |
| 1.4 | 0 | 0 | 0 | 0 | 0 | 0 |
| 1.0 | 0 | 0 | 0 | 0 | 0 | 0 |
Table 8.
The 40 °C oil leakage stability test results (g).
Table 8.
The 40 °C oil leakage stability test results (g).
| Division | ASE Content |
|---|
| Once | Twice | Three Times | Four Times | Five Times | Six Times |
|---|
CA average
particle size
(μm) | 16.0 | - | - | - | - | 14.5 | 13.2 |
| 5.0 | - | - | 15.2 | 14.8 | 16.8 | - |
| 2.0 | - | 11.2 | 10.1 | - | - | - |
| 1.4 | 7.5 | 0 | 0 | 0 | 0 | 0 |
| 1.0 | 9.8 | 0 | 0 | 0 | 0 | 0 |
Table 9.
Specimens that ensure both workability and oil leakage stability.
Table 9.
Specimens that ensure both workability and oil leakage stability.
| Division | Specimen No. | CA particle Size (μm) | ASE Content | Viscosity (mPa·s) |
|---|
| 1 | Sp 2-4 | 2.0 | Four times | 4.91 × 10⁵ |
| 2 | Sp 2-5 | 2.0 | Five times | 5.08 × 10⁵ |
| 3 | Sp 1.4-2 | 1.4 | Twice | 4.90 × 10⁵ |
| Publisher’s Note: MDPI stays neutral with regard to jurisdictional claims in published maps and institutional affiliations. |
© 2022 by the authors. Licensee MDPI, Basel, Switzerland. This article is an open access article distributed under the terms and conditions of the Creative Commons Attribution (CC BY) license (https://creativecommons.org/licenses/by/4.0/).


