Article

Theoretical Analysis of Rock Blasting Damage in Construction of Tunnels Closely Under-Passing Sewage Box Culverts

1
Department of Geotechnical Engineering, Tongji University, Shanghai 200092, China
2
China Railway 20th Bureau Group Co., Ltd., Xi’an 710016, China
*
Author to whom correspondence should be addressed.
Appl. Sci. 2022, 12(19), 9875; https://doi.org/10.3390/app12199875
Submission received: 14 July 2022 / Revised: 24 September 2022 / Accepted: 25 September 2022 / Published: 30 September 2022
(This article belongs to the Special Issue Tunneling and Underground Engineering: From Theories to Practices)

Abstract

:
With the large-scale construction of urban traffic tunnels in China, it has become common to underpass existing buildings and structures such as sewage box culverts and pipelines using the drilling-blasting method. How to analyze accurately the blasting damage of surrounding rock and reasonably determine the safe distance between tunnel and box culvert or pipelines is an urgent issue to be solved. In this paper, the Cowper-Symonds plastic kinetic hardening model was improved using both rock initial damage degree and damage modification coefficient considering rock residual strength. The proposed model was implemented into LS-DYNA. The proposed damage model was used to evaluate the blasting construction of rock tunnels closely under-passing sewage box culverts. The results of numerical simulation using the proposed damage model shows that the blasting damage range of rock with a damage degree of more than 0.5 very significantly reduces from 1.0 m to 0.3 m as the spacing between the box culvert and the tunnel increases from 1.0 m to 4.0 m, and the evolution process of rock blasting damage can be well-presented. Moreover, the safe distance between tunnel and box culvert in blasting construction can be reasonably determined to be no less than 4.0 m. The findings in this paper could be significant for guiding the blasting construction of rock tunnels closely under-passing sewage box culverts.

1. Introduction

Tunnels often are constructed using the drilling-blasting method in many eastern Chinese cities. The blasting construction of rock tunnels must inevitably underpass existing buildings and structures such as sewage box culverts and pipelines. When the tunnel constructed using the drilling-blasting method underpasses through the structure of box culverts, the impact caused by rock blasting will damage the box culvert structure adjacent to the tunnel [1]. Blasting damage in the construction of tunnels is usually regulated in infrastructure contracts because it can influence the lifecycle cost and quality for tunneling projects [2]. The most critical issue is how to reasonably determine the safe distance between tunnel and existing box culvert in tunnel blasting construction. The control of explosion-induced crushed and cracked zones is of the utmost importance in the rock explosion design [3].
In numerical simulations of tunnel excavation, rock damage-plasticity models are often used to study the influence of both effects on the evolution of deformation and stress distribution in rock masses [4,5]. The research on the constitutive models of rock blasting damage is a developing process. The blasting damage model of rock (the GK model) [6] was used to simulate the process of rock blasting. The GK model was improved upon using the definition of crack density distribution with the effect of loading time and damage variables with the fracture probability [7,8]. Using the damage mechanics theory of rock can better simulate the formation and development process from microscopic cracks to macroscopic cracks of rock with native defects [9,10]. The rock tension-compression damage model [11] and tension-compression-shear damage model [12] were developed. The damage process of the surrounding rock under multiple full-face blasts is simulated using rock blast-induced damage model integrating the tensile damage model with the Drucker-Prager yield condition [13]. The rock blasting damage constitutive model coupling the tension-compression weighted damage variable and the classical PLASTIC_ KINEMATIC model was used to investigate the rock damage evolution law in slotting-blasting construction [14].
With the development of computer technology, numerical simulation technology has become one of effective methods to investigate the damage evolution of rock in the process of blasting excavation construction [15,16,17,18,19,20]. Surrounding rock damage is controlled by accurately describing rock characteristics such as Young’s modulus and Poisson’s ratio in tunnel blasting construction [17], and by optimizing charge structures and the number of blast-hole rows [18]. The damage degree of the blasting crushing zone was determined using rock fracture theory [19]. The Johnson-Holmquist-Rock (JHR) damage model is proposed to simulate the failure process of rock under blasting load [20]. Elastoplastic cellular automaton was employed to simulate blasting-induced elastoplastic dynamic responses [21].
Rock explosion is a complex problem because neither the rock characteristics nor the explosion waves could be accurately estimated. A first-order reliability analysis can predict rock blasting damage [22].
Through the use of ANSYS/LS-DYNA to establish a three-dimensional finite element model for slope and tunnel, the minimum safe distance from tunnel face to slope surface was determined according to the first strength theory and a linear statistical relationship between peak particle velocity and rock effective tensile stress [23]. Using the 3D numerical model established by LS-DYNA, the safety vibration velocity threshold of each vulnerable area was calculated based on the maximum tensile stress criterion during the whole process of tunnel blasting excavation [24]. The displacement of surrounding rock in tunnel construction can be predicted or estimated using the artificial neural network [25,26], numerical analysis, fuzzy logic, and statistical analysis models [26], and the gene expression programming [27]. Moreover, the plastic zone surrounding rock in tunnel excavation can be determined using numerical analysis, the fuzzy inference system, and the multivariate regression model [28].
At present, the minimum safe distance between sewage box culverts in operation and the tunnel constructed using the drilling-blasting method is usually determined by the peak blasting vibration velocity. However, in actual blasting construction, it is often difficult to monitor the blasting vibration velocity of the operating sewage box culvert structure embedded underground. Therefore, it is a very effective and feasible method to use numerical simulation calculation to determine the minimum safe distance based on the threshold value of the rock blasting damage degree of the surrounding rock. In addition, current blasting damage models rarely consider both the initial damage and the residual strength of rock.
In this paper, the Cowper-Symonds kinetic hardening model was improved using the rock initial damage degree and damage modification coefficient considering rock residual strength. Using the proposed damage model, blasting damage characteristics are investigated when the initial damage degree of the surrounding rock is different, and the residual strength of the damaged rock can be considered simultaneously. Then, dangerous parts of the box culvert structure are theoretically determined. Finally, the safe distance between tunnel and the existing box culvert in blasting construction can be determined using the blasting damage degree of the rock.
The novelty of this paper is that the Cowper-Symonds kinetic hardening damage model was improved upon by considering the rock initial damage degree and its residual strength after blasting. In addition, the safe distance between tunnel and box culvert in tunnel blasting construction can be determined reasonably using the rock blasting damage degree of the rock.

2. Methodology

2.1. Calculation of Total Tensional Strain

According to the continuous damage theory, Yang (1996) established a blasting damage model of rock [7]. In the Yang model, the equivalent tensile strain θ of the microelement is defined as the sum of the tensile strains ( λ 1 , λ 2 , and λ 3 ) along the three principal directions, described by the logarithmic strain. When the equivalent tensile strain of microbody exceeds the critical value, the tensile failure occurs.
The logarithmic principal strain is denoted by Formula (1) [7]:
e i = ln λ i ,   i   =   1 ,   2 ,   3
where, λ 1 , λ 2 , and λ 3 are engineering strains along the first principal strain direction, the second principal strain direction, and the third principal strain direction, respectively.
The total tensional strain θ is denoted by Formula (2):
θ = e i t ,   i   =   1 ,   2 ,   3
where e i t = 0 if the principal strain is compressional; e i t = e i if the principal strain is tensile.

2.2. Strain Rate-Dependence and Cumulative Damage

The Yang’s model assumed that flaws and cracks exist within rock mass [7]. Under tension, these flaws and cracks may grow, and new flaws and cracks may be generated, leading to the reduction of the stiffness and strength of rock. It was assumed that the increase of crack density is controlled by the tensile strain of rock. Formula (3) was proposed to calculate the increase of the crack density [7,9,29]:
d C d / d t = α ( θ θ c ) β
where C d is crack density; t is time; α and β are material constants; θ is equivalent tensile strain; θ c is critical tensile strain, and can be determined by the uniaxial dynamic tensile test, θ c = ln ( 1 + ε t ) ; ε t is ultimate tensile strain. When θ < θ c , crack density does not increase.
Damage variable D can be denoted by Formula (4):
D = 1 e C d 2
The relationship between the relative damage variable and the acoustic wave velocity for rock mass was denoted by Formula (5) when 0 D 1 and c c 0 [30]:
D = 1 ( c / c 0 ) 2
where c is the acoustic wave velocity of damaged rock after being loaded; c 0 is the initial acoustic wave velocity of rock.
When rock is the undamaged material before being loaded, D can be denoted by Formula (6):
D = 1 ( c / c ^ ) 2
where c ^ is the acoustic wave velocity of undamaged rock. In this paper, rock mass with an integrity index of more than 0.8 is assumed as the undamaged material.
The initial damage value of rock D 0 can be calculated by Formula (7):
D 0 = 1 ( c 0 / c ^ ) 2
The initial integrity index of rock mass η 0 is denoted by Formula (8):
η 0 = ( c 0 / c ^ ) 2
Then, the approximate relationship between initial damage value and initial integrity coefficient of rock mass is expressed by Formula (9):
D 0 = 1 η 0
Considering the effect of initial crack density, D 0 can be denoted by Formula (10) [9,29].
D 0 = 1 e C d 0 2
where C d 0 is the initial crack density of the rock mass.
Considering the initial crack density of the rock, Formula (3) can be expressed by Formula (11) [9,29]:
C d = θ c θ α θ ˙ ( θ θ c ) β d θ + C d 0
where θ ˙ is the equivalent tensile strain rate; C d 0 = ln η 0 .

2.3. Equivalent Bulk Modulus and Shear Modulus of Damaged Rock

It is assumed that the Poisson’s ratio of damaged rock is the same as that of undamaged rock. In the blasting damaged process of rock, Young’s modulus and the shear modulus can be obtained by Formulae (12) and (13), respectively [7,31].
E d = E ( 1 D ) / ( 3 ( 1 2 ν ) )
G d = G ( 1 D )
where E d is Young’s modulus of damaged rock; G d is shear modulus of damaged rock; E is Young’s modulus of undamaged rock; ν is Poisson’s ratio of rock; G is shear modulus of undamaged rock.
Young’s modulus and initial shear modulus with initial damage can be obtained by Formulae (14) and (15), respectively [7,31]:
E 0 = E ^ ( 1 D 0 ) / ( 3 ( 1 2 ν ) )
G 0 = G ^ ( 1 D 0 )
where E 0 is initial Young’s modulus of rock with initial damage; G 0 is initial shear modulus of rock with initial damage; E ^ is equivalent Young’s modulus of undamaged rock; G ^ is equivalent shear modulus of undamaged rock.
When Formula (14) is substituted into Formula (12), Young’s modulus of damaged rock can be obtained by Formula (16) using initial Young’s modulus, initial damage value, and damage variable of rock [29]:
E d = E 0 ( 1 D ) / ( 3 ( 1 2 ν ) ( 1 D 0 ) )
When Formula (15) is substituted into Formula (13), the shear modulus of damaged rock can be obtained by Formula (17) using initial shear modulus, initial damage value, and damage variable of rock [29]:
G d = G 0 ( 1 D ) / ( 1 D 0 )

2.4. Modification Coefficient of Damage Variable

After the rock is completely broken, there is still some residual strength [29,30]. The existing blasting damage models of rock rarely consider the characteristics that compressive stress and shear stress are still transmitting after the rock has been broken completely (i.e., the damage degree of rock is close to 1). The statistical damage-softening constitutive model considering the post-peak residual strength of rock was established based on the Hoek-Brown yield criterion [32]. The damage variable modification coefficient was introduced into the damage model proposed by Yumlu (1995) [29]. In this paper, the modification coefficient of damage variable δ is denoted by Formula (18) [32]:
δ = 1 σ r σ lc
where δ is the modification coefficient of damage variable; σ r is the post-peak residual strength of rock; σ lc is peak strength of rock.
Through Formula (18), Formulas (12) and (13) can be transformed to Formulae (19) and (20), respectively:
E d = E 0 ( 1 δ D ) / ( 3 ( 1 2 ν ) ( 1 δ D 0 ) )
G d = G 0 ( 1 δ D ) / ( 1 δ D 0 )

2.5. Constitutive Model Considering Initial Damage and Residual Strength of Rock

When total stress is decomposed into average stress or hydrostatic pressure and deviatoric stress, the elastic damage constitutive relation of rock can be expressed by Formulae (21) and (22):
σ v = E d ε v / ( 3 ( 1 2 ν ) ) ,   σ m = E d ε v / ( 9 ( 1 2 ν ) )
S i j = 2 G d e j j
where σ v is bulk stress, σ v = σ 1 + σ 2 + σ 3 ; σ m is average stress or hydrostatic pressure, σ m = 1 3 ( σ x + σ y + σ z ) ; ε v is bulk strain, ε v = ε 1 + ε 2 + ε 3 ; ε m is average strain, ε m = 1 3 ( ε x + ε y + ε z ) ; S i j is the component of deviatoric stress tensor; and e j j is the component of deviatoric strain tensor.
When Formula (19) is substituted into Formula (21), the model considering initial damage and residual strength of rock can be expressed by Formula (23). When Formula (20) is substituted into Formula (22), the constitutive model considering initial damage and residual strength of rock can be expressed by Formula (24):
σ m = E 0 ε m ( 1 δ D ) / ( 3 ( 1 2 ν ) ( 1 δ D 0 ) )
S i j = 2 G 0 e j j ( 1 δ D ) / ( 1 δ D 0 )
where D 0 D 1 .
When denoted in increments, Formulae (23) and (24) can be transformed to Formulae (25) and (26), respectively:
ε ˙ m = 3 ( 1 2 ν ) ( 1 δ D 0 ) ( σ ˙ m ( 1 δ D ) + D ˙ δ σ m ) / ( E 0 ( 1 δ D ) 2 )         ( θ > θ c )
e ˙ j j = S ˙ i j ( 1 δ D ) + D ˙ δ S i j 2 G 0 ( 1 δ D ) 2 / ( 1 δ D 0 )         ( θ > θ c )
where ε ˙ v is average strain rate; σ ˙ m is average stress rate; e ˙ j j is the component of deviatoric strain rate tensor; and S ˙ i j is deviatoric stress rate.

2.6. Cowper-Symonds Plastic Kinetic Hardening Model

The stress-strain curves of rock under dynamic load show obvious strain rate-related properties. The limit yield strength of rock obviously increases with the increase of strain rate. In this paper, the Cowper-Symonds plastic kinetic hardening model was used to denote the stress-strain relation of rock.
The yield function ϕ is denoted by Formula (27):
ϕ = σ i σ y
where σ i is stress strength, σ i = 3 2 ( S i j α i j ) ( S i j α i j ) ; σ y is yield stress; S i j is the component of deviatoric stress tensor, S i j = σ i j 1 3 σ kk ; α i j is movement tensor at the center of yield surface, Δ α i j = 2 3 ( 1 β ) E p ε ˙ i j p Δ t ; σ kk is the first invariant of stress tensor; Δ α i j is the movement tensor increment at the center of yield surface; β is hardening parameter of rock, and β = 1 when rock belongs to isotropic hardening; E p is plastic hardening modulus, E p = E 0 E tan E 0 E tan ; E 0 is Young’s modulus; E tan is tangent modulus; ε ˙ i j p is plastic strain rate; and Δ t is time increment.
When rock is isotropic material, the effect of movement tensor is not considered. Yield stress is denoted by Formula (28):
σ y = [ 1 + ( ε ˙ C ) 1 / P ] ( σ y 0 + β E p ε p eff )
where ε ˙ is strain rate; C and P are the constants of the Cowper-Symonds plastic kinetic hardening model; σ y 0 is initial yield stress; ε p eff is effective plastic deformation, ε p eff = 0 t d ε p eff ; d ε p eff = 2 3 d ε i j p d ε i j p ; ε i j p is plastic strain.

3. Numerical Algorithm of the Proposed Damage Model

The proposed blasting damage model of rock was implemented into the commercial software LS-DYNA as a user-defined material model [33], shown in Figure 1. The coupling process between the Cowper-Symonds plastic kinetic hardening model and the proposed damage model can be summarized as follows:
(1) According to σ i j n and Δ ε obtained in the former incremental step, stress in the current incremental step is determined using elastic prediction, where C c j k l is elastic tensor and Δ ε k l is strain increment.
(2) The value of damage variable is updated according to the given algorithm.
(3) Judge whether to yield according to the given yield condition. If rock yields, plastic correction is performed according to the given plastic potential function.
(4) Adjust stress value according to damage value.
In Figure 1, σ ¯ i j n + 1 is effective stress tensor; σ i j n + 1 is trial stress tensor; σ i j n and σ i j n + 1 are stress tensor with damage, respectively; C c j k l is elastic tensor; Δ ε and Δ ε k l are strain increment; Δ C d is crack density increment.
The coupling process between the Cowper-Symonds kinetic hardening model and the proposed blasting damage model (shown in Figure 1) can be summarized as follows.

3.1. Elastic Prediction

According to the plastic increment theory, total strain can be decomposed into the increment of elastic strain and that of plastic strain for any time step (see Formula (29)):
Δ ε i j = Δ ε i j e + Δ ε i j p         ( i   =   1 ,   2 ,   3 )
where Δ ε i j is strain increment; Δ ε i j e is increment of elastic strain; and Δ ε i j p is increment of plastic strain.
According to Hooke’s law, the relationships among the deviations of elastic stress, hydrostatic stress and strain are denoted by Formula (30):
{ σ x σ m = 2 G ( ε x ε m ) ,   τ x y = G γ x y σ y σ m = 2 G ( ε y ε m ) ,   τ y z = G γ y z σ z σ m = 2 G ( ε z ε m ) ,   τ z x = G γ z x
where τ x y , τ y z and τ z x are shear stress; and γ x y , γ y z and γ z x are shear strain.
Assuming that all strains are elastic, Formula (30) is expressed as Formula (31) in incremental form, and Formula (21) is expressed as Formula (32) in incremental form:
{ σ x n + 1 = σ ¯ x n + Δ σ m n + 2 G ( Δ ε x Δ ε m ) ,   τ x y n + 1 = τ ¯ x y + G Δ γ x y σ y n + 1 = σ ¯ y n + Δ σ m n + 2 G ( Δ ε y Δ ε m ) ,   τ y z n + 1 = τ ¯ y z + G Δ γ y z σ z n + 1 = σ ¯ z n + Δ σ m n + 2 G ( Δ ε z Δ ε m ) ,   τ z x n + 1 = τ ¯ z x + G Δ γ z x
Δ σ m = K d Δ ε m
where σ ¯ x n , σ ¯ y n , σ ¯ z n , τ ¯ x y , τ ¯ y z and τ ¯ z x are stresses at the previous calculation step after being converted to effective stress space; σ x n + 1 , σ y n + 1 , σ z n + 1 , τ x y n + 1 , τ y z n + 1 , τ z x n + 1 are stresses of elastic test; Δ σ m n is increment of average stress, Δ σ m n = 1 3 ( Δ σ x n + Δ σ y n + Δ σ z n ) ; Δ σ x n , Δ σ y n and Δ σ z n are increments of stress; Δ ε m is increment of average strain, Δ ε m = 1 3 ( Δ ε x + Δ ε y + Δ ε z ) ; Δ ε x , Δ ε y and Δ ε z are increments of strain; and Δ γ x y , Δ γ y z and Δ γ z x are increments of shear strain.

3.2. Calculation of the Damage Variable

According to Formulae (1) and (2), equivalent tensile strain can be obtained by Formula (33):
θ = i = 1 3 ln [ 1 + ε i + | ε i | 2 ]
Rock damage occurs only when equivalent tensile strain is greater than critical tensile strain. To improve the calculation accuracy of equivalent tensile strain, the equivalent tensile strain is recorded for each load step and transmitted to the next cycle. The calculation algorithm of the damage variable is described as follows.
(1) When θ n > θ c , tensile damage of element occurs, and is obtained by Formulae (4) and (11):
(2) Calculate the current equivalent tensile strain by Formula (34):
θ = { ( θ n + θ n + 1 ) / 2 ,     θ n + 1 > θ c ( θ n + θ c ) / 2 ,             θ n + 1 θ c
where θ n is equivalent tensile strain in the nth load step; and θ c is critical tensile strain.
(3) Calculate crack density increment Δ C d n + 1 according to Formula (11) and update the history variable of crack density C d n + 1 = C d n + Δ C d n + 1 .
(4) Update damage variable D using Formula (4).
(5) When θ n θ c , do not calculate tensile damage and directly calculate the Cowper-Symonds kinetic hardening model.

3.3. Plastic Correction

If some element is at elastic state in the current calculation step, stress tensor of elastic test σ ¯ i j n + 1 = σ i j n + 1 .
If some element is at plastic state, stress of elastic prediction and plastic hardening function should be echoed to the yield surface by means of radial regression.
The yield function ϕ is calculated using Formula (27). The Cowper-Symonds kinetic hardening model considers the increase of rock yield stress under the condition of high strain rate. Therefore, it is necessary to calculate yield stress σ y n in the current load step using Formula (28).
When rock enters yield state ( ϕ > 0 ), effective plastic strain is modified using Formula (35):
ε p eff n + 1 = ε p eff n + Δ ε p eff = ε p eff n + σ i σ y n 3 G + E p
Finally, deviatoric stress is decreased by Formula (36) and return to new yield surface:
S i j n + 1 = S i j 3 G Δ ε p eff σ i S i j
where S i j is the component of deviatoric stress tensor before decreasing.

3.4. Stress Update

Update stress using Formula (37):
σ i j n + 1 = σ ¯ i j n + 1 ( 1 δ D ) / ( 1 δ D 0 )

4. Validation of the Availability of the Proposed Model

4.1. Numerical Model of the Uniaxial Compression Test

Numerical simulation of a uniaxial compression test is carried out using the proposed damage model. To verify the availability of the proposed model, numerical simulation results are compared with those calculated by Yang (1996) [7].
The model with length, width, and height all 0.1 m is established to simulate a uniaxial compression test. SOLID 164 is used to mesh the model. The relationship between stress and strain of rock and the development of rock damage variable under the specific constant strain rate are investigated by applying the constant velocity to the node along the Z (vertical) direction at the top of the model.
In the case of uniaxial compression test, compressive stress is σ 1 , and equivalent tensile strain is θ denoted by Formula (38):
θ = ε 2 + ε 3
where ε 2 = ε 3 = ν σ 1 / E .
The main calculation parameters of rock in the uniaxial compression test are listed in Table 1, which was used in the paper of Yang (1996) [7].

4.2. Rock Blasting Damage Evolution and Softening under Compression Conditions

Figure 2 is the stress-strain curve and damage curve obtained using Yang’s model [7] and it was obtained using the proposed model at a strain rate equal to 100 s−1. The curves in Figure 2 are based only on calculations of Yang’s model and the proposed model.
From Figure 2, it can be noted that the evolution curve of the damage variable with strain is monotonically increasing. With the increase of axial stress, ε 2 and ε 3 become tensile strains, and rock damage accumulates gradually to D = 1, when rock is softened significantly until it cannot withstand the applied load. D is about 0.22 when the rock started to soften significantly under stress, seen in Figure 2. This can be taken as a criterion of rock blasting damage and failure.
Compared with the calculation results using Yang’s model [7] and those of the proposed model, it can be concluded that the proposed model can be used to simulate rock damage evolution process under compression, as seen in Figure 2.

4.3. Influence of Strain Rate on Rock Blasting Damage

Since rock deformation characteristics are different for different strain rates, the blasting damage model should have obvious rate correlation. From Figure 3, it can be noted that rock peak stress increases obviously with an increase of strain rate. Rock peak stress increases about 650% as the strain rate varies from 10 to 1000 s−1, that is, there is a significant rate modification phenomenon.
Since the time-dependent damage variable D is related to strain rate, the proposed model can reflect that the higher the strain rate, the more obvious the lag phenomenon of rock softening.

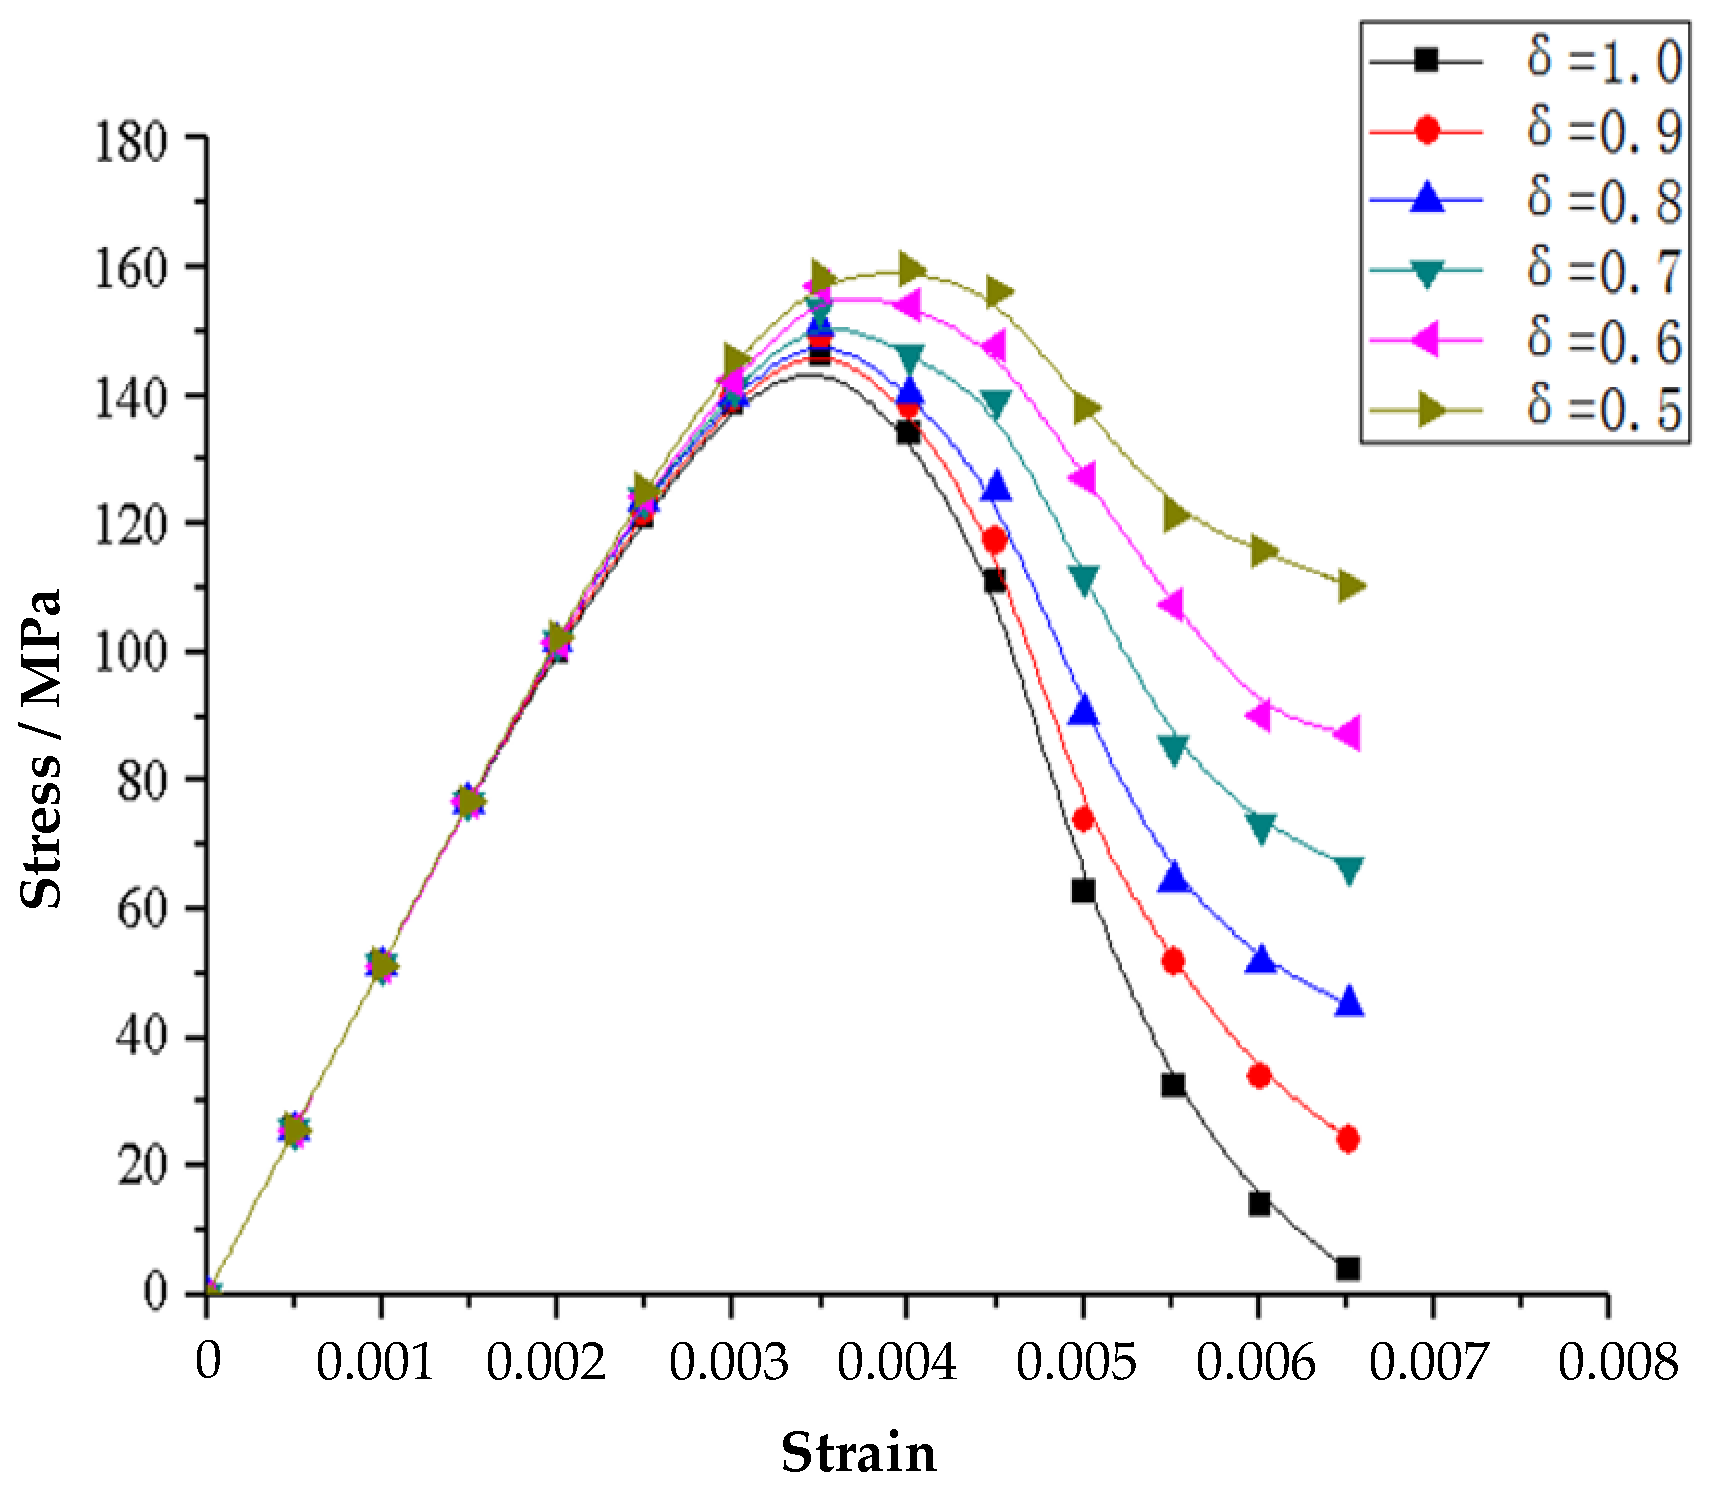
4.4. Influence of Damage Modification Coefficient on Stress-Strain Relationship

From Figure 4, it can be noted that when δ is reduced from 1.0 to 0.5, rock residual strength gradually increases. Rock residual strength is 66.8% of peak strength when δ = 0.5, but only 9.59% of peak strength when δ = 1.0. That is, rock residual strength is very sensitive to the damage modification coefficient. Damage modification coefficient can successfully reflect the residual strength characteristics of rock.

4.5. Influence of Initial Damage on Rock Stress-Strain Relationship

From Figure 5, it can be noted that the stress-strain curve of rock changes obviously with the increase of its initial damage. When strain is less than 0.001, stress-strain curves present an approximately linear change. When strain is more than 0.001, rocks with greater initial damage will soften earlier. When the initial damage degree of rock varies from 0.05 to 0.2, its stress peak value is from 26% to 39% and significantly lower than that of initial undamaged rock.

5. Case Study

Taking the tunnel under-passing sewage box culvert of Shenzhen’s Metro, China, as an example, blasting damage range, blasting damage degree of tunnel surrounding rock, and dangerous parts of box culvert structure are analyzed using the proposed blasting damage model. In addition, the safe distance between the top of the tunnel and the existing box culvert in the tunnel blasting construction is investigated. The tunnel is excavated using the drill-blasting method.

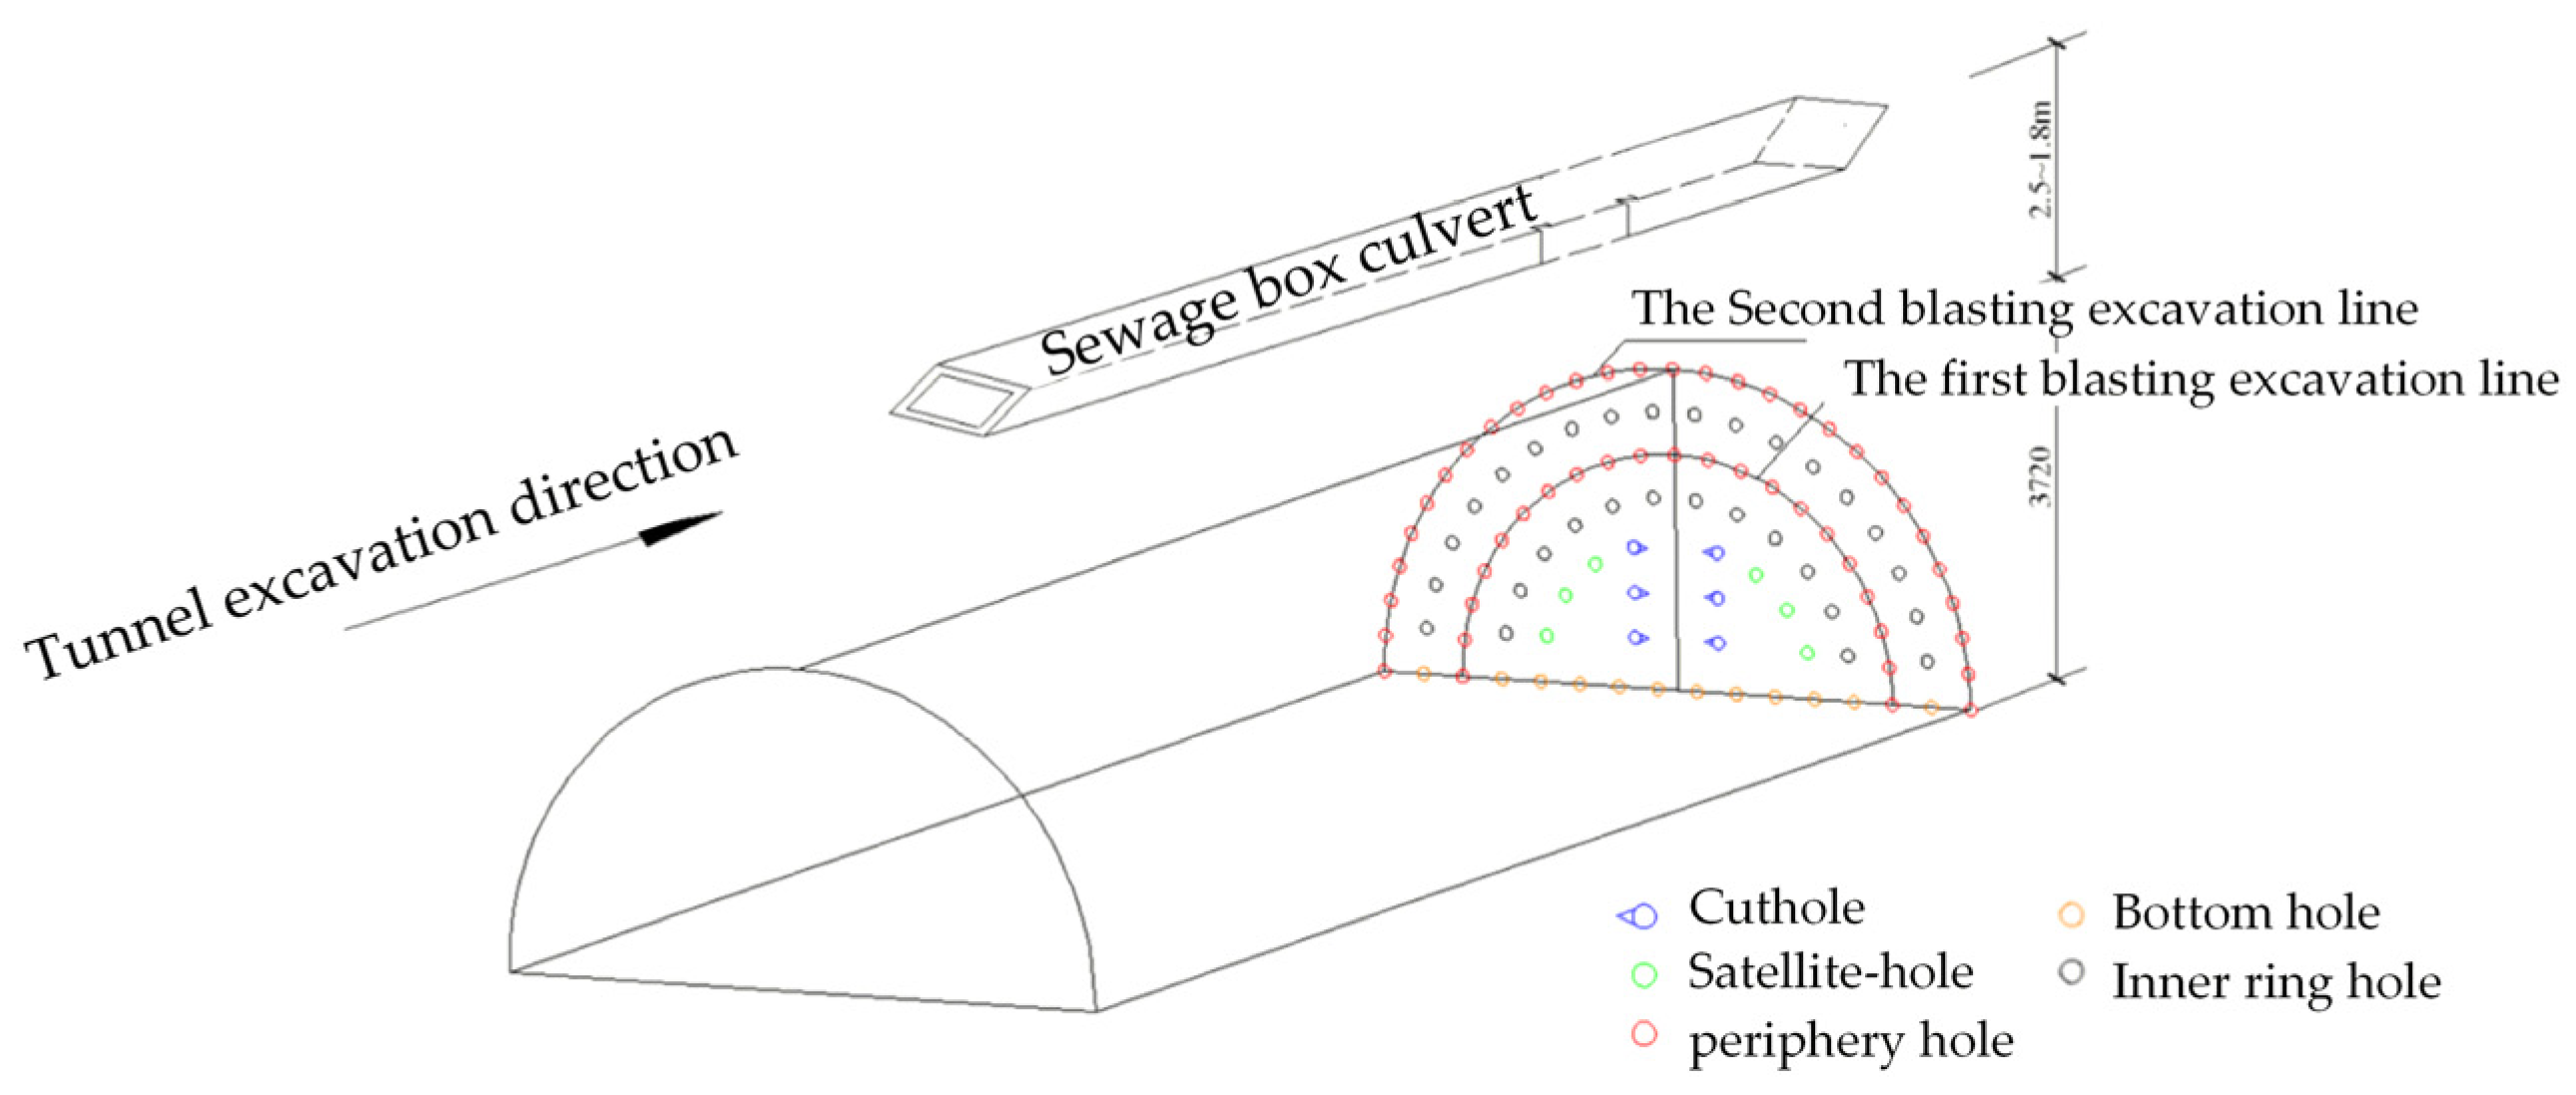
5.1. Calculation Model

Surrounding rocks of the tunnel and sewage box culvert are medium weathered granite in the calculation model. Cross-section dimensions of the calculation model are shown in Figure 6.
Main calculation parameters of rock are listed in Table 2. In Table 2, ρ is the density of surrounding rock; E is Young’s modulus; ν is Poisson’s ratio; σ 0 is yield stress; E tan is tangent modulus; C and P are the constants of Cowper-Symonds plastic kinetic hardening model; α and β are hardening parameters of rock; and δ is damage modification coefficient of rock. ρ , E, ν , σ 0 , E tan , and δ were determined by laboratory tests; C and P are obtained from Xie et al., 2016 [12]; α and β are obtained from Yang et al., 1996 [9].
The length of the model along the tunnel longitudinally is 45.0 m; the length of the model is 55.0 m along the horizontal direction; the height of the model is 35.2~40.0 m. The thickness of the soil overlying the box culvert is 5.0 m. The spacing between the box culvert and the tunnel is 1.0~2.0 m.
The model consists of 4360 elements and 5301 nodes. According to the site conditions, two groups of vertical planes of the model are fixed at the horizontal direction, and the base plane (xy plane) is fixed at the z direction. The gravity force is applied to take the effect of the self-weight stress field into account.

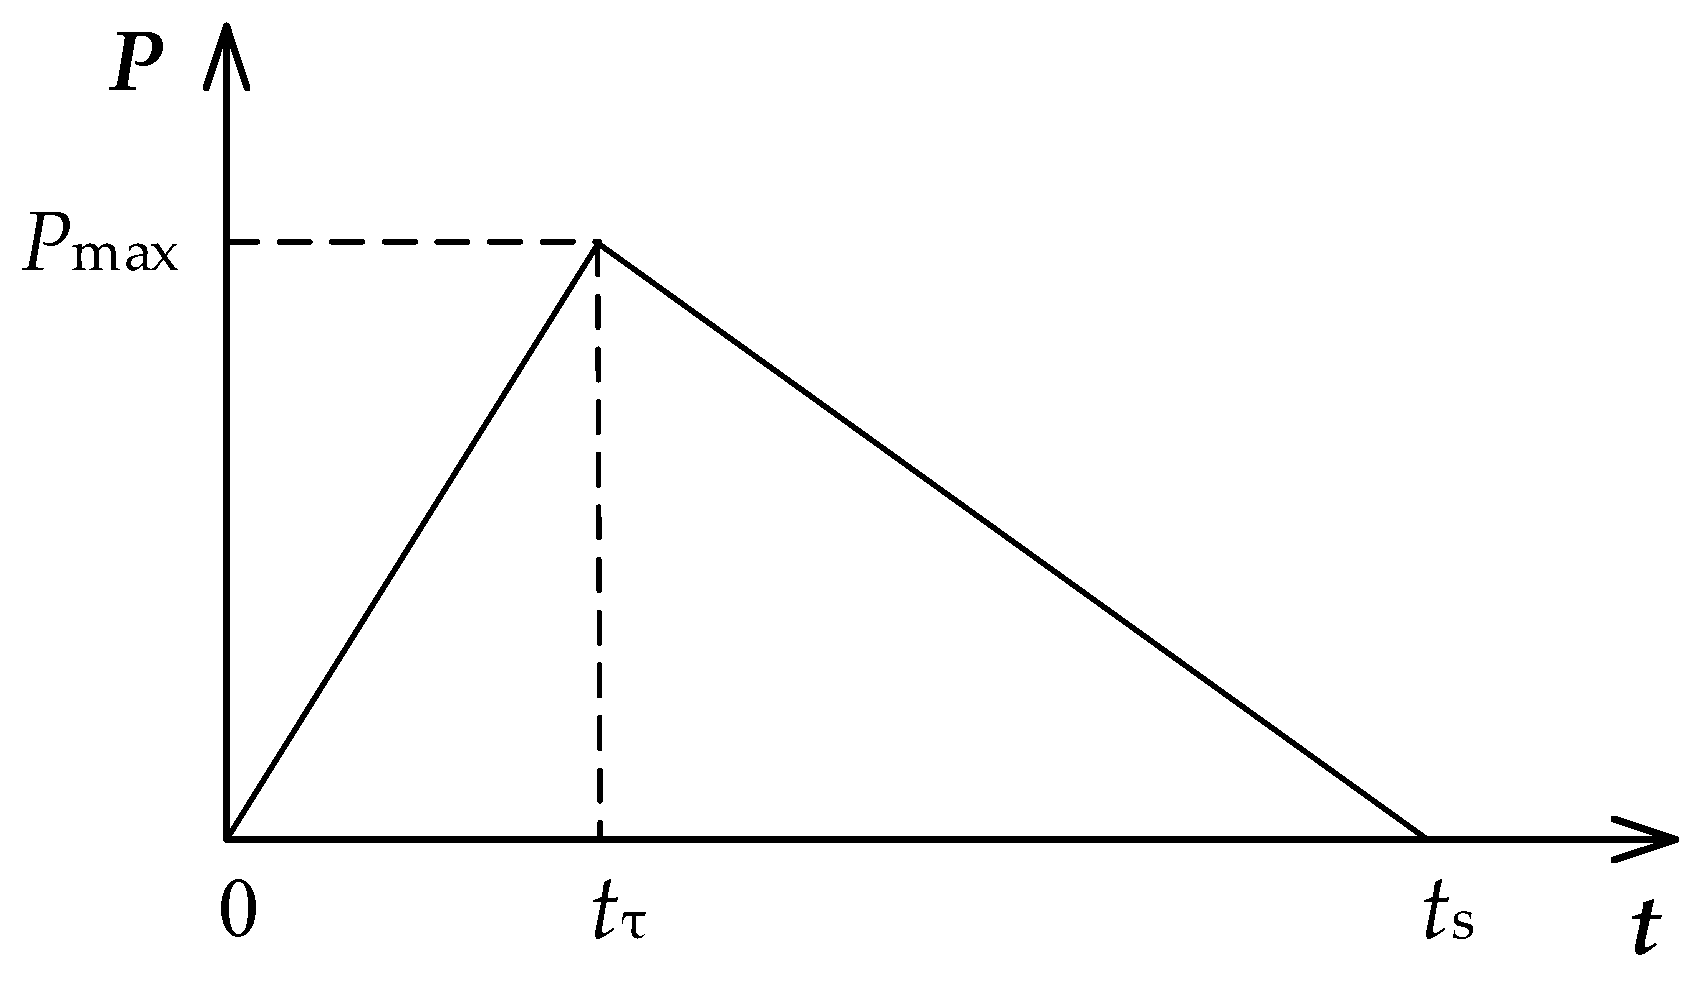
5.2. Blasting Load and Its Application Method

The purpose of tunnel blasting numerical simulation in this paper is to obtain the damage range of surrounding rock caused by blasting construction, and it does not discuss the crushing mechanism and fracture effect of rock near blast-holes. Therefore, it is reasonable and feasible to simulate the blasting effect by applying simplified equivalent loads.
In tunnel blasting numerical simulation, the shapes of blast-holes are not reflected, and blasting pressure load is equivalently applied to the axis plane of blast-holes through conversion [30]. And explosion pressure load is approximated by triangular explosion load, as shown in Figure 7. In Figure 7, P max is peak pressure; t τ is the time corresponding to the rise of load; t s is total load time.
P max can be calculated by Formula (39) [34]:
P max = 1 8 ρ e V 2 k d 6 η
where ρ e is charge density; V is explosive detonation velocity; k d is borehole charge decoupling coefficient, k d = d b d c , d b and d c are diameter of blast-hole and diameter of equivalent explosive coil, respectively; η is the multiple of pressure increase value when detonating gas hits blast-hole wall, η = 8 11 .
Based on the Saint-Venant principle in mechanics, the equivalent blasting load time-history curve is applied to the plane determined by the central line of blast-hole and the axis of blast-holes in the same row (see Figure 8). Equivalent pressure is determined according to the above principle, and is calculated by Formula (40) [34].
P e = 2 r 0 a P 0
where P e is equivalent pressure; P 0 is blasting force acting on single blast-hole wall, P 0 = P max ; r 0 is blast-hole radius; and a is blast-hole spacing.
t τ can be calculated by Formula (41):
t τ = L 1 V
where L 1 is charge length.
In the paper, t τ = 170 μs, t s = 1000 μs [35]. Explosive parameters are listed in Table 3. The diameter of blast-holes is 42 mm; the diameter of the charges is 32 mm.
According to the acoustic wave velocity of rock, D 0 = 0.375 is obtained by Formula (7) in this study. Combined with our experience and considering the safety of the box culvert, the threshold value of rock damage corresponding to the edge of the blasting damage impact range can be determined by Formula (42):
D lim = 0 . 20 + 0 . 80 D 0
where D lim is the threshold value of rock blasting damage; D 0 is initial damage of rock.
Formula (42) can be used to determine the damage accumulation range of rock caused by blasting. According to Formula (42), the blasting damage threshold of surrounding rock around the box culvert structure is 0.50. In the process of tunnel blasting construction, the bottom of the box culvert is obviously the most dangerous. Therefore, the surrounding rock elements close to the bottom of the box culvert structure were selected for the blasting damage analysis, as shown in Figure 9.

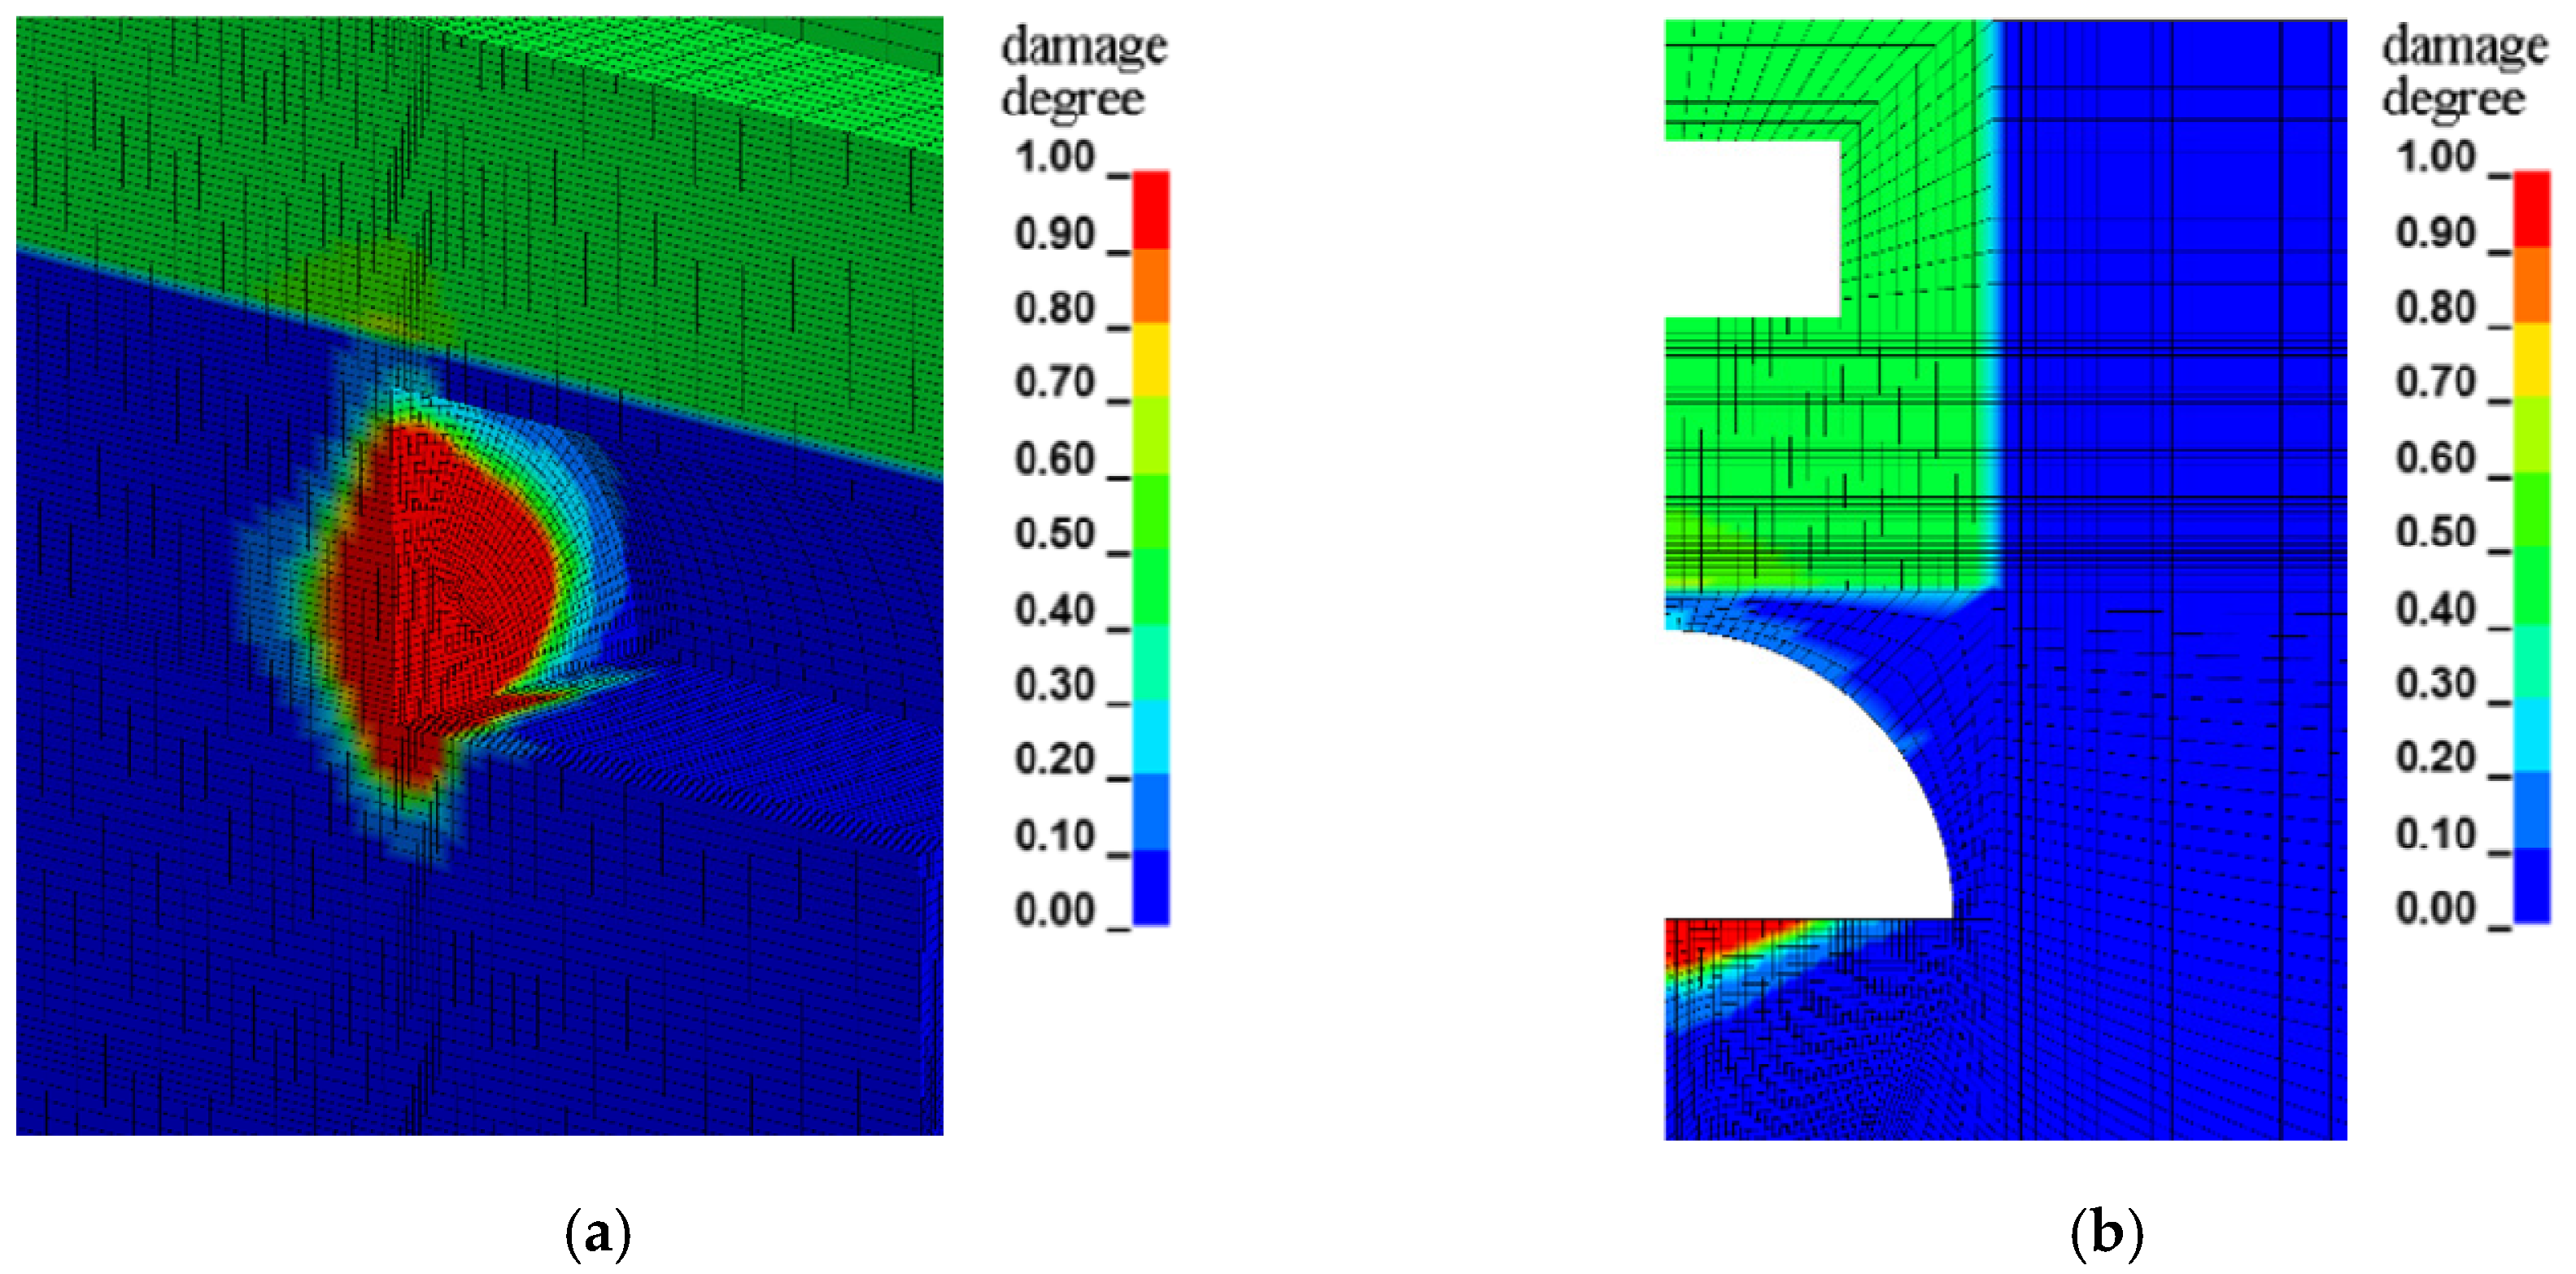
5.3. Results and Discussion

Figure 10a is a three-dimensional blasting damage diagram of surrounding rock when d = 1 m. Figure 10b is cross-section diagram of surrounding rock blasting damage when d = 1 m. d is the spacing between the box culvert and the tunnel.
From Figure 10a,b, it can be noted that the thickness of blasting-damaged rock beneath the box culvert with D > 0.9 is approximately 0.5 m; the thickness of blasting-damaged rock overlying the tunnel with D > 0.8 is approximately 20~22 cm.
From Figure 10a, it can be noted that the thickness of the blasting-damaged rock between the box culvert and the tunnel with D < 0.7 is less than 30 cm. From Figure 10b, it can be noted that the thickness of the surrounding rock between the box culvert and the tunnel with D < 0.7 is approximately 20 cm; the thickness of the surrounding rock between the box culvert and the tunnel with D 0.5 is 1.0 m.
Figure 11a is three-dimensional blasting damage diagram of surrounding rock when d = 2 m. Figure 11b is cross-section diagram of surrounding rock blasting damage when d = 2 m.
From Figure 11a,b, it can be noted that the thickness of blasting-damaged surrounding rock beneath the box culvert with D > 0.9 , is less than 15 cm, located from 1.2 m to 1.35 m beneath the box culvert. The thickness of blasting-damaged surrounding rock beneath the box culvert with D > 0.7 , is less than 45 cm, located from 0.9 m to 1.35 m beneath the box culvert (see in Figure 11a). The thickness of blasting-damaged surrounding rock overlying the tunnel with D < 0.6 , is approximately 60 cm (see in Figure 11a). The thickness of blasting-damaged surrounding rock beneath the box culvert with D 0.5 , is more than 55 cm (see in Figure 11a).
From Figure 11b, it can be noted that the thickness of blasting-damaged surrounding rock beneath the box culvert with D > 0.8 , is less than 20 cm, located from 1.2 m to 1.4 m beneath the box culvert. The thickness of blasting-damaged surrounding rock overlying the tunnel with D 0.5 , is more than 55 cm (see in Figure 11b).
Comparing Figure 10a with Figure 11a, it can be found that the blasting damage range of surrounding rock and blasting damage degree of surrounding rock both very significantly reduce as the spacing between the box culvert and the tunnel increases from 1.0 m to 2.0 m. In addition, blasting damage of surrounding rock exists the concentrated phenomenon beneath the box culvert when the spacing between the box culvert and the tunnel is 1.0 m.
Figure 12a is the three-dimensional blasting damage diagram of surrounding rock when d = 3.0 m. Figure 12b is a cross-section diagram of surrounding rock blasting damage when d = 3.0 m.
From Figure 12a,b, it can be noted that the thickness of blasting-damaged surrounding rock beneath the box culvert with D < 0.5 , is more than 2.35 m. The thickness of blasting-damaged surrounding rock beneath the box culvert with D = 0.5 0.7 is 0.65 m, located from 0.65 m to 1.3 m overlying the tunnel (see in Figure 12a,b).
Figure 13a is three-dimensional blasting damage diagram of surrounding rock when d = 4.0 m. Figure 13b is cross-section diagram of surrounding rock blasting damage when d = 4.0 m.
From Figure 13a,b, it can be noted that the thickness of blasting-damaged surrounding rock beneath the box culvert with D < 0.5 , is more than 3.7 m. The thickness of blasting-damaged surrounding rock beneath the box culvert with D = 0.5 0.7 is 0.3 m, located from 0.45 m to 0.75 m overlying the tunnel (see in Figure 13a,b).
Comparing Figure 10 with Figure 11, Figure 12 and Figure 13, it can be found that when the tunnel underpasses the box culvert at a short distance (d ≤ 2.0 m), the blasting damage of surrounding rock between the box culvert and the tunnel is highly related to d; especially when d ≤ 2.0 m, the box culvert structure has a significant “amplification effect” on the surrounding rock blasting damage, and the amplification effect attenuates with the increase of d; when d ≥ 4.0 m, it can be considered that the box culvert structure has very little influence on the surrounding rock blasting damage of the tunnel.
The “amplification effect” phenomenon on surrounding rock blasting damage may be caused by the facts as follows: the inner space of the box culvert may create an additional free face for detonation holes if the spacing between the box culvert and the tunnel is too small (d ≤ 2.0 m). Furthermore, the compressive wave generated by blasting reaches the box culvert and is reflected to form the tensile wave, which acts together with the subsequent stress wave to accelerate the damage development speed of surrounding rock in this zone.
From Figure 14, it can be noted that when the distance between the box culvert and the tunnel is 3~4 m, the blasting damage of surrounding rock beneath the box culvert does not exceed D lim . Thence, when d > 3.0 m, the surrounding rock around the box culvert are essentially not damaged by blasting. From Figure 15, it can be noted that when the blasting damage of surrounding rock beneath the box culvert shows an upwardly concave parabolic change with d.
From Figure 10, Figure 11, Figure 12, Figure 13, Figure 14 and Figure 15, it can be suggested that the safe distance between the tunnel and the existing box culvert in blasting construction should be not less than 4.0 m. In addition, it can be suggested that the pre-reinforcement of surrounding rock overlying the tunnel should be implemented before tunnel blasting when d < 2.0 m. The sewage box culvert was successfully under-passed using the pre-reinforcement of pipe sheds before tunnel blasting, together with laying out one empty hole without explosives between every two blasting holes with explosives for the peripheral holes of tunnel.

6. Conclusions

  • The Cowper-Symonds kinetic hardening model improved using initial damage degree and damage modification coefficient considering rock residual strength, and can be used to simulate the damage evolution process of rock and softening of rock caused by damage growth under compression.
  • Blasting damage range of surrounding rock with D ≥ 0.5 very significantly reduces from 1.0 m to 0.3 m as the spacing between the box culvert and the tunnel increases from 1.0 m to 4.0 m.
  • Blasting damage of surrounding rock exists some concentrated phenomena beneath the box culvert when the spacing between the box culvert and the tunnel is less than 2.0 m.
  • Using the proposed model can reasonably determine the safe distance between the tunnel and the existing box culvert in blasting construction, which should be not less than 4.0 m.
  • This paper lacks comparative analysis and validation with other methods such as the model using rock tension-compression coupling damage algorithm. Further studies are required for these deficiencies as well as the validation of numerical simulation by field damage detection.
  • Notwithstanding its limitation, the simulation using the proposed model conducted in the paper is still very significant as a reference to guiding tunnel drill-blasting construction closely under-passing sewage box culverts.

Author Contributions

J.X.: conceptualization and constitutive model development, writing—review and editing; H.X.: numerical simulation and analysis, writing—original draft preparation; G.R.: data curation, investigation. All authors have read and agreed to the published version of the manuscript.

Funding

This research was funded by Science and Technology Project of China Railway 20th Bureau Group Co., Ltd., China Postdoctoral Science Foundation, grant number 20060390165.

Institutional Review Board Statement

Not applicable.

Informed Consent Statement

Not applicable.

Data Availability Statement

Data are contained within this article.

Conflicts of Interest

The authors declare no conflict of interest.

References

  1. Lee, K.; Kim, J.; Woo, S.I. Analysis of horizontal earth pressure acting on box culverts through centrifuge model test. Appl. Sci. 2022, 12, 1993. [Google Scholar] [CrossRef]
  2. Ittner, H.; Olsson, M.; Johansson, D.; Schunnesson, H. Multivariate evaluation of blast damage from emulsion explosives in tunnels excavated in crystalline rock. Tunn. Undergr. Space Technol. 2019, 85, 331–339. [Google Scholar] [CrossRef]
  3. Shadabfar, M.; Gokdemir, C.; Zhou, M.L.; Kordestani, H.D.; Muho, E.V. Estimation of damage induced by single-hole rock blasting: A review on analytical, numerical, and experimental solutions. Energies 2020, 14, 29. [Google Scholar] [CrossRef]
  4. Parisio, F.; Vilarrasa, V.; Laloui, L. Hydro-mechanical modeling of tunnel excavation in anisotropic shale with coupled damage-plasticity and micro-dilatant regularization. Rock Mech. Rock Eng. 2018, 51, 3819–3833. [Google Scholar] [CrossRef]
  5. Mader, T.; Schreter, M.; Hofstetter, G. On the influence of direction-dependent behavior of rock mass in simulations of deep tunneling using a novel gradient-enhanced transversely isotropic damage-plasticity model. Appl. Sci. 2022, 12, 8532. [Google Scholar] [CrossRef]
  6. Grady, D.E.; Kipp, M.E. Continuum modeling of explosive fracture in oil shale. Int. J. Rock Mech. Min. 1980, 17, 147–157. [Google Scholar] [CrossRef]
  7. Yang, R.; Bawden, W.F.; Katsabanis, P.D. A new constitutive model for blast damage. Int. J. Rock Mech. Min. Geomech. Abstr. 1996, 33, 245–254. [Google Scholar] [CrossRef]
  8. Liu, L.; Katsabanis, P. Development of a continuum damage model for blasting analysis. Int. J. Rock Mech. Min. 1997, 34, 217–231. [Google Scholar] [CrossRef]
  9. Tang, C. Numerical simulation of progressive rock failure and associated seismicity. Int. J. Rock Mech. Min. 1997, 34, 249–261. [Google Scholar] [CrossRef]
  10. Cao, W.G.; Zhang, S.; Zhao, M.H. Study on statistical damage constitutive model of rock based on new definition of damage. Rock Soil Mech. 2006, 27, 41–46. [Google Scholar]
  11. Hu, Y.G.; Lu, W.B.; Chen, M.; Yan, P.; Zhou, C.B. Comparison and improvement of blasting damage models for rock. Rock Soil Mech. 2012, 33, 3278–3284. [Google Scholar]
  12. Xie, L.X.; Lu, W.B.; Zhang, Q.B.; Jiang, Q.H.; Wang, G.H.; Zhao, J. Damage evolution mechanisms of rock in deep tunnels induced by cut blasting. Tunn. Undergr. Space Technol. 2016, 58, 257–270. [Google Scholar] [CrossRef]
  13. Ji, L.; Zhou, C.B.; Lu, S.W.; Jiang, N.; Li, H.B. Modeling study of cumulative damage effects and safety criterion of surrounding rock under multiple full-face blasting of a large cross-section tunnel. Int. J. Rock Mech. Min. 2021, 147, 104882. [Google Scholar] [CrossRef]
  14. Xu, J.C.; Wang, Z.L.; Rui, G.R. Tunnel Slotting-Blasting Numerical Modeling Using Rock Tension-Compression Coupling Damage Algorithm. Appl. Sci. 2022, 12, 6714. [Google Scholar] [CrossRef]
  15. Yang, J.H.; Jiang, Q.H.; Zhang, Q.B.; Zhao, J. Dynamic stress adjustment and rock damage during blasting excavation in a deep-buried circular tunnel. Tunn. Undergr. Space Technol. 2018, 71, 591–604. [Google Scholar] [CrossRef]
  16. Xie, L.X.; Zhang, Q.B.; Gu, J.C.; Lu, W.B.; Yang, S.Q.; Jing, H.W.; Wang, Z.L. Damage evolution mechanism in production blasting excavation under different stress fields. Simul. Model. Pract. Theory 2019, 97, 101969. [Google Scholar] [CrossRef]
  17. Salum, A.H.; Murthy, V.M.S.R. Optimising blast pulls and controlling blast-induced excavation damage zone in tunnelling through varied rock classes. Tunn. Undergr. Space Technol. 2019, 85, 307–318. [Google Scholar] [CrossRef]
  18. Huo, X.F.; Shi, X.Z.; Qiu, X.Y.; Zhou, J.; Gou, Y.G.; Yu, Z.; Ke, W.Y. Rock damage control for large-diameter-hole lateral blasting excavation based on charge structure optimization. Tunn. Undergr. Space Technol. 2020, 106, 103569. [Google Scholar] [CrossRef]
  19. Xu, X.D.; He, M.C.; Zhu, C.; Lin, Y.; Cao, C. A new calculation model of blasting damage degree—Based on fractal and tie rod damage theory. Eng. Fract. Mech. 2019, 220, 106619. [Google Scholar] [CrossRef]
  20. Xie, L.X.; Yang, S.Q.; Gu, J.C.; Zhang, Q.B.; Lu, W.B.; Jing, H.W.; Wang, Z.L. JHR constitutive model for rock under dynamic loads. Comput. Geotech. 2019, 108, 161–172. [Google Scholar] [CrossRef]
  21. Mei, W.Q.; Li, M.; Pan, P.Z.; Pan, J.F.; Liu, K.L. Blasting induced dynamic response analysis in a rock tunnel based on combined inversion of Laplace transform with elasto-plastic cellular automaton. Geophys. J. Int. 2021, 225, 699–710. [Google Scholar] [CrossRef]
  22. Far, M.S.; Wang, Y.; Dallo, Y.A.H. Reliability analysis of the induced damage for single-hole rock blasting. Georisk Assess. Manag. Risk Eng. Syst. Geohazards 2018, 13, 82–98. [Google Scholar]
  23. He, L.; Zhong, D.W.; Liu, Y.H.; Song, K. Prediction of bench blasting vibration on slope and safety threshold of blasting vibration velocity to undercrossing tunnel. Shock Vib. 2021, 2021, 9939361. [Google Scholar] [CrossRef]
  24. Yang, F.; Jiang, N.; Zhou, C.B.; Lyu, G.P.; Yao, Y.K. Dynamic response and safety control of civil air defense tunnel group during the whole process of underpass tunnel blasting excavation. Int. J. Prot. Struct. 2022. [Google Scholar] [CrossRef]
  25. Rajabi, M.; Rahmannejad, R.; Rezaei, M.; Ganjalipour, K. Evaluation of the maximum horizontal displacement around the power station caverns using artificial neural network. Tunn. Undergr. Space Technol. 2017, 64, 51–60. [Google Scholar] [CrossRef]
  26. Rezaei, M.; Rajabi, M. Vertical displacement estimation in roof and floor of an underground powerhouse cavern. Eng. Fail. Anal. 2018, 90, 290–309. [Google Scholar] [CrossRef]
  27. Rajabi, M.; Rahmannejad, R.; Rezaei, M. Studying the deformation and stability of rock mass surrounding the power station caverns using NA and GEP models. Struct. Eng. Mech. 2021, 79, 35–50. [Google Scholar]
  28. Rezaei, M.; Rajabi, M. Assessment of plastic zones surrounding the power station cavern using numerical, fuzzy and statistical models. Eng. Comput. 2021, 37, 1499–1518. [Google Scholar] [CrossRef]
  29. Yumlu, M.; Ozbay, M. A study of the behaviour of brittle rocks under plane strain and triaxial loading conditions. Int. J. Rock Mech. Min. Geomech. Abstr. 1995, 32, 725–733. [Google Scholar] [CrossRef]
  30. Ahrens, T.; Rubin, A. Impact-induced tensional failure in rock. J. Geophys. Res.-Planet 1993, 98, 1185–1203. [Google Scholar] [CrossRef] [Green Version]
  31. Chen, J.H.; Zhang, J.S.; Li, X.P. Model of rock blasting-induced damage considering integrity of rock mass and its application. Rock Soil Mech. 2016, 38, 857–866. [Google Scholar]
  32. Cao, R.; He, S.; Wei, J.; Wang, F. Study of modified statistical damage softening constitutive model for rock considering residual strength. Rock Soil Mech. 2013, 34, 1652–1660. [Google Scholar]
  33. Lewis, B.A. Manual for LS-DYNA Soil Material Model 143; US Federal Highway Administration: Washington, DC, USA, 2014. [Google Scholar]
  34. Zhang, Y.; Yang, G.; Liu, P.; Yao, J.; Jiang, Y. An equivalent approach for acting blasting load in dynamic numerical simulation of blasting vibration. Chin. J. Undergr. Space Eng. 2012, 8, 56–64. [Google Scholar]
  35. Xu, H.; Lu, W.; Zhou, X. An equivalent approach for acting blasting load in dynamic finite element simulation of blasting vibration. Eng. J. Wuhan Univ. 2008, 41, 67–71. [Google Scholar]
Figure 1. Coupling between the Cowper-Symonds hardening model and the proposed damage model.
Applsci 12 09875 g001
Figure 2. Stress-strain curve and damage-strain curve (strain rate = 100 s−1).
Applsci 12 09875 g002
Figure 3. Stress-strain curves under different strain rates simulated using the proposed model.
Applsci 12 09875 g003
Figure 4. Relationship between damage modification coefficient and stress-strain curve.
Applsci 12 09875 g004
Figure 5. Relationship between initial damage and stress-strain curve at strain rate 100 s−1.
Applsci 12 09875 g005
Figure 6. Model cross-section dimension diagram (unit: m).
Applsci 12 09875 g006
Figure 7. Schematic diagram of triangular blasting load.
Applsci 12 09875 g007
Figure 8. Blast-hole layout diagram of drilling and blasting pattern.
Applsci 12 09875 g008
Figure 9. Monitoring points of rock blasting damage beneath the box culvert.
Applsci 12 09875 g009
Figure 10. Blasting damage diagram of surrounding rock (d = 1 m). (a) three-dimensional blasting damage diagram. (b) cross-section blasting damage diagram.
Applsci 12 09875 g010
Figure 11. Blasting damage diagram of surrounding rock (d = 2 m). (a) three-dimensional blasting damage diagram. (b) cross-section blasting damage diagram.
Applsci 12 09875 g011
Figure 12. Blasting damage diagram of surrounding rock (d = 3 m). (a) three-dimensional blasting damage diagram. (b) cross-section blasting damage diagram.
Applsci 12 09875 g012
Figure 13. Blasting damage diagram of surrounding rock (d = 4 m). (a) three-dimensional blasting damage diagram. (b) cross-section blasting damage diagram.
Applsci 12 09875 g013
Figure 14. Rock damage degree variation of different monitoring points with d.
Applsci 12 09875 g014
Figure 15. Damage degree variation of surrounding rock beneath the box culvert with d.
Applsci 12 09875 g015
Table 1. Main calculation parameters of rock in uniaxial compression test [7].
E (GPa) ν σ 0 (MPa) αβ θ c
51.80.332153.15 × 1061.00.0002
Table 2. Main calculation parameters of rock [7,9].
ρ /kg/m3E/GPa ν σ 0 /MPa E tan /GPa C
/s−1
Pαβ δ
2600300.27100502.54.03.15 × 1061.00.9
Table 3. Explosive parameters.
Type of Explosive ρ e (kg/m3)V (m/s)
2# rock emulsion explosive9503500
Publisher’s Note: MDPI stays neutral with regard to jurisdictional claims in published maps and institutional affiliations.

