Article

Piezoelectric-Based Sensor Concept and Design with Machine Learning-Enabled Using COMSOL Multiphysics

1
College of Engineering and Technology, American University of the Middle East, Egaila 54200, Kuwait
2
Faculty of Science III, Lebanese University, Tripoli 90656, Lebanon
*
Author to whom correspondence should be addressed.
Appl. Sci. 2022, 12(19), 9798; https://doi.org/10.3390/app12199798
Submission received: 3 September 2022 / Revised: 25 September 2022 / Accepted: 26 September 2022 / Published: 29 September 2022

Abstract

:
This paper presents the concept and design of a system that embeds piezoelectric sensors to measure the voltage of a mechanical load applied to it. COMSOL Multiphysics, a finite element simulation tool, was used to design the system and analyze the data to find a possible fingerprint of voltage changes. The sensors’ voltage readings were affected by the load applied to the surface of the structure with different magnitudes and speeds. The analyzed data show the effect of position and mass on the voltage readings and indicates the possibility of speed prediction. The obtained dataset results validated the concept of the proposed system, where the collected data can serve as a digital data pipeline model for future research on different artificial intelligence (AI) or machine learning (ML) modeling applications. From the obtained data, a reasonable view shows that voltage reading matrices can be utilized for the detection of vehicle speed, location, and mass if used as training data for machine learning modeling, which can benefit the Internet of Things (IoT) technology.

1. Introduction

Piezo technology is becoming essential in a world of smart devices that require the use of vibration sensors used in consumer electronics, automotive industries, architectural design, and other sectors where their extensive range of functionality extends to areas such as safety, fitness tracking, touch-free interaction [1], structural health monitoring [2], near-surface water detection in soils [3], air quality monitoring [4], food quality control [5], and energy harvesting applications [6,7]. With the rise of technology, piezoelectric sensors are of utmost importance for a wide range of applications, such as skin-attachable devices for health monitoring and the detection of diseases.
Piezoelectricity, a physical phenomenon known for decades, is defined as certain materials’ ability to produce electric signals when mechanically stressed or conversely deform in the presence of electric potential. Many materials have been used in piezoelectricity. The most popular material is the perovskite structured (Pb[Zr(x)Ti(1−x)]O3) (PZT) [8], utilized for a wide range of applications in electromechanical sensors, actuators, and transducers. The polymer structured material, poly-vinylidene fluoride (PVDF), a viable alternative to PZT in wearable or implantable devices [9,10], is also widely used in piezoelectricity. Studying piezoelectric systems is typically performed through experiments along with analytical and numerical approaches [11]. One of the most prominent numerical techniques that is vastly used in all major engineering industries is the finite element method (FEM). FEM enables the simulation and modeling of electromechanical coupling for the great majority of complicated geometries that cannot be handled with analytical approaches since it can accommodate the complete elements of multilayered structures and approximate the genuine solution to multiphysics systems. This way has been used to study a piezoelectric bridge transducer for energy harvesters utilizing the dissipated kinetic energy from traffic loads on roadways [12]. Another study used a finite element modeling approach to investigate the effectiveness of piezoelectric energy harvesters from asphalt pavements under various loads, various temperatures, buried depths, and traffic speeds [13].
COMSOL Multiphysics, the reliable finite element modeling tool, is comprised of many “Multiphysics” modules and is designed for research that spans multiple disciplines. The detailed design and flexibility to select various materials built-in in the software allow scientists and engineers to simulate different research topics in different applications before manufacturing, such as microscopy probes [14,15], toxic gas absorption [16], piezoelectric and piezoresistive pressure sensors, optimization, and comparative studies [14,17]. COMSOL is commonly used in piezoelectricity studies for sensing and energy harvesting applications such as bridge health monitoring [18], railway tracks [19], MEMS-based piezoelectric acoustic sensors [20], and others, using different materials. Sivakumar et al. revealed the static analysis of a 10-layered PZT-5H smart structure-based cantilever beam by studying the structure deformation and deflection direction [21]. Other work proposed a multi-layer structure-based sensor to study and enhance its electromechanical behavior [22,23]. Different materials such as Polyvinylidene fluoride (PVDF) and Polydimethylsiloxane (PDMS) are also used in different designs for different applications (at-home breath monitoring of COVID-19 virus patients [24], nanodevice development [25], and tactile sensors [26]). Many other works have also developed their research on energy harvesting proposing a variety of materials such as PFCB W14 [27], PZT-4, PZT-5A, PZT-5J, PZT-7A [28], ZnO, ZnS, BGO [26,29].
Even though recent research works are developing piezo technology in a variety of applications by using a wide range of materials [30,31,32,33,34,35,36,37], we are presenting a new approach in the piezo technology systems that functions as a data pipeline for future research on a variety of artificial intelligence (AI) or machine learning (ML) modeling applications. This method integrates COMSOL’s electromechanical principles with machine learning. An intelligent Piezoelectric-based wearable system for estimating calorie intake using ML was developed by [31]. However, our proposed research methodology and study details are distinct from theirs.
The results of this study show that a load’s speed, location, and mass may be deduced from voltage measurement matrices. When compared to on-site data collection, the time and money saved by using simulated data are substantial. The use of COMSOL Multiphysics in the planning stages of constructing a digital data pipeline for a smart sensor design is of critical relevance to the development of AI and ML in the future. Further studies [38,39,40] extend and provide specifics on many structural design characteristics, such as load mass, speed, and piezo sensor dimension, all of which are crucial to developing an effective ML/AI modeling pipeline for utilizing the data. Our proposed model architecture is comprised of several piezo sensors that measure the voltage produced by a variation in the speed and mass of a load’s pressure on the system. This makes it possible to figure out the mass of a load and how fast it is moving.

2. Design and Methodology

In the first part of this section, the sensor concept and design, and the physics interfaces employed in the simulation study using COMSOL Multiphysics are presented showing the different parameters and equations to be defined in the study. The importance and effect of the mesh size and structure are demonstrated through a validation study provided in the second part. In the third part of this section, we look at the study method used to gather the data that will be used in the machine learning analysis.

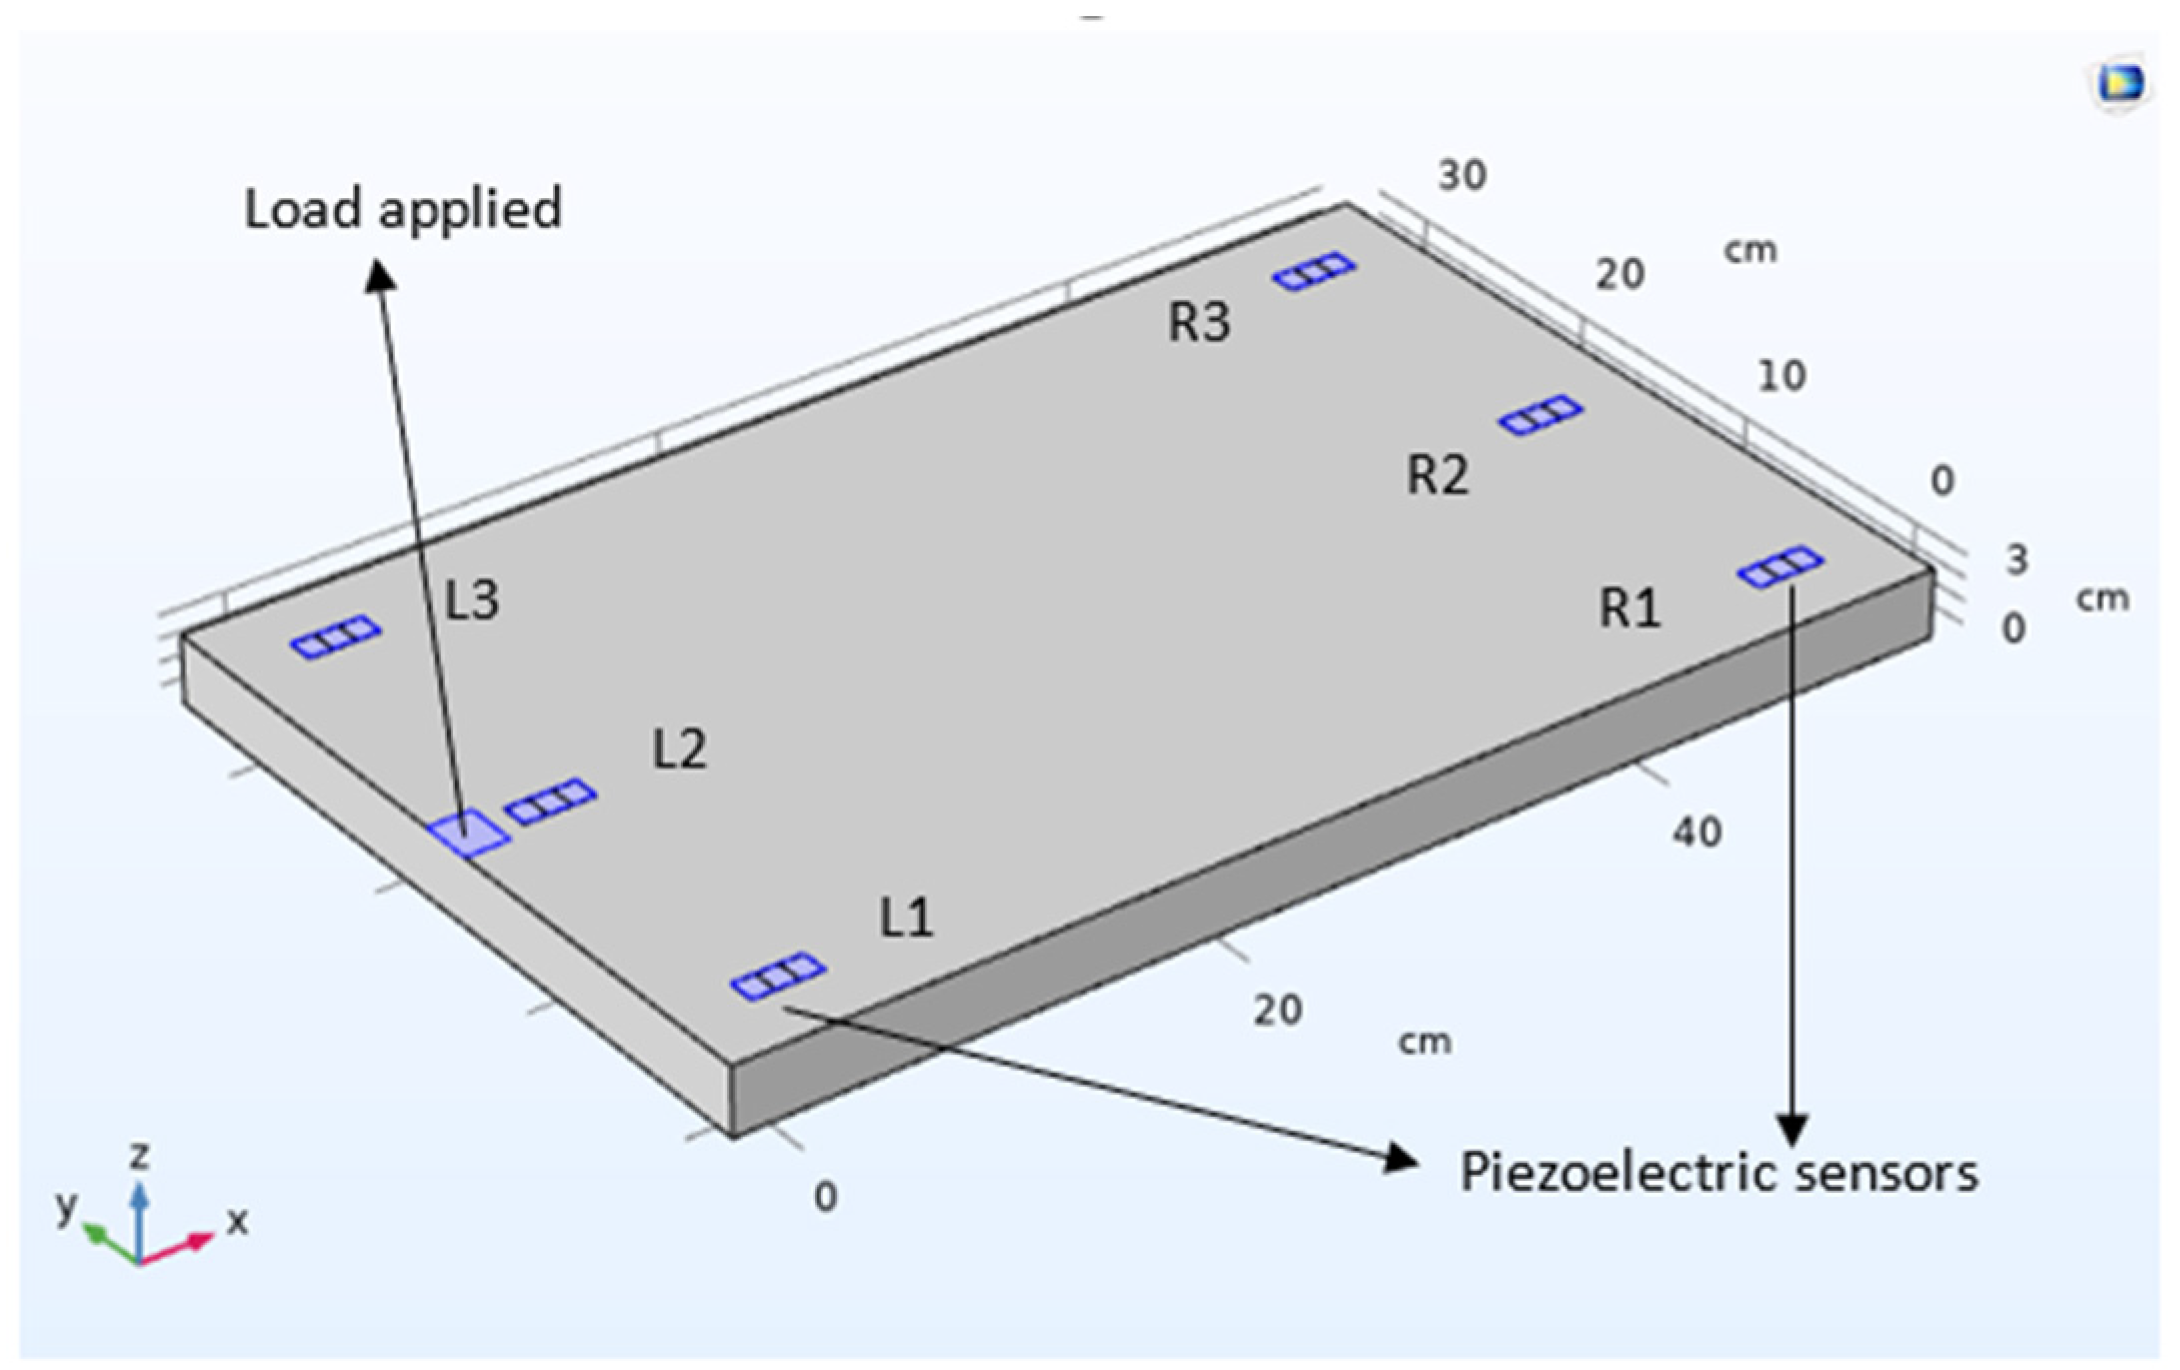
2.1. Structure Design

The structural design and mechanical stress-induced voltage measurements are all performed in COMSOL Multiphysics. The design structure has a length of 50 cm, a width of 30 cm, and a thickness of 3 cm where 6 piezoelectric sensors are distributed equidistantly all over the structure as follows: 3 sensors to the right side of the structure and 3 sensors to the left (Figure 1). The structure and the sensors are made of wood and Lead Zirconate Titanate (PZT-5H) (piezoelectric material), respectively. The sensor design is brought from a commercial sensor of dimensions 3.18 cm length, 1.27 cm width, and 0.51 mm thickness. A rectangular shape of 2 cm length, and 2.5 cm width is defined on the surface of the structure to simulate the surface contact of the load to be applied. Thus, the 6 sensors measure the potential difference (voltage) for each change in the load magnitude and position.
Two physics interfaces have been defined through COMSOL study, solid mechanics, and electrostatics. A multiphysics node is added to couple the two interfaces and studies the piezoelectric effect.
Solving the equations of motion and constructing a parametric model of a solid material are the foundations of solid mechanics interface. Results such as displacement, stress, and strain are computed. In this interface, the two external boundaries of the structure along the x-axis are defined as fixed constraints, and the rectangular shape on the structure surface is defined as boundary load where a gravitational force towards the negative z-axis is applied F = m g   and stress can be deducted as follows (Equation (3)):
T = F A
where T and A are the stress and the structure surface area, respectively.
The electrostatics interface is computing the electric displacement field and potential distributions in dielectrics under conditions. In this interface, the domains identifying the sensors are defined as charge conservation. The relative permittivity value from the “piezoelectric material node” in the solid mechanics interface is substituted into the “charge conservation node” in the electrostatics interface using the Multiphysics node. Piezoelectric effect is a term used to describe the change in electric polarization that occurs in piezoelectric sensor material under mechanical stress. Because of this stress-induced polarization shift, an apparent potential difference can be observed throughout the material (Equations (2) and (3)).
T = C E S e T E
D = e S + ε S E
where T ,   S ,   D and E are the stress, strain, electric displacement, and electric field, respectively. The material properties   C E , e and ε S correspond to the elasticity, coupling, and permittivity matrices.

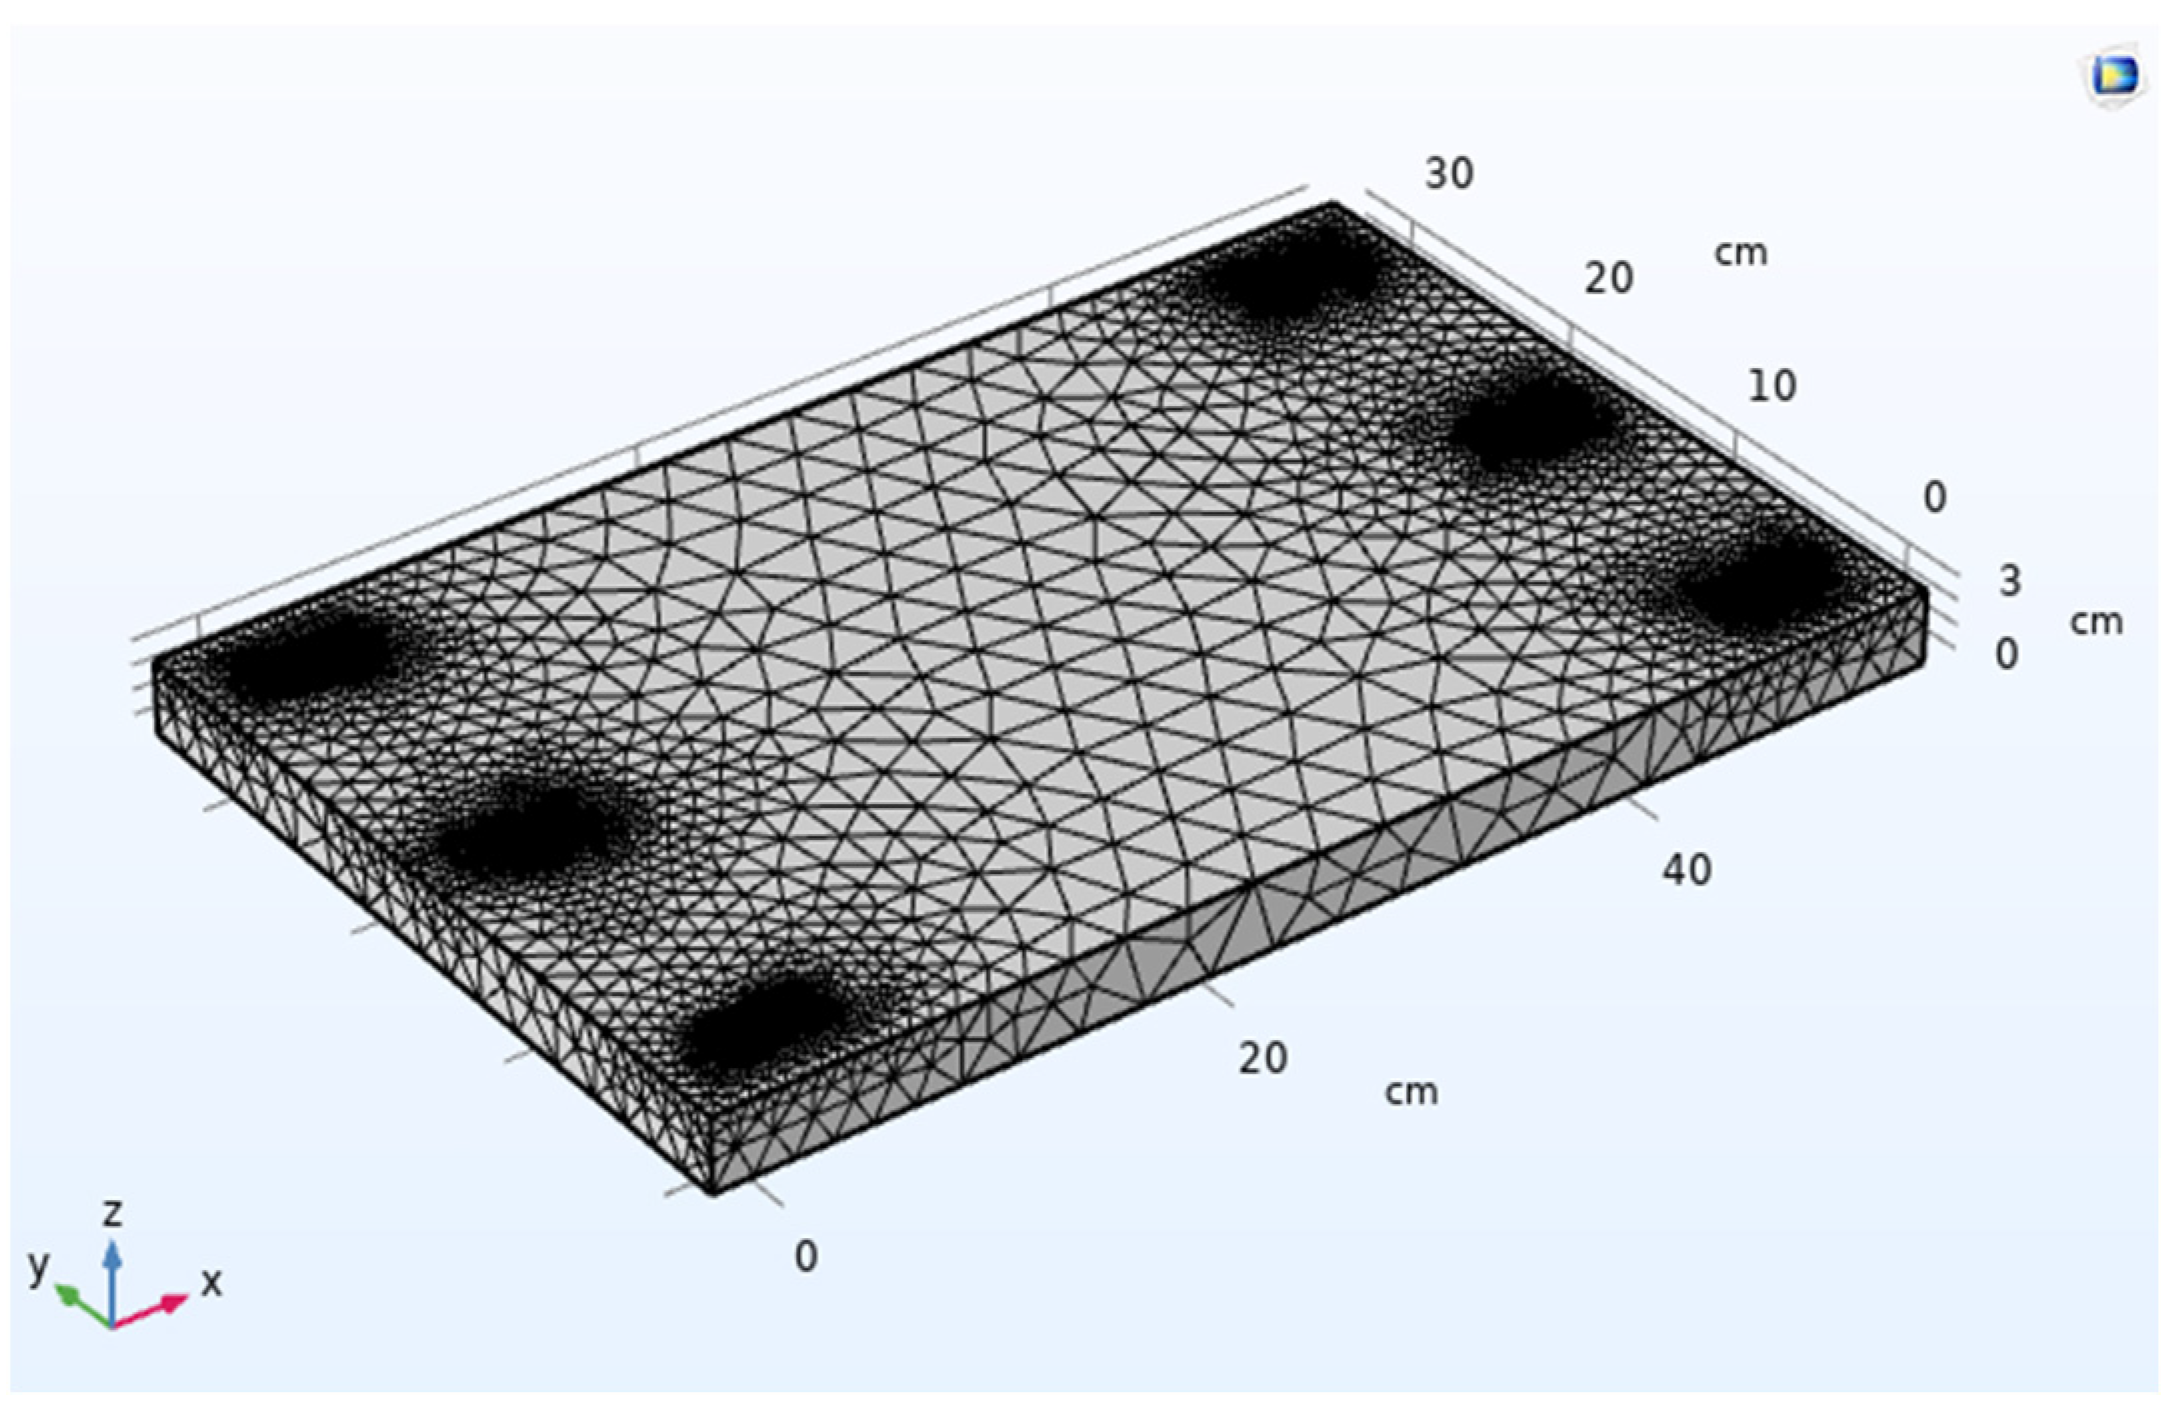
2.2. Mesh and Study Validation

Since there is a discrepancy in the structure design dimensions (from 0.5 mm (minimum side size) to 50 cm (maximum side size)), a custom mesh is used in the study to ensure accurate results. The minimum and maximum element sizes are set to 0.1 and 2 cm, respectively. Other element size parameters are important to mention such as the maximum element growth rate of 1.4, a curvature factor of 0.4, and a resolution of narrow regions of 0.7. A smooth transition to interior mesh is selected and the number of boundary layers is defined to be 15 with a factor of 1.2. A high-quality mesh and reliable outcomes are guaranteed by the specified element size and boundary layer parameters. (Figure 2). Seven mesh studies with varying qualities are developed and simulation data are collected for each study for a fixed load magnitude and position to assess mesh quality and simulation accuracy. The study’s parameters details are shown in Table 1.
The values of the potential difference measured by the sensors L2 and R2 are given in Figure 3. One can notice that the voltage values for each of these sensors are fluctuating for Studies 1 to 4 with an average error of 23.35%. However, in Studies 6 and 7, the voltage values of each sensor are converging to the same result with an average error of 1.1%. Considering this, we can verify the simulation outcomes based on the parameters established in Studies 6 and 7. We then proceed with our study using the same mesh parameters as in Study 6.

2.3. Methodology

The simulation study comprises of applying loads of varying magnitudes, from 40 kg to 60 kg in 5 kg increments, to the surface of the structure. As our simulation study is set as stationary, the definition of the speed is correlated to the distance and time dependency. A load moving with a speed of 0.5 m/s for example, with a time step of 0.1 s, corresponds to a shift of the load position by 5 cm step until reaching the structure end. This corresponds to 11 contact points. To cover different speed readings, the load is defined to move on the structure’s central x-axis by a 2.5 cm distance step until reaching the structure end. The voltage measured by the piezoelectric sensors is denoted for each of these changes of mass and position.

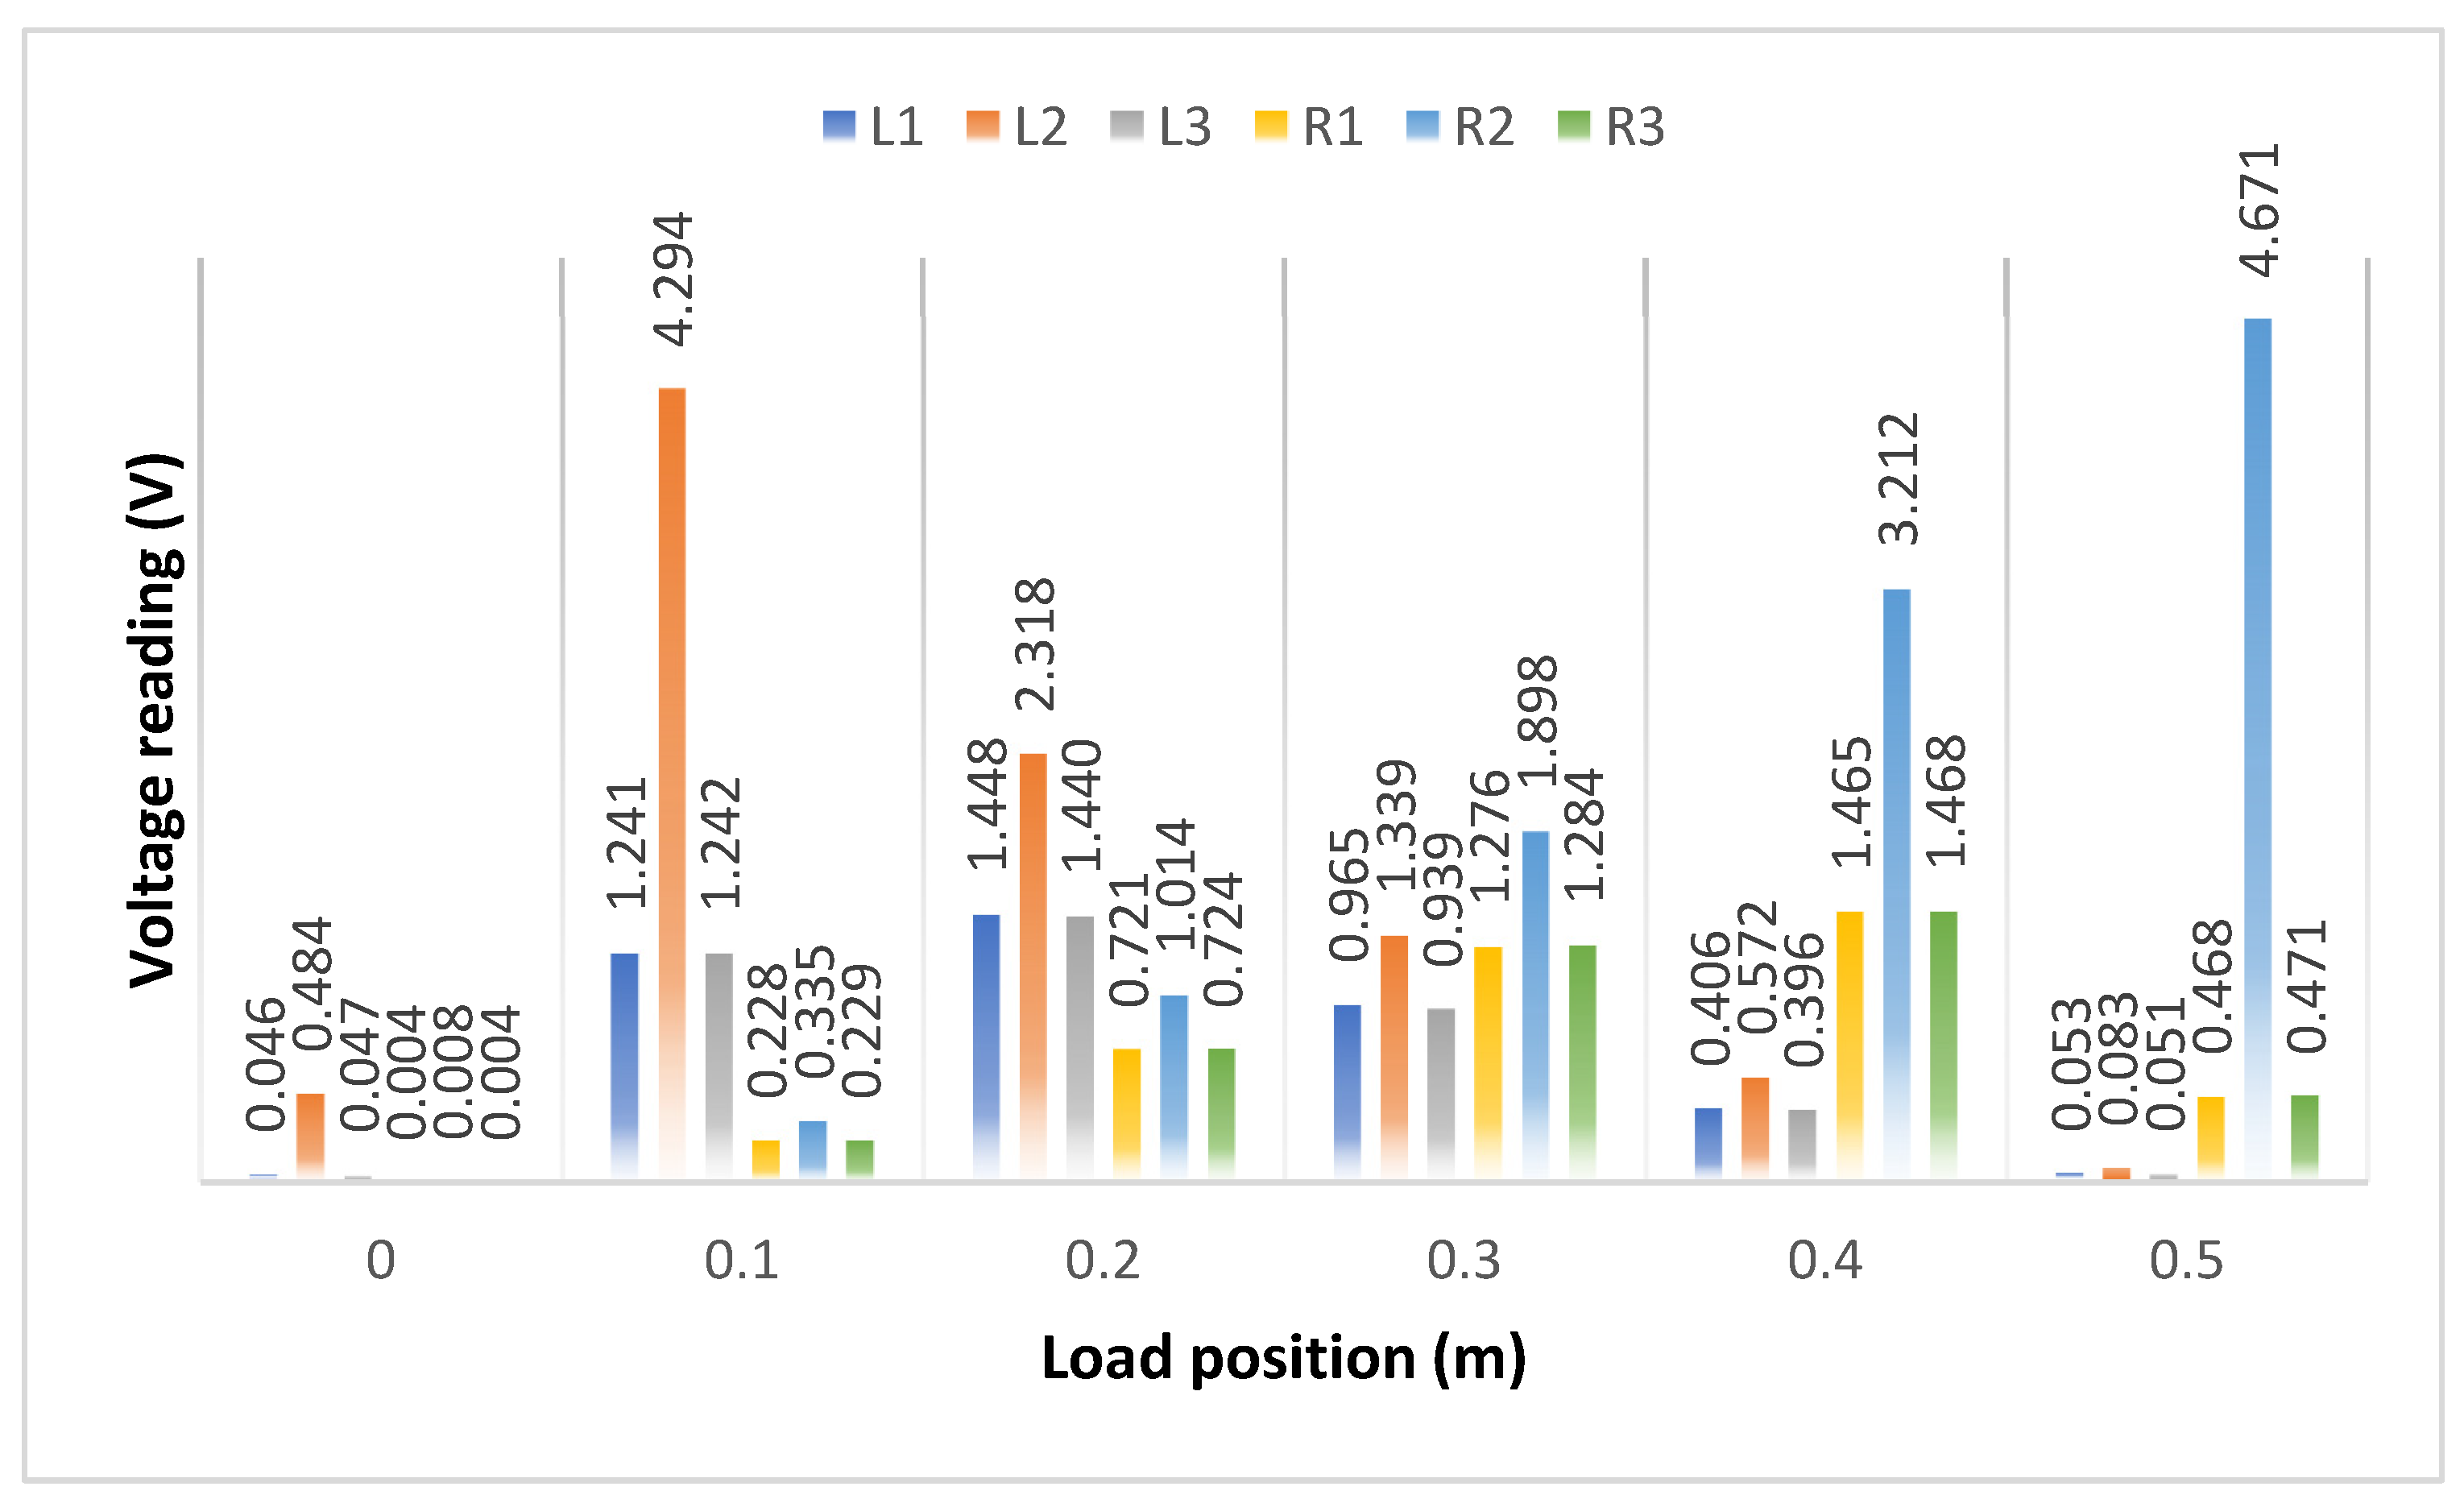
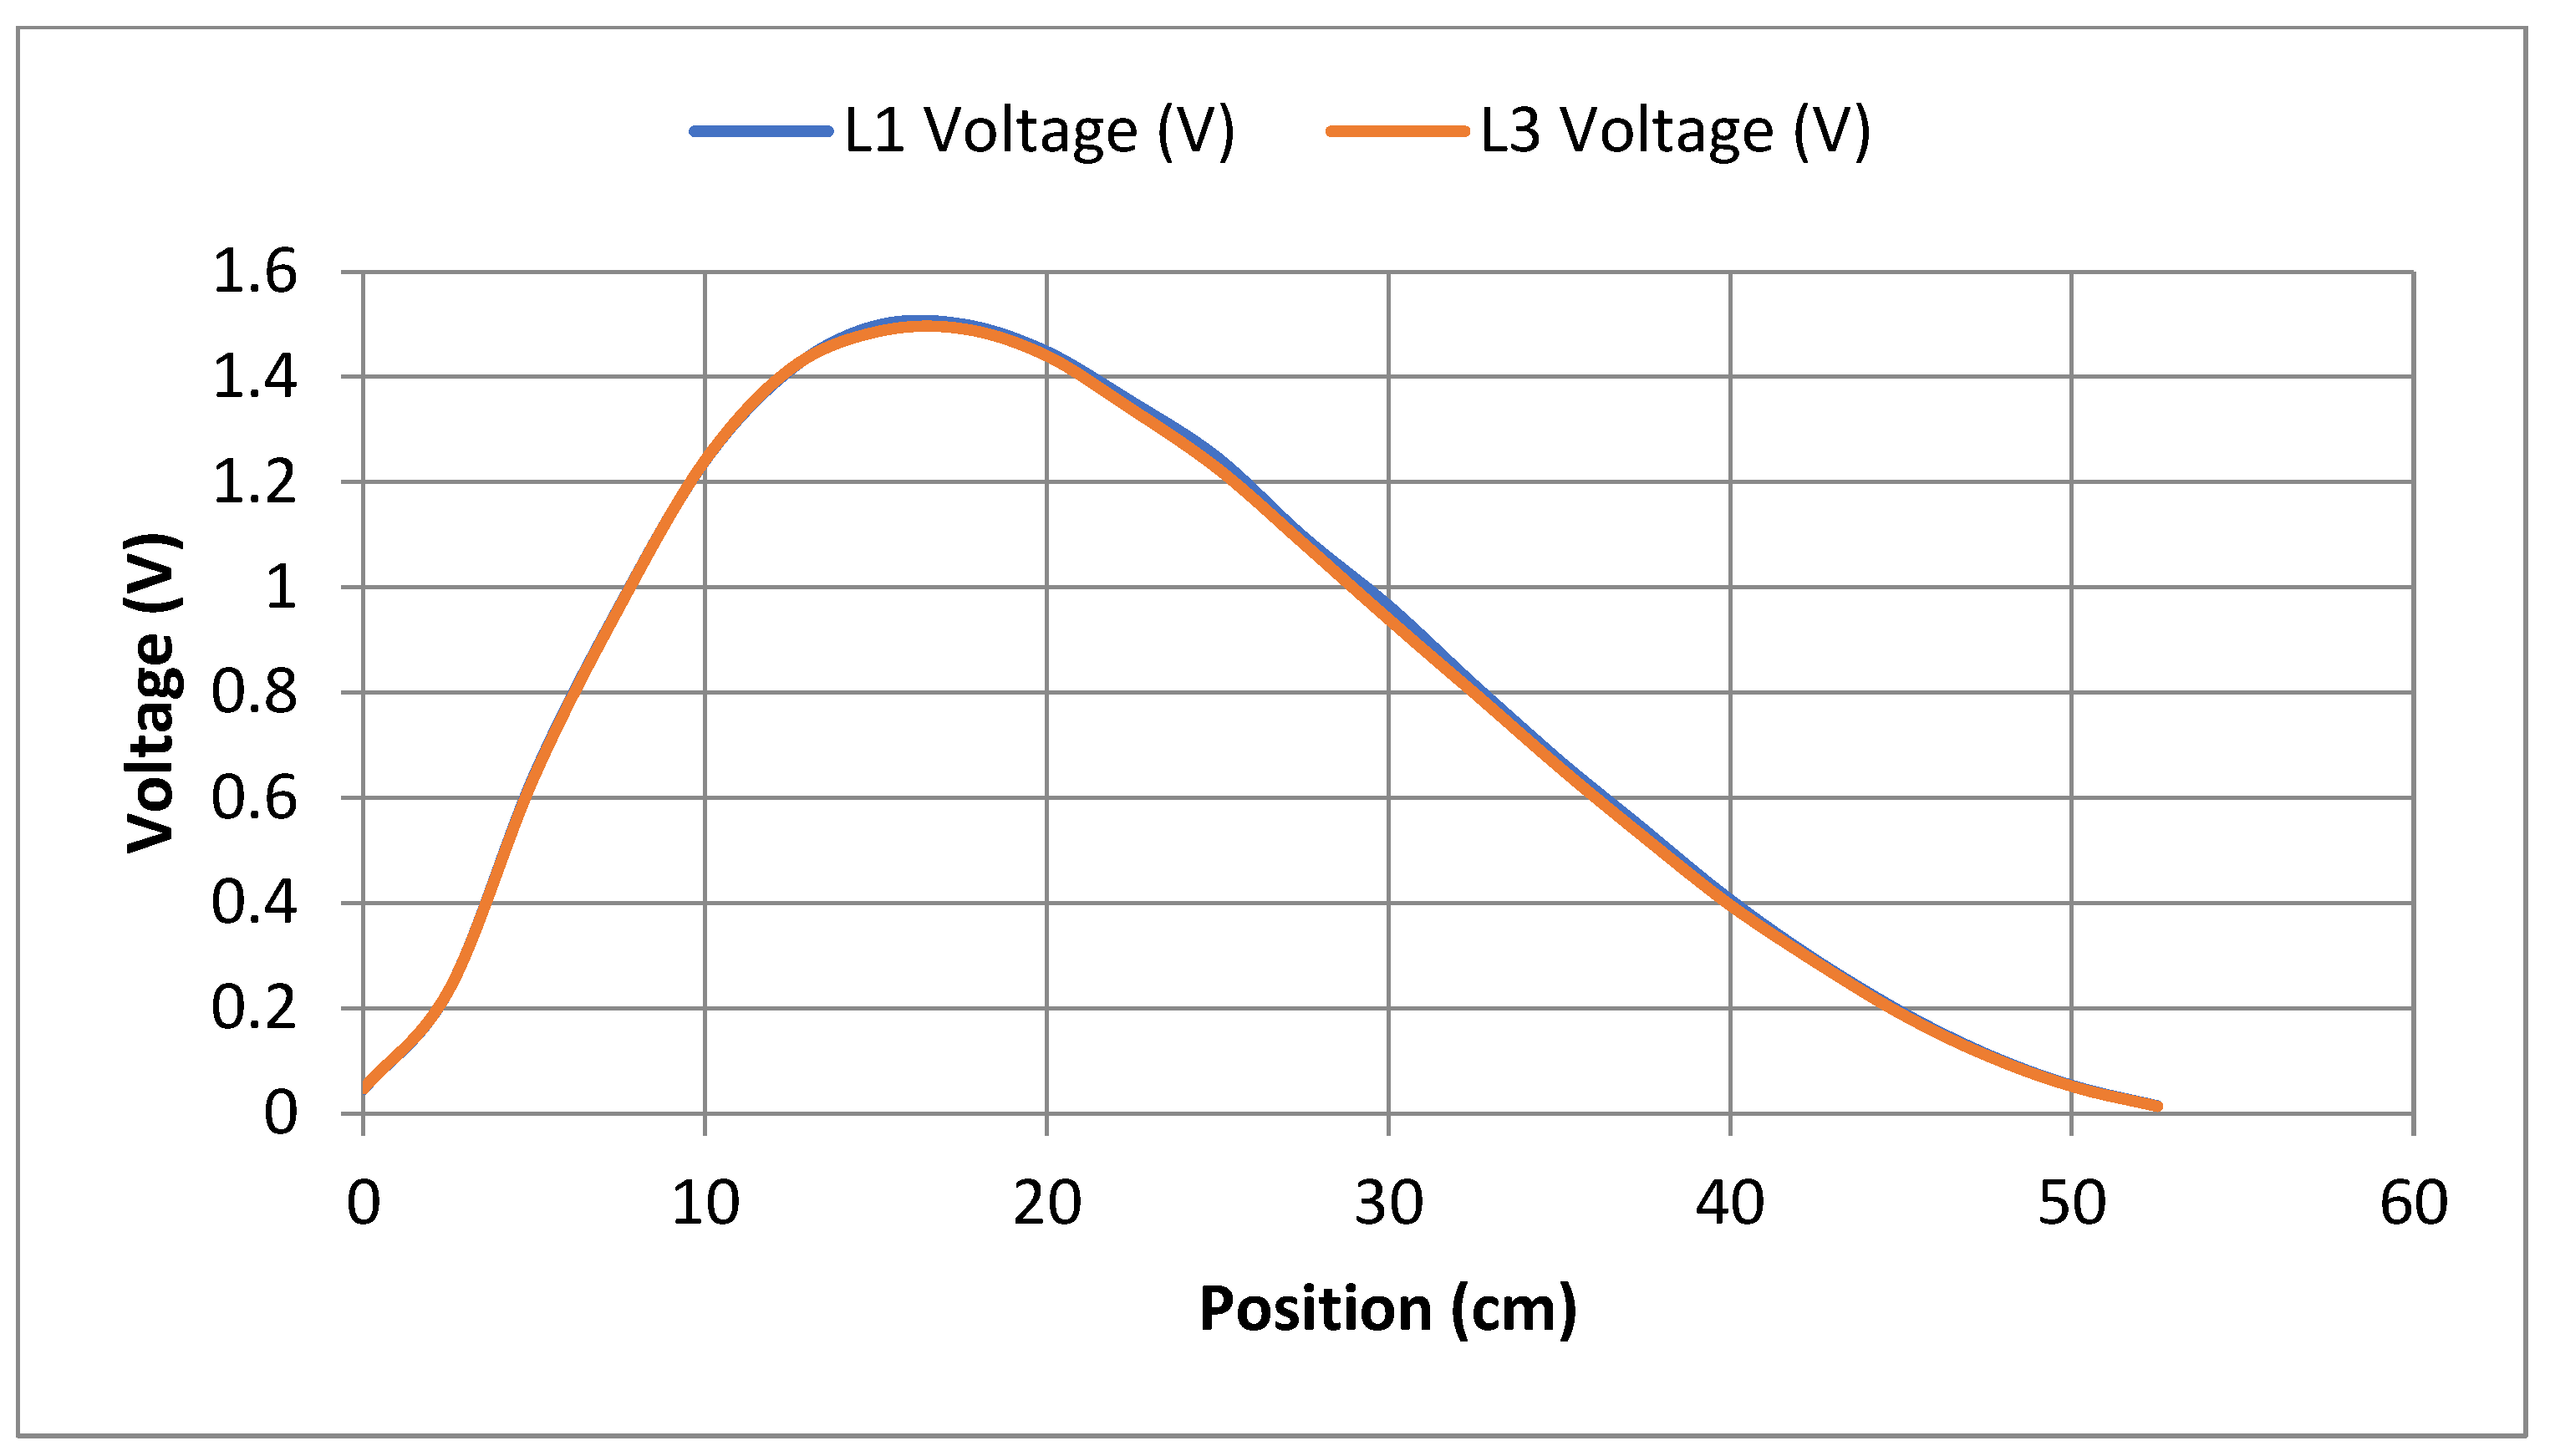
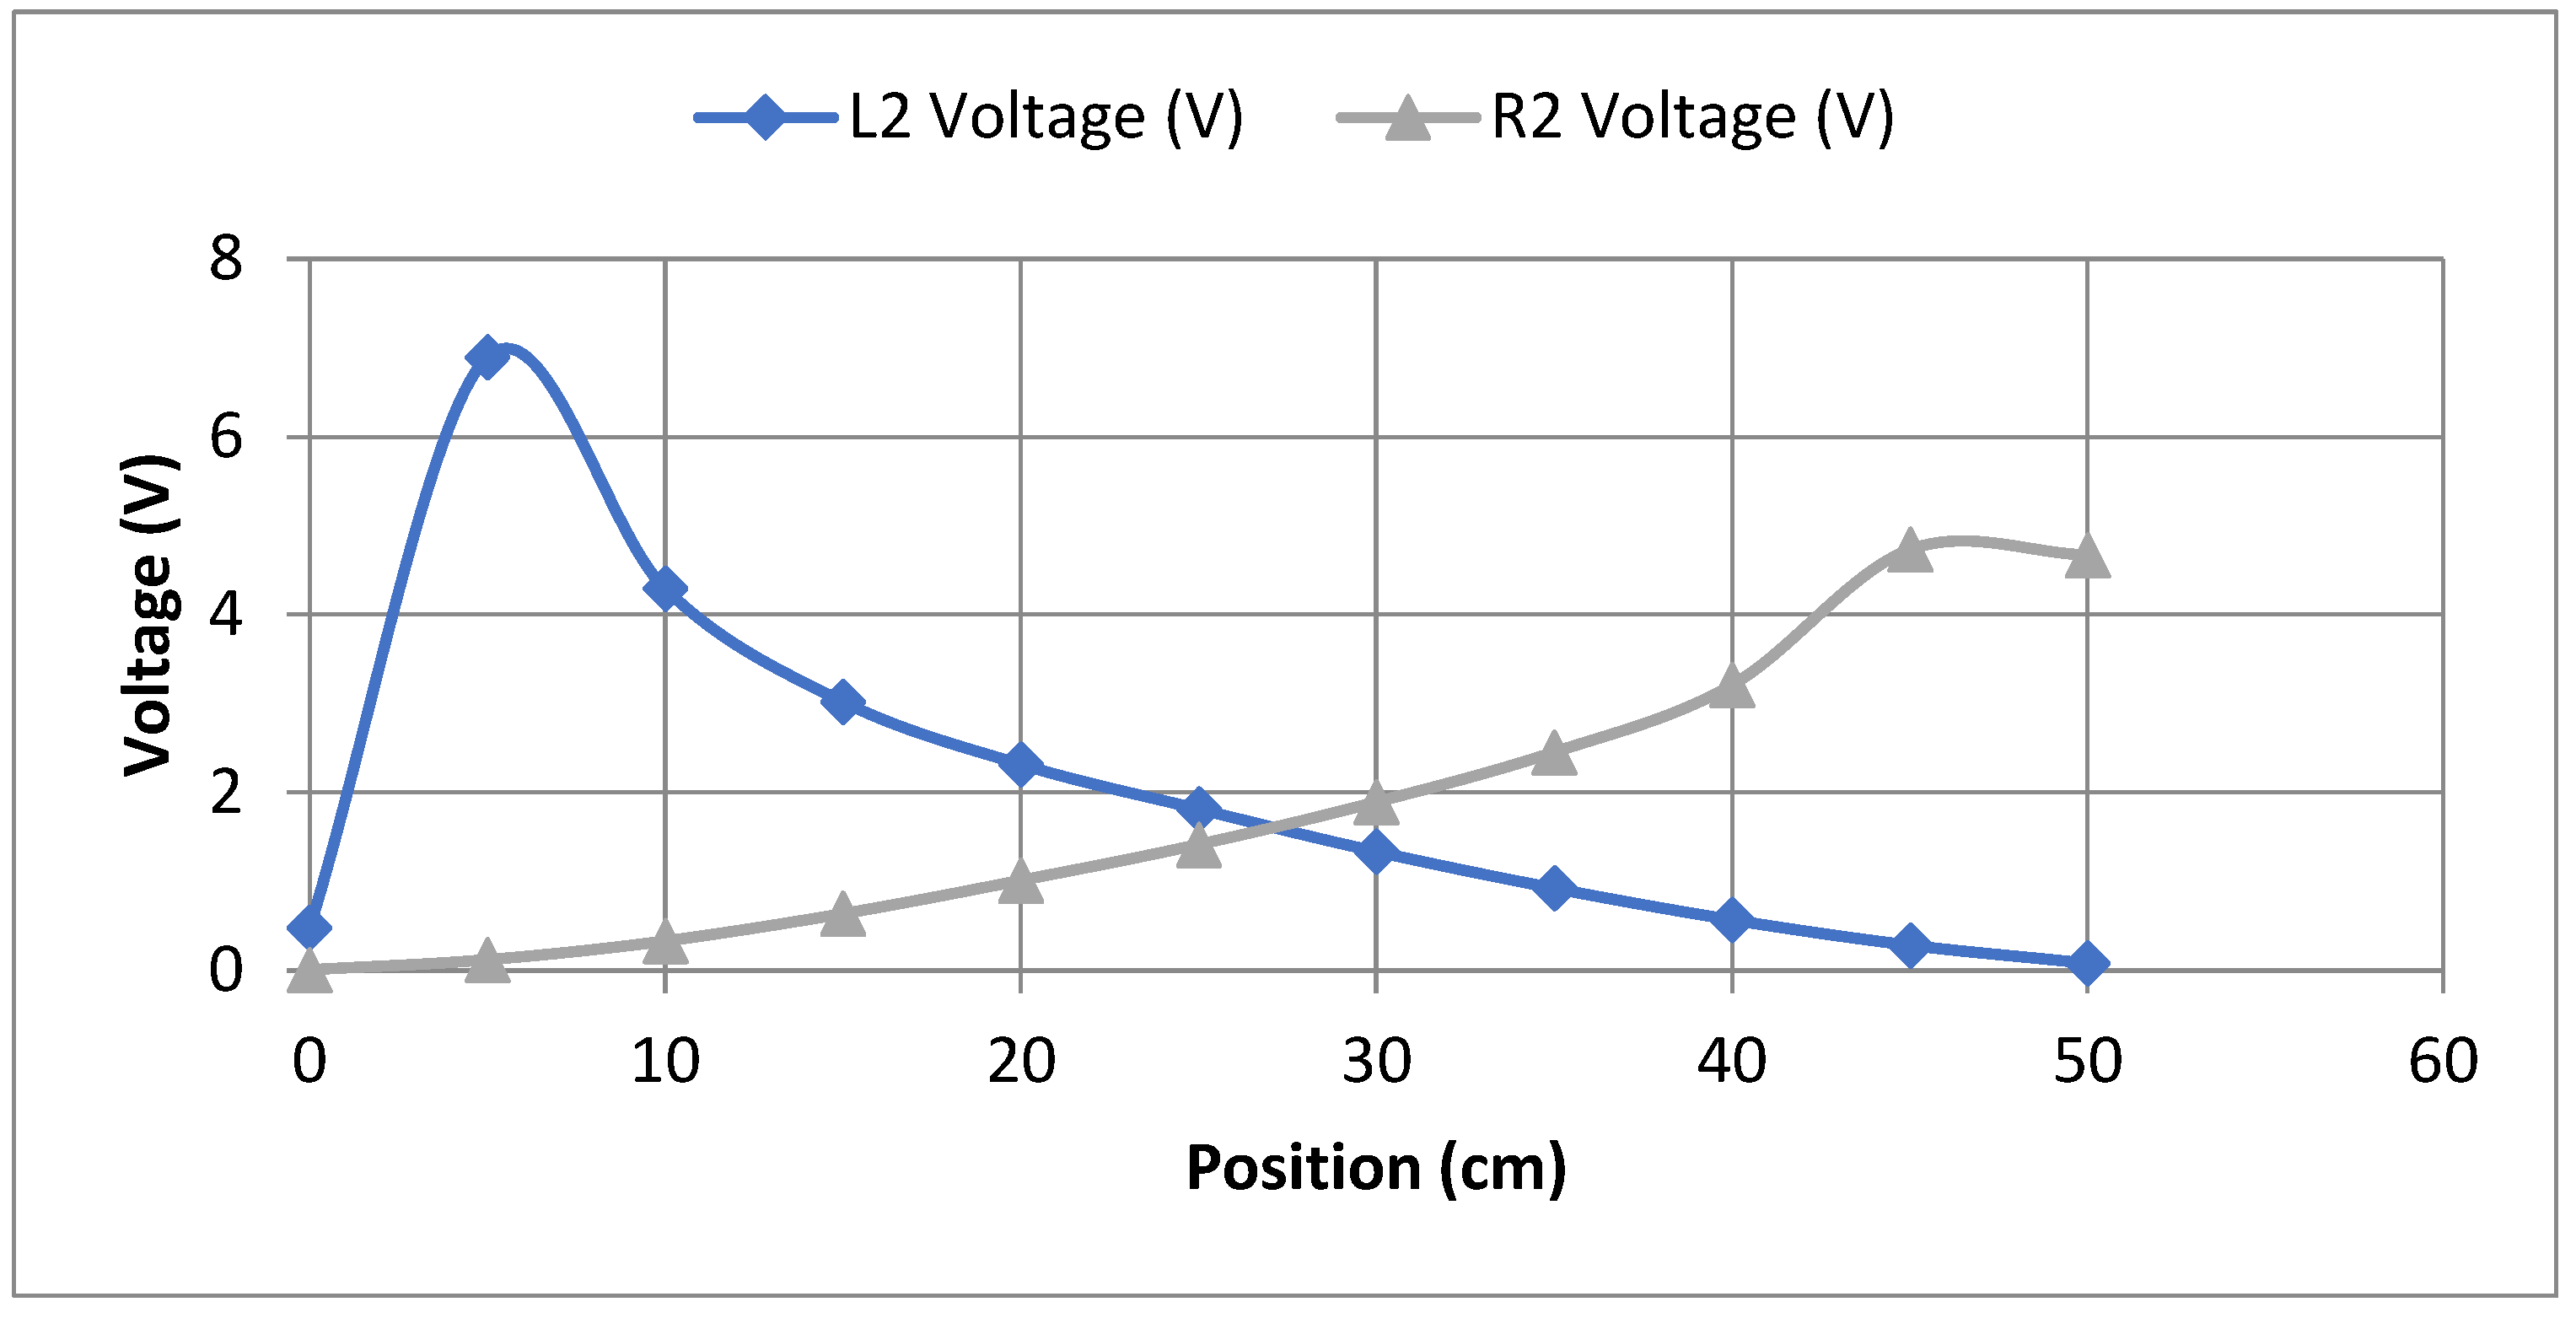
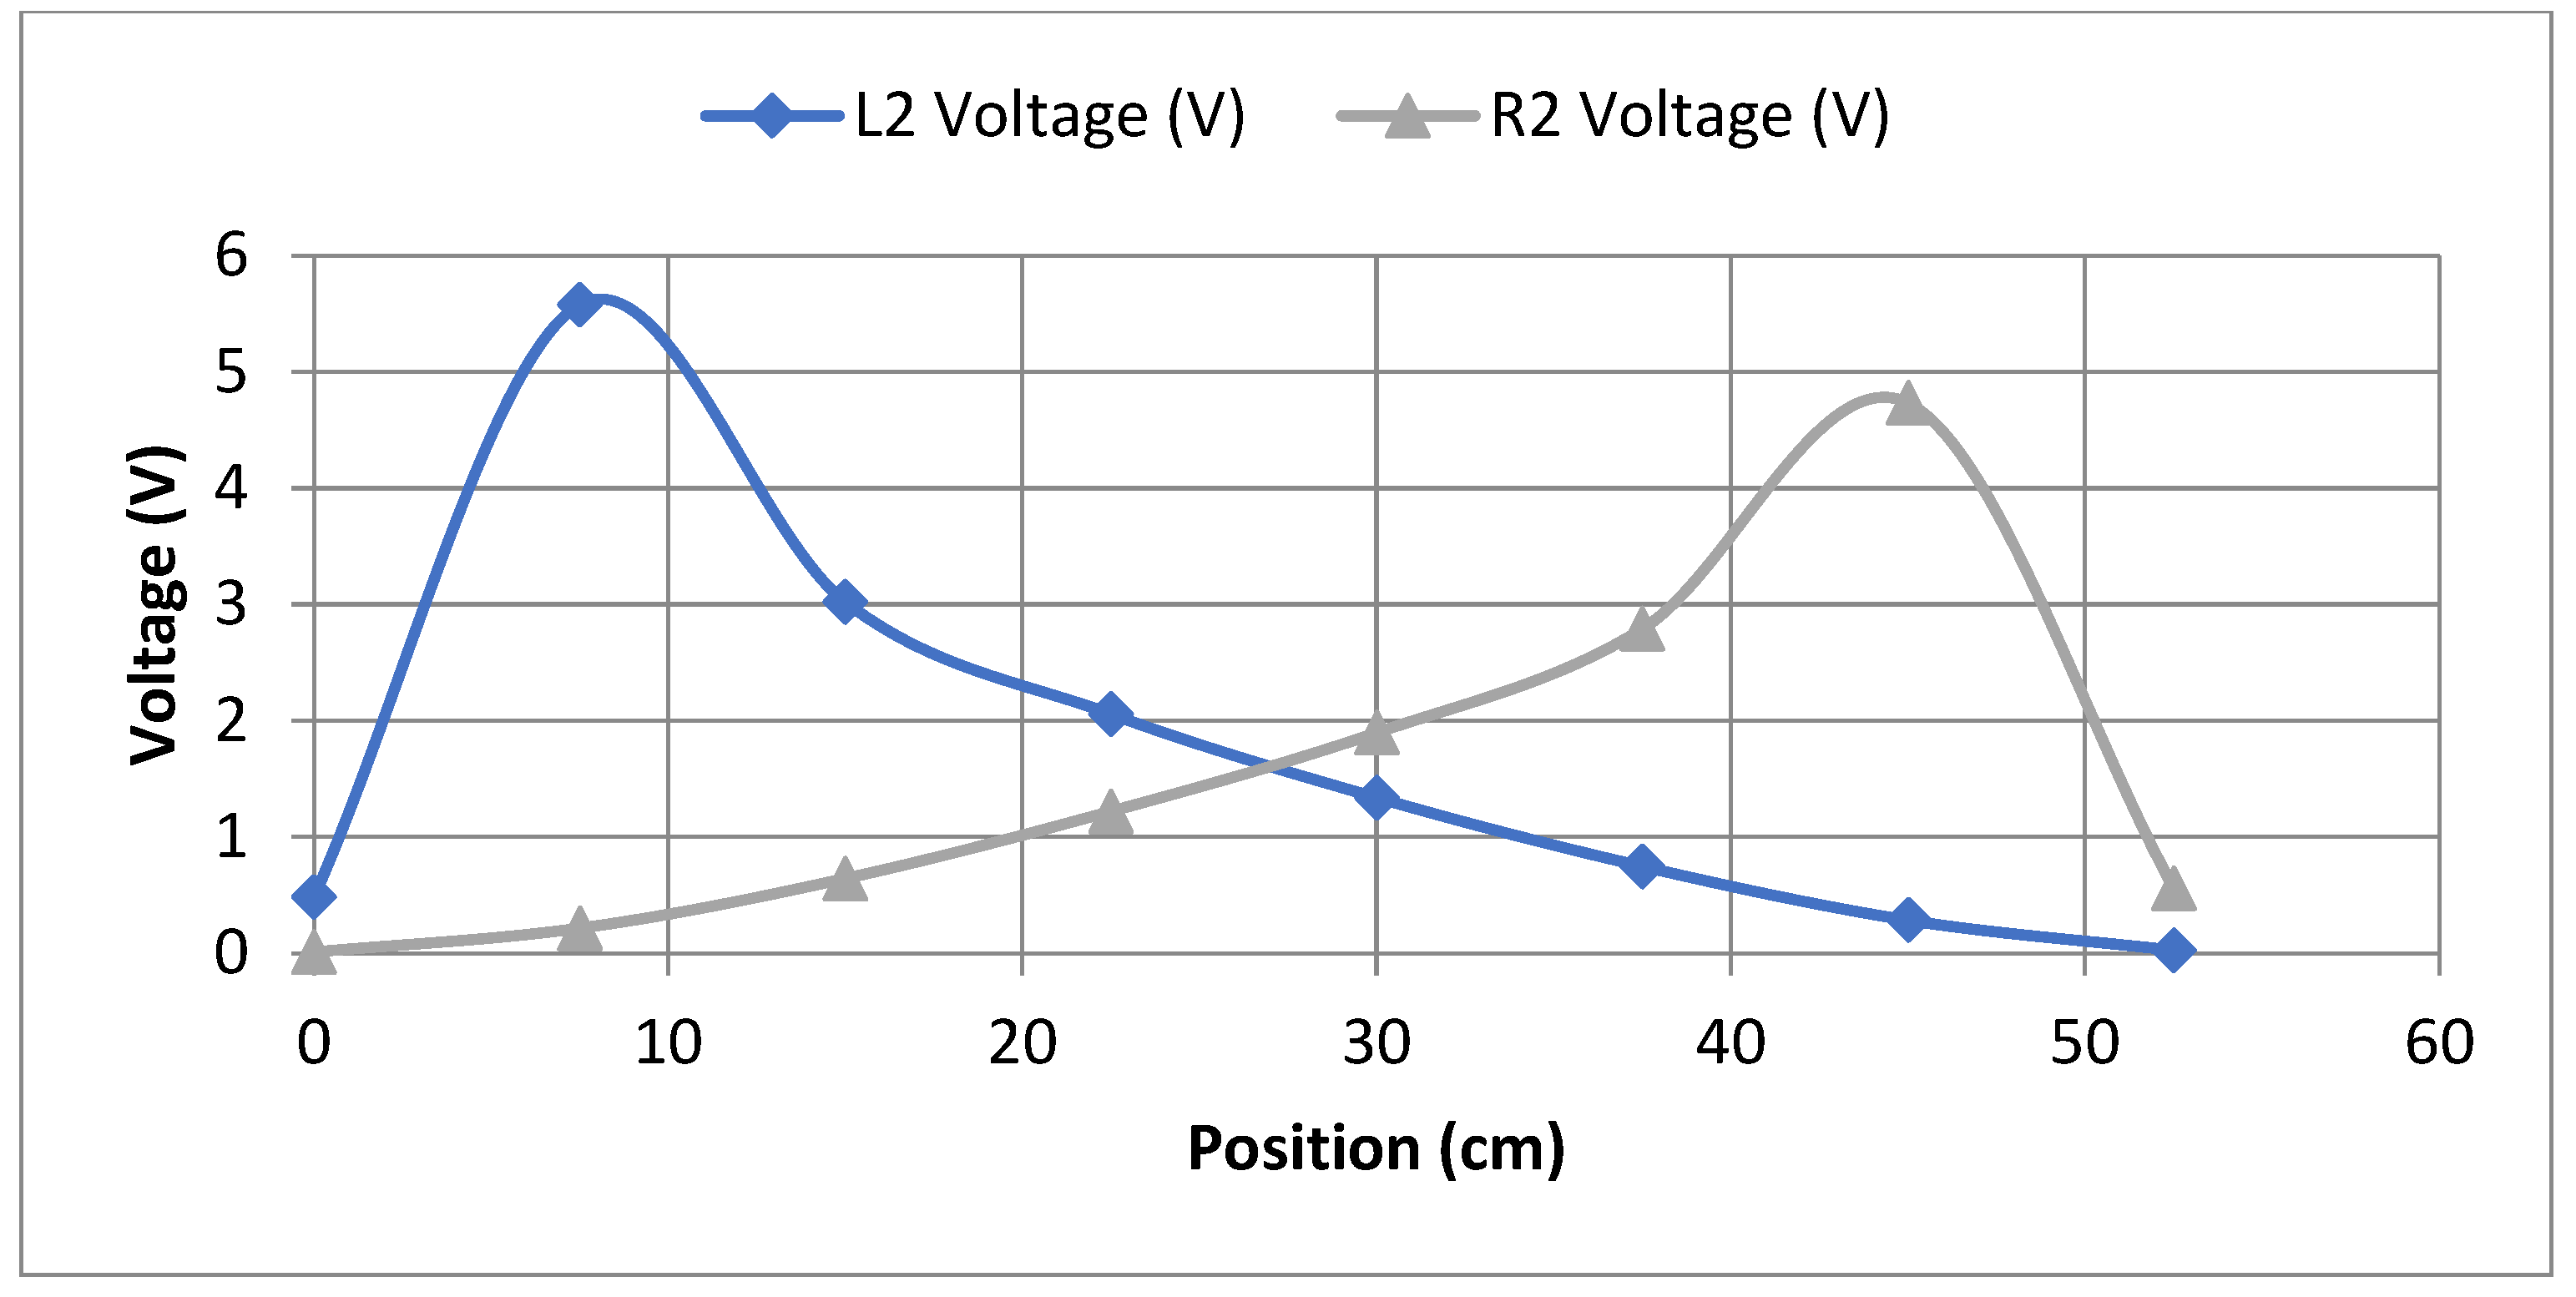
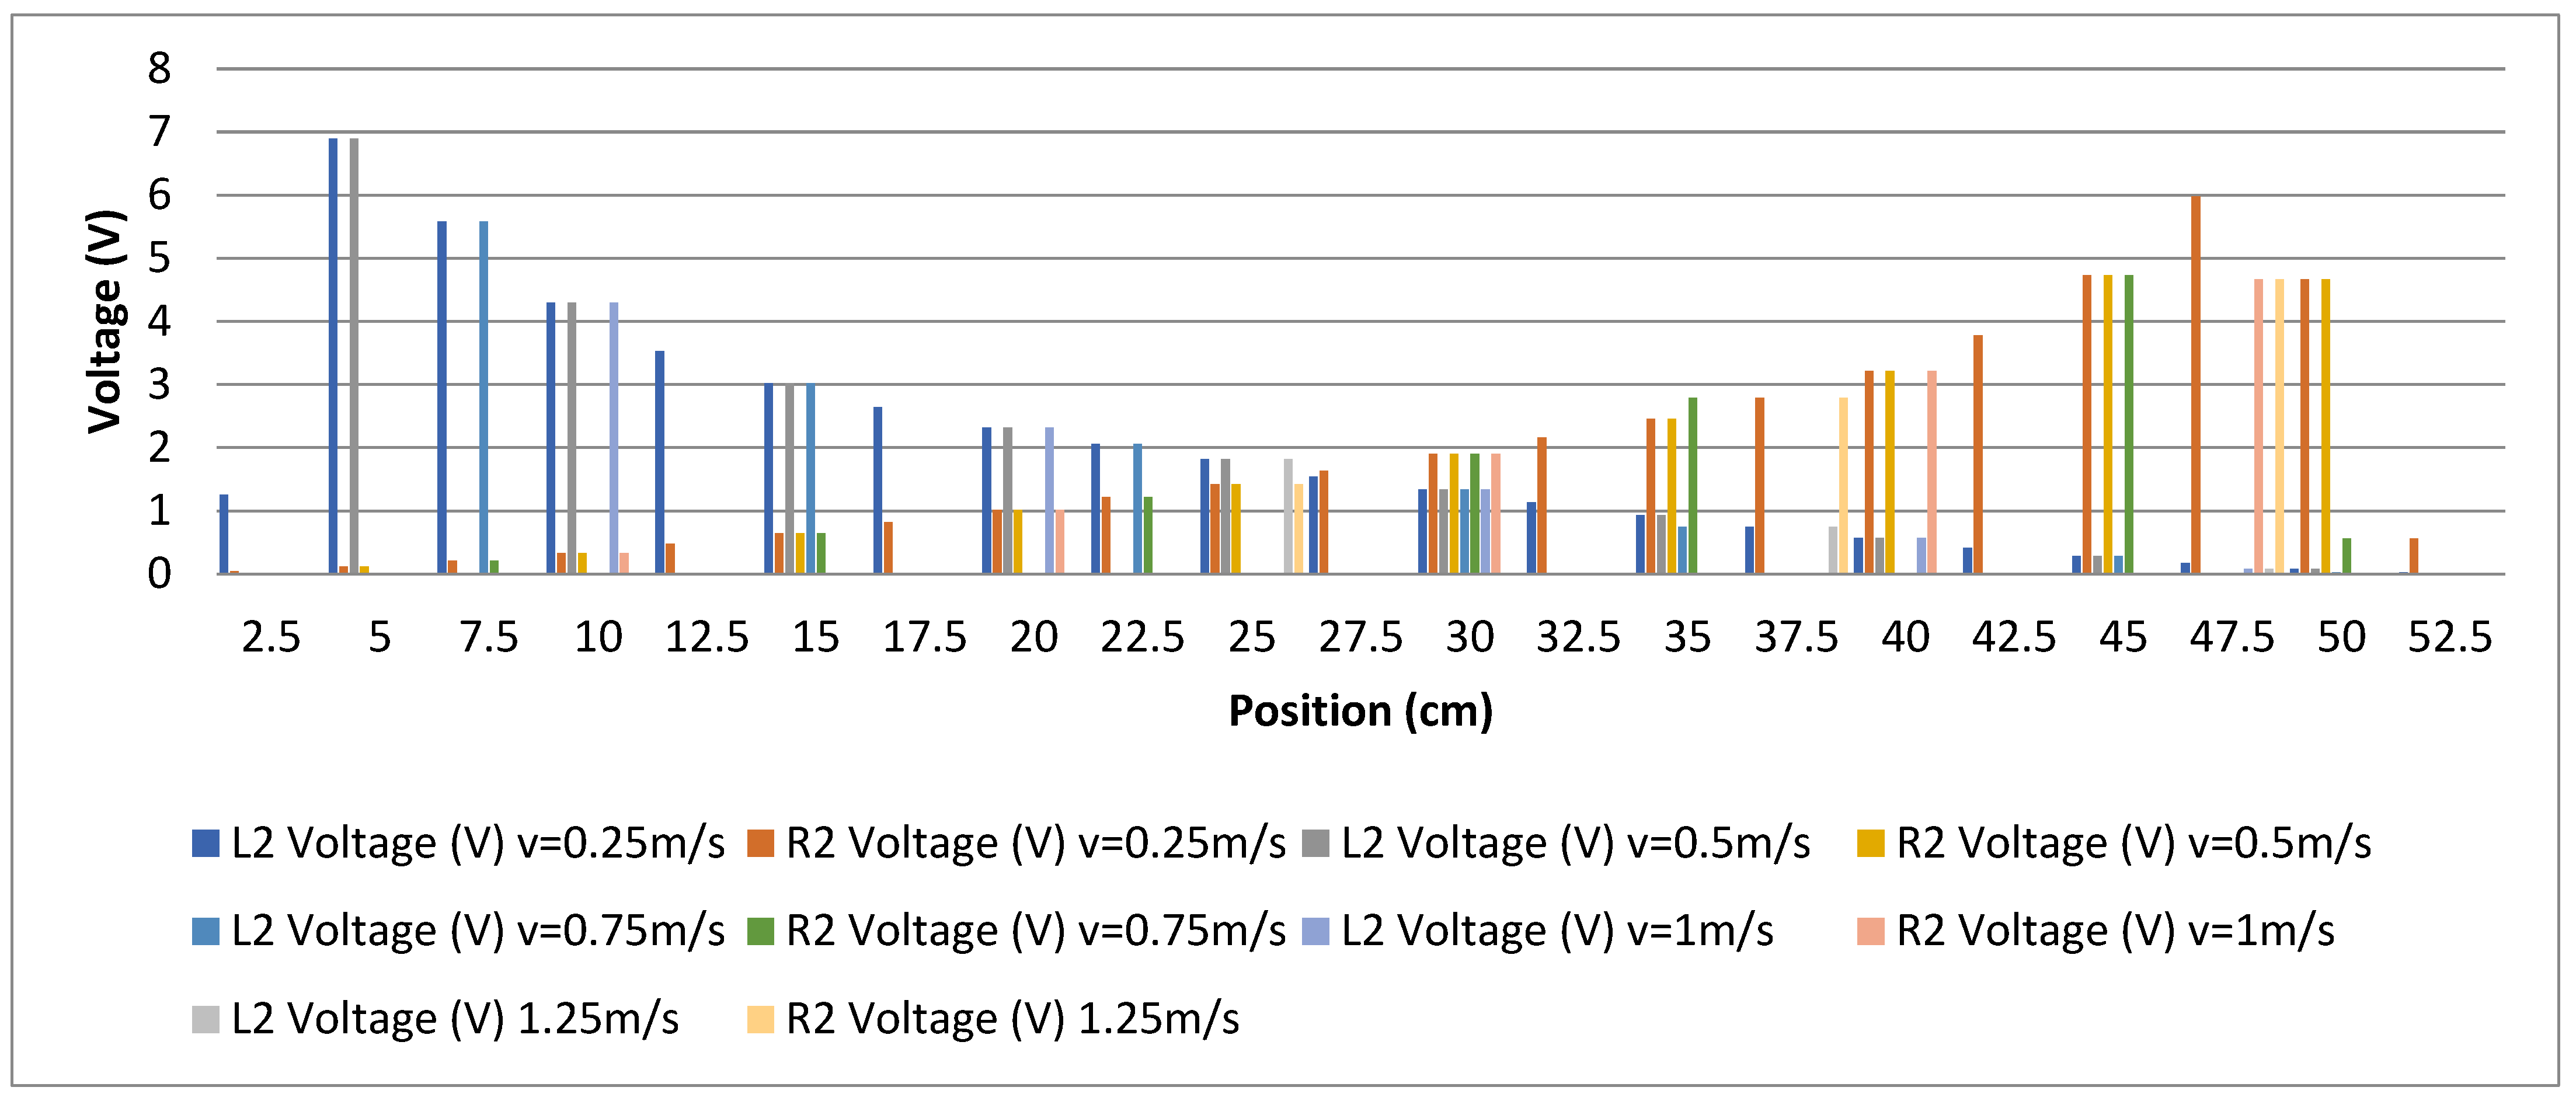
3. Results and Discussion

The load mass effect on the sensors’ voltage reading is presented in Table 2. Increasing the load mass results in increasing the stress applied to the structure and, therefore, a higher voltage reading by all sensors. Due to a large number of readings for all load positions, an average voltage is presented for each mass for each of the sensors.
The locations of the six piezoelectric sensors distributed all over the structure are kept fixed, and the sensors’ voltage readings for different speeds are acquired by changing the load mass and position. It is important to visualize the stress distribution all over the structure with load change of position (Figure 4) and to analyze the voltage values collected by the sensors.
One can observe that the highest value of stress is obtained when a 40 kg load magnitude is applied at a location far from the structure’s fixed edge (x = 30 cm). The effect of the load position on the voltages provided by the sensors is shown in Figure 5. When the load is located at the structure’s fixed edge (x = 0 cm), the highest voltage reading is provided by sensor L2 and negligible voltage readings are provided by the remaining sensors (L1, L3, R1, R2, R3). However, when the applied load is shifted from the structure’s fixed edge, the voltage values provided by all sensors are obtaining higher with maximum voltage values measured by the closest sensor to the load location. As the load is displaced on the axis aligned with L2 and R2, these two sensors always provide the highest voltage values depending on the load position. The results are logical, since when higher stress is applied to the sensor’s surroundings, a higher displacement of crystal atoms in the piezoelectric material of this sensor results in higher electric dipoles within the medium and, therefore, a greater charge potential difference. Thus, this can be considered as a validation of our study results, as sensors L1, L3, and R1, R3, are symmetrical and should provide similar values, which is confirmed in our results (see Figure 6).
It is necessary to point out the similarity of the voltage readings between L1 and L3, and between R1 and R3, as they are defined symmetrically in the structure (Figure 1 and Figure 2). This is well seen in Figure 6, which presents a perfect fit of the voltage readings obtained by the sensors L1 and L3 for a 40 kg load. The same results are obtained for R1 and R3. Sensors L2 and R2 are more affected by the load mass and position as they are aligned with the structure’s central x-axis where the load is displacing. Thus, in the following parts, data analysis of only L2 and R2 sensor readings will be presented. The voltages provided by the sensors L2 and R2 for all simulated load positions are given in Figure 7 for a 40 kg load mass. To determine the speed representation and identify the speed effect fingerprint, the whole voltage spectrum reading is used.
Figure 8, Figure 9 and Figure 10 are extracted from Figure 7 to show the sensors’ voltage readings for different load speeds. Because the speed of the load is determined by the load’s position on the structure’s surface, the number of contact points between the load and the structure varies for each speed. The faster the load is, the fewer contact points are obtained. A load speed of 0.5 m/s corresponds to 11 contact points with a 5 cm distance step (Figure 8). A load speed of 0.75 m/s corresponds to 8 contact points with a 7.5 cm distance step (Figure 9). A load speed of 1 m/s corresponds to 6 contact points with a 10 cm distance step (Figure 10), etc. Consequently, the simulation study’s load distance step can be adjusted based on the requirements of the data pipeline.
Figure 11 combines L2 and R2 sensors’ voltage readings corresponding to load speeds of 0.25 m/s, 0.5 m/s, 0.75 m/s, 1 m/s, and 1.25 m/s. More possible speeds could be presented. This figure can be used to point out how the generated data can be useful for speed prediction. The voltage values collected by the six sensors (six input parameters) defined in the structure, for each change in load mass and position, create a set of data that can be used to define a speed detection model. Table 3 illustrates a demo version of the data set and how this data can be prepared for speed classification, where rows 2–10 are continuous with each other and correspond to the same input set definition for speed prediction. This table presents the input parameters data provided by the six sensors for two different load masses (40 kg and 45 kg) and for all studied load positions that correspond to a load speed of 0.5 m/s, 0.75 m/s, and 1 m/s. The voltage readings correspond to the load speed “v”, where each load speed corresponds to its specific load position due to the distance step. As given in Table 3, zero voltage reading corresponds to the case where the load is not observed due to the distance step effect. The effect of the mass on the voltage readings provided by all the sensors can be seen clearly in this table. The voltage values are increasing with the mass load for different speeds. This is also true for different positions. Data input values presented in Table 3 can be customized depending on needs. Here, we are only presenting a demo version of the full data set.
Most research papers focus on developing piezo technology through experiments with various materials and applications. Simulating intelligent devices for improved energy harvesting takes up the majority of the subsequent work performed with numerical analysis. Reference [19] proposes a ZnO-based acoustic piezoelectric sensor placed between two layers of aluminum electrodes. COMSOL measures the sound-induced potential difference. The proposed device has micrometer-scale dimensions and microvolt-scale voltage. The results illustrate how sound pressure increases the voltage. Reference [22] suggests stacking ZnO between platinum electrodes for various bio-sensing applications. Using COMSOL, the potential difference is measured under varying pressures. The voltage readings on the volt scale increase as the pressure applied increases for the various proposed configurations. As the voltage readings of the sensors increase with increasing load pressure, our paper’s findings are comparable to those of the above-mentioned studies. Higher voltage readings are displayed by the sensors closest to the load pressure.
The results reveal that changes in load position and magnitude influence the sensors’ voltage readings due to varying points of load contact with the structure at different load speeds. One can notice that sensors’ voltage values increase as the load site moves away from the structure’s fixed edge, with the highest voltage values for sensors L2 and R2, which are closest to the load location. The results also validate the accuracy of our study as the readings of the symmetrically defined sensors L1, L3, and R1, R3 are comparable.
The input parameters data set provided shows how voltage readings can be used as a load speed sensor for the IoT. The simulation research can adopt a variable load distance step based on data pipeline needs and provide more speeds. This reveals a load’s magnitude and speed of motion.

4. Conclusions and Future Work

This work proposes a novel method for piezo technology systems as a digital data pipeline for future research on various artificial intelligence (AI) or machine learning (ML) modeling applications. COMSOL Multiphysics was used to create a structure for constructing a digital data pipeline for a smart sensor. Multiple piezo sensors that measure the voltage resulting from a change in the location and mass of a system’s load pressure are incorporated into the model structure that we are proposing.
Seven mesh studies with different mesh parameters have been conducted to ensure mesh quality and guarantee accurate findings. The mesh parameters of studies 6 and 7 converge to the same result with an average error of 1.1% and may thus be utilized to validate the research results. The Von Mises stress distribution throughout the structure has been evaluated by repositioning a 40-kg load. Results indicate that sensors’ voltage values increase as the load site moves away from the structure’s fixed edge. The highest voltage values have been observed for sensors L2 and R2, which are closest to the load location.
In this article, we demonstrated the practicality of a system based on piezoelectric pressure sensors that measure the voltages of mechanical loads at various magnitudes and positions (speeds). The primary contribution is a data pipeline for digital environments that will eventually accelerate AI/ML modeling and enhance data cleaning/filtering. Our suggested system may deliver millions of data readings in a relatively short period (days, depending on processing power) and at a cheap cost compared to the time (months, years) and expense of collecting the same data from a real-world environment. The design of the structure, the piezoelectric material, and the dimensions of the piezoelectric sensor can be adjusted and tailored based on the requirements. The collected data set can be customized to expedite data gathering processes for various on-road assessments, such as speed/weight detection, traffic safety tire-asphalt contact friction warning system, road stress points, heavy load traffic flow, etc. A prototype of the suggested design is currently being developed, and its specifics will be detailed in future work.

Author Contributions

Conceptualization, B.M. and S.V.; Methodology, B.M. and M.H.; Project administration, B.M.; Software, B.M., M.H., A.A., N.F., M.A., A.P., A.L. and H.I.T.; Supervision, B.M. and S.V.; Validation, B.M. and S.V.; Writing—original draft, B.M., M.H., A.A., M.A. and S.V.; Writing—review & editing, B.M. and S.V. All authors have read and agreed to the published version of the manuscript.

Funding

This research received no external funding.

Conflicts of Interest

The authors declare no conflict of interest.

References

  1. Wang, Q.; Ruan, T.; Xu, Q.; Yang, B.; Liu, J. Wearable multifunctional piezoelectric MEMS device for motion monitoring, health warning, and earphone. Nano Energy 2021, 89, 106324. [Google Scholar] [CrossRef]
  2. An, Y.K.; Kim, M.; Sohn, H. Piezoelectric transducers for assessing and monitoring civil infrastructures. In Sensor Technologies for Civil Infrastructures; Woodhead Publishing: Sawston, UK, 2014; pp. 86–120. [Google Scholar]
  3. Nolz, R.; Kammerer, G. Evaluating a sensor setup with respect to near-surface soil water monitoring and determination of in-situ water retention functions. J. Hydrol. 2017, 549, 301–312. [Google Scholar] [CrossRef]
  4. Fu, J.L.; Ayazi, F. Dual-mode piezo-on-silicon resonant temperature and humidity sensor for portable air quality monitoring systems. In Proceedings of the SENSORS, 2010 IEEE, Waikoloa, HI, USA, 1–4 November 2010; pp. 2131–2135. [Google Scholar]
  5. Khot, L.R.; Panigrahi, S.; Lin, D. Development and evaluation of piezoelectric-polymer thin film sensors for low concentration detection of volatile organic compounds related to food safety applications. Sens. Actuators B Chem. 2011, 153, 1–10. [Google Scholar] [CrossRef]
  6. Chen, N.; Bedekar, V. Design, Modeling, and Simulation of Two-Piece Trapezoidal Piezoelectric Devices for Sensing and Energy Harvesting. Adv. Mater. Sci. Eng. 2020, 2020, 9743431. [Google Scholar] [CrossRef]
  7. Bhaskaran, P.R.; Rathnam, J.D.; Koilmani, S.; Subramanian, K. Multiresonant frequency piezoelectric energy harvesters integrated with high sensitivity piezoelectric accelerometer for bridge health monitoring applications. Smart Mater. Res. 2017, 2017, 6084309. [Google Scholar] [CrossRef]
  8. Weaver, P.M.; Stevenson, T.; Quast, T.; Bartl, G.; Schmitz-Kempen, T.; Woolliams, P.; Blumfield, A.; Stewart, M.; Cain, M.G. High temperature measurement and characterization of piezoelectric properties. J. Mater. Sci. Mater. Electron. 2015, 26, 9268–9278. [Google Scholar] [CrossRef]
  9. Xie, L.; Wang, G.; Jiang, C.; Yu, F.; Zhao, X. Properties and Applications of Flexible Poly (Vinylidene Fluoride)-Based Piezoelectric Materials. Crystals 2021, 11, 644. [Google Scholar] [CrossRef]
  10. Rahman, W.; Garain, S.; Sultana, A.; Middya, T.R.; Mandal, D. Self-powered piezoelectric Nanogenerator based on wurtzite ZnO nanoparticles for energy harvesting application. Mater. Today Proc. 2018, 5, 9826–9830. [Google Scholar] [CrossRef]
  11. Popovici, D.; Constantinescu, F.; Maricaru, M.; Hantila, F.I.; Nitescu, M.; Gheorghe, A. Modeling and simulation of piezoelectric devices. In Modelling and Simulation; IntechOpen: London, UK, 2008. [Google Scholar]
  12. Jasim, A.; Wang, H.; Yesner, G.; Safari, A.; Maher, A. Optimized design of layered bridge transducer for piezoelectric energy harvesting from roadway. Energy 2017, 141, 1133–1145. [Google Scholar] [CrossRef]
  13. Du, C.; Liu, P.; Jin, C.; Yang, H.; Li, C.; Jiang, G.; Oeser, M. Evaluation of the piezoelectric and mechanical behaviors of asphalt pavements embedded with a piezoelectric energy harvester based on multiscale finite element simulations Construction and Building. Materials 2022, 333, 127438. [Google Scholar] [CrossRef]
  14. Mourched, B.; Abdallah, M. Design and characterization of a new microscopy probe using COMSOL and ANSYS. Int. J. Multiphysics 2022, 16, 95–106. [Google Scholar]
  15. Mourched, B.; Nativel, E.L.; Kribich, R.; Falgayrettes, P. GALL-BORRUT, P Study of light emission and collection in a transparent dielectric cantilever-based near-field optical probe. J. Microsc. 2016, 262, 3–11. [Google Scholar] [CrossRef] [PubMed]
  16. Akshya, S.; Juliet, A.V. Study of toxic gas adsorption on silicon substrate integrated with piezoelectric material for sensing application using COMSOL Multiphysics. In IOP Conference Series: Materials Science and Engineering; IOP Publishing: Bristol, UK, 2021; Volume 1070, p. 012003. [Google Scholar]
  17. Dileena, L.; Sreeja, S.B.; Sreekala, C.O. A comparative study on piezoelectric and piezoresistive pressure sensor using COMSOL simulation. Mater. Today Proc. 2021, 46, 3121–3126. [Google Scholar] [CrossRef]
  18. Jain, A.; Kumar, S.; Kharb, A. COMSOL Multiphysics Simulation of Piezoelectric Sensor for Energy Harvesting from Railway tracks. Int. J. Recent Technol. Eng. 2019, 8, 5446–5452. [Google Scholar] [CrossRef]
  19. Veena, S.; Hegde, V.; Nagaraj, V.S.; Suresh, H.L.; Gautham, M.A. Design and Simulation of Mems based Piezoelectric Acoustic sensor. In Proceedings of the 2019 IEEE 4th International Conference on Condition Assessment Techniques in Electrical Systems (CATCON), Chennai, India, 21–23 November 2019; pp. 1–4. [Google Scholar]
  20. Kumar, A.; Sharma, S.; Chand, K.; Guha, P. Structural Analysis of PFCB W14 Material Using COMSOL Multiphysics. In Proceedings of the 2019 6th International Conference on Signal Processing and Integrated Networks (SPIN), Noida, India, 7–8 March 2019; pp. 649–653. [Google Scholar]
  21. Sivakumar, N.; Kanagasabapathy, H.; Srikanth, H.P. Static multiple, distributed piezoelectric actuator structural deformation and bending analysis using comsol. Mater. Today Proc. 2018, 5, 11516–11525. [Google Scholar] [CrossRef]
  22. Bhargava, M.; Tamboli, A.; Sivanathan, K. Performance Enhancement of MEMS based Piezoelectric Pressure Sensor using Multistep Configuration. In Proceedings of the 2019 IEEE 19th International Conference on Nanotechnology (IEEE-NANO), Macao, China, 22–26 July 2019; pp. 576–579. [Google Scholar]
  23. Amiri, N.; Tasnim, F.; Anbarani, M.T.; Dagdeviren, C.; Karami, M.A. Experimentally verified finite element modeling and analysis of a conformable piezoelectric sensor. Smart Mater. Struct. 2021, 30, 085017. [Google Scholar] [CrossRef]
  24. Panahi, A.; Hassanzadeh, A.; Moulavi, A. Design of a low cost, double triangle, piezoelectric sensor for respiratory monitoring applications. Sens. Bio-Sens. Res. 2020, 30, 100378. [Google Scholar] [CrossRef]
  25. Malhotra, K.; Kumari, M.U.; Shireesha, G.; Karbari, S.R. Design and simulation of stacked PVDF layers with ZnO for piezoelectric nanodevices. Mater. Today Proc. 2021, 42, 951–954. [Google Scholar] [CrossRef]
  26. Turdakyn, N.; Medeubayev, A.; Abay, I.; Adair, D.; Kalimuldina, G. Preparation of a piezoelectric PVDF sensor via electrospinning. Mater. Today Proc. 2022, 49, 2478–2481. [Google Scholar] [CrossRef]
  27. Likhon, M.M.; Shawan, S.I.; Alam, M.N.; Siddique, S. Characterizing Piezoelectric Properties of PZT-4, PZT-5A, PZT-5J, PZT-7A and Lithium Tantalite Material-based Transducers. In Proceedings of the 2021 International Conference on Green Energy, Computing and Sustainable Technology (GECOST), Miri, Malaysia, 7–9 July 2021; pp. 1–4. [Google Scholar]
  28. Greeshma, M.G.; Sreenidhi, P.R. Material Design for Self-Powered Cranial Drill using Piezoelectric effect–A COMSOL Study. In Proceedings of the 2021 4th Biennial International Conference on Nascent Technologies in Engineering (ICNTE), NaviMumbai, India, 15–16 January 2021; pp. 1–5. [Google Scholar]
  29. Vrtagić, S.; Softić, E.; Gmanjunath, A.; Ponjavić, M.; Stević, Ž.; Subotić, M.; Kevrić, J. Traffic Flow Influence on the Bitumen Distortion through the Back Propagation Algorithm Based on the Real on Road Formed Dataset Parameters. In International Symposium on Innovative and Interdisciplinary Applications of Advanced Technologies; Springer: Cham, Switzerland, 2021; pp. 167–186. [Google Scholar]
  30. Younis, A.; Dong, Z.; ElBadawy, M.; AlAnazi, A.; Salem, H.; AlAwadhi, A. Design and Development of Bladeless Vibration-Based Piezoelectric Energy–Harvesting Wind Turbine. Appl. Sci. 2022, 12, 7769. [Google Scholar] [CrossRef]
  31. Hussain, G.; Ali Saleh Al-rimy, B.; Hussain, S.; Albarrak, A.M.; Qasem, S.N.; Ali, Z. Smart Piezoelectric-Based Wearable System for Calorie Intake Estimation Using Machine Learning. Appl. Sci. 2022, 12, 6135. [Google Scholar] [CrossRef]
  32. Yu, Y.; Qin, X.; Hussain, S.; Hou, W.; Weis, T. Pedestrian Counting Based on Piezoelectric Vibration Sensor. Appl. Sci. 2022, 12, 1920. [Google Scholar] [CrossRef]
  33. Lozoya-Santos, J.d.-J.; Félix-Herrán, L.C.; Tudón-Martínez, J.C.; Vargas-Martinez, A.; Ramirez-Mendoza, R.A. Design and Implementation of an IoT-Oriented Strain Smart Sensor with Exploratory Capabilities on Energy Harvesting and Magnetorheological Elastomer Transducers. Appl. Sci. 2020, 10, 4387. [Google Scholar] [CrossRef]
  34. Aramendia, I.; Fernandez-Gamiz, U.; Zulueta Guerrero, E.; Lopez-Guede, J.M.; Sancho, J. Power Control Optimization of an Underwater Piezoelectric Energy Harvester. Appl. Sci. 2018, 8, 389. [Google Scholar] [CrossRef]
  35. Mouapi, A.; Hakem, N.; Kandil, N. Piezoelectric Energy Harvesting Prediction and Efficient Management for Industrial Wireless Sensor. Appl. Sci. 2020, 10, 8486. [Google Scholar] [CrossRef]
  36. Yang, Z.-X.; He, X.-T.; Peng, D.-D.; Sun, J.-Y. Free Damping Vibration of Piezoelectric Cantilever Beams: A Biparametric Perturbation Solution and Its Experimental Verification. Appl. Sci. 2020, 10, 215. [Google Scholar] [CrossRef]
  37. Zhang, J.; Kong, L.; Zhang, L.; Li, F.; Zhou, W.; Ma, S.; Qin, L. A Novel Ropes-Driven Wideband Piezoelectric Vibration Energy Harvester. Appl. Sci. 2016, 6, 402. [Google Scholar] [CrossRef]
  38. Vrtagić, S.; Softić, E.; Ponjavić, M.; Stević, Ž.; Subotić, M.; Gmanjunath, A.; Kevric, J. Video Data Extraction and Processing for Investigation of Vehicles’ Impact on the Asphalt Deformation Through the Prism of Computational Algorithms. Trait. Du Signal 2020, 37, 899–906. [Google Scholar] [CrossRef]
  39. Martín Fernández, C.; Langendoerfer, P.; Soltani Zarrin, P.; Díaz-Rodríguez, M.; Rubio-Muñoz, B. Kafka-ML: Connecting the data stream with ML/AI frameworks. Future Gener. Comput. Syst. 2022, 126, 15–33. [Google Scholar] [CrossRef]
  40. Pervaiz, F.; Vashistha, A.; Anderson, R. Examining the challenges in development data pipeline. In Proceedings of the 2nd ACM SIGCAS Conference on Computing and Sustainable Societies, Accra, Ghana, 3–5 July 2019; pp. 13–21. [Google Scholar]
Figure 1. Structure design embedding piezoelectric sensors and load pressure.
Applsci 12 09798 g001
Figure 2. Design showing a good quality of structure mesh.
Applsci 12 09798 g002
Figure 3. Voltage values measured by the sensors L2 and R2 for different studies.
Applsci 12 09798 g003
Figure 4. (a) Von Mises stress distribution for a 40 kg load applied at x = 0 cm (edge of the structure); (b) Von Mises stress distribution for a 40 kg load applied at x = 30 cm from the structure’s fixed edge.
Applsci 12 09798 g004
Figure 5. Sensors’ voltage reading in terms of load position for a 40 kg load magnitude moving with 1 m/s speed.
Applsci 12 09798 g005
Figure 6. L1 and L3 sensors’ voltage reading in terms of load position.
Applsci 12 09798 g006
Figure 7. L2 and R2 sensors’ voltage reading in term of load position.
Applsci 12 09798 g007
Figure 8. L2 and R2 sensors’ voltage reading for a 0.5 m/s load speed.
Applsci 12 09798 g008
Figure 9. L2 and R2 sensors’ voltage reading for a 0.75 m/s load speed.
Applsci 12 09798 g009
Figure 10. L2 and R2 sensors’ voltage reading for a 1 m/s load speed.
Applsci 12 09798 g010
Figure 11. L2 and R2 voltage readings in terms of load contact points for different load speeds.
Applsci 12 09798 g011
Table 1. Parameters details of different mesh studies.
StudyMaximum Element Size (cm)Minimum Element Size (cm)Maximum Element of Growth RateResolution of Narrow RegionsThickness Adjustment Factor
185521
252321
352221
4521.421
5311.421
620.11.40.71
720.11.40.72
Table 2. Piezo sensor average voltage reading over all distances.
m (kg)4045505560
Voltage sensors (V)L1 (average for all positions)0.9502661.0690491.1878321.3066151.425399
L2 (average for all positions)0.950151.0689191.1876881.3064561.425225
L3 (average for all positions)0.9476741.0661341.1845931.3030521.421512
R1 (average for all positions)0.9483941.0669431.1854921.3040421.422591
R2 (average for all positions)0.9513051.0702181.1891311.3080441.426957
R3 (average for all positions)0.9520081.0710081.1900091.309011.428011
Table 3. Example of full data provided by the six sensors for different load speeds for possible speed prediction/classification.
Position (cm)OutputInput
Voltage (V)L1L2L3R1R2R3
5.00.50 m/sm = 40 kg0.64396.89780.64090.07750.12210.0772
m = 45 kg0.72447.76000.72100.08710.13730.0869
0.75 m/s
1.00 m/s
m = 40 kg
m = 45 kg
0
7.50.75 m/sm = 40 kg0.96485.57870.96340.14220.21450.1415
m = 45 kg1.08546.27601.08380.15990.24140.1592
0.50 m/s
1.00 m/s
m = 40 kg
m = 45 kg
0
10.00.50 m/sm = 40 kg1.24144.29431.24200.22800.33480.2286
m = 45 kg1.39664.83111.39720.25650.37660.2572
0.75 m/sm = 40 kg
m = 45 kg
0
1.00 m/sm = 40 kg1.24144.29431.24200.22800.33480.2286
m = 45 kg1.39664.83111.39720.25650.37660.2572
12.50.50 m/s
0.75 m/s
1.00 m/s
m = 40 kg
m = 45 kg
0
15.00.50 m/sm = 40 kg1.49753.02311.48570.45530.64160.4518
m = 45 kg1.68473.40091.67140.51220.72180.5083
0.75 m/sm = 40 kg1.49753.02311.48570.45530.64160.4518
m = 45 kg1.68473.40091.67140.51220.72180.5083
1.00 m/sm = 40 kg
m = 45 kg
0
17.50.50 m/s
0.75 m/s
1.00 m/s
m = 40 kg
m = 45 kg
0
20.00.50 m/sm = 40 kg1.44792.31791.44010.72101.01410.7239
m = 45 kg1.62892.60771.62010.81111.14080.8144
0.75 m/sm = 40 kg
m = 45 kg
0
1.00 m/sm = 40 kg1.44792.31791.44010.72101.01410.7239
m = 45 kg1.62892.60771.62010.81111.14080.8144
22.50.75 m/sm = 40 kg1.35200.00001.33740.86571.22020.8686
m = 45 kg1.52090.00001.50450.97391.37270.9772
0.50 m/s
1.00 m/s
m = 40 kg
m = 45 kg
0
25.00.50 m/sm = 40 kg1.24621.81561.22561.00301.41821.0069
m = 45 kg1.40202.04261.37881.12841.59541.1328
0.75 m/s
1 m/s
m = 40 kg
m = 45 kg
0
27.50.50 m/s
0.75 m/s
1.00 m/s
m = 40 kg
m = 45 kg
0
30.00.50 m/sm = 40 kg0.96471.33860.93941.27611.89751.2842
m = 45 kg1.08531.50591.05681.43562.13471.4447
0.75 m/sm = 40 kg0.96471.33860.93941.27611.89751.2842
m = 45 kg1.08531.50591.05681.43562.13471.4447
1.00 m/sm = 40 kg0.96471.33860.93941.27611.89751.2842
m = 45 kg1.08531.50591.05681.43562.13471.4447
32.50.50 m/s
0.75 m/s
1.00 m/s
m = 40 kg
m = 45 kg
0
35.00.50 m/sm = 40 kg0.67110.92700.65821.47462.45651.4789
m = 45 kg0.75501.04290.74051.65892.76361.6638
0.75 m/s
1.00 m/s
m = 40 kg
m = 45 kg
0
37.50.75 m/sm = 40 kg0.53800.00000.52371.50602.79131.5023
m = 45 kg0.60520.00000.58921.69433.14021.6901
0.50 m/s
1.00 m/s
m = 40 kg
m = 45 kg
0
40.00.50 m/sm = 40 kg0.40570.57210.39601.46493.21221.4676
m = 45 kg0.45640.64360.44551.64803.61381.6511
0.75 m/sm = 40 kg
m = 45 kg
0
1.00 m/sm = 40 kg0.40570.57210.39601.46493.21221.4676
m = 45 kg0.45640.64360.44551.64803.61381.6511
42.50.50 m/s
0.75 m/s
1.00 m/s
m = 40 kg
m = 45 kg
0
45.00.5 m/sm = 40 kg0.19300.28430.18891.14714.73451.1480
m = 45 kg0.21710.31990.21251.29055.32631.2915
0.75 m/sm = 40 kg0.19300.28430.18891.14714.73451.1480
m = 45 kg0.21710.31990.21251.29055.32631.2915
1.00 m/sm = 40 kg
m = 45 kg
0
47.50.50 m/s
0.75 m/s
1.00 m/s
m = 40 kg
m = 45 kg
0
50.00.5 m/sm = 40 kg0.05280.08300.05120.46794.67070.4706
m = 45 kg0.05940.09340.05760.52635.25460.5295
0.75 m/sm = 40 kg
m = 45 kg
0
1.00 m/sm = 40 kg0.05280.08300.05120.46794.67070.4706
m = 45 kg0.05940.09340.05760.52635.25460.5295
52.50.75 m/sm = 40 kg0.01380.00000.01360.14200.55730.1415
m = 45 kg0.01550.00000.01530.15970.62700.1592
0.5 m/s
1.00 m/s
m = 40 kg
m = 45 kg
0
Publisher’s Note: MDPI stays neutral with regard to jurisdictional claims in published maps and institutional affiliations.

