Abstract
A new electro-hydraulic servo point load instrument was designed to address the problem that the existing point load instrument cannot be loaded continuously and uniformly; different loading rates (using three loading rates: 0.1, 0.5, 1.0 kN/s) were conducted on fine-crystalline granite, coarse-crystalline granite, and siltstone (each rock sample contains four sizes: 203, 303, 403, 503 mm3) for point load tests. Firstly, the influence of loading rate on the axial stress distribution of rock sample loading was investigated in conjunction with the rock strength damage theory. Next, the influence of rock sample size and loading rate on different standard point load strength evaluation methods was analyzed to find a reasonable evaluation method and loading rate and range of rock sample size. Finally, the relationship between standard point load strength and uniaxial compressive strength was analyzed on this basis to obtain its empirical conversion formula. The results show that: (1) With the increase in the loading rate of point load, the tensile and compressive stresses in the loading axis increase, and the compressive stresses near the center of the loading axis of the rock sample are more influenced by the loading rate; the standard point load strength increases with the increase in the loading rate, but the increase in the standard point load strength decreases when the loading rate increases to a certain range. (2) With the increase in size, the standard point load strength solved by method I, method III, and method IV has an obvious size effect, while the size effect of standard point load strength solved by method II is not obvious. (3) The conversion factors of fine-crystalline granite, coarse-crystalline granite, and siltstone were obtained by zero-intercept linear regression analysis as 16.80, 15.32, and 14.60, respectively, which indicated that the conversion factors of rocks with high strength were higher than those of rocks with low strength. The present research results can provide theoretical support for revising the existing point load strength calculation equations.
1. Introduction
A point load test is a method to obtain the compressive strength of rocks indirectly, which is widely used in engineering construction because of its simple sample preparation and compact and portable test instrument for field testing [1]. In recent years, scholars at home and abroad have conducted much research on the point load test of rocks. Broch and Franklin [2] proposed that the point load strength index Is is equal to the damage load P divided by specimen-loading spacing squared, D2. The International Society of Rock Mechanics (ISRM) [3] and American Society for Testing and Materials (ASTM) [4] stated that the point load strength index Is is equal to the damage load P divided by the square of the equivalent core diameter of the specimen , and then the correction index m is proposed based on different sizes, and finally the standard point load strength Is(50) is equal to the point load strength index Is multiplied by the correction factor F. Kahraman and Gunaydin [5] conducted point load tests and uniaxial compressive strength tests on igneous, metamorphic, and sedimentary rocks, and used regression analysis to investigate the effect of different rock types on their correlations. Masoumi et al. [6] conducted point load tests and uniaxial compressive strength tests on sandstones of different sizes, invoking the unified size effect law. They investigated the effect of contact area on the size-effect behavior of point load results by using a new method to determine the point load strength index, which led to opposite size-effect trends. Haeri et al. [7] conducted point load tests and numerical studies on different shaped specimens, and the results of the study showed that the point load strength index increased with increasing test model size, and that the shape of the particles did not have a significant effect on their tensile strength. Haeri et al. [8] investigated the effect of model size and particle size on the point load index through numerical simulation tests, and the results showed that the standard point load strength Is(50) increased with both model size and particle size. Zhu et al. [9] showed by the effects of rock sample shape factor β and loading point spacing D on rock sample point load strength index Is that specimen Is gradually decayed with the increase in both β and D in a power function law, and finally stabilized. Wei et al. [10] conducted a large number of point load tests on rock samples with three different geometric shapes. Theoretically and experimentally, the results showed that the point load strength index was insensitive to the shape of the rock samples, and the research results verify the effectiveness of point load test on irregular specimens. Hiramatsu and Oka [11] performed point load tests on rock samples of different shapes to analyze the stress state inside the samples and demonstrated that the samples were mainly subjected to compressive stresses near the loading point and mostly uniform tensile stresses in the region beyond the loading axis. Reichmuth [12] revealed the process of point load damage under the action of point load and tensile and compressive stress zones, which are formed inside the rock sample. As the load continues to increase, compressive damage cracks are formed near the loading cone, and the cracks form a sliding line as the load increases. The cracks acting with the tensile stress in the center of the specimen gradually penetrate, and the specimen is damaged. Peng [13] used the axisymmetric finite element method to determine the stress distribution in cylindrical rock discs with different diameter–thickness ratios under double-point loading, and discussed the characteristics of the tensile radial and tangential stress distribution. The stress field tends to stabilize when the ratio of diameter to thickness is greater than 1. Following this work, a large number of scholars conducted in-depth studies on the relevant empirical formulas and parameter values for the standard point load strength Is(50) and the tensile and compressive strength of rocks [14,15,16,17,18,19].
The abovementioned scholars have mostly studied the calculation mode of point load strength, the factors influencing point load strength, the damage mechanism of point load tests, and the correlation between standard point load strength Is(50) and uniaxial compressive strength. However, there are fewer studies on the influence of loading rate on the point load strength of rocks, and only the size of the rock sample and the loading time in the point load test are specified in the specification (GB/T 50266-2013) [20]; the loading rate and loading mode (the loading mode is mainly continuous loading and discontinuous loading) are not clearly specified. At present, most scholars mainly use a hand pump to apply pressure to the rock sample when conducting the point load test (lowering the handle to apply load to the rock sample and raising the handle to make the hand pump suck oil): the pressure application process is not continuous, the application rate varies from person to person, and the test results have large errors.
In view of these problems, we designed and developed an electro-hydraulic servo point load instrument with uniform loading and adjustable rate, which is used to study the variation law of point load strength under different sizes and different loading rates, and also to reduce the dispersion of test data and provide technical means to revise the existing point load strength calculation formula. (All standard point load strengths noted below are replaced by Is(50)).
2. New Electro-Hydraulic Servo Point Load Instrument
2.1. Structural Design
The self-developed electro-hydraulic servo point load instrument is shown in Figure 1, which is also the only electro-hydraulic servo point load tester on the market at present. It is mainly composed of a high-rigidity frame, electro-hydraulic servo loading system, data acquisition system, and case. The high-rigidity frame includes an upper and lower bearing plate, upper and lower limit beams, upper and lower loading indenter, and limit column. The electro-hydraulic servo loading system includes a plunger pump, oil circuit system, and motor and control circuit. The data acquisition system includes a display, control system, and oil pressure sensor. The input and output interfaces include the charging port, angle-friction interface, power button, and USB interface. The main technical parameters of electro-hydraulic servo point loaders are shown in Table 1.
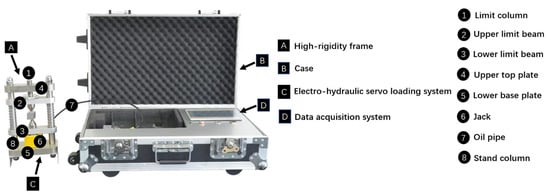
Figure 1.
Physical view of the new electro-hydraulic servo point load instrument.

Table 1.
Main technical parameters of the new electro-hydraulic servo point load instrument.
2.2. Key Technologies
In view of the actual problem of the discontinuous loading process for conventional point load instruments, the technical research is carried out as follows:
- (1)
- Develop a miniaturized electro-hydraulic servo loading system; break through the precise control technology of the battery circuit; realize multichannel capability, small flow rate, and high-pressure stable output under smaller volume and lighter weight, with the ability to intelligently detect pressure changes and maintain the target pressure; and create a loading rate that is stable and adjustable. Electro-hydraulic servo point loaders for the first time achieve variable-rate, continuous, and uniform loading, thus reducing test data dispersion.
- (2)
- The test data are uploaded to the cloud platform in real time through 5G technology, with instant test results and instant transmission back to the cloud server.
2.3. Operation Process
Main operation process:
- (1)
- Select a test site on flat ground to install the test instrument, open the data operating system, and assure that the sensors work properly.
- (2)
- According to the physical properties of the test specimen, select the rock category, mineral composition, grain size, and weathering degree in the corresponding operation interface, as shown in Figure 2. Measure the size of the point load specimen, enter the test specimen length, width, thickness parameters, and test loading rate in the operating system, as shown in Figure 3.
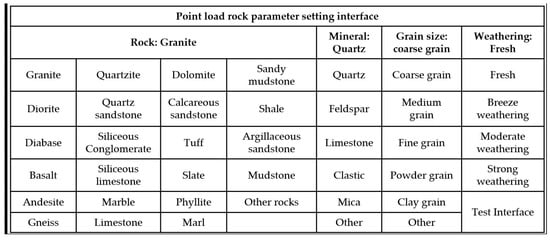 Figure 2. Rock parameter setting—English interface.
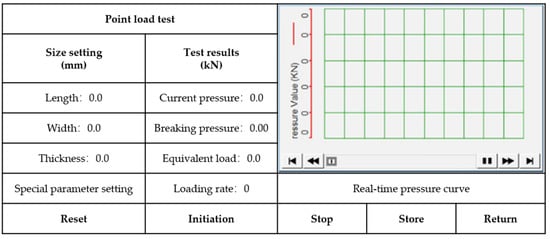 Figure 3. Test—English interface.
 - (3)
- Insert a USB flash drive to store data.
- (4)
- Install the specimen by lifting the lower beam with both hands upward, then put in the jack; rotate the limit column to adjust the space and clamp the specimen.
- (5)
- Specimen installation is complete, ready for storage, start the test.
- (6)
- Press the start–store (test end) button to export data, view the test process real-time display of the current pressure value, and end the test to display the fracture pressure value and equivalent load.
- (7)
- Test data are transferred to the U disk and to the cloud computing platform through 5G technology.
3. Rock Sample Preparation and Test Method
3.1. Rock Sample Preparation
Three representative rock samples were selected for quantitative analysis, namely, fine-crystalline granite and coarse-crystalline granite with high strength and large differences in grain size and morphology, and siltstone with moderate strength and uniform grain size.
Both granites were taken from Qingchuan County, Guangyuan City, Sichuan Province. The coarse-crystalline granite is mainly gray-white with black mica and white quartz embedded in it, the grains are large and evenly distributed. Neither block structure nor joints and fissures are developed, and the integrity of the block is good. The fine-crystalline granite has small grains of black mica in its mineral composition, showing a uniform distribution of dots, and the rock sample is mainly black and white, with fine grain structure, blocky structure, dense structure, and hard texture. The siltstone was taken from an abandoned mine in Wuhua District, Kunming City, Yunnan Province, and has a dark red color, blocky coarse-grained sandy structure, and is relatively homogeneous.
To ensure the accuracy of the test results, the different sizes of each rock sample were taken from the same rock block with uniform texture, and each rock block was checked for macroscopic defects to ensure that there were no obvious cracks or alteration areas. The different sizes of rock samples were cut and core-drilled along the same direction. For the square samples of the point load test, the three rock samples were cut into square specimens with side lengths of 20, 30, 40, and 50 mm using an automatic type infrared-controlled cutting machine (DQ-4A). For the cylindrical samples of the uniaxial compression test, firstly, a core drilling machine (ZS-100) was used to core the rock block, and then an automatic-type infrared-controlled cutting machine (DQ-4A) was used to cut the core sample into cylindrical specimens of 50 mm in diameter and 100 mm in height. To ensure the stability of the test data and reduce the degree of dispersion, a face grinding machine (SHM-201) was also used to smooth the section of the cut rock sample, so that the size error of the test rock sample was controlled within the range of ±0.1 mm. A total of 56, 64, and 57 specimens of fine-crystalline granite, coarse-crystalline granite and siltstone were used for the point load test, while a total of 6, 5, and 6 specimens were used for the uniaxial compression test, respectively. Table 2 lists the specific sizes and quantities.
Table 2.
Summary of rock sample sizes and quantities.
3.2. Point Load Test and Uniaxial Compression Test
In this paper, the effect of specimen size and loading rate on the point load strength was investigated using the self-developed electro-hydraulic servo point load instrument. Three loading rates were designed for each size of the three rock samples: 0.1, 0.5, and 1.0 kN/s. The validity principle of the point load test data strictly followed the relevant codes and standards [20,21], and if the failure section did not pass through the loading point, or the rock sample did not form a penetration crack during the pressurization process, etc., then the data were considered invalid. The damage results of the specimen are shown in Figure 4.
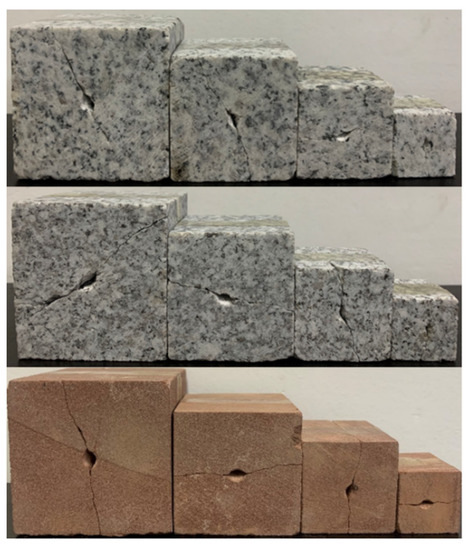
Figure 4.
Images of point load damage in the three rock samples.
The uniaxial compression test was performed using a SUNS-type rock mechanics electro-hydraulic servo test machine, strictly in accordance with the Standard for Engineering Rock Mass Test Methods [20], in the dry state, and the uniaxial compressive strength test method of the International Society of Rock Mechanics was used to load the rock samples in a displacement-controlled manner with a loading rate of 0.001 mm/s [22]. Three rock samples were subjected to uniaxial compression. The damage results of the specimens after compression tests are shown in Figure 5.
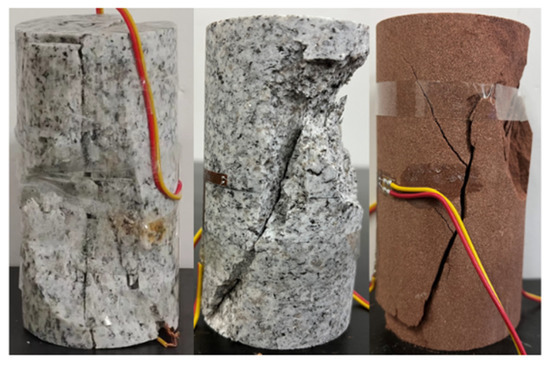
Figure 5.
Images of uniaxial compression damage in the three rock samples.
4. Results and Discussion
4.1. Point Load Damage Process Analysis
The entire damage process of the point load test is analyzed. When the rock sample is loaded, the conical indenter at the contact surface starts to penetrate, and at the same time the original open structural surface or microfracture is gradually closed by the force in the direction of the loading axis, and the rock is compacted in the local range. As the loading rate increases, the compaction degree gradually decreases, and the load continues to increase before some of the tiny voids are compressed and stabilized; the loading point becomes crushed under the action of significant contact compressive stress, and the loading cone head is slightly embedded in the rock sample, and the broken shape of the contact point is approximately the same as the shape of the conical indenter. The conical indenter continues to penetrate, and under the joint action of tensile and compressive stresses, the tensile and compressive strain of the rock material reaches the damage limit, and the damage occurs first at the surface of the rock sample. After a small local damage is produced, the stress at the damage mouth is quickly concentrated and rapidly expands to the depth in the form of cracks, and when the upper and lower cracks expand to connect, and the interparticle adhesion force at the longitudinal surface of the overloading axis without cracks is less than the horizontal component force of the conical indenter. The rock sample is instantaneously destroyed. When the loading rate becomes larger, the cracks at the contact point and inside cannot be fully developed, and part of the actual loading process is overcoming the stiffness of the rock sample, which can be seen from the difference in the breaking loads of the three rock samples at different loading rates, as shown in Table 3.
Table 3.
Damage load statistics of the three rock samples with different sizes and loading rates.
4.2. The Internal Stress State of Rock Samples under Different Loading Rates
Japanese scholars such as Hiramatsu and Oka [11] made and processed epoxy resin into spheres, squares, and rectangles for point load tests, and used three-dimensional photoelastic tests to monitor the stress state during the whole process of point load tests. The results showed that the stress state of the three models near the loading axis is basically the same. Later, Wei et al. and Chau and Wei [23,24] also conducted theoretical studies on the internal stress state of cylindrical specimens in axial and radial point-loading tests. Wei et al. [10] compared the stress distribution in the sphere and cylinder under axial and radial point loads, and showed that if the dimensions of the sphere and cylinder are similar, the stress distribution within the sphere and cylinder along the loading-axis direction is similar in terms of magnitude and distribution pattern. Thus, the analysis of the stress state and damage mechanism of axial point load tests of cylindrical samples is also applicable to square rock samples.
According to the stress distribution on the loading axis of the specimen after the surface of the semi-infinite body is subjected to the normal concentrated force F of the Boussinesq problem and combined with St. Venant’s principle, ignoring the influence of the specimen boundary, the stress magnitude at the midpoint of the loading axis as the origin, the vertical axis as the loading axis, and the horizontal axis is the stress magnitude axis, a right-angle coordinate system is established, and the stresses produced by the upper and lower two compressive stresses F on the loading axis are superimposed to obtain the compressive and tensile stresses at a point z on the loading axis [25,26,27,28]:
Poisson’s ratio μ of fine-crystalline granite, coarse-crystalline granite and siltstone were 0.200, 0.185, and 0.180, respectively, as measured by an indoor uniaxial compression test, and the distribution of tensile and compressive stresses on the loading axis of the rock sample point load could be analyzed by substituting Equations (1) and (2). The stress distribution states of three rock samples of different sizes under different loading rates were plotted, with the vertical axis coordinate scale being the ratio of the coordinate z of the corresponding point to the height a of the rock sample, and the horizontal axis coordinate scale being F/(2πa2). The plotted results are shown in Figure 6.
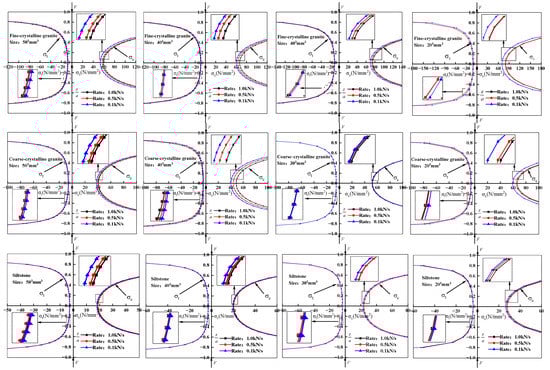
Figure 6.
Stress distribution of three rock samples of different sizes under different loading rates.
Analyzing the stress distribution states of the three rock samples under different loading rates, it was found that most of the areas inside the rock samples were subject to tensile stresses. The tensile and compressive stresses on the loading axes showed an increasing trend with the increase in rate; the difference in stress distribution of the rock samples due to the rate was mainly reflected in the compressive stresses, and the compressive stresses were more affected by the rate near the center of the loading axes. This is mainly because the loading rate has some influence on the damage load of the rock sample, and the distribution of tensile and compressive stresses in the rock sample is related to the damage load. Under the action of point load, the damage of the rock sample contains both the effect of tensile stress and compressive stress. The point load strength is a comprehensive reflection of uniaxial compressive strength and tensile strength, and the loading rate has a certain effect on the tensile and compressive stresses; therefore, it is realistic and feasible to consider the effect of loading rate on the point load strength.
4.3. Effect of Loading Rate and Rock Sample Size on Is(50)
There are many methods for solving Is(50), and four methods for solving Is(50) are summarized based on previous studies, as shown in Table 4. In this study, the effect of rate and size variation on several existing methods for solving Is(50) is investigated by using regular specimens of different sizes and controlling different loading rates.
Table 4.
Method of solving the standard point load strength.
4.3.1. Effect of Loading Rate on Is(50)
From the results of the preliminary tests, it is known that the loading rate and loading method affect the damage load, which is closely related to Is(50), so it is especially important to consider the effect of loading rate on Is(50). Figure 7 shows the relationship curves between Is(50) and loading rate for the three rock samples solved using different methods. From the overall trend, the Is(50) of different sizes of the three rock samples increased with the increase in loading rate, except for individual specimens due to the heterogeneity of the rock sample itself or the error of the test operation.
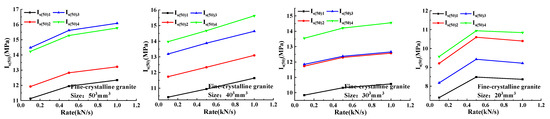
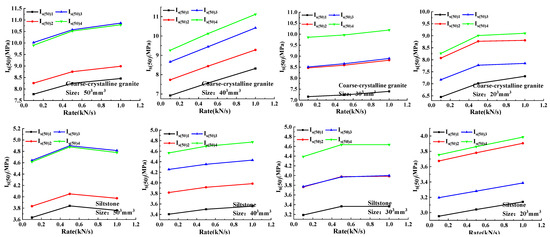
Figure 7.
Relationship between Is(50) and loading rate for three rock samples with different sizes.
For the three rock samples with different sizes, the effect of loading rate on Is(50) solved by different methods was analyzed and it was found that the curve shape changed as the size decreased. Taking Is(50)2 for fine-crystalline granite as an example, when the sizes are 503, 403, 303, and 203 mm3, the increase in Is(50)2 is larger in the loading-rate range 0.1–0.5 kN/s, and the growth rates of Is(50)2 are 0.076, 0.051, 0.048, and 0.150, respectively, while in the loading-rate range 0.5–1.0 kN/s, the growth rates of Is(50)2 are 0.031, 0.062, 0.023, and −0.019. This indicates that the effect of rate on Is(50)2 varies in different loading-rate ranges when the rock sample size is different, and the overall performance is that the growth rate of Is(50)2 is smaller in the larger loading-rate range than that in the smaller loading-rate range, but the effect of loading rate on Is(50)2 is almost linearly increasing for the rock sample of size 403 mm3.
4.3.2. Effect of Rock Sample Size on Is(50)
Referring to Figure 7, and using the size 503 mm3 as the reference point of each rock sample, the top-down blue line (Is(50)3), green line (Is(50)4), red line (Is(50)2), and black line (Is(50)1) in the image are noted as I3, I4, I2, and I1, respectively. At the same size, with the increase in loading rate, the ranking order of Is(50) solved by different methods for each rock sample remained the same; while with the decrease in size, the top-down ranking order changed and basically followed the pattern: I3, I4, I2, I1-I4, I3, I2, I1-I4, I3, I2, I1-I4, I2, I3, I1. It can be found that the ranking order of I2 showed an increasing trend with the decrease in size, I3 showed a decreasing trend with the decrease in size, and the ranking order of I1 and I4 remained basically the same.
This is due to the fact that Is(50) solved by different methods contains two components, the uncorrected point load strength index Is and the correction factor. Is(50)1 and Is(50)2 are corrected based on the point load strength index Is1 (Is1 is calculated using the equivalent diameter method), while Is(50)3 and Is(50)4 are corrected based on the point load strength index Is2 (Is2 is calculated using the loading-spacing method). Under the same size, with the increase in loading rate, the damage load increases, the change in loading rate only affects Is, and the correction coefficients of different methods only contain the size parameters, so the arrangement order remains the same. Under the same loading rate, the relationship between the magnitude of Is1 and Is2 always remained Is1 < Is2 as the size decreased, and the relationship curves between the load strength index and size of the three rock sample points, as shown in Figure 8. The order of the correction coefficients of different methods changed; the relationship curves between the correction coefficients and the size for the three rock sample points are shown in Figure 9.
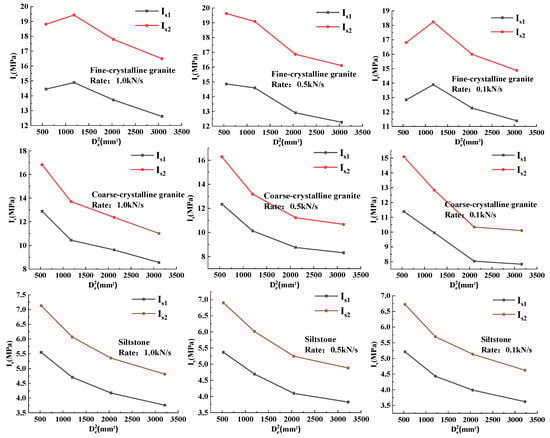
Figure 8.
Relationship between two point load strength indexes Is and size for the three rock samples under different loading rates.
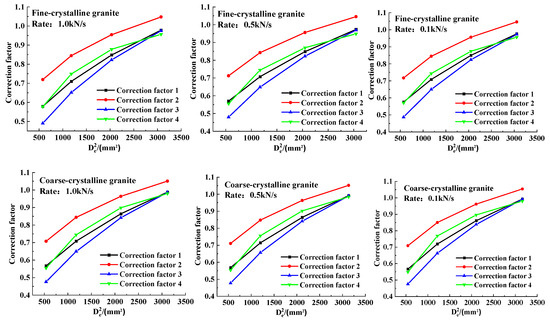
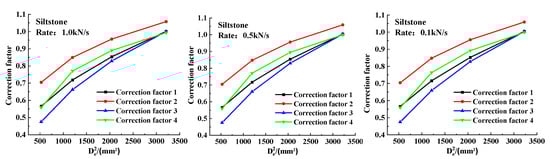
Figure 9.
Three correction factors versus size for the three rock samples at different loading rates.
4.3.3. Reasonable Is(50) Evaluation Method
Figure 10 shows the curves of Is(50) versus for three rock samples solved by different methods at different loading rates. The analysis shows that Is(50)1, Is(50)3, and Is(50)4 show an overall increasing trend with the increase in rock sample size, while Is(50)2 shows fluctuating changes with the increase in rock sample size and maintains an overall horizontal change trend. It indicates that the Is(50) values solved using methods I, III, and IV still have an obvious size effect, while the Is(50) solved using method II does not have an obvious size effect. Therefore, considering the effect of rock sample size on Is(50) for the different methods, it is more reasonable to use Is(50) solved by method II to predict the uniaxial compressive strength of rocks in the following analysis. It should be noted that even at the same loading rate, the degree of Is(50)2 for the three rock samples is affected by the differing size of the rock sample, and in practical engineering, specific analysis should be performed for different rock samples.
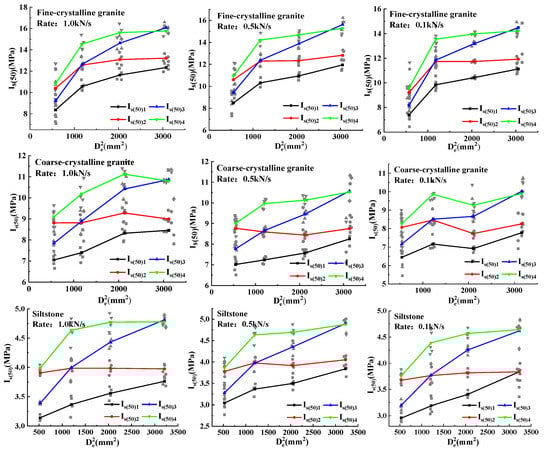
Figure 10.
The relationship between Is(50) and size of the three rock samples under different loading rates.
4.4. Analysis of Optimal Loading Rate and Stable Size Range for the Different Rock Samples
4.4.1. Optimal Loading-Rate Analysis
The effect of loading rate on Is(50)2 was considered to be non-negligible. The Is(50)2 values of different sizes of rock samples at the same loading rate were firstly obtained, and then the Is(50)2 values of different sizes of rock samples were averaged, and finally the average Is(50)2 values of three rock samples at different rates were obtained, as shown in Table 5, Table 6 and Table 7. The optimal loading rate was explored by analyzing the degree of variation in Is(50)2 for different sizes (the coefficient of variation index was used to evaluate).
Table 5.
Statistical table listing the variability of Is(50)2 for fine-crystalline granite with different sizes and loading rates.
Table 6.
Statistical table listing the variability of Is(50)2 for coarse-crystalline granite with different sizes and loading rates.
Table 7.
Statistical table listing the variability of Is(50)2 for siltstone with different sizes and loading rates.
In order to investigate the loading rate at which Is(50)2 is less affected by size, the coefficient of variation of Is(50)2 for different sizes of rock samples at the same the loading rate is obtained, and it can be seen that the coefficient of variation is the smallest for fine-crystalline granite, coarse-crystalline granite, and siltstone at the point load loading rates of 0.5, 0.5, and 1.0 kN/s. This indicates that the Is(50) solved using method II for different sizes rock samples at this loading rate is more reasonable and credible.
4.4.2. Stable Size Range Analysis
On the basis of the proposed optimal loading rate for the three rock samples, the reasonable size range of the rock samples was further investigated. Firstly, the strength difference between adjacent sizes of Is(50)2 was obtained for these three rock samples at the optimal loading rate, and then the average value of the strength difference was obtained; the results are shown in Table 8. It can be seen that the mean strength difference between adjacent dimensions of the three rock samples is the largest for fine-crystalline granite, followed by coarse-crystalline granite, and finally siltstone. This indicates that the greater the strength of the rock sample, the greater the influence of Is(50)2 by the size of the rock sample. Therefore, in practical engineering, the effect of size on Is(50)2 for large-strength rock samples should be considered.
Table 8.
Statistical table listing the Is(50)2 difference between different sizes for the three rock samples subjected to a reasonable loading rate.
In addition, it can be seen from Table 8 that fine-crystalline granite, coarse- crystalline granite, and siltstone square samples all have the smallest strength difference in Is(50)2 for the size range 303–403 mm3. This indicates that the stable size range of solving Is(50)2 for fine-grained granite, coarse-grained granite, and siltstone at loading rates of 0.5, 0.5, and 1.0 kN/s are all 303–403 mm3.
4.5. Relationship between Is(50) and Uniaxial Compressive Strength
Based on the reasonable calculation method of Is(50), optimal loading rate, and stable dimensional range derived in the previous paper, the relationship between Is(50) and uniaxial compressive strength is analyzed in order to obtain the uniaxial compressive strength of the rock more accurately. Previous studies have shown [2,33,34] that the linear zero-intercept function is generally recognized by domestic and foreign scholars for predicting the physical significance of the model in a more reasonable way. The uniaxial compressive strength formulation was solved jointly with the linear zero-intercept function.
The system of equations is:
where Rc is the uniaxial compressive strength (MPa), P is the breaking load (N), A is the cross-sectional area of the rock sample perpendicular to the loading direction (mm2), and Ki is the strength conversion factor
For the three rock samples in this paper, Table 9 lists the empirical conversion relationship equations given by relevant scholars at home and abroad, whose strength conversion coefficients range from 11.08 to 25.00. The strength conversion coefficients vary for different rocks, and even for the same rock; the strength conversion relationship varies greatly due to the different geographical conditions in which it is located. By substituting the uniaxial compressive strength obtained from the test with Is(50)2 into Equations (3) and (4), the empirical conversion equations for these three rocks were obtained, as shown in Table 10.
Table 9.
Conversion relationship between Is(50) and uniaxial compressive strength.
Table 10.
Empirical conversion formulas for the three rock samples.
The results show that the conversion coefficients for fine-crystalline granite, coarse-crystalline granite, and siltstone are 16.80, 15.32, and 14.60, respectively, which indicates that the conversion coefficients of rocks with high strength are higher compared to those with low strength. This phenomenon is consistent with that found in the literature [42,43], which also indicates that the results of this study are scientifically reasonable.
5. Conclusions
In this paper, the self-developed electro-hydraulic servo point load instrument was used to conduct point load test research on three rock samples at different loading rates. The following conclusions were obtained by analyzing the internal stress state of rock samples at different loading rates, the effect of loading rate, and dimensional changes on different Is(50), and establishing the empirical conversion equation between Is(50) and uniaxial compressive strength.
- (1)
- The tensile and compressive stresses in the loading-axis direction of the three rock samples under the action of point load increased with the increase in the loading rate. The difference in stress distribution of the rock samples brought by the influence of the loading rate was mainly reflected in the compressive stresses, and the compressive stresses were mostly influenced by the loading rate near the center of the loading axis of the rock samples.
- (2)
- With the increase in loading rate, Is(50) tends to increase, and when the loading rate increases to a certain range (0.5–1.0 kN/s), the growth of Is(50) tends to level off, and the influence of loading rate on Is(50) value is greatest at size 403 mm3. Is(50) solved using methods I, III, and IV have obvious size effect, while Is(50) solved using method II has no obvious size effect, so it is more reasonable to use Is(50) solved using method II to predict the uniaxial compressive strength of the rock.
- (3)
- The Is(50) solved by method II is more reasonable and reliable for fine-crystalline granite, coarse-crystalline granite, and siltstone in the size range 303–403 mm3 at loading rates of 0.5, 0.5, and 1.0 kN/s.
- (4)
- An empirical conversion relationship between Is(50) and uniaxial compressive strength was proposed for the three rock samples used in this analysis, and the strength conversion coefficients of 16.80, 15.32, and 14.60 were obtained for fine-crystalline granite, coarse-crystalline granite, and siltstone specimens, respectively. It indicates that the high-strength rock has a higher conversion coefficient than the low-strength rock.
Author Contributions
Conceptualization, X.Z. and L.Q.; formal analysis, X.Z. and L.Q.; funding acquisition, F.W.; investigation, Z.W. and J.W.; methodology, F.W. and L.Q.; data curation, Y.C. and Z.W.; resources, J.W. and Z.W.; validation, Y.C. and X.Z.; visualization, J.W.; writing—original draft, X.Z.; writing—review and editing, L.Q. All authors have read and agreed to the published version of the manuscript.
Funding
The project presented in this article was supported by the National Natural Science Foundation of China (41831290) and the Key Research and Development Project of Zhejiang Province (2020C03092).
Conflicts of Interest
The authors declare no conflict of interest.
References
- Lin, J. Experimental Study on Rapid Acquisition of Rock Strength Based on Homemade Portable Point Load Meter. Master’s Thesis, Shaoxing University, Shaoxing, China, 2017. (In Chinese). [Google Scholar]
- Broch, E.; Franklin, J.A. The point-load strength test. Int. J. Rock Mech. Min. Sci. Geomech. 1972, 9, 669–676. [Google Scholar] [CrossRef]
- Franklin, J.A. Suggested method for determining point load strength. Int. J. Rock Mech. Min. Sci. Geomech. 1985, 22, 51–60. [Google Scholar] [CrossRef]
- American Society for Testing and Materials (ASTM). Standard Test Method for Determination of the Point Load Strength Index of Rock and Application to Rock Strength Classifications; ASTM International: West Conshohocken, PA, USA, 2008. [Google Scholar]
- Kahraman, S.; Gunaydin, O. The effect of rock classes on the relation between uniaxial compressive strength and point load index. Bull. Eng. Geol. Environ. 2009, 68, 345–353. [Google Scholar] [CrossRef]
- Masoumi, H.; Saydam, S.; Hagan, P.C. Unified size-effect law for intact rock. Int. J. Geomech. 2016, 2, 04015059. [Google Scholar] [CrossRef]
- Haeri, H.; Sarfarazi, V.; Shemirani, A.B.; Hosseini, S.S. Experimental and numerical investigation of the effect of sample shapes on point load index. Geomech. Eng. 2017, 13, 1045–1055. [Google Scholar]
- Haeri, H.; Sarfarazi, V.; Zhu, Z.; Fatehimarji, M. Investigation of the model scale and particle size effects on the point load index and tensile strength of concrete using particle flow code. Struct. Eng. Mech. 2018, 66, 445–452. [Google Scholar]
- Zhu, J.J.; Luo, Q.; Zhan, X.Q.; Jiang, L.W.; Fang, D. Equivalent area method for point load strength evaluation of irregular soft phyllite. J. Rock Mech. Eng. 2018, 37, 2762–2771. (In Chinese) [Google Scholar]
- Wei, X.X.; Chau, K.T.; Wong, R.H.C. Theoretical and Experimental Validation of Point Load Strength Test for Irregular Lumps. J. Eng. Mech. 2019, 145, 04019065. [Google Scholar] [CrossRef]
- Hiramatsu, Y.; Oka, Y. Determination of the tensile strength of rock by a compression test of an irregular test piece. Int. J. Rock Mech. Min. Sci. Geomech. Abstr. 1966, 3, 89–90. [Google Scholar] [CrossRef]
- Reichmuth, D.R. Point load testing of brittle materials to determine tensile strength and relative brittleness. In Proceedings of the 9th US Symposium on Rock Mechanics (USRMS), Golden, CO, USA, 17–19 April 1967. [Google Scholar]
- Peng, S.S. Stress analysis of cylindrical rock discs subjected to axial double point load. Int. J. Rock Mech. Min. Sci. Geomech. Abstr. 1976, 13, 97–101. [Google Scholar] [CrossRef]
- Li, D.; Wong, L.N.Y. Point load test on meta-sedimentary rocks and correlation to UCS and BTS. Rock Mech. Rock Eng. 2013, 46, 889–896. [Google Scholar] [CrossRef]
- Kayabali, K.; Selcuk, L. Nail penetration test for determining the uniaxial compressive strength of rock. Int. J. Rock Mech. Min. Sci. 2010, 47, 265–271. [Google Scholar] [CrossRef]
- Heidari, M.; Khanlari, G.R.; Torabi Kaveh, M.; Kargarian, S. Predicting the uniaxial compressive and tensile strengths of gypsum rock by point load testing. Rock Mech. Rock Eng. 2012, 45, 265–273. [Google Scholar] [CrossRef]
- Diamantis, K.; Gartzos, E.; Migiros, G. Study on uniaxial compressive strength, point load strength index, dynamic and physical properties of serpentinites from Central Greece: Test results and empirical relations. Eng. Geol. 2009, 108, 199–207. [Google Scholar] [CrossRef]
- Yin, J.H.; Wong, R.H.C.; Chau, K.T.; Lai, D.T.W.; Zhao, G.S. Point load strength index of granitic irregular lumps: Size correction and correlation with uniaxial compressive strength. Tunn. Undergr. Sp. Technol. 2017, 70, 388–399. [Google Scholar] [CrossRef]
- Wang, Z.Y.; Qiao, L.; Zhang, F.; Wu, F.Q.; Chen, Y.H.; Zhou, X.X. Experimental study of point load strength of red sandstone based on size effect. Min. Res. Dev. 2022, 42, 61–68. (In Chinese) [Google Scholar]
- GB/T 50266-2013; Standard for Engineering Rock Mass Test Methods. China Plan Press: Beijing, China, 2013. (In Chinese)
- Franklin, J.A.; Pells, P.; McLachlin, D.; Brook, N.; Robins, P.J.; Greminger, M.; Kutter, H.; Broch, E.; van Heerden, W.L.; Vogler, U.W. A recommended method for determining the strength of point loads by the Experimental Methods Committee of the International Society of Rock Mechanics. J. Rock Mech. Eng. 1986, 5, 79–90. (In Chinese) [Google Scholar]
- Wu, F.Q.; Qiao, L.; Guan, S.G.; Zhang, Q.T.; Wang, Z.Y.; Wu, J. Study on the size effect of uniaxial compression test on small size rock samples. J. Rock Mech. Eng. 2021, 40, 865–873. (In Chinese) [Google Scholar]
- Wei, X.X.; Chau, K.T.; Wong, R.H.C. Analytic solution for axial point load strength test on solid circular cylinders. J. Eng. Mech. 1999, 125, 1349–1357. [Google Scholar] [CrossRef]
- Chau, K.T.; Wei, X.X. A new analytic solution for the diametral point load strength test on finite solid circular cylinders. Int. J. Solid. struct. 2001, 38, 1459–1481. [Google Scholar] [CrossRef]
- Wu, J.L. Mechanics of Elasticity; Higher Education Press: Beijing, China, 2001. (In Chinese) [Google Scholar]
- Yu, M.H.; Peng, Y.J. A hundred-year summary of strength theory. Adv. Mech. 2004, 34, 32. (In Chinese) [Google Scholar]
- Liao, J.J.; Wang, C.D. Elastic solutions for a transversely isotropic half-space subjected to a point load. Int. J. Numer. Anal Met. 1998, 22, 425–447. [Google Scholar] [CrossRef]
- Wang, C.D.; Tzeng, C.S.; Pan, E.; Liao, J.J. Displacements and stresses due to a vertical point load in an inhomogeneous transversely isotropic half-space. Int. J. Rock Mech. Min. Sci. 2003, 40, 667–685. [Google Scholar] [CrossRef]
- Cai, M.F. Rock Mechanics and Engineering; Science Press: Beijing, China, 2002. (In Chinese) [Google Scholar]
- Chen, Y.L.; Zhang, Y.; Lin, L. Relationship between point load strength and uniaxial compressive strength of conglomerate. Min. Eng. Res. 2020. (In Chinese) [Google Scholar]
- Hassani, F.P.; Scoble, M.J.; Whittaker, B.N. Application of the point load index test to strength determination of rock and proposals for a new size-correction chart. In Proceedings of the 21st US Symposium on Rock Mechanics (USRMS), Rolla, MO, USA, 27–30 May 1980; pp. 543–553. [Google Scholar]
- GB50218—94National Standard of the People’s Republic of China, Engineering Rock Classification Standard; Ministry of Construction of the People’s Republic of China, China Plan Press: Beijing, China, 1995. (In Chinese)
- Puech, A.; Becue, J.P.; Colliat, J.L. Advances in the design of piles driven into non-cemented to weakly cemented carbonate formations. In Engineering for Calcareous Sediments; CRC Press: London, UK, 2021; pp. 305–312. [Google Scholar]
- Kaya, A.; Karaman, K. Utilizing the strength conversion factor in the estimation of uniaxial compressive strength from the point load index. Bull. Eng. Geol. Environ. 2016, 75, 341–357. [Google Scholar] [CrossRef]
- Vallejo, L.E.; Welsh, R.A.; Robinson, M.K. Correlation between unconfined compressive and point load strengths for Appalachian rocks. In Proceedings of the 30th US Symposium on Rock Mechanics (USRMS), Morgantown, WV, USA, 19–22 June 1989. [Google Scholar]
- Ghosh, D.K.; Srivastava, M. Point-load strength: An index for classification of rock material. Bull. Int. Assoc. Eng Geol-Bull. l’Assoc. Int. Géologie l’Ingénieur. 1991, 44, 27–33. [Google Scholar] [CrossRef]
- Chau, K.T.; Wong, R.H.C. Uniaxial compressive strength and point load strength of rocks. Int. J. Rock Mech. Min. Sci. Geomech. Abstr. 1996, 33, 183–188. [Google Scholar] [CrossRef]
- Zeng, W.X.; Xu, H.Q. Statistical methods and applications of point load test results on rocks. J. Rock Mech. Eng. 2001, 20, 962–965. (In Chinese) [Google Scholar]
- Basu, A.; Aydin, A. Predicting uniaxial compressive strength by point load test: Significance of cone penetration. Rock Mech Rock Eng. 2006, 39, 483–490. [Google Scholar] [CrossRef]
- Akram, M.; Bakar, M.Z.A. Correlation between uniaxial compressive strength and point load index for salt-range rocks. Pak. J. Eng. Appl. Sci. 2007, 1. [Google Scholar]
- He, L.B.; Fu, Z.L.; Wang, Q.; Fang, T.J.; Gao, N.N. Linear relationship test between point load strength and uniaxial compressive strength of rocks. Coalf. Geol. Explor. 2014, 42, 68–73. (In Chinese) [Google Scholar]
- Sabatakakis, N.; Koukis, G.; Tsiambaos, G.; Papanakli, S. Index properties and strength variation controlled by microstructure for sedimentary rocks. Eng. Geol. 2008, 97, 80–90. [Google Scholar] [CrossRef]
- Singh, T.N.; Kainthola, A.; Venkatesh, A. Correlation between point load index and uniaxial compressive strength for different rock types. Rock Mech. Rock Eng. 2012, 45, 259–264. [Google Scholar] [CrossRef]
Publisher’s Note: MDPI stays neutral with regard to jurisdictional claims in published maps and institutional affiliations. |
© 2022 by the authors. Licensee MDPI, Basel, Switzerland. This article is an open access article distributed under the terms and conditions of the Creative Commons Attribution (CC BY) license (https://creativecommons.org/licenses/by/4.0/).