Article

Lightweight and Parameter-Optimized Real-Time Food Calorie Estimation from Images Using CNN-Based Approach

by
Rakib Ul Haque
1,2,
Razib Hayat Khan
1,2,*,
A. S. M. Shihavuddin
1,2,
M. M. Mahbubul Syeed
1,2 and
Mohammad Faisal Uddin
1,2
1
RIoT Research Center, Independent University, Dhaka 1229, Bangladesh
2
Department of Computer Science and Engineering, Independent University, Dhaka 1229, Bangladesh
*
Author to whom correspondence should be addressed.
Appl. Sci. 2022, 12(19), 9733; https://doi.org/10.3390/app12199733
Submission received: 11 August 2022 / Revised: 21 September 2022 / Accepted: 22 September 2022 / Published: 27 September 2022

Abstract

:
Automated object identification has seen significant progress during the last decade with close to human-level accuracy, aided by deep learning methods. With the rapid rise of obesity and other lifestyle-related diseases worldwide, the availability of fast, automated, and reliable image-based food calorie estimation is becoming a necessity. With the help of a deep learning-based automated object identification system, it is possible to introduce accurate and intelligent solutions in the form of a mobile app. However, for these kind of applications, processing speed is an important concern as the images should be processed in real time. Although plenty of studies have been conducted that focus on food image detection-based calorie estimation, there is still a lack of an image-driven, lightweight, fast, and reliable food calorie estimation system. In this paper, we propose a method based on the parameter-optimized Convolution Neural Networks (CNN) for detecting food images of regular meals using a handheld camera. Once identification process of the food items are complete, the corresponding calories and nutritional facts can be calculated using prior knowledge about the food class. Through our findings, we demonstrate that our proposed approach ensures high accuracy and can significantly simplify the existing manual calorie estimation procedures by converting them into a real-time automated process.

1. Introduction

In the last few decades, obesity has become a major health issue. Obesity increases the risk of many fatal diseases such a diabetes, heart attack, high cholesterol, some form of cancers (breast and colon cancer), and respiratory problems [1]. One of the main reasons for the increase in obesity is unhealthy dietary habits. Unhealthy dietary habits can be eating unhealthy foods, eating foods that contain a large amount of sugar, or just overeating. A person is considered obese when the Body Mass Index (BMI) of that person is greater than 30 kg/m 2 [2]. In order to maintain a healthy BMI, daily food intake should be within a prescribed limit. In other words, tacking obesity requires consumption of nutritious meals with a proper calorie intake. Therefore, it is very important to have effective means of estimating and tracking one’s daily calorie consumption. Measuring approximate calories directly from the food can be a great abetment in this regard. However, to the best of our knowledge, there is no medical technology that can calculate in real time the amount of calories contained in any food. The conventional practice followed in food industry labels the calorie count of each ingredient that is used to prepare a food item. For instance, one of the largest fast food restaurant chains, McDonald’s, labels the amount of calories against each ingredient within a food item [3]. This labeling is performed manually based on a calorie table suggested by the health care experts [4]. The process, however, is expensive, laborious, error-prone, time-consuming, and most importantly, it has a small impact on controlling the calorie intake of an individual.
A much pragmatic solutions to this problem would be to design and develop a real-time image recognition based food calorie estimation system. This system would offer a fast and inexpensive way of calorie measurement with sublimer accuracy. For the reference, a food image recognition system is a kind of computer vision that can automatically recognize the food images based on a supervised data set. However, developing a food image based classification system is challenging due to the advent variations of images resulting from heterogeneous conditions, e.g., changing in light conditions, food shapes, and occlusions, among others [5]. Therefore, considering a suitable set of parameters is necessary when designing pattern recognition systems within the parameters of supervised learning [6].
Research on this track mainly emphasizes on recognizing the food images [7,8], with a very little focus on estimating the food calories through image recognition [9,10]. An assessment on the reported results reveals that the methods are mostly expensive in terms of time and computational complexity [11]. Moreover, the majority of the image recognition methods are inconvenient for a meal with multiple food items, and are not designed for estimating the food calories [12]. Therefore, it is important to have a food calorie estimation method that is both lightweight and optimized in relation to space and time complexity for recognizing multiple items simultaneously at a time. In this connection, computer vision-based approaches, such as Convolution Neural Networks (CNN), are proven effective as a lightweight real-time image classification method for estimating the calories from food images [13].
Taking advantage of the CNN method, this study involves the design of an automated calorie estimation system with the help of neural networks to ensure better accuracy compared with the existing methods. This system can be run on a smart device equipped with a built-in camera, making it easy to recognize food items in estimating the constituent calories by leveraging a predefined data set of daily food intake. The developed image recognition method is a soft real-time system. The user request can be processed in milliseconds to offer real-time response to the user. This system uses image processing and segmentation to identify food items of any shape and size (e.g., apples, bananas, mango, donuts, etc.) from the food image, measures each food item’s volume, and matches that information with the current nutritional fact table. Additionally, the segmentation characteristics are enhanced by the texture, color, shape, and object size, as these parameters play a pivotal role in recognition. The core contribution of this work is summarized bellow:
  • Developing a parameter-optimized lightweight CNN model to instinctively analyze food images, and estimate constituent calorie by detecting distinct items in it;
  • Training and optimizing the model performance to achieve an accuracy of 85%;
  • Undertake a comparative assessment among different configurations of the CNN-based approach in relation to accuracy, speed, and complexity.

2. Literature Review

The literature survey explores extensively the research results that concentrate on the image classification and calorie estimation. Consequently, a comparative performance analysis of the proposed models is conducted in five distinct categories, e.g., real time, optimized time complexity, optimized space complexity, and the satisfactory score. A satisfactory score can be comprehended as a performance indicator for a system with accuracy above 80%. The executive summary of this assessment is documented in Table 1 which also presents the distinctive contribution of this study in comparison with the existing ones on this track.
In [14], Hoashi et al. propose an automated food image recognition system for 85 categories of foods by combining different image features, such as the Gabor features, the color histogram, the bag of features (BoF), and the gradient histogram with Multiple Kernel Learning (MKL). However, this work only focuses on the image classification, and not on calorie estimation. In [15], Pouladzadeh et al. present a food calorie and nutrition measurement system based on support vector machine (SVM). Their approach employs food image processing and utilizes nutritional information from the nutrition table. The system is deployed in smartphones, and it scores issues. In [16], Liang and Li focus on a unique food image data set including mass and volume records for the foods. They exploit a deep learning technique (Faster R-CNN) for food identification and comprehensive calorie estimation. Their data set comprises of 2978 pictures. However, the approach does not consider the real-time characteristics for the calorie estimation. In [17], Raikwar et al. focus on estimating the calorie count of the food using images as input. The food image is processed through several image processing techniques before being applied to the SVM. However, the author does not cover the real-time characteristic for the estimation.
In [18], Menezes et al. discuss the latest object identification methods, such as you only look once, faster region convolutional neural network, and single-shot multibox detector. The authors, however, do not focus on the real-time food calorie estimation. In [13,19,20,21], the authors employs a deep learning (DL)-based model for food calorie estimation based on various food images. Even so, these models are time-consuming and do not support real-time estimation. Other studies also explore the application of DL models for food calorie measurement. For instance, in [22], Kasyap et al. uses a DL model for food calorie measurement with an error reduction of 20%. In [23], Ayon et al. deploy a novel DL model on the webpage images to predict food calorie content in real time. In [24], Okamoto et al. utilize a similar approach by crawling the web for food images and preprocessing them to train a DL model for food calorie estimation.
Similar work in progress estimates the calorie content of a meal directly from recipe images [25], but suffers from scalability and real-time performance issues. In [26], Naomi et al. use HoloLens to estimate the actual size of the food and associated calories with high recognition time.
In [27], Jelodar and Sun develop a pipeline for calorie estimation and meal reproduction for different servings of the meal. However, the focus is on the accuracy only, leaving their method highly expensive in terms of computation and scalability. In [28], Naritomi and Yanai introduce the concept of hungry networks in which they reconstructs the 3D shape of the dish and plate from a single image. This method increases the processing time as 3D images require a substantial amount of processing time. In [29], Subaran et al. aim to improve the accuracy of the segmentation processes and calorie calculation using a combination of Mask R-CNN and GrabCut algorithms, which requires approximately three minutes to compute. In [30], Siemon et al. targets the same with a hierarchical clustering-based transfer learning method for greater accuracy. However, their method requires prior clustering information of the food and adds overhead to the calculation. Finally, in [31], Zaman et al. uses the 3D volume estimation of the food images and corresponding nutrition volume estimation, which requires a special setup to run and thus make it unfit to use for real application.
The accumulation of the above arguments leads to the conclusion that the contemporary methods fail to fulfill all five characteristics cited in Table 1. This study takes this opportunity to fill this research gap through the development of a lightweight CNN-based real-time food calorie estimation system. This system can also be deployed in smart devices for everyday use.
Table 1. Comparative analysis of food calorie systems a.
StudiesYearFood Calorie EstimationReal TimeOptimize Time ComplexityOptimize Space ComplexitySatisfactory Score
Hoashi et al. [14]2010
Pouladzade et al. [15]2014
Liang & Li [16]2017
Raikwar et al. [17]2018
Meneze et al. [18]2019
Zaman et al. [31]2019
Poply et al. [13]2020
Latif et al. [19]2020
Shen et al. [20]2020
Ruede et al. [25]2020
Kasyap et al. [22]2021
Ayon et al. [23]2021
Darapaneni et al. [21]2021
Okamoto et al. [24]2021
Naritomi et al. [26]2021
Jelodar & Sun [27]2021
Naritomi & Yanai [28]2021
Siemon et al. [30]2021
Subaran [29]2022
Proposed system2022
a Here, ’✓’ means covered and ’−’ means not covered.

3. Preliminaries

3.1. Real-Time System

A real-time system is bound to provide response within pre-specified time bounds. Real-time systems can be classified along two axes, namely, hard real-time system, and soft real-time system. For the earlier system, the specified time constrains must be met with no exception, whereas, for the later, the time bound might occasionally fail with very low probability [32]. The real-time system proposed in this study is of the soft type.

3.2. Deep Learning and CNN

Convolutional neural networks (CNN or ConvNet) are a type of deep learning-based artificial neural network (ANN) that is most commonly applied on the visual image classification in the multiclass data set [33]. The CNN is not a fully connected network, and, therefore, it reduces the computational intensity [34]. This characteristic makes CNN a better choice for image classification problems [35]. A classical model of CNN consists of the following layers.
  • Convolution Layer: The computer stores image data as a matrix where every individual pixel value of the image is preserved. In this layer, different filters play active roles. A filter is also a matrix, but smaller than the input matrix of any image. In a convolution layer, every filter dimension is the same, but values may differ. When an image is fed into one of these filters, the filter scans the matrix of the image, performs a dot product between the matrix value of the image and filter, adds all the values and a new matrix is generated as an output of this layer.
  • Max Pooling Layer: The max-pooling layer is commonly used after every convolution layer. The main task of this max-pooling layer is the feature extraction. It finds and extracts the dominant feature from the matrix generated in the convolution layer, ignoring the less important ones. This makes the deep learning model much more efficient.
  • Dense Layer: The dense layer is a fully connected layer. Every neuron or filter of the dense layer is connected to every output node of the previous layer. It is actually a small traditional neural network inside the CNN [36]. It feeds all outputs from the previous layer to all its neurons where each neuron provides one output to the next layer.
  • ReLu (Rectified Linear unit) Activation: This activation function improves the decision and nonlinear features of the network without changing the receptive fields of the convolution layer. ReLU is often preferred over other nonlinear functions used in CNNs (such as hyperbolic tangent, absolute of hyperbolic tangent, and sigmoid) because it trains the neural network several times faster without a significant penalty to generalization accuracy.
  • ADAM Optimizer: Adam is a stochastic gradient descent optimization method that may be used in place of the conventional stochastic gradient descent technique to update network weights which are iterative based on training data [37]. It holds the decreased average of the past squared gradients v ( t ) such as AdaDelta and RMSprop; it furthermore holds a decreased average of past gradients m ( t ) , i.e.,
    m ( t ) = β 1 m ( t 1 ) + ( 1 β 1 ) δ w ( t )
    v ( t ) = β 2 v ( t 1 ) + ( 1 β 2 ) δ w ( t )
  • SoftMax Function: This function transforms a vector of K real values and converts it to a vector of K absolute values that sum to one. Although the input values may be positive, negative, zero, or more than one, SoftMax converts them to values between 0 and 1 that can be interpreted as probabilities.
    σ ( z ) i = e z i j = 1 K e z j
    Here, z i values are input vector elements and may take any real value. The normalizing factor at the bottom of the formula guarantees that the summation of all the function’s output values equals one.
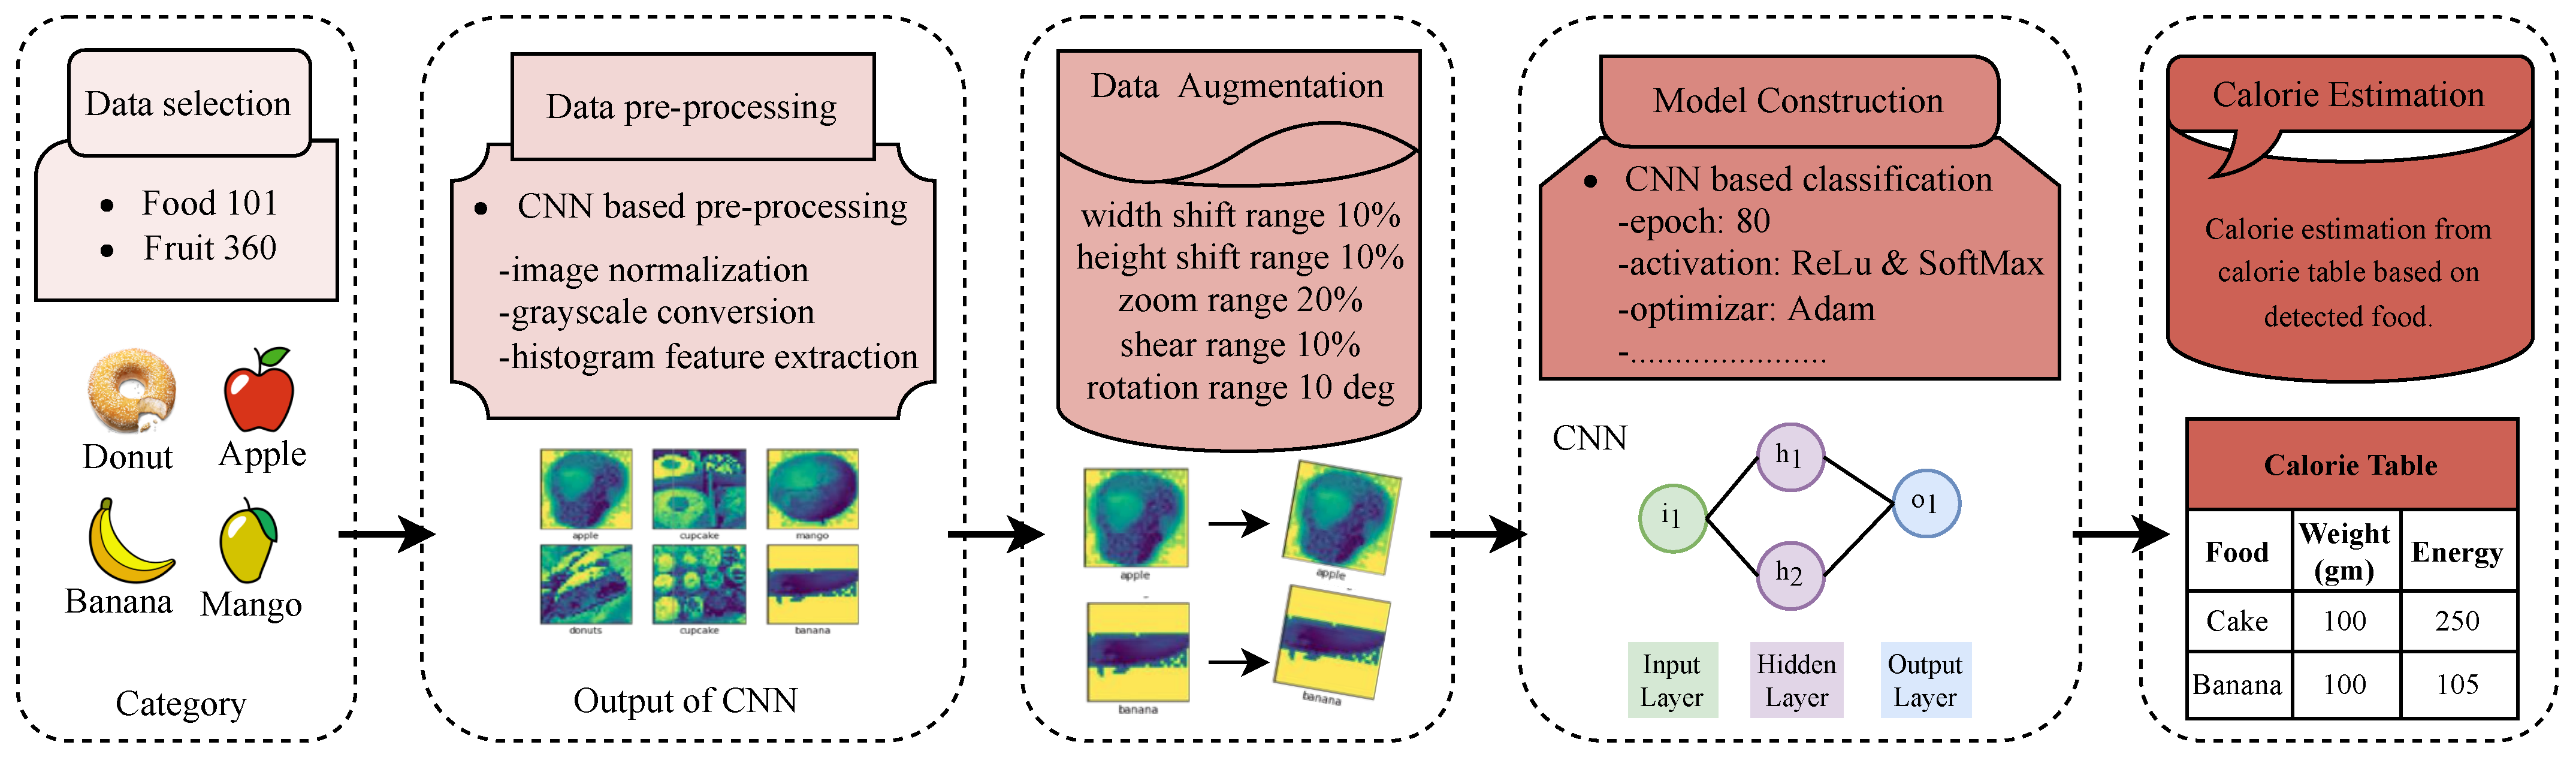
4. Methodology

This research work is realized by the following tasks: data set selection, data set pre-processing, data augmentation, and model construction. The below Figure 1 illustrates the different tasks of our methodology.

4.1. Data Set Selection

This study uses a qualitative data set with the aim of performing classification. The data set contains images of five types of food. The data set is symmetric which means that the instance of each type of food item in the dataset is equal. Two data sets were chosen from Kaggle with the intention of achieving a result with greater accuracy. The two data sets are Food-101 [38] and Fruit-360 [39]. These data sets contain RGB images of food items. Each category contains 1000 images. Each category of food images was preserved along with the top and side view of the food items. An implicit food calorie list along with food volume is also associated with each data set for the purpose of estimating calories. Table 2 illustrates the data set with different parameters.

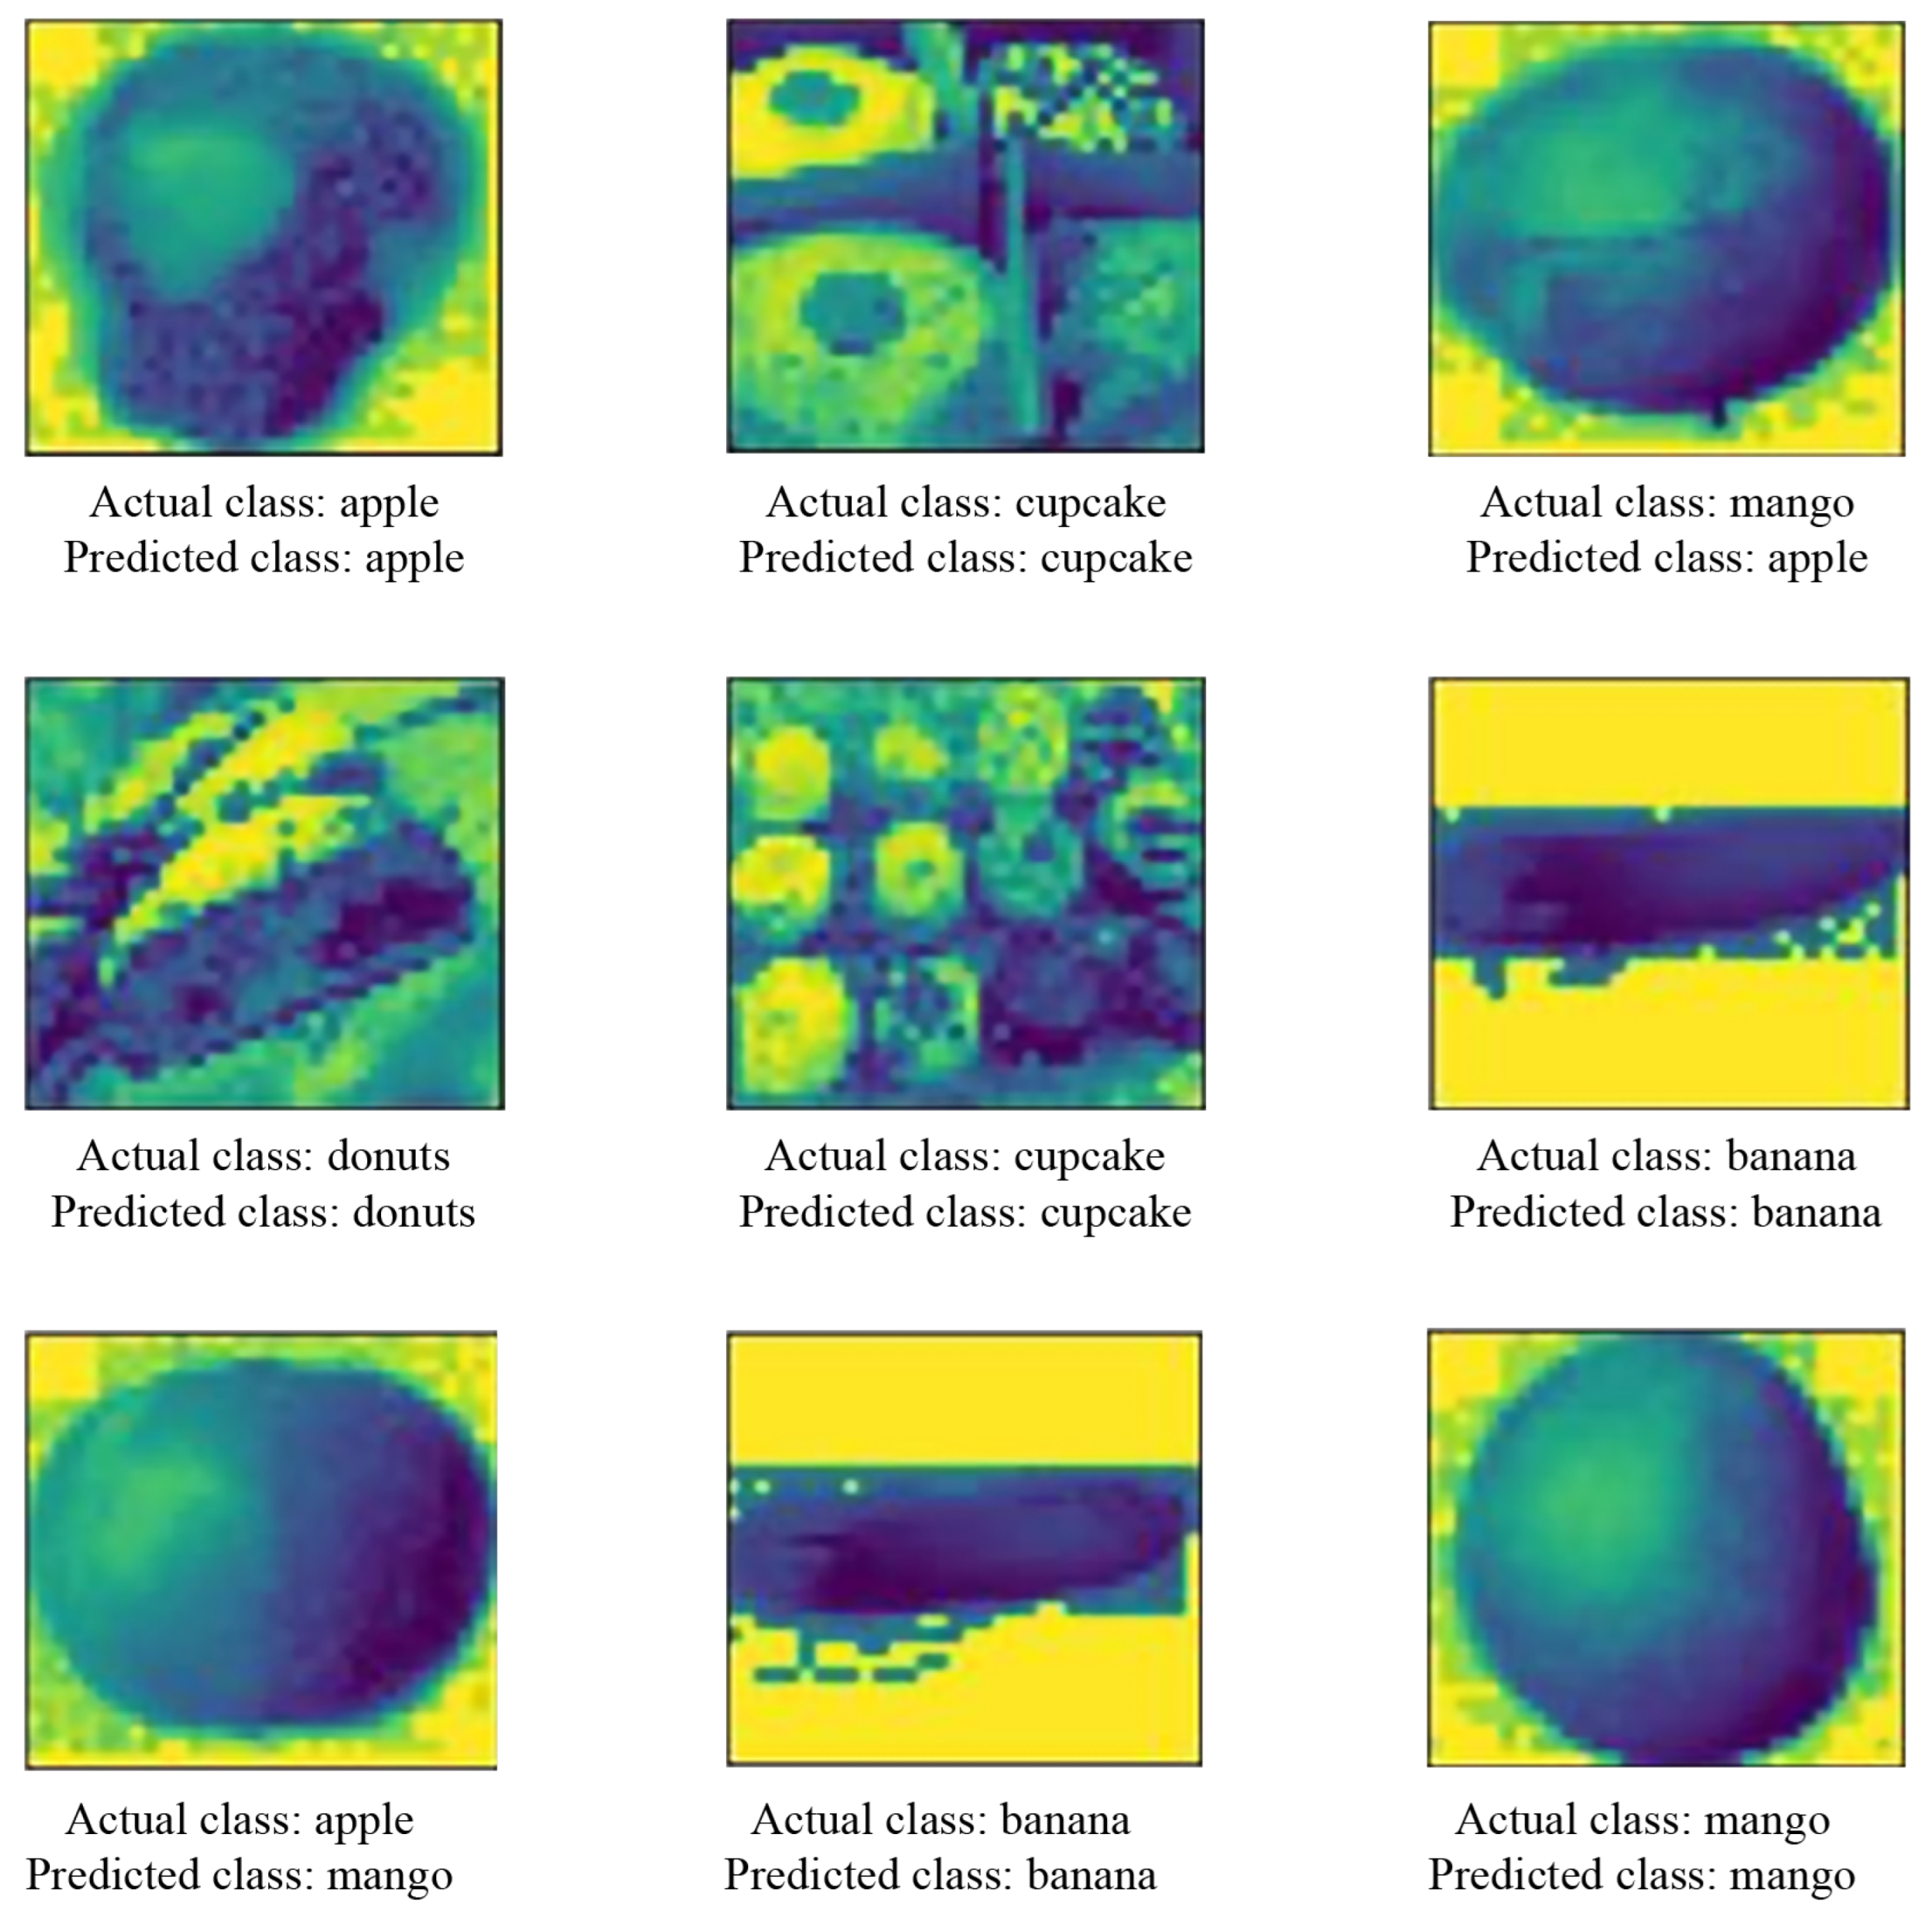
4.2. Data Set Preprocessing

This step is mainly applied to facilitate the resizing of the image in the data set, and the final size of the images is 32 × 32 pixels. After that, the image normalization process was applied to the data set based on the RGB values of the images. Image normalization ensures optimal assessment across data-gaining methods and texture instances. Subsequently, this study divides the RGB color channel into 255 values to convert the images of the data set to grayscale. This ultimately normalizes the range of the RGB values of the corresponding images. Following the image conversion to grayscale, the histogram feature extraction method has been applied. An image histogram is a grayscale value distribution that shows the frequency of occurrence with which a gray level value appears. The histogram analysis assumes that the grayscale values of foreground (anatomical structures) and background (outside the patient boundary) are distinguishable. It also adjusts the global contrast of an image by updating the pixel intensity distribution.

4.3. Data Augmentation

Data augmentation refers to a technique for increasing data quantity by inserting slightly modified copies of existing data or creating new synthetic data from existing data. While performing the training of an ML model, this process serves as a regularizer and helps to minimize the overfitting problem. Overfitting has been described as the unintentional extraction of some residual variance (i.e., noise) reflected in the underlying model structure [40]. This study uses data augmentation for the same purpose. We used the image data generator function from the TensorFlow library to augment the data set. The function belongs to the Keras subclass of TensorFlow and falls under the image subclass [41]. Table 3 illustrates the augmented parameters. This study divides the training, validation, and testing into 80%, 10%, and 10%, respectively.

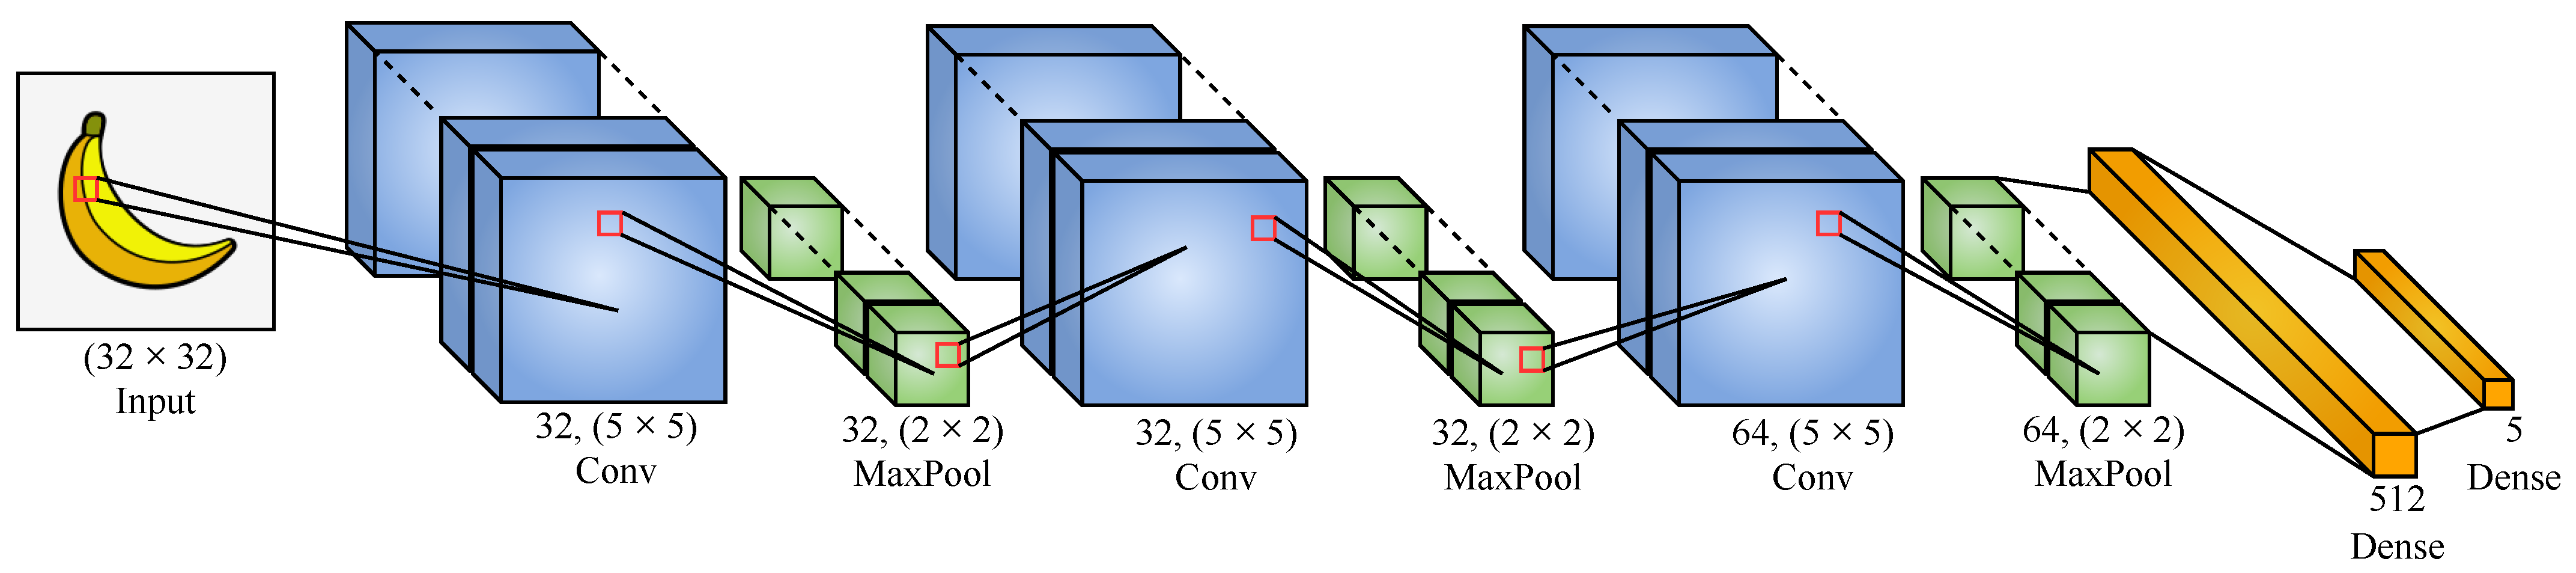
4.4. Model Construction

Finding the best model configuration for a custom data set is a demanding task. This study has developed a general model using some fine-tuned parameters to find the best model for the custom data set. Subsequently, this study was able to generate 81 different custom models for the developed CNN method. Figure 2 illustrates the architecture of the CNN model.
This study uses several fine tuned parameters such as filter size, filter number, pool size, and dense node to generate the CNN model. Conv2D layer, relu, and other activation functions are also used in this process. Among 81 CNN models, model 44 has achieved the most accuracy which has been discussed in the following section.
The execution time along with various parameters of the best 10 models is illustrated in Section 5. It is important to note that there is no machine to measure the exact amount of calories contained within any food item and no pre-labeled food calorie image dataset is available that can train any model.

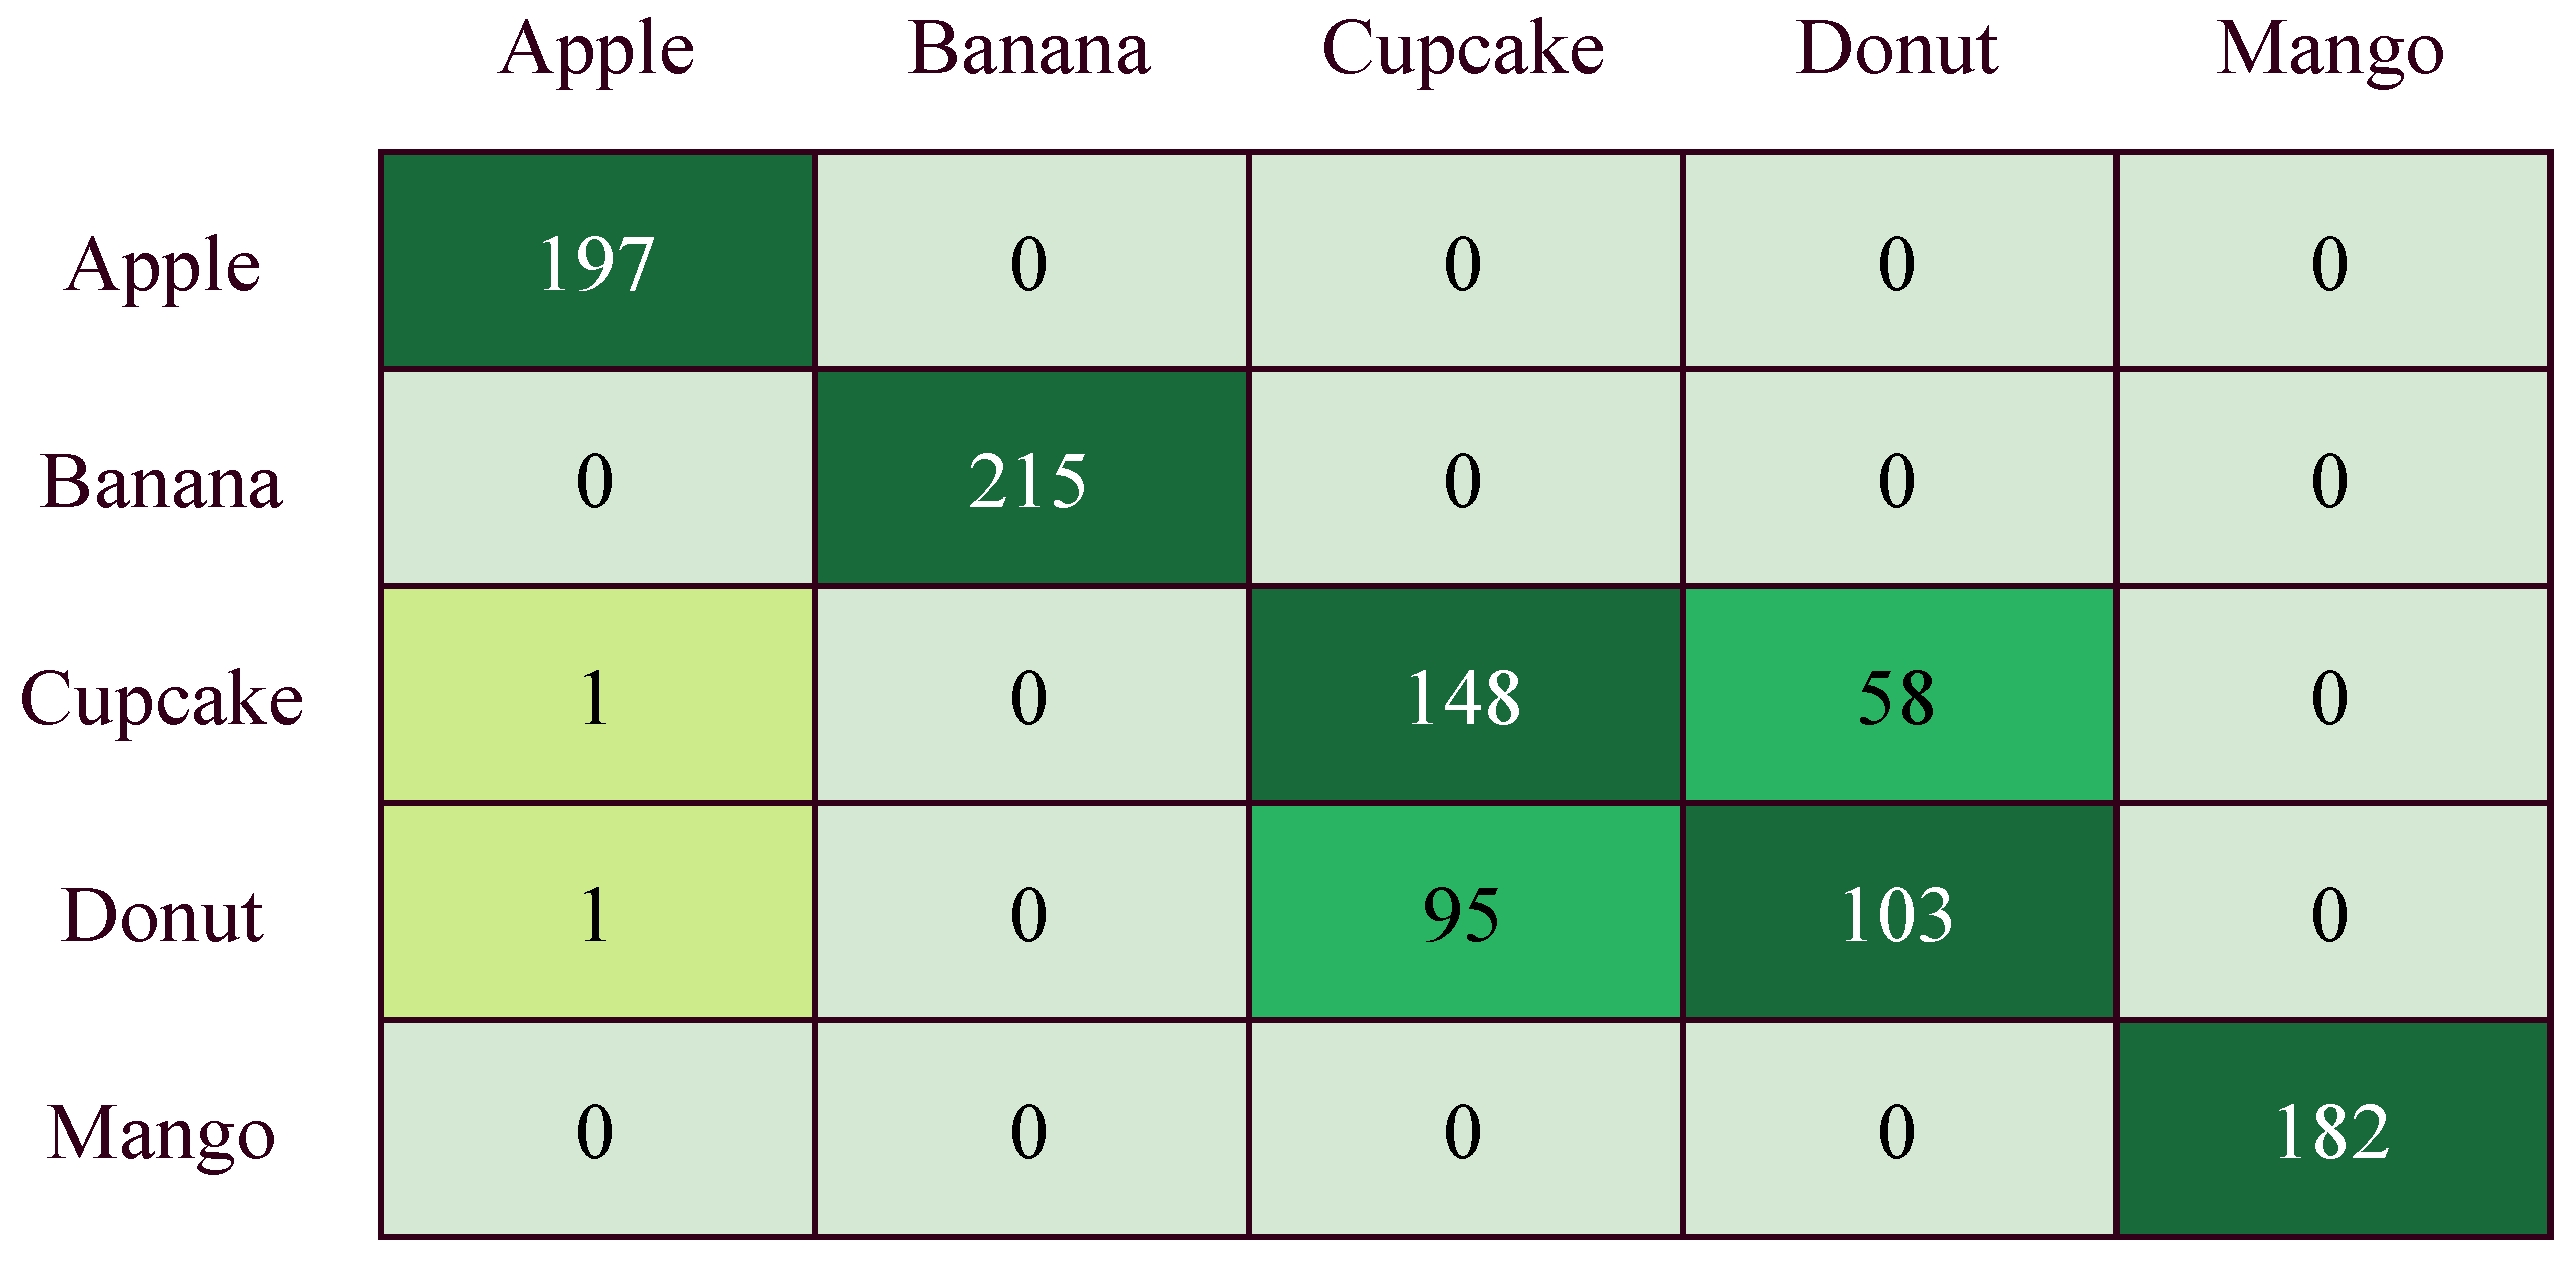
5. Results and Findings

This section defines the performance evaluation matrix (such as inference time and model space complexity) and also describes the performance of the model. The inference time of a model is the time required to complete all the model operations.
inference time = FLOPs FLOPS
  • FLOPs: To measure the inference time of a model, we have calculated the total number of computations performed by the model. This is where we mention the term Floating Point Operation (FLOP). This could be an addition, subtraction, division, multiplication, or any other operation that involves a floating point value. The FLOPs provide the complexity of the model.
    Convolutions FLOPs = 2 × Number of Kernel × Kernel Shape × Output Shape
    Fully Connected Layers FLOPs = 2 × InputSize × Output Size
  • FLOPS: The next term is the Floating Point Operations per Second (FLOPS). This term provides information on the efficiency of the hardware system. For this study, 1 FLOPS is considered as 1,000,000,000 operations per second.
For a real-time food calorie estimation system, calculating space complexity is very important. The space complexity of a CNN model is realized by the following equation.
CNN model space complexity = ( c w h k + k ) × p
where c, w, h, and k stand for the number of kernels, wide, height, and the number of output channels, respectively. p stands for the number of bytes per element. For this study, 4 bytes (floating point) per element are considered.
The model with higher accuracy, and a lesser disparity between the training and validation accuracy ensures the higher performance of the model. On the other hand, the loss function is evaluated by discovering the most suitable hyperparameter for the particular model. All models have been trained applying 80 epochs. Fine tuning of models and model-oriented parameters are used to improve the performance of the models. For model tuning, the filter numbers are set to [16, 32, 64], and the filter sizes are set to [(3,3), (5,5), (7,7)]. Filtering is usually applied to remove noise and undesirable artifacts from the image data set. Model-oriented parameters such as pool size (2,2) are used for feature extraction, dense node (512) is used for the comparison of the images, and the drop (0.5) function is used to prevent overfitting problem. Activation functions such as ReLu and SoftMax are used to prevent the interrupted probabilities of the feature map. Adam optimizer is used to optimize the data. A total of 81 models were generated and these are divided into four groups, which are shown in Table 4. Most of the models were unable to perform as expected. The accuracy is almost 79–80%. However, models with filter size (5,5) provide better validation accuracy than models with filter sizes (3,3). The finest 10 models are shown in Table 5 with detail comparison.
The table illustrates that model 44 reveals the best result where the filter size is (5,5), pool size is (2,2), and the filter number is set to (32,32,64). Model 44 gives the highest training and test accuracy along with the highest validation. Model 44 is able to accomplish 86% validation accuracy and 84.9% test accuracy. The graph shows that model 44 reveals 25% validation loss and 26% test loss, which is lower than the other illustrated models. The training accuracy is 84%, and the training loss is 31%. Figure 3 shows the confusion matrix of model 44. Figure 4 shows the predicted and actual class of food images. Figure 5 shows the line chart between accuracy and time for the top 10 models where model 44 is the most efficient.
Further analysis was performed based on three parameters such as accuracy, light weightiness, and speed to identify the best model in real time. The scenario is shown in Figure 6 as a ternary diagram. Min–max scaling was performed on the accuracy, space, and time at first. All values are rounded up to two decimal places. Lightweightiness and speed were calculated by subtracting scaled space and time from 1, respectively. Considering the Ternary diagrams, it is clear that model 17 outperforms all other models based on three parameters. In the ternary graph, the value which is closer to the center of the triangle is considered to be the best one. Model 17 lays close to the center of the ternary diagrams while comparing with other models which reveals it as the most suitable model for the food calorie estimation.

6. Discussion

The research work proposed an efficient CNN model to achieve the authors’ research goals. The model has worked well because of the proper distribution of internal neurons in the dense layers. It also has a decent number of drops in neuron connections that prevents the overfitting problem. In the CNN, we have used custom models for our data set where different filter numbers and filter sizes were used. Moreover, it shows that the best model varies depending on the perspective—based on which the observation is performed. Here, if the study considers accuracy and time, then model 44 is the best choice. Model 44 requires a processing time of 0.008 s, which means it can process 125 frames per second. Even with additional overheads, our model processes 60 frames per second and it can easily be deployed as mobile-based real-time applications. Again, if the study considers accuracy, time, and space, then model 17 is the best choice.
The system is intended to assist dietitians in treating both obese and overweight individuals. Individuals will benefited from using the system that will allow for better control over their regular eating habits. However, there is always a room for improvement. The same applies to the proposed model. However, for better understanding, it is important to train the model with various food images that will enable the model to identify all sorts of food items. This study is limited to achieving this feature due to the lack of a high-quality image data set according to the required criteria. A real-time data analysis with the present system was achieved using a laptop camera. However, in future, this research will aim to make the system compatible with various smart handheld devices. Currently, the calorie estimation of the food images uses custom data sets. Additionally, feature extraction is crucial for increasing the accuracy of an image recognition system’s training and validation. However, the proposed models were unable to achieve an accuracy of more than 90%. In future, an attempt will be made to enhance the process of the food image recognition system for feature extraction, thus increasing the training and validation accuracy. Apart from that, there is a plan to work with the various food volumes to obtain the most accurate food calorie estimation.

7. Conclusions

Automated food image identification and corresponding nutrition content estimation with maximum accuracy are essential in food habit moderation. In this research, a lightweight, optimum CNN model is developed, experimenting with varied configurations and scoring around 85% in accuracy. The method can easily be trained and applied to customized data sets with higher accuracy using simple linear operations. The system can contribute to resolving a societal issue by allowing both obese and normal weight individuals to maintain a diet plan depending on their daily calorie intake. Nevertheless, more precise work is planned to be conducted in this area of food image recognition and calorie estimation with better accuracy.

Author Contributions

Conceptualization, R.H.K.; methodology, R.U.H., R.H.K. and A.S.M.S.; software, R.U.H.; validation, R.H.K., A.S.M.S. and M.M.M.S.; formal analysis, R.U.H., A.S.M.S. and M.M.M.S.; investigation, R.U.H.; resources, R.U.H. and R.H.K.; data curation, R.U.H.; writing—original draft preparation, R.U.H.; writing—review and editing, R.U.H., M.F.U. and A.S.M.S.; visualization, R.U.H.; supervision, M.M.M.S.; project administration, R.H.K.; funding acquisition, M.F.U. All authors have read and agreed to the published version of the manuscript.

Funding

This research received no external funding.

Institutional Review Board Statement

Not applicable.

Informed Consent Statement

Not applicable.

Data Availability Statement

Not applicable.

Conflicts of Interest

The authors declare no conflict of interest.

References

  1. Bray, G.; Bouchard, C. (Eds.) Handbook of Obesity-Volume 2: Clinical Applications; CRC Press: Boca Raton, FL, USA, 2014. [Google Scholar]
  2. Prentice, A.M.; Jebb, S.A. Beyond body mass index. Obes. Rev. 2001, 2, 141–147. [Google Scholar] [CrossRef]
  3. Petimar, J.; Ramirez, M.; Rifas-Shiman, S.L.; Linakis, S.; Mullen, J.; Roberto, C.A.; Block, J.P. Evaluation of the impact of calorie labeling on McDonald’s restaurant menus: A natural experiment. Int. J. Behav. Nutr. Phys. Act. 2019, 16, 99. [Google Scholar] [CrossRef]
  4. Health Canada. Health Canada Nutrient Values. November 2011. Available online: https://www.canada.ca/en/health-canada/services/food-nutrition/healthy-eating/nutrient-data/nutrient-value-some-common-foods-booklet.html (accessed on 31 August 2022).
  5. Kasar, M.M.; Bhattacharyya, D.; Kim, T.H. Face recognition using neural network: A review. Int. J. Secur. Its Appl. 2016, 10, 81–100. [Google Scholar] [CrossRef]
  6. Li, G.Z.; Bu, H.L.; Yang, M.Q.; Zeng, X.Q.; Yang, J.Y. Selecting subsets of newly extracted features from PCA and PLS in microarray data analysis. BMC Genom. 2008, 9, S24. [Google Scholar] [CrossRef]
  7. Ciocca, G.; Micali, G.; Napoletano, P. State recognition of food images using deep features. IEEE Access 2020, 8, 32003–32017. [Google Scholar] [CrossRef]
  8. Park, S.J.; Palvanov, A.; Lee, C.H.; Jeong, N.; Cho, Y.I.; Lee, H.J. The development of food image detection and recognition model of Korean food for mobile dietary management. Nutr. Res. Pract. 2019, 13, 521–528. [Google Scholar] [CrossRef]
  9. Mezgec, S.; Seljak, B.K. Using deep learning for food and beverage image recognition. In Proceedings of the 2019 IEEE International Conference on Big Data (Big Data), Los Angeles, CA, USA, 9–12 December 2019; pp. 5149–5151. [Google Scholar]
  10. Mezgec, S.; Eftimov, T.; Bucher, T.; Seljak, B.K. Mixed deep learning and natural language processing method for fake-food image recognition and standardization to help automated dietary assessment. Public Health Nutr. 2019, 22, 1193–1202. [Google Scholar] [CrossRef]
  11. Moolchandani, D.; Kumar, A.; Sarangi, S.R. Accelerating cnn inference on asics: A survey. J. Syst. Archit. 2021, 113, 101887. [Google Scholar] [CrossRef]
  12. Liang, H.; Gao, Y.; Sun, Y.; Sun, X. CEP: Calories estimation from food photos. Int. J. Comput. Appl. 2020, 42, 569–577. [Google Scholar] [CrossRef]
  13. Poply, P. An Instance Segmentation approach to Food Calorie Estimation using Mask R-CNN. In Proceedings of the 2020 3rd International Conference on Signal Processing and Machine Learning, Beijing, China, 22–24 October 2020; pp. 73–78. [Google Scholar]
  14. Hoashi, H.; Joutou, T.; Yanai, K. Image recognition of 85 food categories by feature fusion. In Proceedings of the Proceedings of the 2010 IEEE International Symposium on Multimedia, Taichung, Taiwan, 13–15 December 2010; pp. 296–301.
  15. Pouladzadeh, P.; Shirmohammadi, S.; Al-Maghrabi, R. Measuring calorie and nutrition from food image. IEEE Trans. Instrum. Meas. 2014, 63, 1947–1956. [Google Scholar] [CrossRef]
  16. Liang, Y.; Li, J. Computer vision-based food calorie estimation: Data set, method, and experiment. arXiv 2017, arXiv:1705.07632. [Google Scholar]
  17. Raikwar, H.; Jain, H.; Baghel, A. Calorie Estimation from Fast Food Images Using Support Vector Machine. Int. J. Future Revolut. Comput. Sci. Commun. Eng. 2018, 4, 98–102. [Google Scholar]
  18. De Menezes, R.S.T.; Magalhaes, R.M.; Maia, H. Object recognition using convolutional neural networks. In Recent Trends in Artificial Neural Networks-from Training to Prediction; IntechOpen: London, UK, 2019. [Google Scholar]
  19. Latif, G.; Alsalem, B.; Mubarky, W.; Mohammad, N.; Alghazo, J. Automatic Fruits Calories Estimation through Convolutional Neural Networks. In Proceedings of the 2020 6th International Conference on Computer and Technology Applications, Antalya, Turkey, 14–16 April 2020; pp. 17–21. [Google Scholar]
  20. Shen, Z.; Shehzad, A.; Chen, S.; Sun, H.; Liu, J. Machine learning based approach on food recognition and nutrition estimation. Procedia Comput. Sci. 2020, 174, 448–453. [Google Scholar] [CrossRef]
  21. Darapaneni, N.; Singh, V.; Tarkar, Y.S.; Kataria, S.; Bansal, N.; Kharade, A.; Paduri, A.R. Food Image Recognition and Calorie Prediction. In Proceedings of the 2021 IEEE International IOT, Electronics and Mechatronics Conference (IEMTRONICS), Toronto, ON, Canada, 21–24 April 2021; pp. 1–6. [Google Scholar]
  22. Kasyap, V.B.; Jayapandian, N. Food Calorie Estimation using Convolutional Neural Network. In Proceedings of the 2021 3rd International Conference on Signal Processing and Communication (ICPSC), Coimbatore, India, 13–14 May 2021; pp. 666–670. [Google Scholar]
  23. Ayon, S.A.; Mashrafi, C.Z.; Yousuf, A.B.; Hossain, F.; Hossain, M.I. FoodieCal: A Convolutional Neural Network Based Food Detection and Calorie Estimation System. In Proceedings of the 2021 National Computing Colleges Conference (NCCC), Taif, Saudi Arabia, 27–28 March 2021; pp. 1–6. [Google Scholar]
  24. Okamoto, K.; Adachi, K.; Yanai, K. Region-Based Food Calorie Estimation for Multiple-Dish Meals. In Proceedings of the 13th International Workshop on Multimedia for Cooking and Eating Activities, Taipei, Taiwan, 16–19 November 2021; pp. 17–24. [Google Scholar]
  25. Ruede, R.; Heusser, V.; Frank, L.; Roitberg, A.; Haurilet, M.; Stiefelhagen, R. Multi-task learning for calorie prediction on a novel large-scale recipe data set enriched with nutritional information. In Proceedings of the 2020 25th International Conference on Pattern Recognition (ICPR), Milan, Italy, 10–15 January 2021; pp. 4001–4008. [Google Scholar]
  26. Naritomi, S.; Yanai, K. CalorieCaptorGlass: Food calorie estimation based on actual size using hololens and deep learning. In Proceedings of the 2020 IEEE Conference on Virtual Reality and 3D User Interfaces Abstracts and Workshops (VRW), Atlanta, GA, USA, 22–26 March 2020; pp. 818–819. [Google Scholar]
  27. Jelodar, A.B.; Sun, Y. Calorie Aware Automatic Meal Kit Generation from an Image. arXiv 2021, arXiv:2112.09839. [Google Scholar]
  28. Naritomi, S.; Yanai, K. Pop’n Food: 3D Food Model Estimation System from a Single Image. In Proceedings of the 2021 IEEE 4th International Conference on Multimedia Information Processing and Retrieval (MIPR), Tokyo, Japan, 8–10 September 2021; pp. 223–226. [Google Scholar]
  29. Subaran, T.L.; Semiawan, T.; Syakrani, N. Mask R-CNN and GrabCut Algorithm for an Image-based Calorie Estimation System. J. Inf. Syst. Eng. Bus. Intell. 2022, 8, 1–10. [Google Scholar] [CrossRef]
  30. Siemon, M.S.; Shihavuddin, A.S.M.; Ravn-Haren, G. Sequential transfer learning based on hierarchical clustering for improved performance in deep learning based food segmentation. Sci. Rep. 2021, 11, 813. [Google Scholar] [CrossRef]
  31. Zaman, D.M.S.; Maruf, M.H.; Rahman, M.A.; Ferdousy, J.; Shihavuddin, A.S.M. Food Depth Estimation Using Low-Cost Mobile-Based System for Real-Time Dietary Assessment. GUB J. Sci. Eng. 2019, 6, 1–11. [Google Scholar] [CrossRef]
  32. Buttazzo, G.; Lipari, G.; Abeni, L.; Caccamo, M. Soft Real-Time Systems; Springer: Berlin/Heidelberg, Germany, 2005; Volume 283. [Google Scholar]
  33. Heenaye-Mamode Khan, M.; Boodoo-Jahangeer, N.; Dullull, W.; Nathire, S.; Gao, X.; Sinha, G.R.; Nagwanshi, K.K. Multi-class classification of breast cancer abnormalities using Deep Convolutional Neural Network (CNN). PLoS ONE 2021, 16, e0256500. [Google Scholar] [CrossRef]
  34. Jaiswal, S.; Nandi, G.C. Robust real-time emotion detection system using CNN architecture. Neural Comput. Appl. 2020, 32, 11253–11262. [Google Scholar] [CrossRef]
  35. Albawi, S.; Mohammed, T.A.; Al-Zawi, S. Understanding of a convolutional neural network. In Proceedings of the 2017 international conference on engineering and technology (ICET), Antalya, Turkey, 21–23 August 2017; pp. 1–6. [Google Scholar]
  36. Huang, G.; Liu, Z.; Van Der Maaten, L.; Weinberger, K.Q. Densely connected convolutional networks. In Proceedings of the IEEE Conference on Computer Vision and Pattern Recognition, Honolulu, HI, USA, 21–26 July 2017; pp. 4700–4708. [Google Scholar]
  37. Kingma, D.P.; Ba, J. Adam: A method for stochastic optimization. arXiv 2014, arXiv:1412.6980. [Google Scholar]
  38. Kaggle Data Set: Food-101. Available online: https://www.kaggle.com/datasets/dansbecker/food-101 (accessed on 1 July 2022).
  39. Kaggle Data Set: Fruit-360. Available online: https://www.kaggle.com/datasets/moltean/fruits (accessed on 1 July 2022).
  40. Jabbar, H.; Khan, R.Z. Methods to avoid over-fitting and under-fitting in supervised machine learning (comparative study). Comput. Sci. Commun. Instrum. Devices 2015, 70, 163–172. [Google Scholar]
  41. TensorFlow v2.10.0. 2021. Available online: https://www.tensorflow.org/api_docs/python/tf/keras/preprocessing/image/ImageDataGenerator (accessed on 26 April 2021).
Figure 1. System model for image-based food calorie estimation.
Applsci 12 09733 g001
Figure 2. Architecture of the proposed CNN.
Applsci 12 09733 g002
Figure 3. Confusion Matrix of model 44.
Applsci 12 09733 g003
Figure 4. Real-time food image recognition using model 44.
Applsci 12 09733 g004
Figure 5. Line graph for top 10 models performance based on accuracy and time.
Applsci 12 09733 g005
Figure 6. Ternary diagrams for top 10 models performance based on accuracy, lightweightness, and speed.
Applsci 12 09733 g006
Table 2. Data selection from two different data set with a typical nutrition table [4].
SourceData Set NameTypesNumber of InstancesVolume (Gram)Energy (Kilocalorie)
Apple100013372
FOOD-101Banana1000118105
KaggleandDonut100064269
Fruit-360Cupcake100072262
Mango100013368
Table 3. Augmentation parameters.
ParametersValues
Width shift range (%)10
Height shift range (%)10
Zoom range (%)20
Shear range (%)10
Rotation range (deg)10
Table 4. General CNN model structure.
GroupsLayers
Group 1 (tunable)Conv2D, Conv2D, and MaxPooling2D
Group 2 (tunable)Conv2D, Conv2D, and MaxPooling2D
Group 3 (tunable)Conv2D, Conv2D, and MaxPooling2D
Group 4 (tunable)DropOut, Flatten, Dense Layer, and DropOut
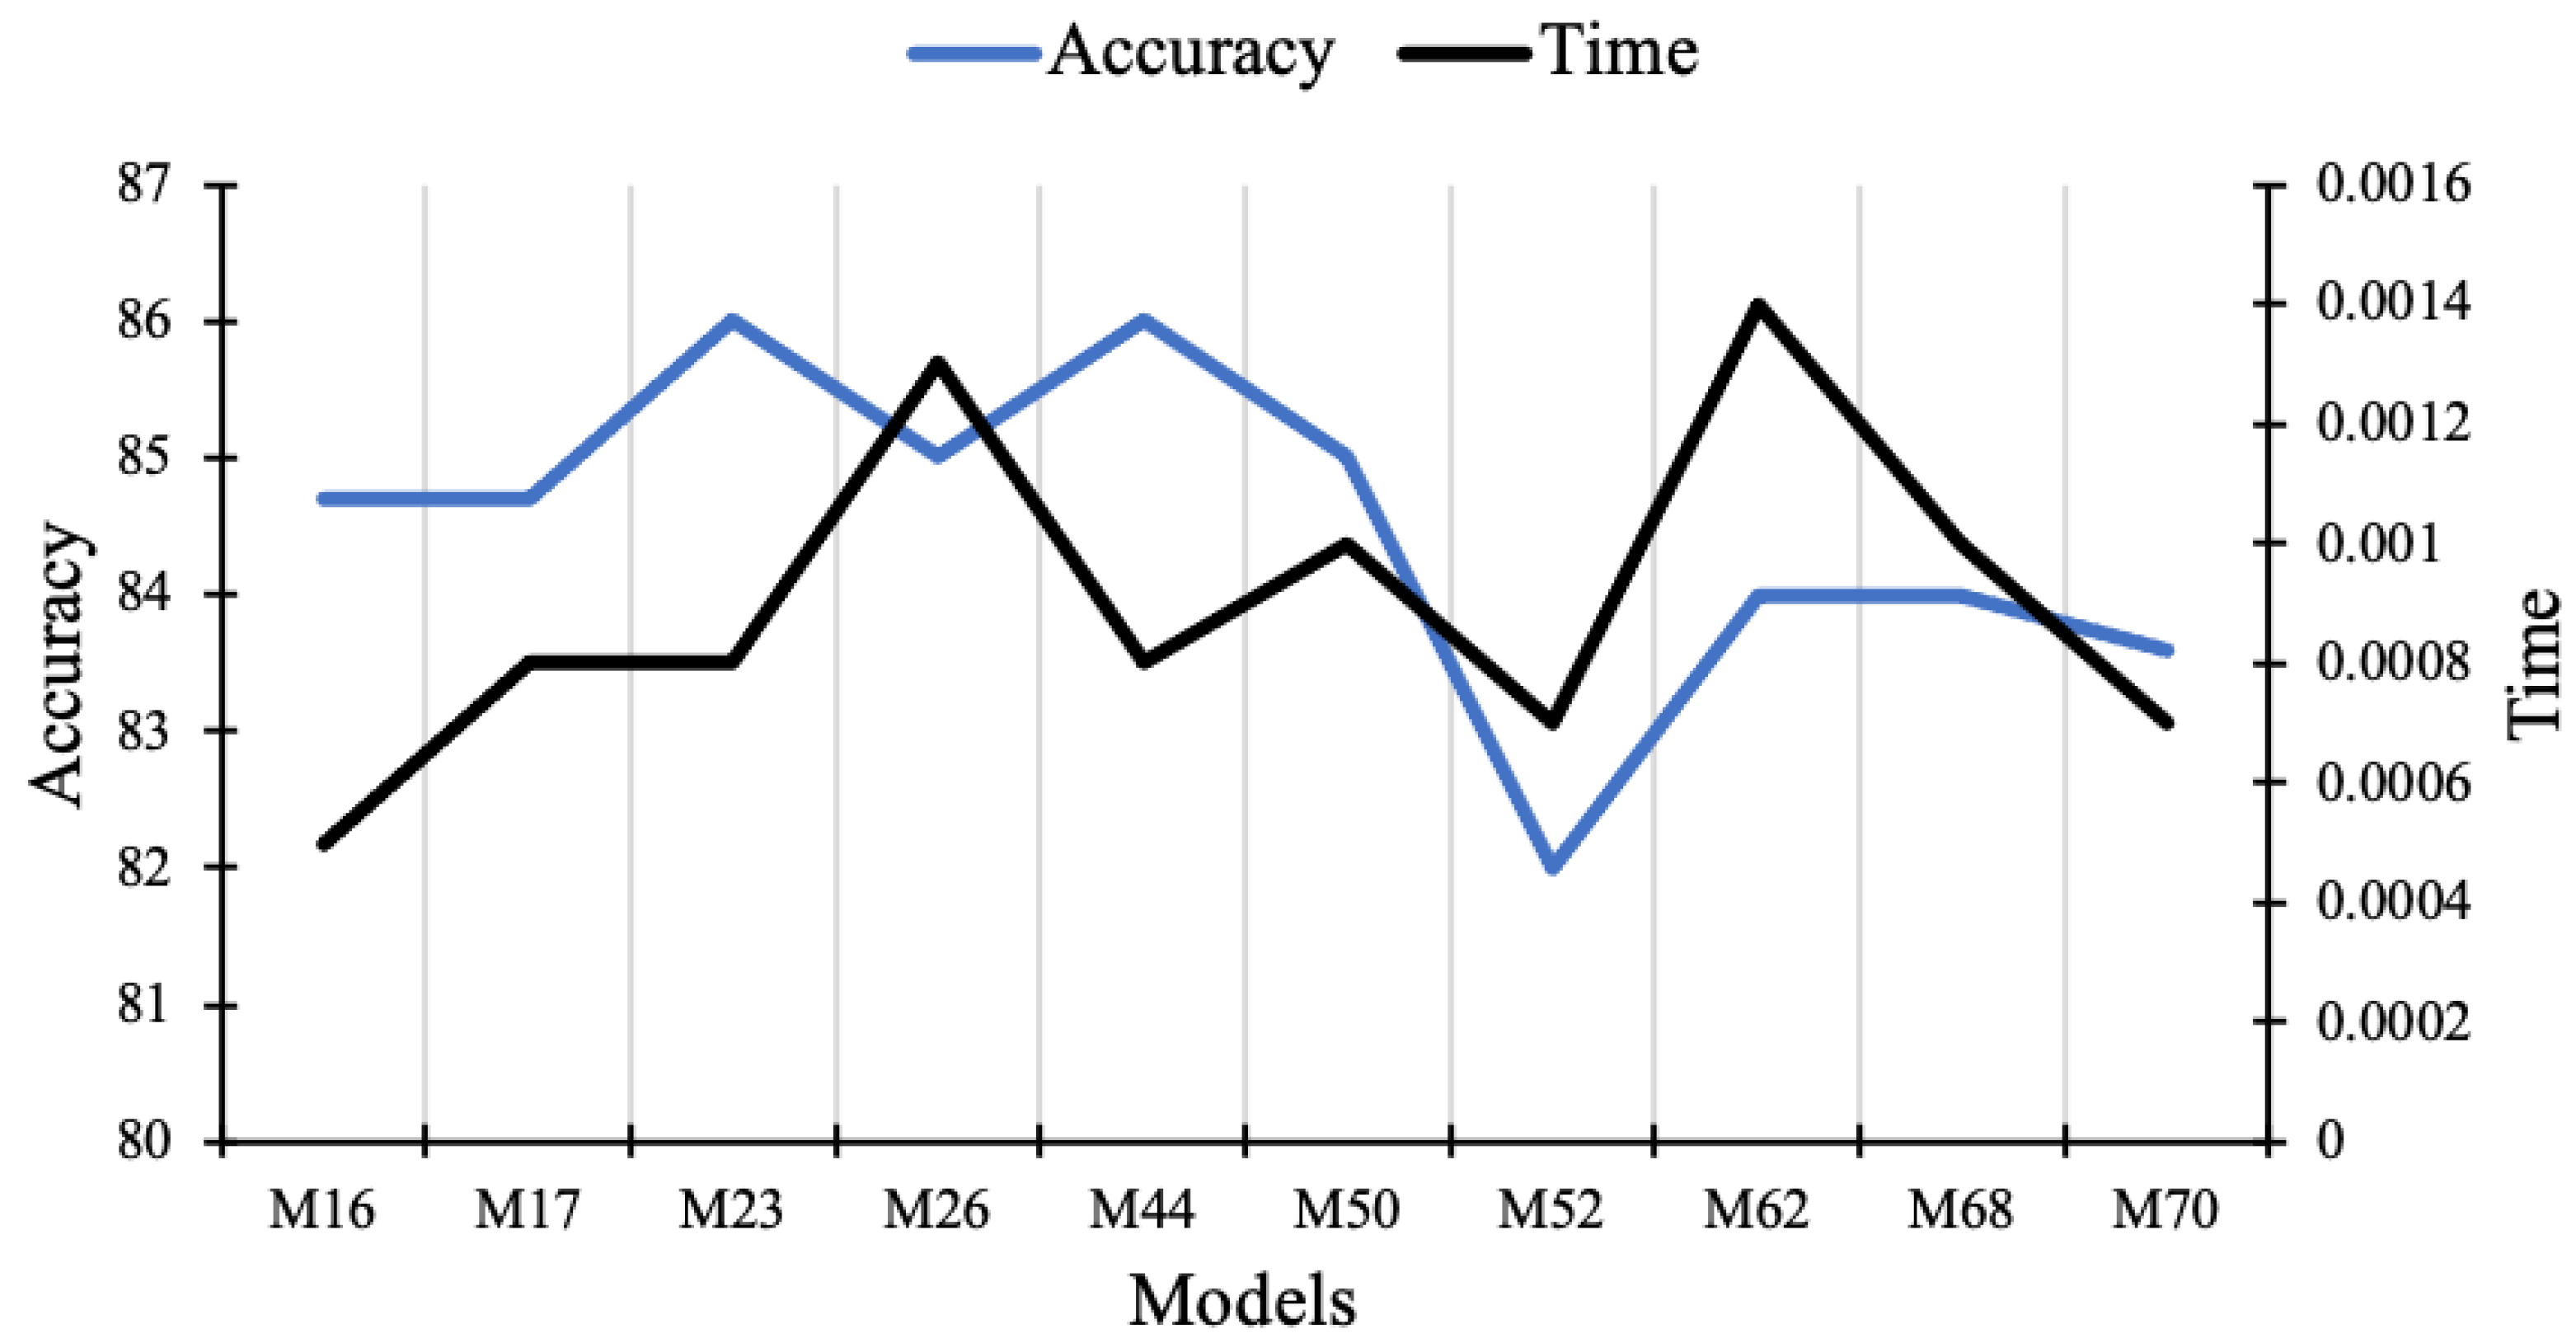
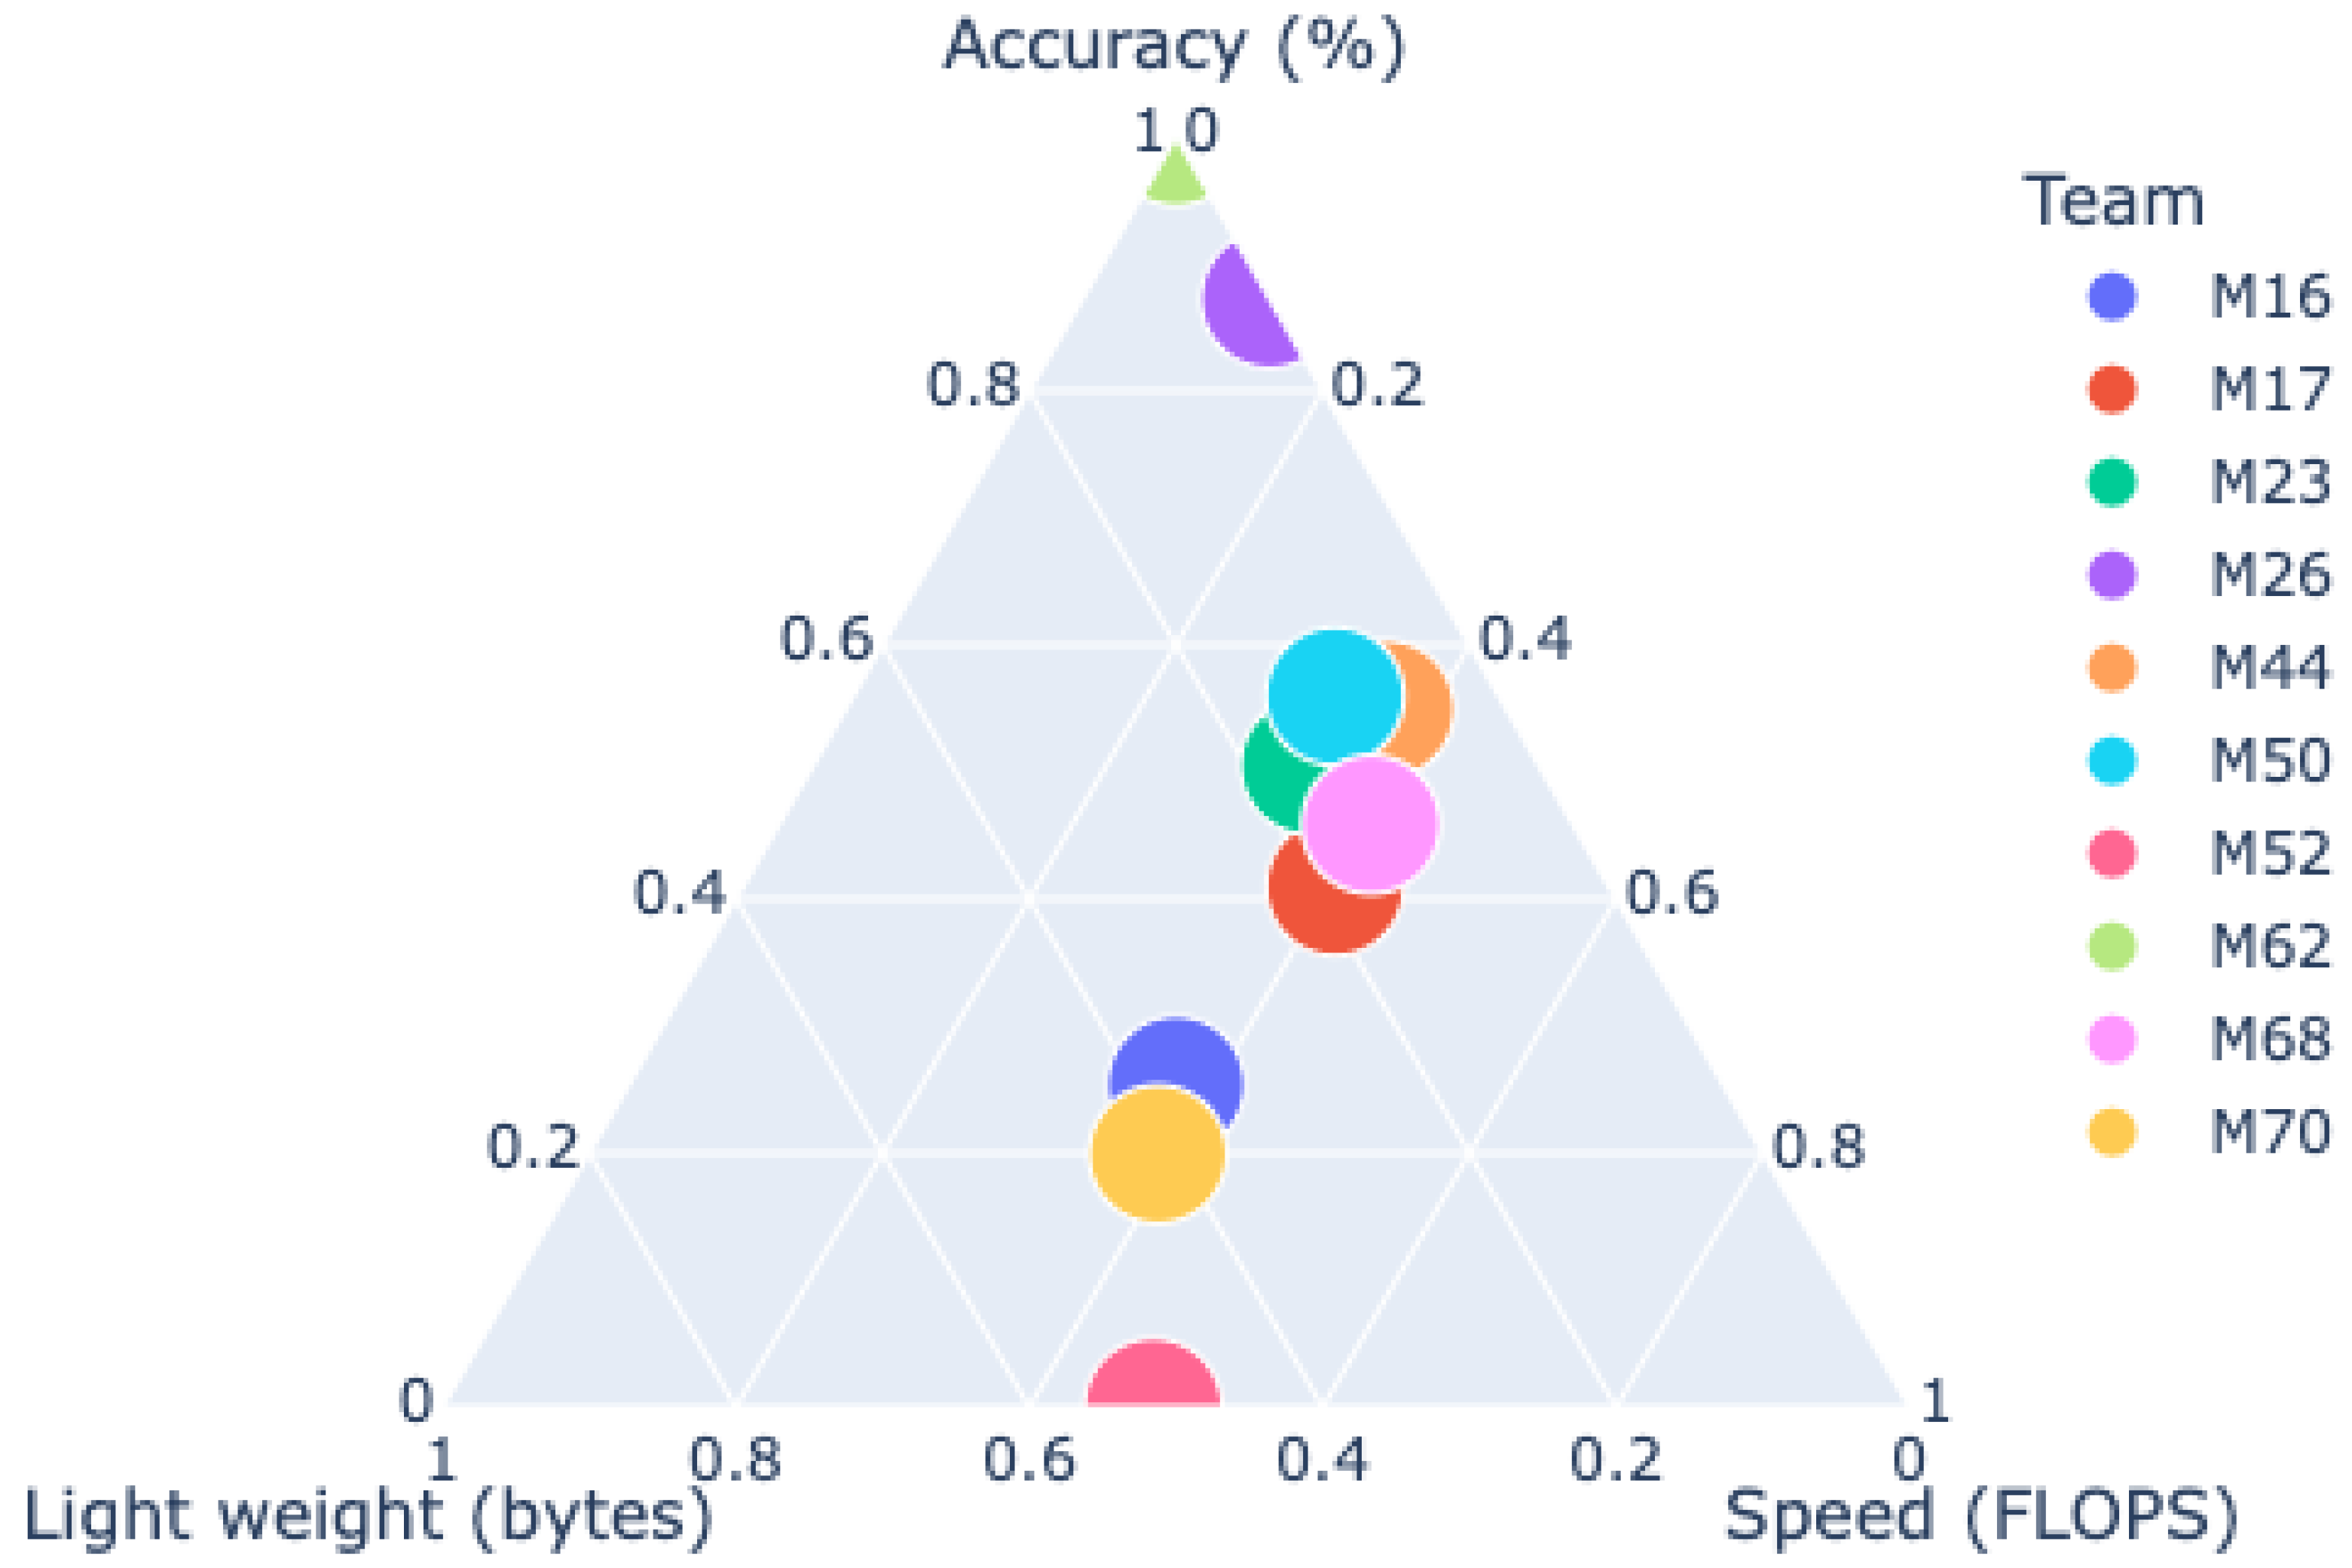
Table 5. Top 10 models performance comparison for the Accuracy (A), Loss (L), Space (in bytes), and Time (in seconds).
Model
Name
Group-1
Filter Num
Group-2
Filter Num
Group-3
Filter Num
Filter
Size
TrainingValidationTestSpaceTime (s)
model 16163264(3,3)A: 0.795A: 0.847A: 0.83630,5000.0005
L: 0.38L: 0.29L: 0.3
model 17163264(5,5)A: 0.809A: 0.847A: 0.82966,3400.0008
L: 0.34L: 0.27L: 0.28
model 23166432(5,5)A: 0.80A: 0.86A: 0.8566,3400.0008
L: 0.37L: 0.27L: 0.27
model 26166464(5,5)A: 0.818A: 0.85A: 0.8482,3400.0013
L: 0.34L: 0.26L: 0.27
model 44323264(5,5)A: 0.84A: 0.86A: 0.84874,3400.0008
L: 0.31L: 0.25L: 0.26
model 50326432(5,5)A: 0.81A: 0.85A: 0.82974,3400.0010
L: 0.36L: 0.26L: 0.28
model 52326464(3,3)A: 0.82A: 0.82A: 0.7939,1400.0007
L: 0.32L: 0.31L: 0.34
model 62641664(5,5)A: 0.80A: 0.84A: 0.83682,3400.0014
L: 0.35L: 0.27L: 0.28
model 68643232(5,5)A: 0.81A: 0.84A: 0.83674,3400.0010
L: 0.35L: 0.28L: 0.29
model 70643264(3,3)A: 0.83A: 0.836A: 0.83739,1400.0007
L: 0.34L: 0.32L: 0.31
Publisher’s Note: MDPI stays neutral with regard to jurisdictional claims in published maps and institutional affiliations.

