Article

The Effect of Confined Granular Soil on Embedded PZT Patches Using FFT and Digital Static Cone Penetrometer (DSCP)

Civil Engineering Department, Delhi Technological University, Delhi 11042, India
*
Author to whom correspondence should be addressed.
Appl. Sci. 2022, 12(19), 9711; https://doi.org/10.3390/app12199711
Submission received: 28 August 2022 / Revised: 18 September 2022 / Accepted: 20 September 2022 / Published: 27 September 2022

Abstract

:
This paper presents the effect of confined granular fill on the efficiency of embedded PZT (Lead Zirconate Titanate) patches. The experiments are carried out to capture the dynamic response of confined granular fill and voltage output. The dynamic response of the system is analysed using the fast Fourier transformation (FFT) of vibration and digital static cone penetrometer (DSCP) test at various excitation frequencies. The peak pick method is used to determine the damping loss factor and natural frequency. The efficiency of voltage generation of embedded PZT patches is influenced by the depth of embedment, excitation frequency, location, and engineering properties of the confined granular fill. The results show that the influence of vibration frequency and placement of PZT on the output voltage should be considered. The thickness and engineering properties of granular soil affect the efficiency of voltage output. This study emphasizes the utility of PZT patches in the subgrade and structural health monitoring of various geotechnical structures.

1. Introduction

Advances in smart infrastructure and the rise in demand for energy have led to generating energy sources utilizing mechanical vibrations. Piezoelectric energy harvesting has the potential to convert mechanical vibration into electrical energy. Substantial research has been embarked upon to elucidate the influence of the configuration of a piezoelectric energy harvester (PEH) on its efficiency of energy conversion [1,2,3,4,5]. Kim et al. [2] analysed the Cymbal PEH, which can generate power (1.2 mW) at 20 Hz for each passing vehicle. Wang et al. [4] investigated stack piezoelectric devices installed on a railway track. The results show that the energy increased to 1000 mJ when the stiffness increased to a significantly high value (MN/m). Subsequently, the electrical voltage was generated at 97 V (0.06 J) per vehicular movement on asphalt pavement. Zhang et al. [5] investigated the performance of a cantilever PEH for harvesting energy from bridge vibrations. The PEH was positioned where the mode shape had a peak displacement. As the fundamental frequency of the PEH was closest to one of the bridge’s natural frequencies, more energy could be harvested. The previous studies show that the energy harvester’s configuration and vibration intensity affect the output of PZT patches.
The principle of energy conversion using piezoelectric materials depends on the dynamic response of the input vibration [6,7]. Peigney and Siegert [8] concluded that the amplitude and frequency of vibrations of a bridge influence the power output. A few researchers [9,10] investigated the effectiveness of embedded piezoelectric elements. They developed a compression model to analyse the efficiency of power output. They indicated that the output power of piezoelectric material depends on the loading cycles on the asphalt pavements. The analysis of excitation force, damping ratio, and natural frequency of the structure need to be considered to enhance energy conversion. However, none of these previous studies considered the effect of abutting material on the efficiency of the PZT patches when embedded in the pavement.
Despite abutting material properties, the output efficiency of the PZT patch is also influenced by the frequency of mechanical vibrations. Roshani et al. [11] indicated that the amplitude and frequency of the loading condition significantly affect the output power. Cahill et al. [12] investigated the energy harvesting from the bridge under varied loading conditions. The energy harvester showed a peak voltage response at the natural frequency. Ding et al. [13] studied the effect of piezoelectric energy harvesting under traffic load vibrations. They investigated the influence of vibration frequency and excitation load on power output.
Kumari and Trivedi [14] studied the influence of confined granular fill on horizontally and vertically embedded granular fill. They concluded that the alignment of the PZT patch influences the voltage output. The research indicates that the dynamic response of the system significantly affects energy harvesting. These studies considered the effect of the pavement surface and traffic loads on the efficiency of PEHs. They did not consider the influence of subgrade on the performance of the piezoelectric energy harvesters. However, the influence of various subgrade materials and engineering properties on converting vibration energy for PZT patches under various excitation frequencies has not been clearly understood.
This paper aims to explore an experimental analysis of the influence of the abutting material’s properties and the excitation frequency on the voltage output of PZT patches. Some experiments were conducted on confined granular fill at varying depths to analyse the effect of embedment depths. This paper shows the effect of both vertical and transverse mechanical vibrations of varied excitation frequencies. The dynamic responses of the experimental data were analysed using fast Fourier transformation (FFT) in the frequency domain. The system’s natural frequency was investigated experimentally using the peak pick method from the frequency response (FRF) function of the system. An analysis of the influence of excitation frequency, embedment depth, and displacement on voltage output is presented based on experimental data. Further, a set of static cone penetration tests was carried out to monitor the effect of confinement under various excitation frequencies. This effort emphasizes the utility of PZT patches in granular fills with vibration and their uses in piezoelectric energy harvesting from the ambient vibration from civil structures.

2. Material and Methods

The granular material used in the present work is classified as poorly graded sand using the particle-size analysis as per the Indian Standard Soil Classification system (IS: 2720). The grain size distribution curve of the granular soil is shown in Figure 1. The index properties, as determined in the laboratory, are given in Table 1.

Piezoelectric Materials

Piezoceramic (PZT) materials have been widely applied to convert mechanical energy into electrical energy in engineering applications [6,8,15,16]. The constitutive equations of PZT materials as per IEEE (1987) are expressed as
S P = S p q E T q + d k p E k
D i = d i q T q + ξ i k T E k
where S p represents the mechanical strain tensor; D i denotes the electric displacement; T q is stress tensor; d k p is strain coefficient matrix; E k is applied external electric field vector; S p q E is elastic compliance coefficient at the constant electrical field; and ξ i k T dielectric permittivity at constant stress.
The PZT-soil coupled system can be modelled as a 1-D system as the constraint along the thickness direction of the PZT patch. In the vertical direction, assuming the polarization is along the z-axis. In the transverse direction, the polarization is along the x-axis. The PZT material is considered an isotropic material in the x-y plane. Thus, the constitutive equations (Equations (1) and (2)) of the PZT patch are expressed as,
S Z P = S 33 p E T Z P + d 33 E Z ;   S x P = S 31 p E T x P + d 31 E x
D Z = d 33 T Z P + ξ 33 T E Z ;   D x = d 31 T x P + ξ 31 T E x
The stress–strain in soil material along the z and x-direction can be expressed as follows:
ε Z S = S 33 S E T Z S ;   ε x S = S 31 S E T x S
where ε Z S and T Z S are the stress and strain vectors of the granular soil along the z-direction, respectively. ε x S and T x S are the stress and strain vectors of the granular soil along the x-direction, respectively. S 33 S E represents the elastic compliance coefficient of the granular soil.
The geometric relationship equations of the PZT patch and granular soil composite system [17] are expressed as,
ε Z S = ε P S = w P S Z ;   ε x S = ε P S = w P S X
E Z = ϕ Z = 0 ;   E x = ϕ X = 0
where w P S is the displacement of the PZT patch and soil composite in the z direction, and ϕ is the electric potential. In the present study, the external electric field is considered negligible.

3. Experimental Set-Up and Procedure
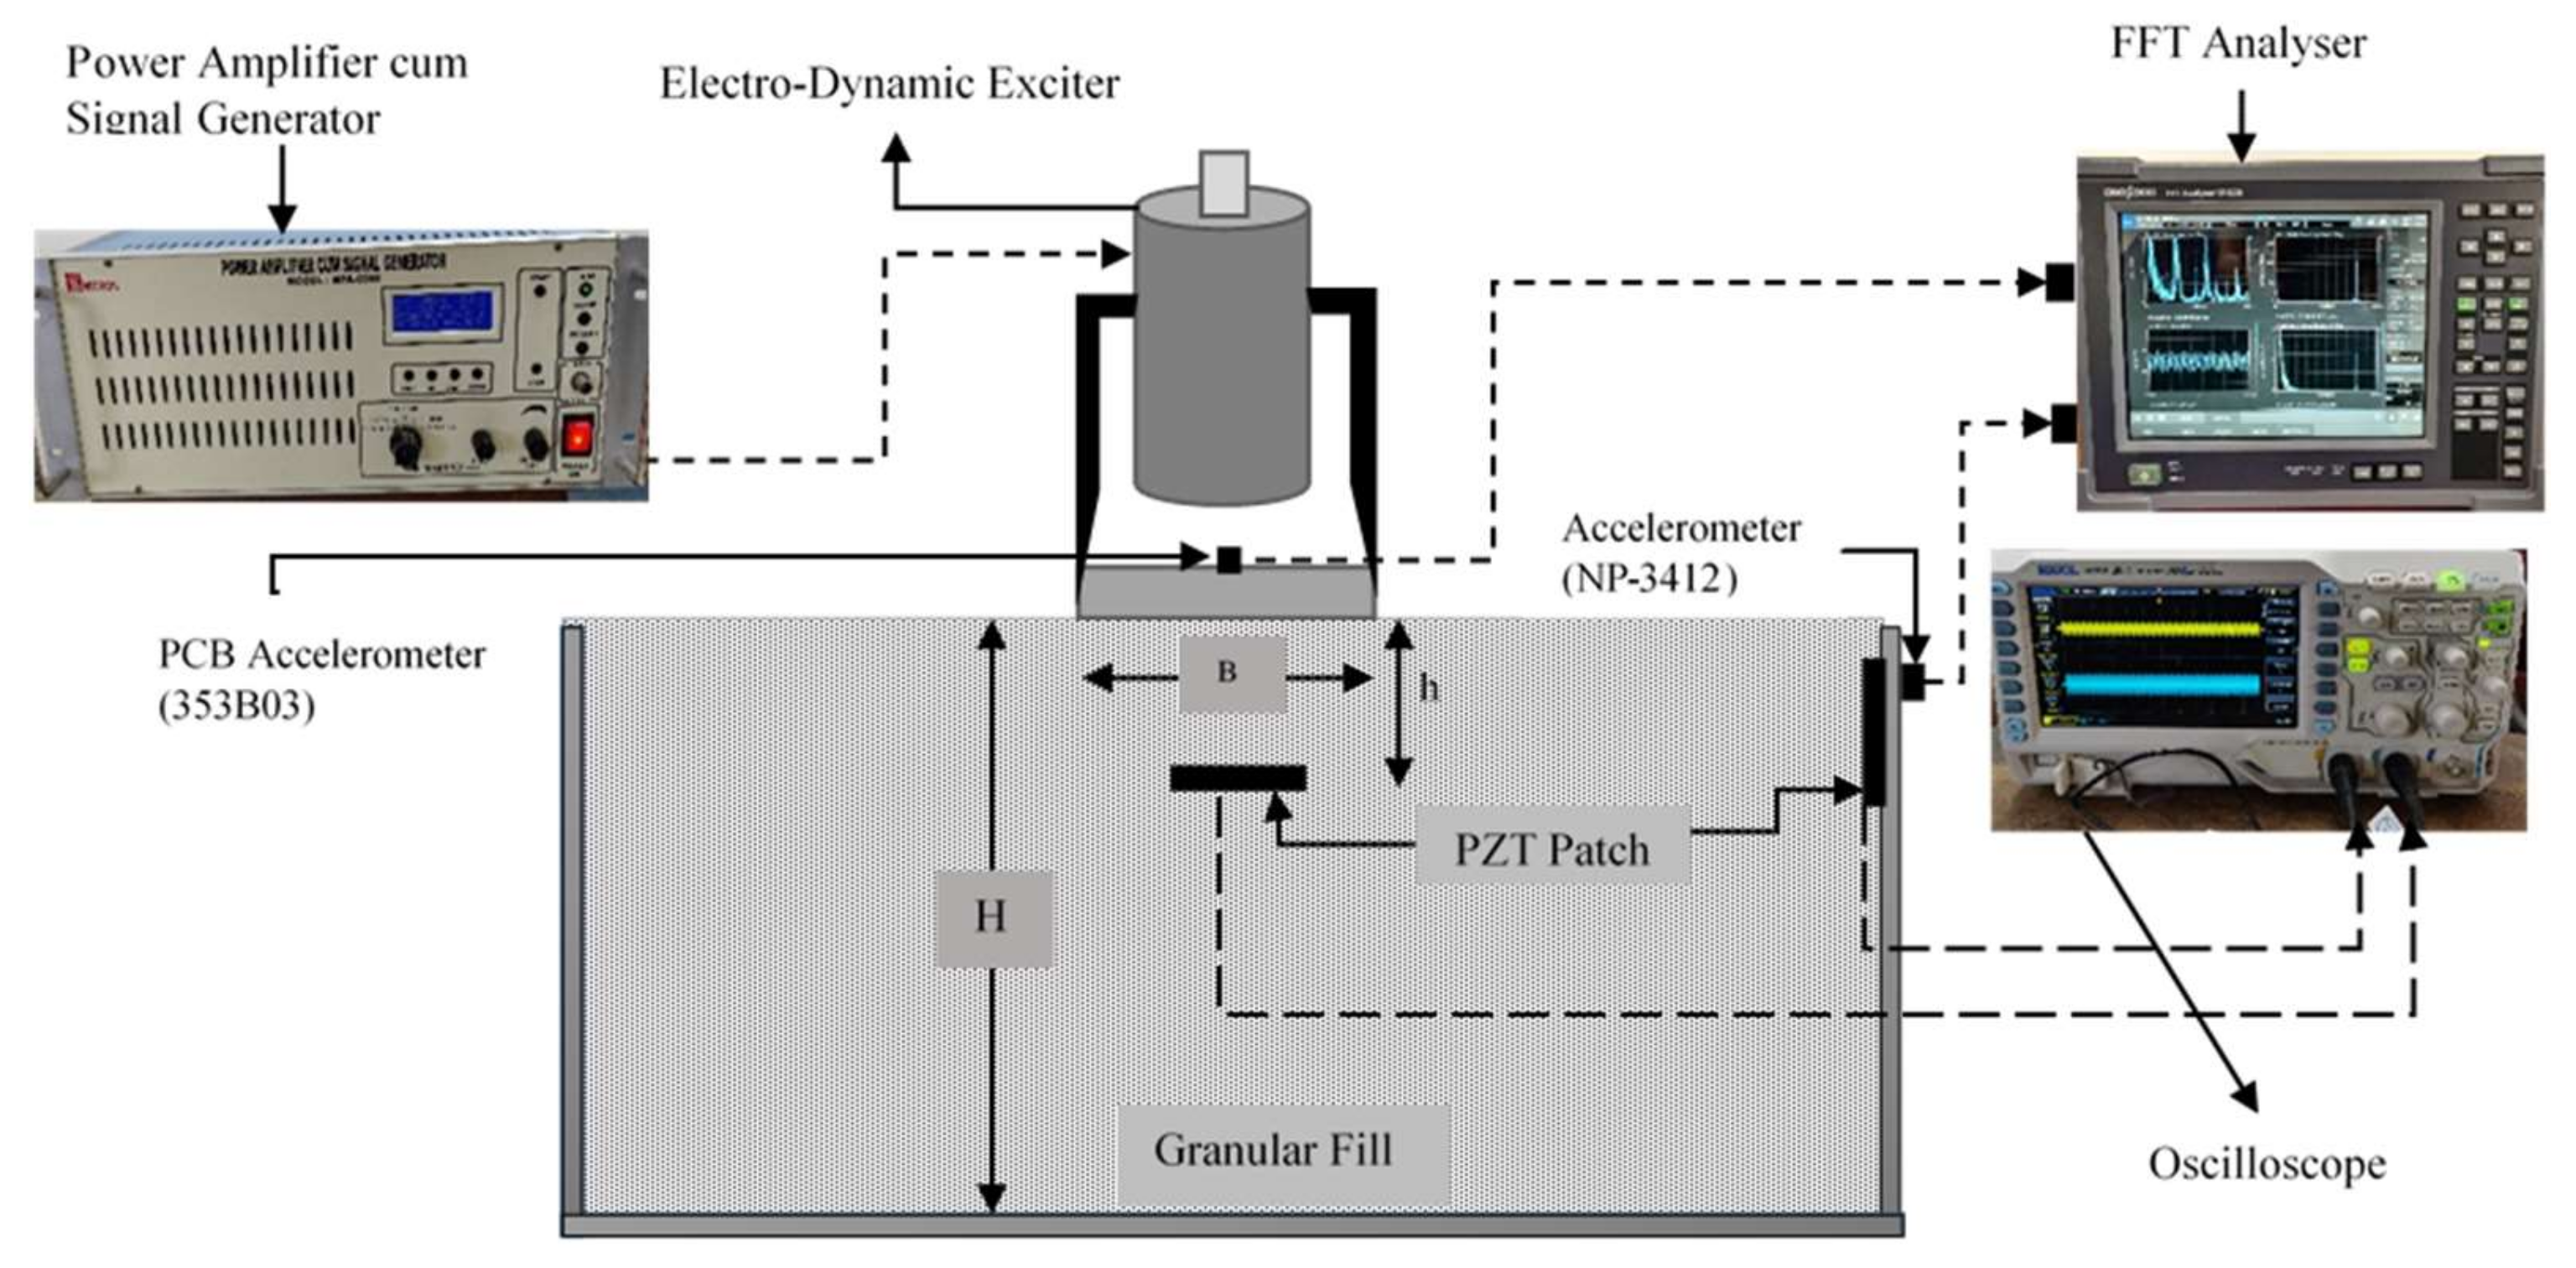
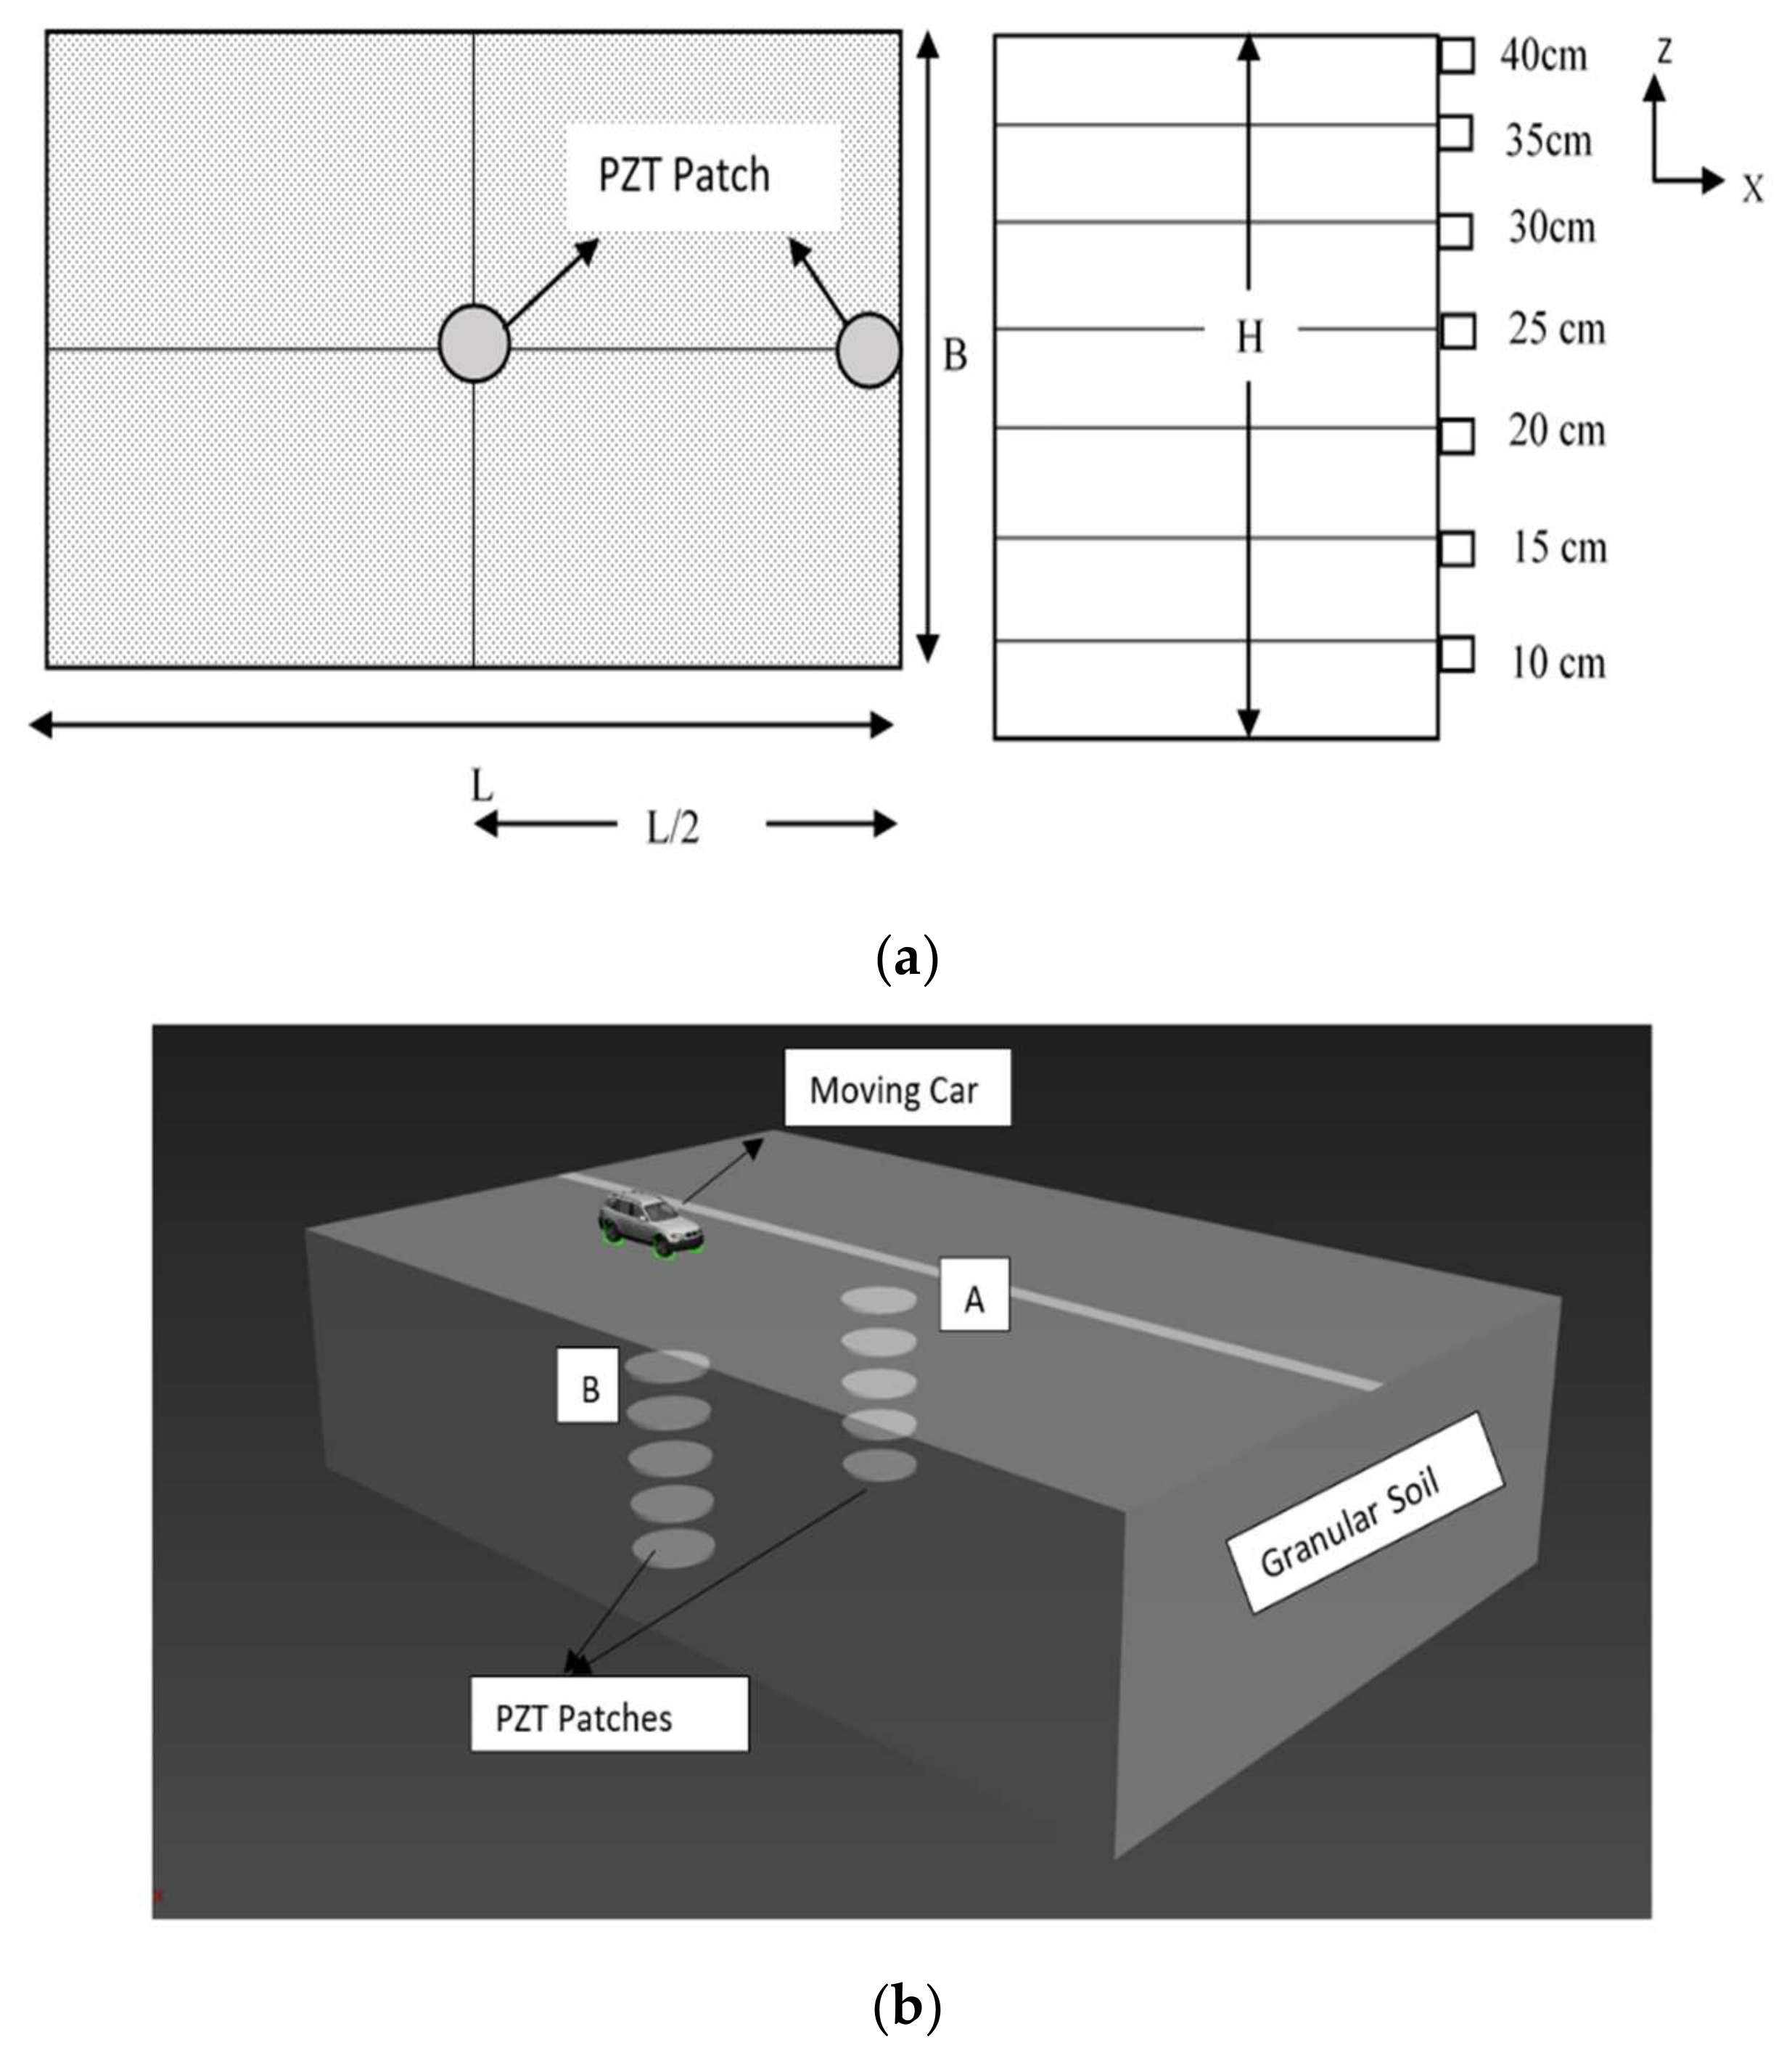
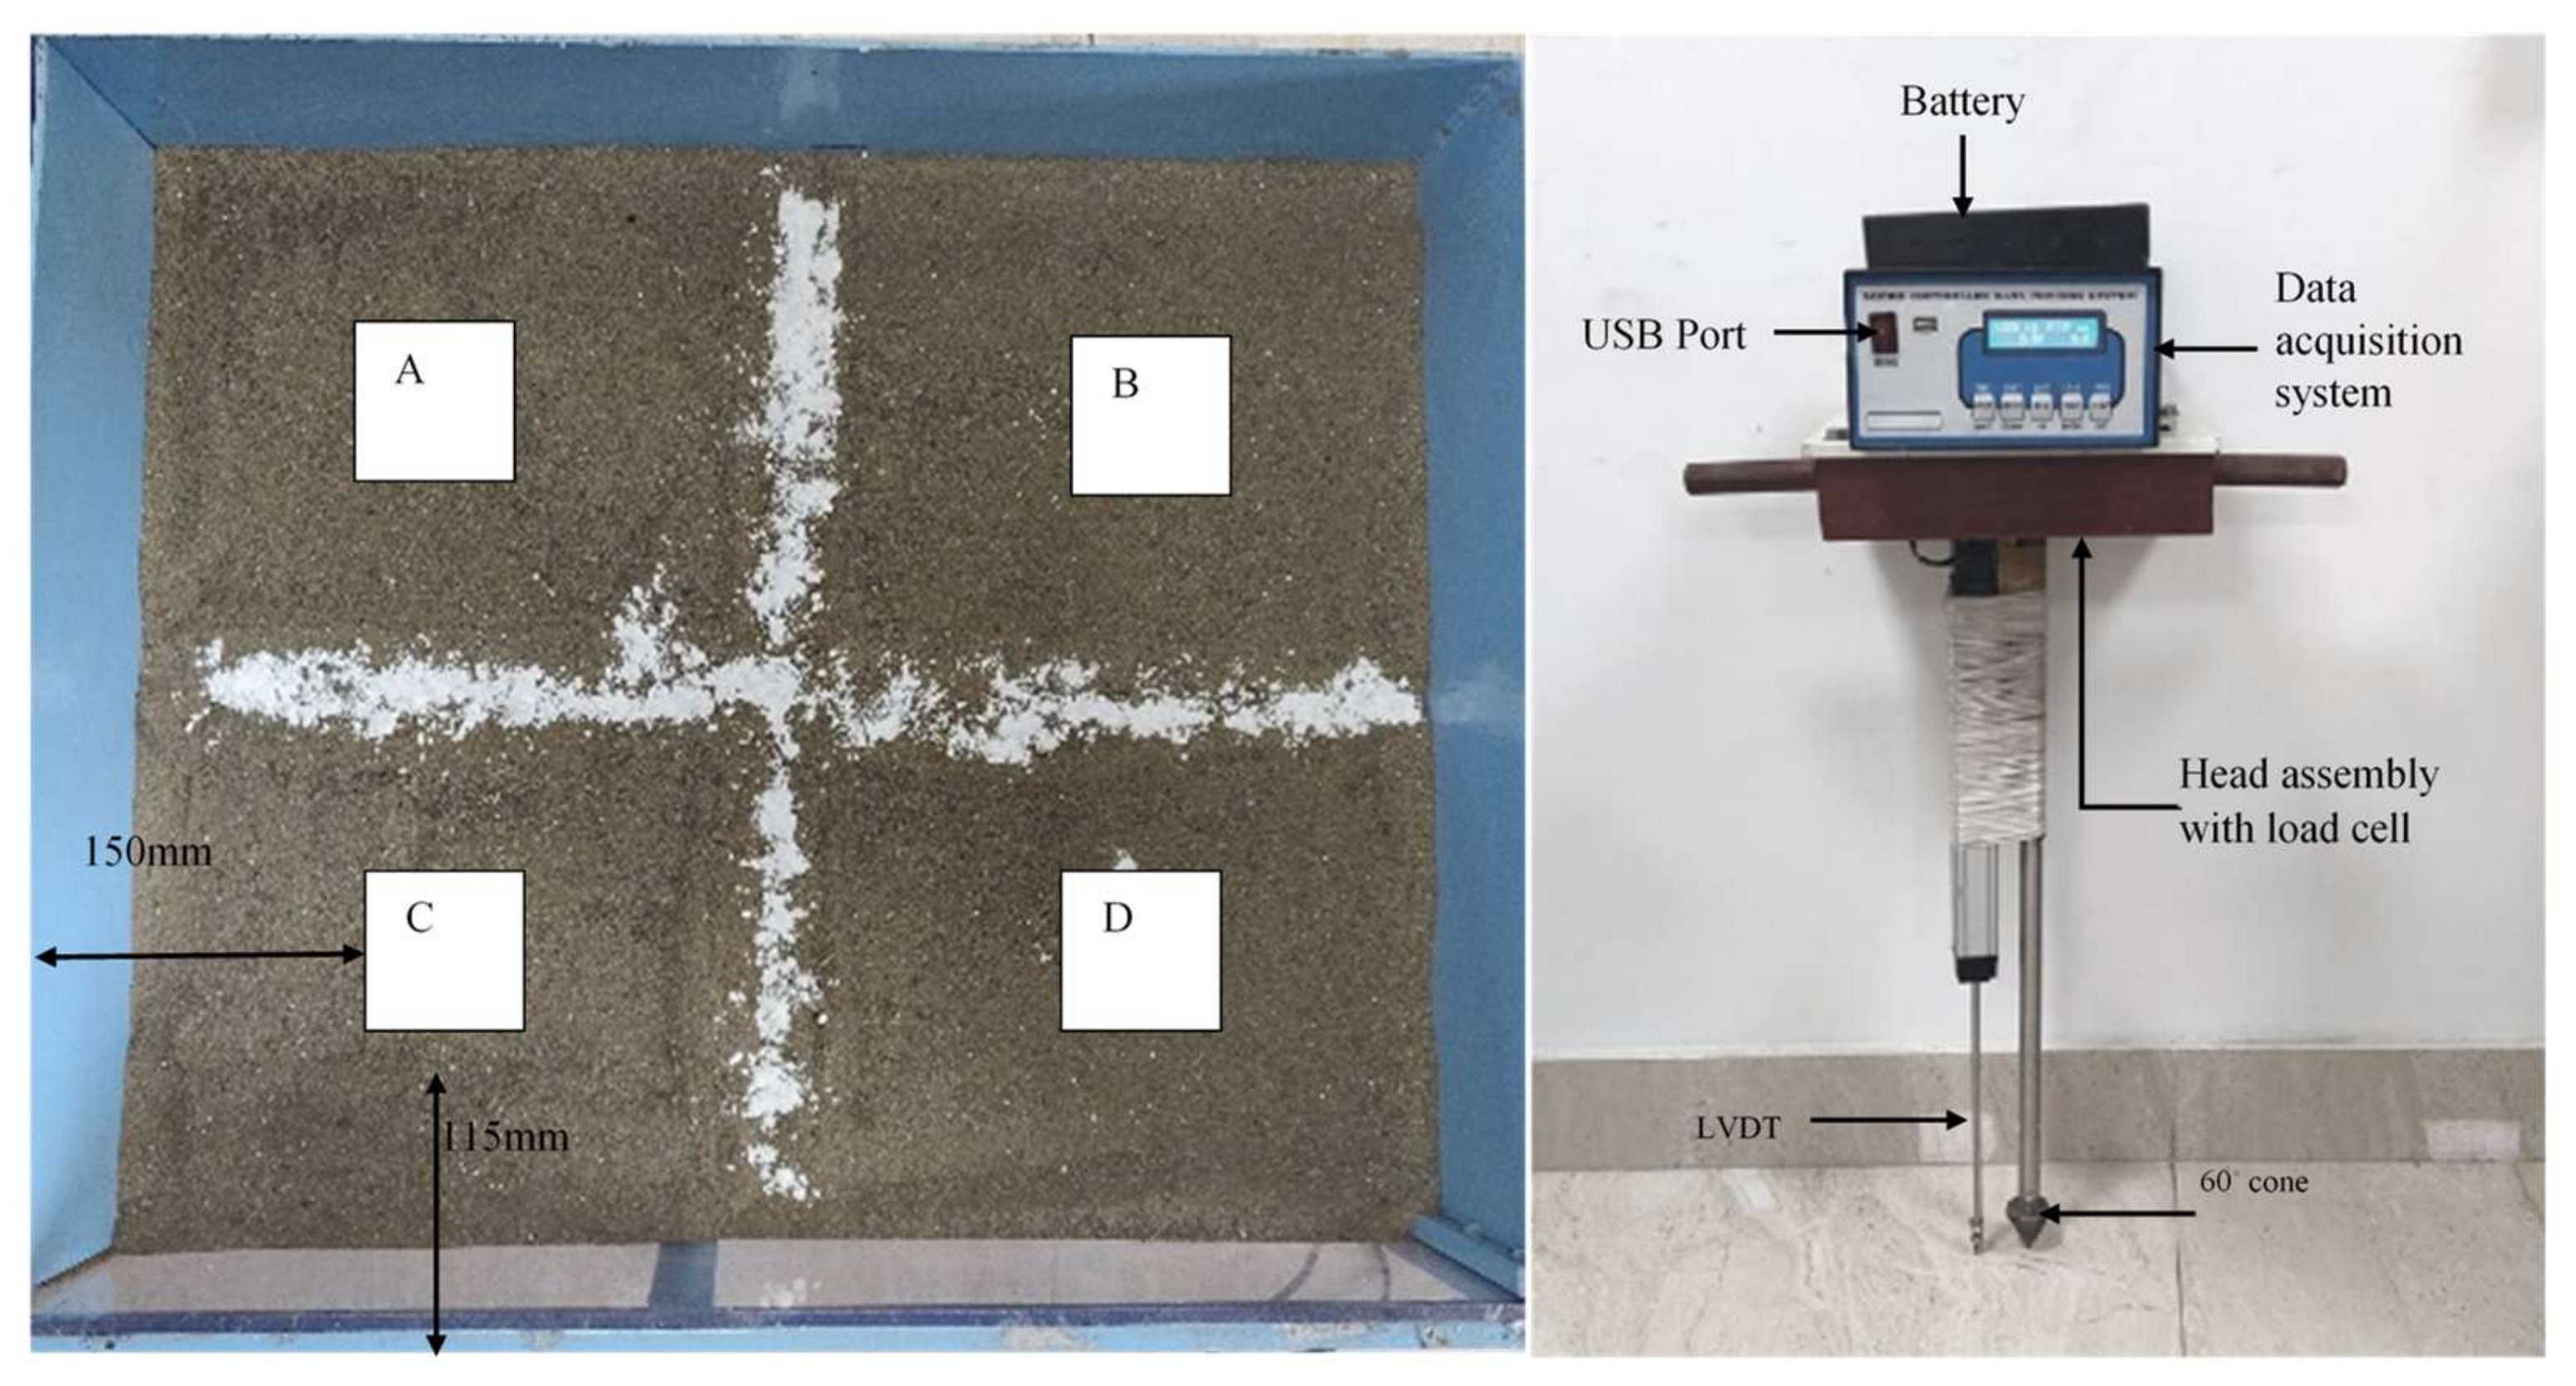
3.1. Test Model

To study the effect of various parameters, such as the exciting frequency and depth of the PZT patch, required conducting an experiment. Therefore, a laboratory set-up was designed to investigate the effect of the natural frequency of the confined granular fill system on PZT patches in a steel tank of 600 × 460 mm with 400 mm depth. The experimental set-up included the steel tank, granular material, dynamic shaker, PZT patches, piezoelectric accelerometers (sensors), FFT analyser, and oscilloscope (Figure 2). The vibration tests were performed through a steel plate of size (270 × 230 mm) and thickness (10 mm). The tank was filled with compacted granular soil in three layers to maintain the uniform density of 1785 kg·m−3 throughout the depth. It was assumed that the dynamic response of the soil is independent of the plate thickness. A PZT patch of diameter 27 mm was used. In solving the problem related to dynamic response analysis in the frequency response domain, fast Fourier transform is an efficient method for both single- and multi-degree freedom systems [18]. Therefore, all data were collected as the FFT of the vibrations at various excitation frequencies. The layout of the embedded PZT patches in confined granular fill is shown in Figure 3.

3.2. Electro-Dynamic Vibrator and Instruments

An electro-dynamic exciter (Uttrakhand, India) (MEV-0020) was used to produce vibration. The system generated the vibrations with the drive coil connected rigidly to the moving platform and positioned. When AC flows in the drive coil, it gives rise to force by converting an electric current into mechanical vibrations that move the platform. The exciter was connected to the power amplifier cum signal generator (MPA-0500) to control the mechanical force. The function of a power amplifier cum signal generator was used to generate and amplify the signal sufficiently to drive the exciter to the desired frequency.
The dynamic response of the confined granular soils was monitored using two accelerometers, one PCB piezoelectric accelerometer (353B03) with low noise cable (M003), and one accelerometer (NP-3412) with signal cable (S381) (Haryana, India) (Figure 2). The PCB (353B03) has a sensitivity of 9.98 mV/g, transverse sensitivity of 0.9%, and resonant frequency of 56.1 kHz. The accelerometer NP-3331 has a sensitivity of 5.038 mV/g. Both sensors were connected to an FFT analyser (CF-9200). The FFT analyser has a bandwidth of 100 mHz to 100 kHz and a frequency tolerance of ±0.005%. The PCB accelerometers were attached to the centre of the granular fill to measure the vertical vibration. An accelerometer (NP-3412) was employed on one side of the tank to monitor the horizontal vibration. The data collected were the FFT spectrum and FRF (frequency response function) of vibration for various exciting frequencies.
To measure the effect of vibration on the voltage output of piezoelectric patches, the positive and negative node of the PZT is connected to an oscilloscope (DS1102Z-E) using the probes (PVP 3150). The output data are obtained in the form of voltage vs. time.

3.3. Modal Parameter Estimation

The peak picking modal estimation technique was utilized in natural frequency analysis. It has been commonly used due to its simplicity. The dynamic response of a system to an external excitation load is described as
M x ¨ ( t ) + C x ˙ ( t ) + K x ( t ) = F ( t )
where M, C, and K are matrices of mass, damping, and stiffness of the system, and x, , and represent the displacement, velocity, and acceleration response of the system, respectively.
The peak picking method is considered for estimating the modal features of a dynamic system based on response data. This approach could characterize ambient vibration excitation as standard white-noise Gaussian distribution based on the fact that the frequency response function (FRF) of a system would experience peak values in the frequency domain. In the case of a white noise excitation, the FRF of a system at sensor location k, H k = ( j w ) , is considered equivalent to the Fourier spectrum of the response data gathered by the sensor. This range is derived by converting the measured response to the frequency domain using FFT. Therefore, the natural frequency of the system is the dominant frequency of the FRF of the system [19].
The damping loss factor is analysed using the frequency response function expressed as follows,
x F = 1 k 1 ω 2 ω n 2 2 + 4 ξ 2 ω 2 ω n 2
where ξ is the damping loss factor, the natural frequency of the system ω n = k m , and the spring constant k. ω is excitation frequency.
The measurements of modes at resonances are difficult for a lightly damped system. Simultaneously, the response of a heavily damped system is significantly influenced by more than one mode. The mode shapes are determined by the peak picking method using the system’s FRFs.

3.4. Digital Static Cone Penetrometer

A digital static cone penetrometer (SCP) test is a low-cost method for measuring the penetration resistance of fine granular materials during site investigation and laboratory research. The cone tip was hydraulically forced into the soil during the SCP test at a consistent penetration rate. The cone tip resistance and sleeve friction resistance were measured. In this study, a digital SCP was used, which consists of a measuring body with two push handles, a drive rod with a diameter of 16 mm and a length of 498 mm, a 60° cone (area of cone base Ac = 9.97 cm2) assembled at the bottom of the drive rod, a linear variable displacement transducer (LVDT) with a range of 0–200 mm, a data acquisition system with a USB output slot, and a load cell with a capacity of 300 kg, as shown in Figure 4. It also depicts the layout of the test sections in the soil tank.
The digital SCP is handheld and capable of penetrating sub-base and subgrade soils. The push handles are provided at the head assembly of the digital SCP. It penetrates the cone attached to the driving rod into the soil at a constant force given with the help of body weight. During the testing, both the load cell and the LVDT were active. The load cell assists in measuring the applied load, while the LVDT measures the digital SCP penetration. Both provide the electrical signal to the data acquisition system, transforming it from analogue to digital. The digital SCP was positioned vertically on the surface of the granular soil. Jerks were avoided while pushing the handles of the digital SCP since they affect the output data. The data from the load cell and LVDT were automatically saved in a tabular format with two columns, load and displacement, in the USB output device. When the applied force causes a negligible change in the magnitude of penetration, the device records refusal. It may produce inconsistent readings and damage the cone, driving rod, and load cell.

4. Results and Discussion

The experimental study investigated the dynamic responses of the confined granular fill with different excitation frequencies. The vibration generated due to harmonic excitation in a frequency range 10–50 Hz was collected in the form of a power spectrum and frequency response function. The properties of materials used as PZT patches are listed in Table 2.

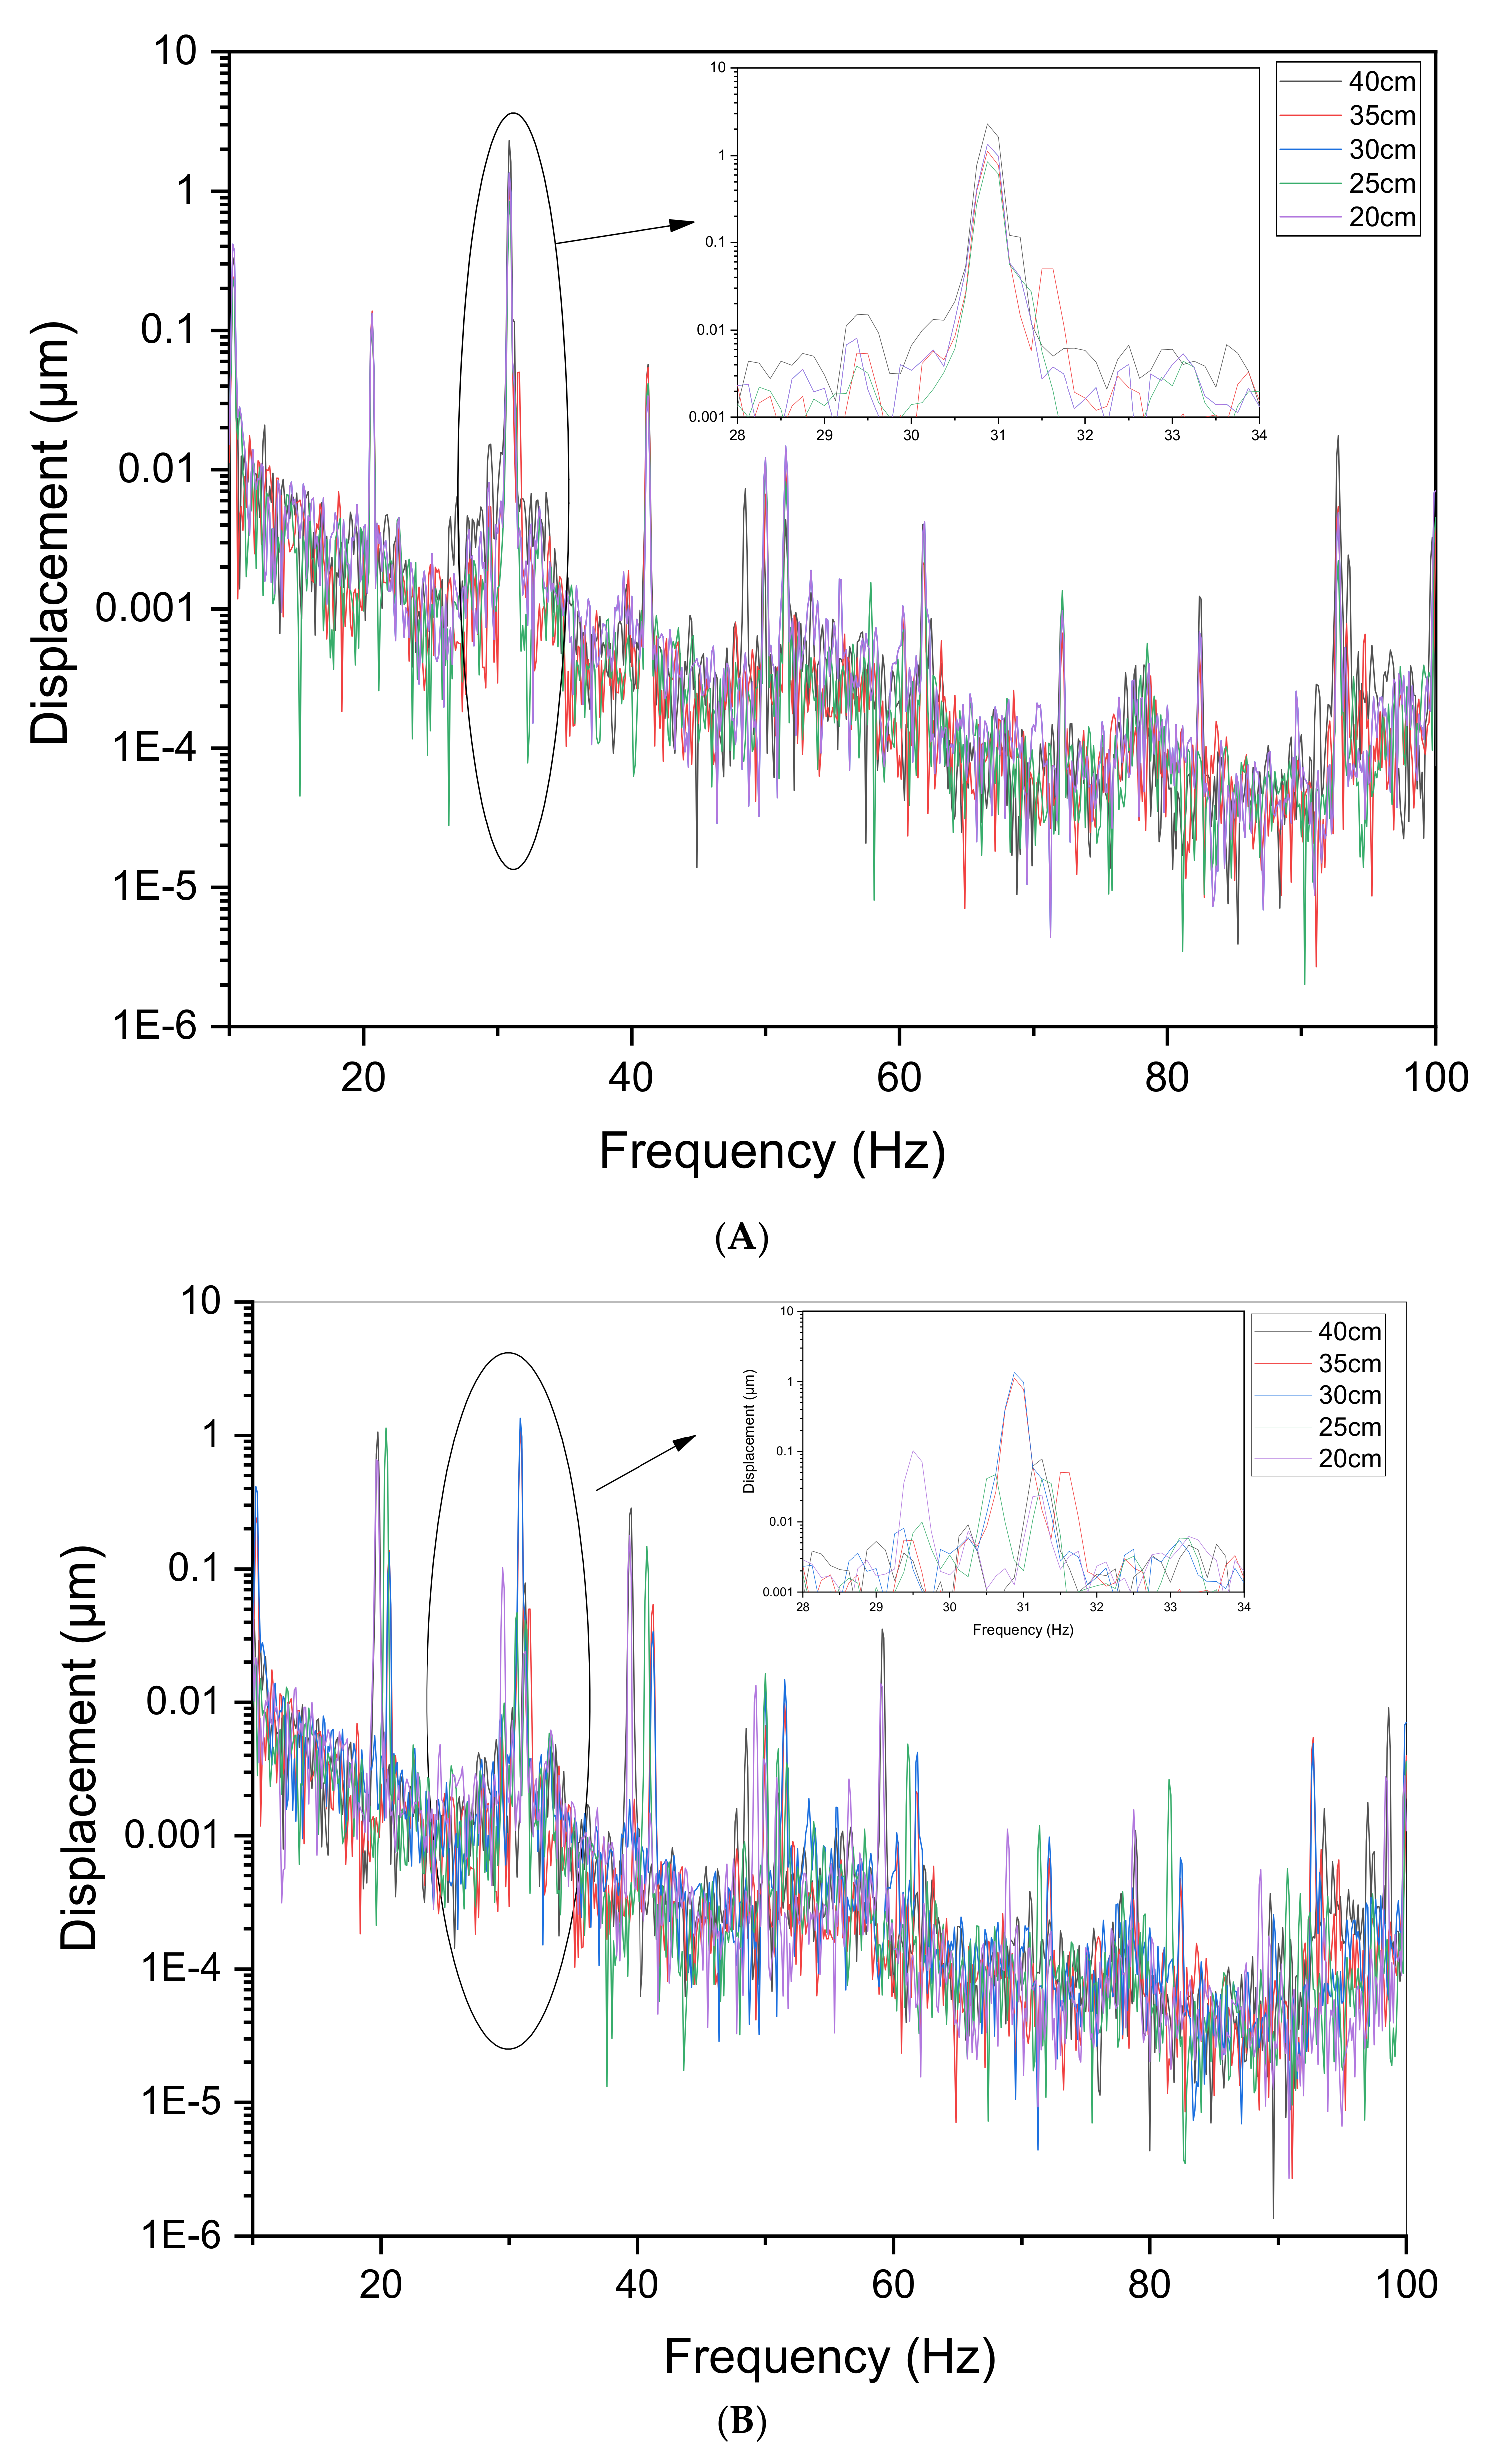
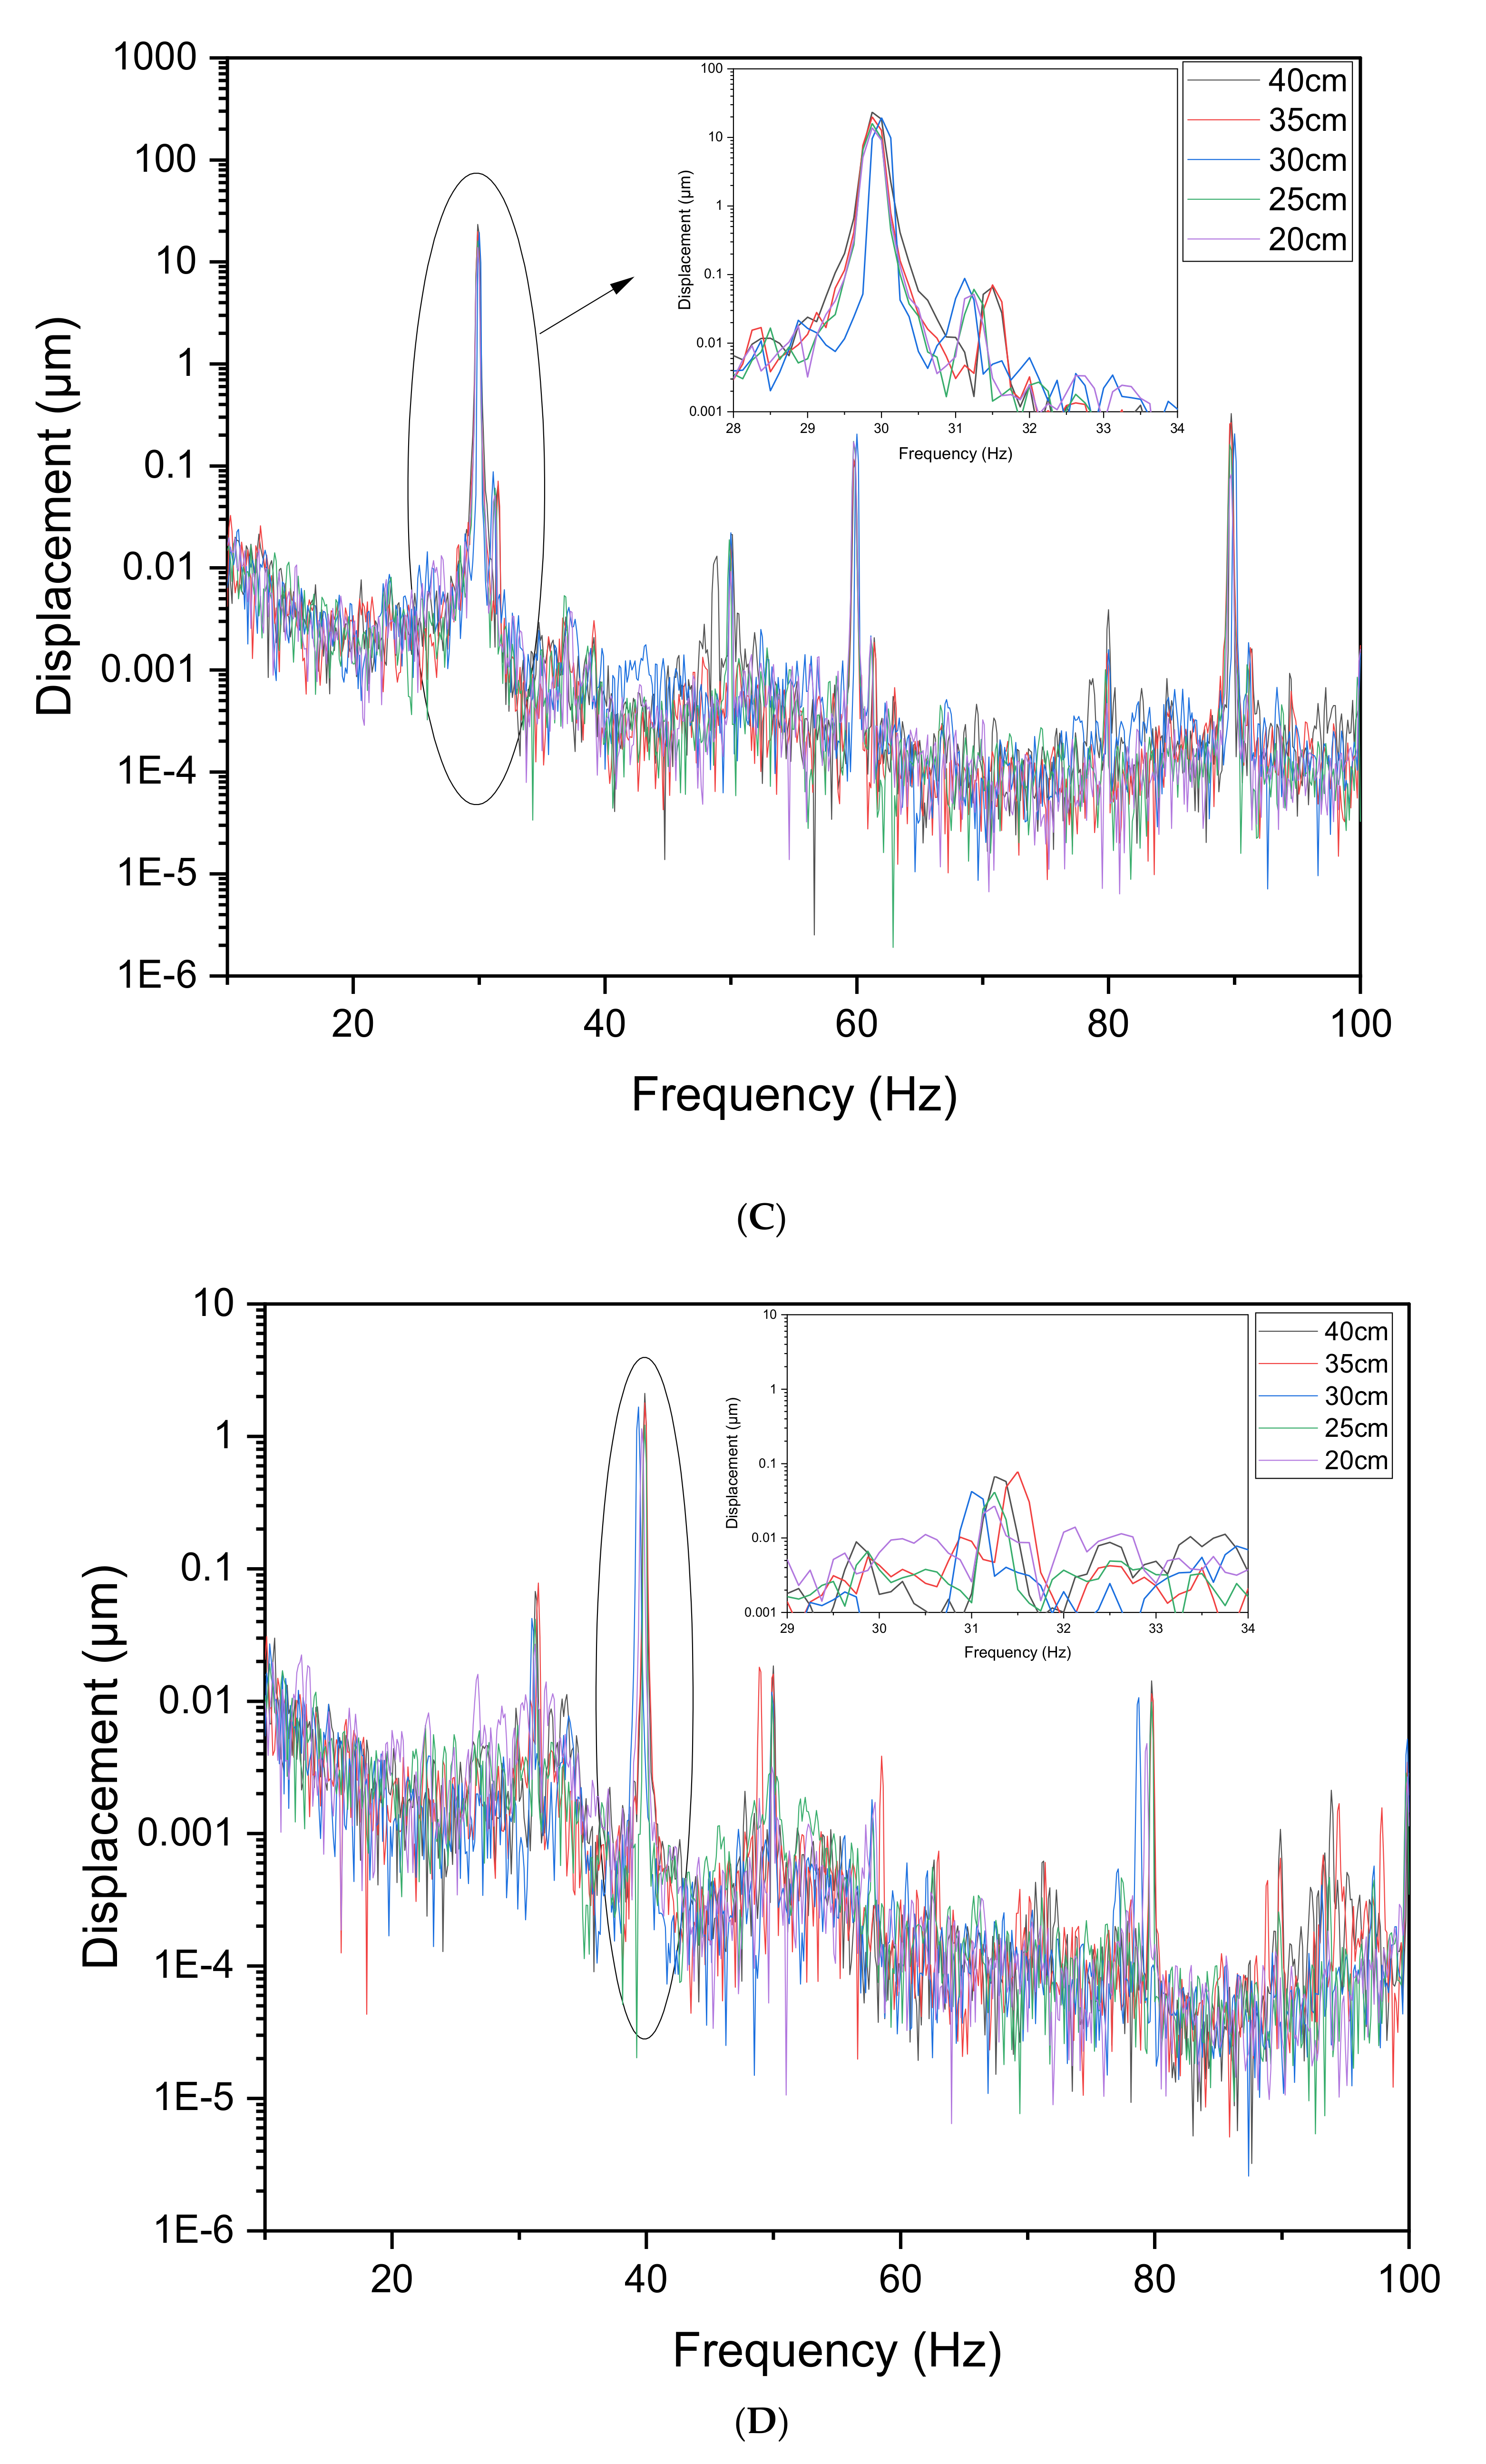
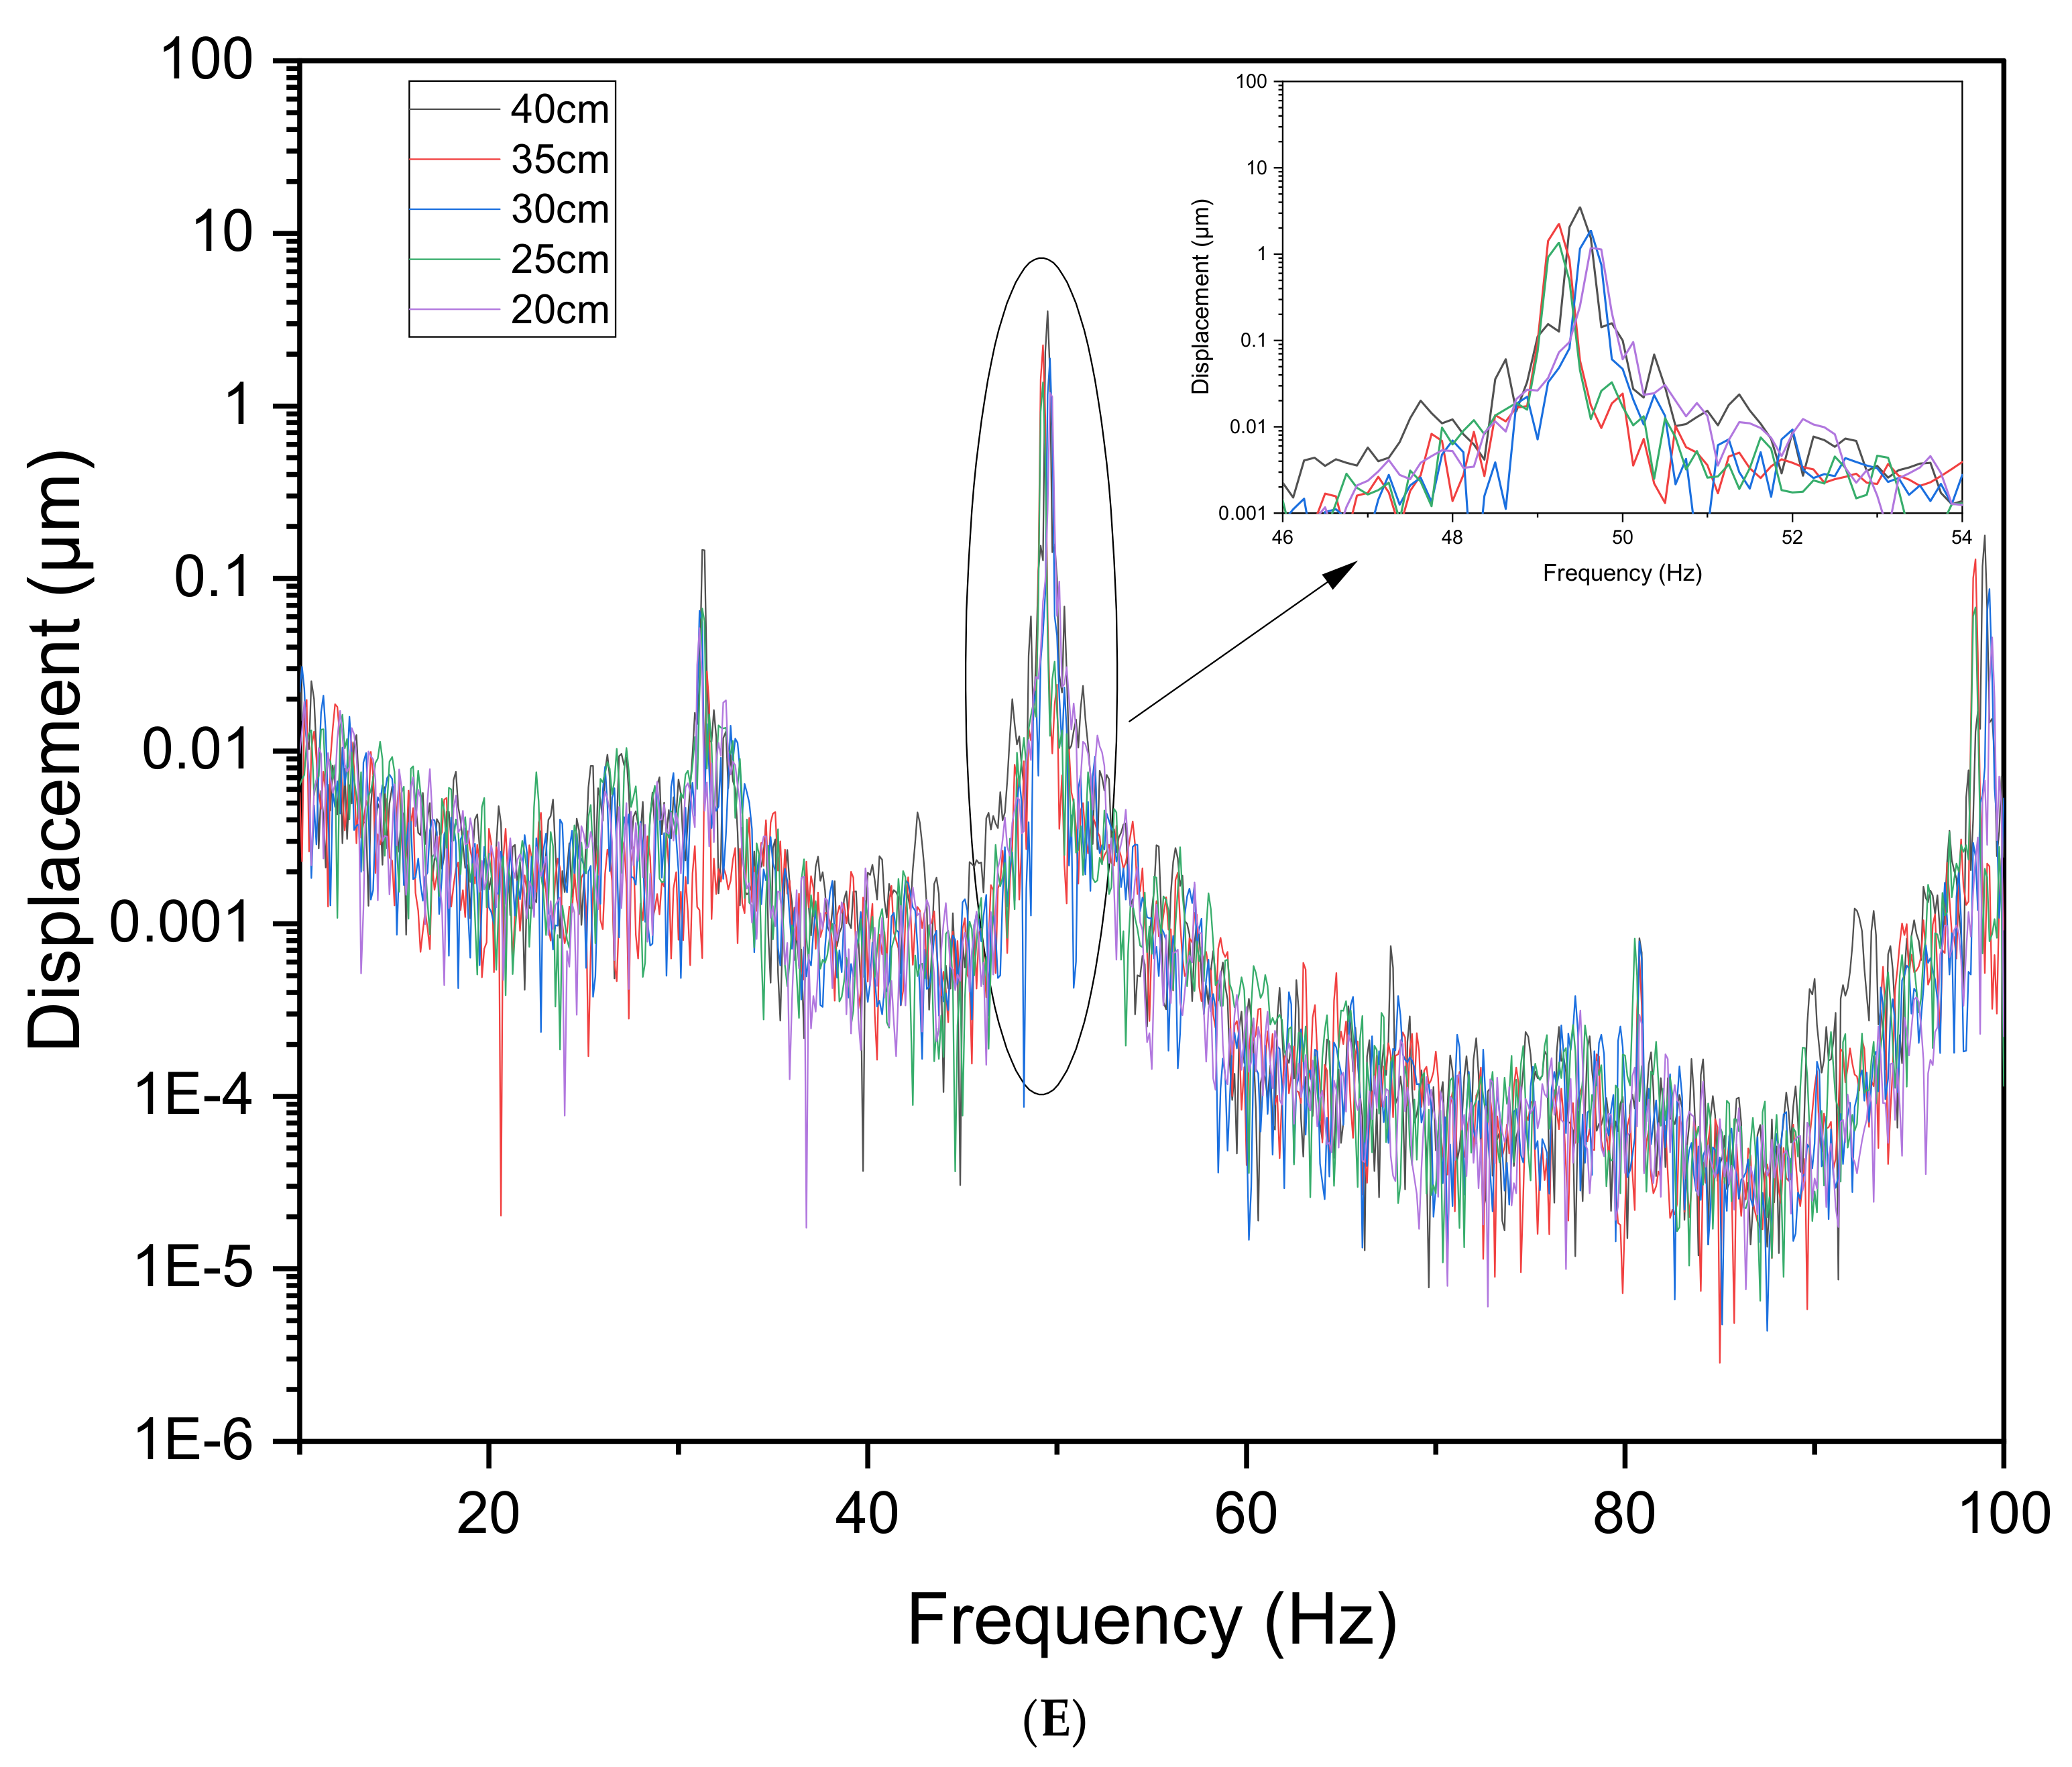
4.1. Natural Frequency Analysis

Fast Fourier transformations (FTT) were utilized to obtain the damping characteristics and natural frequency of the system in the frequency domain. The piezoelectric accelerometers were attached at various depths (H = 20 cm, 25 cm, 30 cm, 35 cm, and 40 cm) to analyse the dynamic responses of the confined granular fill. The arrangement of the accelerometer is shown in Figure 3. The confined granular fill was subjected to vibrations of various frequencies (f = 10–50 Hz). The peak amplitudes of the acceleration, velocity, and displacement response at various excitation frequencies are shown in Table 3 for both vertical and transverse vibrations.
The peak response (acceleration, velocity, and displacement) of the confined granular fill at the same position varied directly as the excitation frequency. A similar observation was made by Ding et al. (2018) for the dynamic response of the subgrade at various exciting frequencies. The peak response of the confined granular at centre point is greater than the point to the right; due to the boundary effect. The geometric law was followed to understand the relationship between stress, strain, and displacement. The displacement spectrum for various excitation frequencies characterizes the vibrations generated at different depths.
Figure 5 shows the displacement response spectrum of the system at various excitation frequencies (f = 10–50 Hz) at varying depths of the confined granular fill. This spectrum was obtained using the FFT analyser and accelerometers. The purpose of obtaining the system’s response spectrum is to analyse the damping loss factor and natural frequency of the system. The displacement has a maximum at the natural frequency for the excitation frequencies of 10–30 Hz. In this case, the peak is at 31 Hz. For high frequencies, the peak displacement tends towards 40 Hz. At high frequencies, the confined system will behave as a rigid body, so the mass just follows the upper layer motion. Figure 5E depicts that the peak displacement of the vibration was obtained at the 40 cm thickness, whereas for low frequencies (10–30 Hz), the maximum displacement obtained was closer to 30 cm. The displacement response also represents the intensity of the vibration at a deeper depth to understand the effect of vibration on the PZT patches embedded at various thicknesses of the granular fill.
The natural frequency and damping loss factor were analysed using the peak pick modal parameter method from the frequency response function (FRF) of the experimental data. Table 4 represents the damping loss factors at various excitation frequencies.

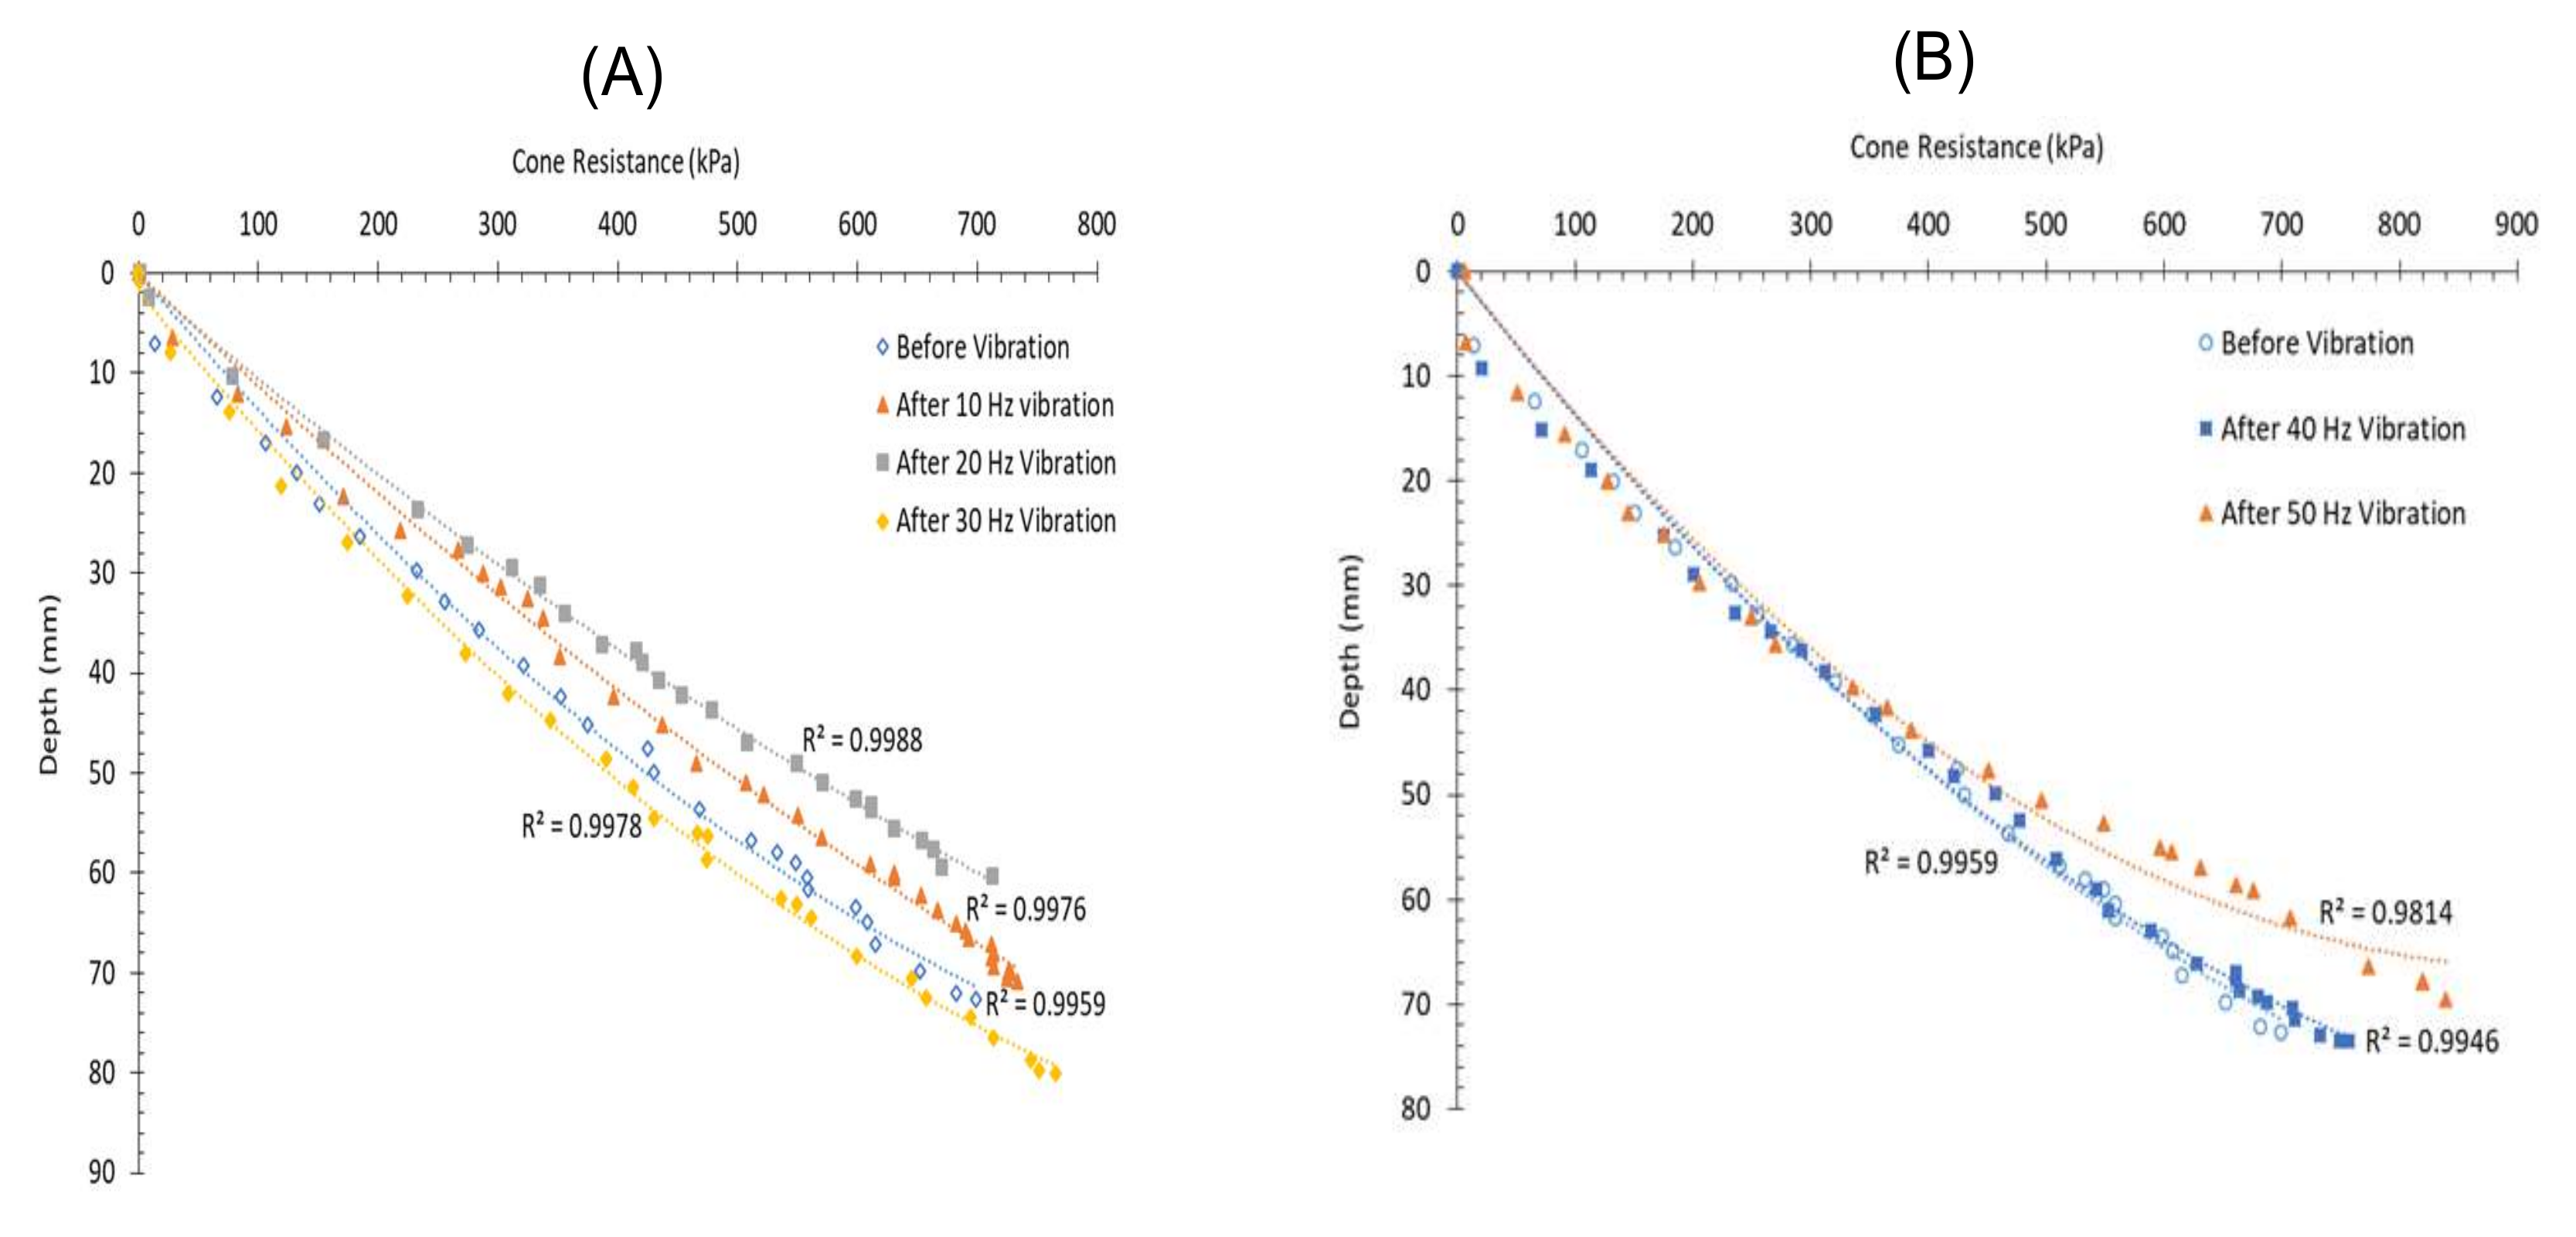
4.2. Cone Resistance of Confined Granular Fill

Figure 6A presents the cone resistance of filled granular soil subjected with and without external dynamic vibrations. Digital SCP tests were performed at locations ‘A’, ‘B’, ‘C’, and ‘D’ in the test section. Singh et al. [20] performed a digital SCP test to estimate the load displacement of fine-grained soils. Digital SCP results are not identical at all the testing locations. However, they follow a similar pattern for each test section at different excitation frequencies. The cone resistance can be utilized to determine the stress at a penetration depth. The results clearly show that after 10–20 Hz frequency vibration, granular soil has greater resistance against applied load than before vibration. After 30 Hz frequency vibration, the cone resistance decreased up to 22% due to changes in the relative density of the granular fill. The relative density and overburden pressure control the cone resistance of the granular fill [21]. Figure 6B presents the cone resistance of the granular fill after 40–50 Hz excitation frequency.
It is observed that the cone resistance increases after excitation frequency above the natural frequency. The overlapping at shallow depth signifies an unstructured response at low overburden pressure. The relationship between the cone resistance and penetration depth at varying excitation frequencies followed an empirical law as
D P = α q c 2 + β q c
where α and β are fitting parameters that vary with an excitation frequency of vibration (Table 5) with a satisfactory coefficient of regression (R2). The cone resistance q c and depth of penetration D p are expressed in kPa and mm, respectively.

4.3. Analysis of Output Voltage

Figure 7 plots the variations in the voltage output of the PZT patch with respect to the excitation frequency at different embedment depths of PZT in the vertical direction (f = 10–50 Hz, H = 40 cm, hr = 0.5–1). The variation in maximum output voltage at varied excitation frequencies is due to the displacement of granular soil. Compared with the other excitation frequency, it is found that maximum voltage output in the vertical direction was obtained for the depth ratio of 0.5 at resonance. Thus, a greater output voltage is obtained if the PZT patch is arranged at an appropriate depth from the surface of the granular soil. In other words, the PZT patch cannot be placed at a greater depth ratio and shallow depth in granular soils, as this reduces the voltage output efficiency. The efficiency of voltage output for the PZT patch embedded in a vertical direction at various excitations is shown in Table 6. The efficiency of the voltage output at varied excitation frequencies is analysed using the formula
η = V f 1 V f 2 V f 1
where V f 1 is voltage output of PZT patch at 10 Hz frequency and V f 2 is the voltage output of the PZT patch at various frequencies (20–50 Hz).
Figure 8 shows the voltage output variation of the PZT patch with respect to the excitation frequency at different embedment depths in the transverse direction (f = 10–50 Hz, H = 40 cm, hr = 0.5–1). This attempt was made to analyse the effect of vibration on PZT patch embedded at a distance in lateral direction from the centreline. Table 6 shows the voltage output efficiencies of PZT patches at various exciting frequencies embedded in a lateral direction. It can be observed from Figure 8 that the output voltage was minimum at 30 Hz excitation frequency and maximum at higher frequencies for a depth ratio of 0.6. Thus, the maximum voltage output is obtained at more than 30 Hz excitation frequency in the transverse direction. The variation in the output voltage at varied excitation frequencies is due to the confinement of the granular fill. Hence, the distance from the centreline of the load influences the efficiency of the PZT patch embedded in confined granular fill, similar result was found by Ding et al. (2018).

5. Conclusions

This study investigated the effect of the confined granular soil on the efficiency of the PZT patches under various exciting frequencies. The dynamic response of experimental data were analysed using fast Fourier transformation (FFT). The peak pick method was used to analyse the natural frequency of the system. An analysis was also performed of the influence of excitation frequency and embedment depth on the voltage output of PZT patches. Further, a set of static cone penetration tests were carried out to monitor the effect of confinement under various excitation frequencies. The significant findings are summarized as follows:
(i)
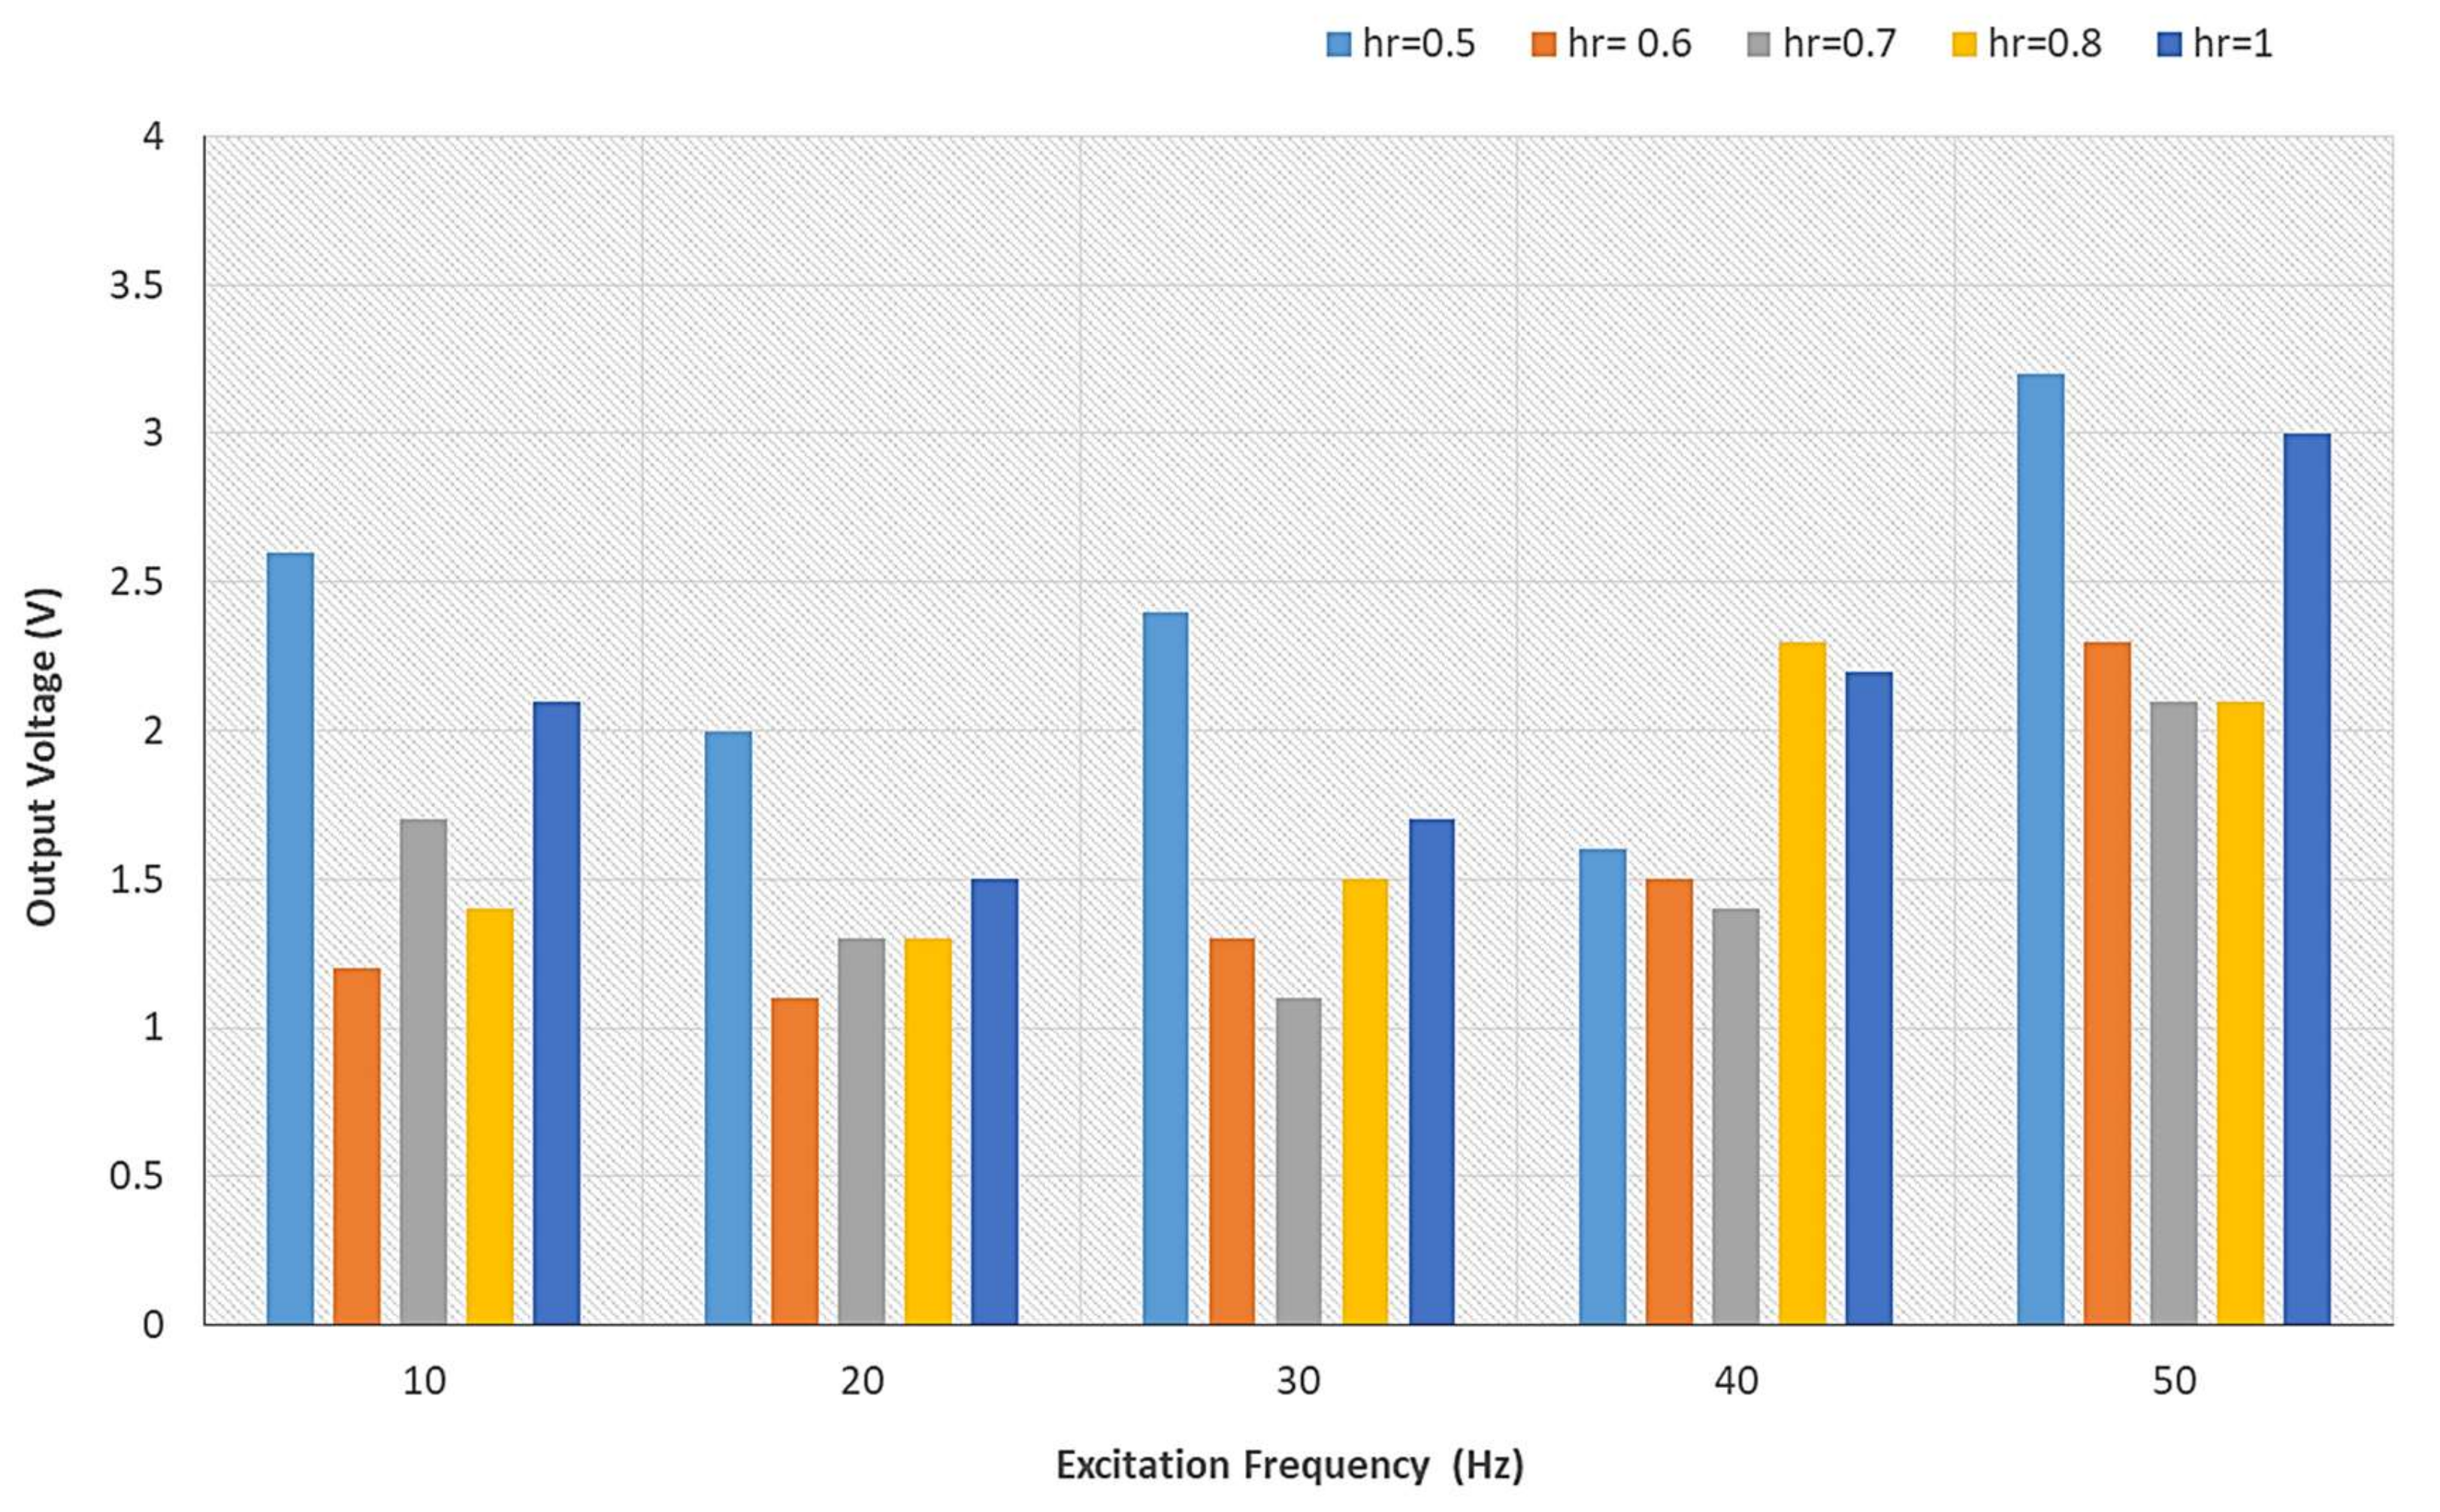
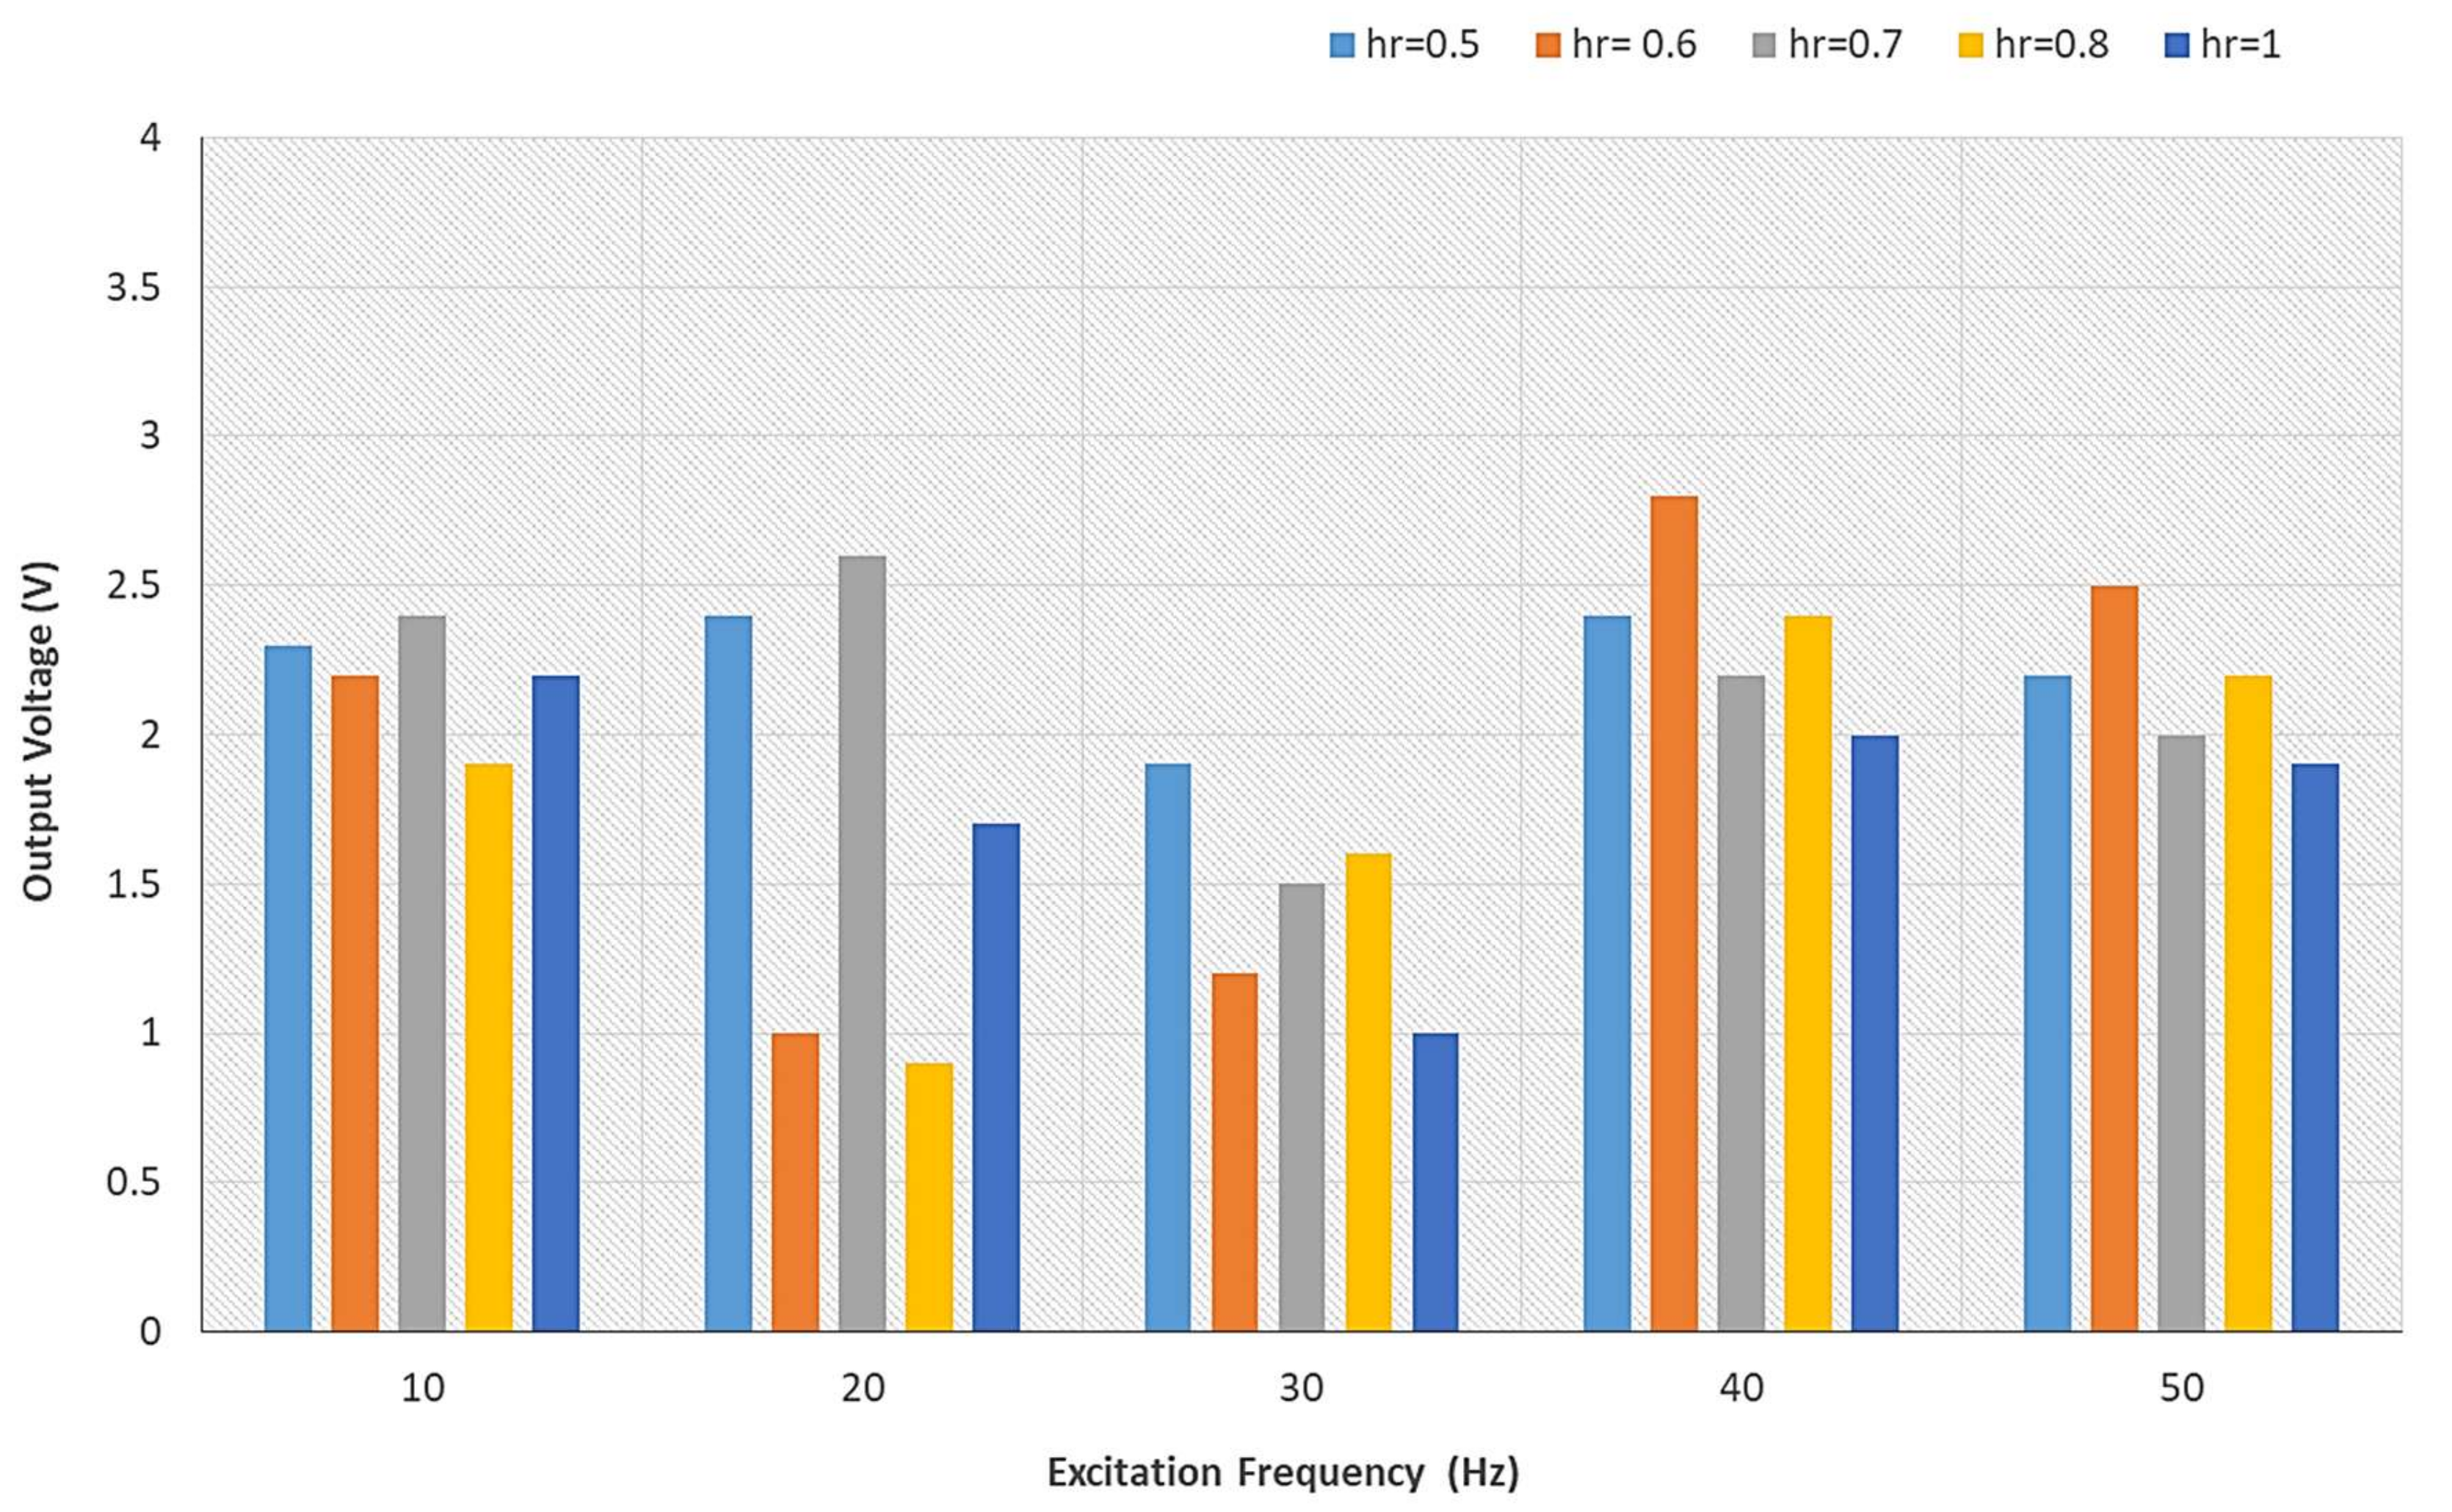
The voltage output from the PZT patch depends on the excitation frequency and placement of the PZT patch. For the same embedment depth, the peak voltage output in vertical direction is observed at 50 Hz, while in the transverse direction, it is obtained at 10 Hz.
(ii)
The depth of the compressive and tensile regions of the embedded PZT patch should be considered to obtain the maximum output voltage. For the same excitation frequency (f = 10–20 Hz), the maximum output voltage was obtained at a thickness of 20 cm for vertical vibration. For the transverse vibration, the maximum output voltage was obtained at a thickness of 30 cm.
(iii)
The cone resistance at various penetration depths indicates that voltage output increased proportionally with the cone resistance after excitation at the natural frequency. For excitation frequencies (f = 40–50 Hz), the voltage output increased from 22–45% for cone resistance in the 9–10% range. This variation indicates that the densification of fill and consequent increase in the cone resistance significantly impact improving the efficiency of the PZT patch.
(iv)
The natural frequency and damping loss factor significantly influence the voltage output of the PZT patch.

Author Contributions

Conceptualization, N.K. and A.T.; methodology, N.K. and A.T.; formal analysis, N.K.; investigation, N.K.; resources, N.K. and A.T.; data curation, N.K.; writing—original draft preparation, N.K.; writing—review and editing N.K.; visualization, N.K. and A.T.; supervision, A.T. All authors have read and agreed to the published version of the manuscript.

Funding

This research received no external funding.

Data Availability Statement

Data is contained within the article.

Acknowledgments

The first author is thankful to Amit Bandyopadhyay, Washington state university, Pullman, for the constructive and valuable suggestion for writing the manuscript. The authors acknowledge resources and support from Delhi technological university, Delhi.

Conflicts of Interest

The authors declare no potential conflict of interest with respect to the research, authorship, and/or publication of this article.

References

  1. Roundy, S.; Wright, P.K.; Rabaey, J. A study of low level vibrations as a power source for wireless sensor nodes. Comput. Commun. 2003, 26, 1131–1144. [Google Scholar] [CrossRef]
  2. Kim, H.W.; Batra, A.; Priya, S.; Uchino, K.; Markley, D.; Newnham, R.E.; Hofmann, H.F. Energy harvesting using a piezoelectric ”cymbal” transducer in dynamic environment. Jpn. J. Appl. Phys. 2004, 43, 6178. [Google Scholar] [CrossRef]
  3. Jung, H.J.; Kim, I.H.; Jang, S.J. An energy harvesting system using the wind-induced vibration of a stay cable for powering a wireless sensor node. Smart Mater. Struct. 2011, 20, 075001. [Google Scholar] [CrossRef]
  4. Wang, J.; Shi, Z.; Xiang, H.; Song, G. Modeling on energy harvesting from a railway system using piezoelectric transducers. Smart Mater. Struct. 2015, 24, 105017. [Google Scholar] [CrossRef]
  5. Zhang, Z.; Tang, L.; Xiang, H. Piezoelectric energy harvesting from bridge vibrations using different models for moving vehicles. J. Aerosp. Eng. 2019, 32, 04018141. [Google Scholar] [CrossRef]
  6. Erturk, A. Piezoelectric energy harvesting for civil infrastructure system applications: Moving loads and surface strain fluctuations. J. Intell. Mater. Syst. Struct. 2011, 22, 1959–1973. [Google Scholar] [CrossRef]
  7. Kumari, N.; Trivedi, A. Vibration Control of Flexible Retention Systems. In Advances in Computer Methods and Geomechanics; Lecture Notes in Civil Engineering; Springer: Singapore, 2020; Volume 2, pp. 529–539. [Google Scholar]
  8. Peigney, M.; Siegert, D. Piezoelectric energy harvesting from traffic-induced bridge vibrations. Smart Mater. Struct. 2013, 22, 095019. [Google Scholar] [CrossRef]
  9. Zhao, H.; Ling, J.; Yu, J. A comparative analysis of piezoelectric transducers for harvesting energy from asphalt pavement. J. Ceram. Soc. Jpn. 2012, 120, 317–323. [Google Scholar] [CrossRef]
  10. Chen, Y.; Zhang, H.; Zhang, Y.; Li, C.; Yang, Q.; Zheng, H.; Lü, C. Mechanical energy harvesting from road pavements under vehicular load using embedded piezoelectric elements. J. Appl. Mech. 2016, 83, 081001. [Google Scholar] [CrossRef]
  11. Roshani, H.; Dessouky, S.; Montoya, A.; Papagiannakis, A.T. Energy harvesting from asphalt pavement roadways vehicle-induced stresses: A feasibility study. Appl. Energy 2016, 182, 210–218. [Google Scholar] [CrossRef]
  12. Cahill, P.; Mathewson, A.; Pakrashi, V. Experimental validation of piezoelectric energy-harvesting device for built infrastructure applications. J. Bridge Eng. 2018, 23. [Google Scholar] [CrossRef]
  13. Ding, G.; Zhao, X.; Sun, F.; Wang, J. Effect of subgrade on piezoelectric energy harvesting under traffic loads. Int. J. Pavement Eng. 2018, 19, 661–674. [Google Scholar] [CrossRef]
  14. Kumari, N.; Trivedi, A. Factors Influencing Piezoelectric Response of Horizontally and Vertically Embedded PZT Patch in Confined Granular Fills. Adv. Mater. Sci. Eng. 2022, 2022, 7860273. [Google Scholar] [CrossRef]
  15. Xiang, H.J.; Wang, J.J.; Shi, Z.F.; Zhang, Z.W. Theoretical analysis of piezoelectric energy harvesting from traffic induced deformation of pavements. Smart Mater. Struct. 2013, 22, 095024. [Google Scholar] [CrossRef]
  16. Kumari, N.; Trivedi, A. Application of Semi-Active Control Strategy for The Wall Retaining Granular Fills. In Proceeding of the China-Europe Conference on Geotechnical Engineering 2018, SSGG, Vienna, Austria, 13–16 August 2018; Springer: Berlin, Germany, 2018; pp. 978–982. [Google Scholar]
  17. Zhang, C.; Wang, X.; Yan, Q.; Vipulanandan, C.; Song, G. A novel method to monitor soft soil strength development in artificial ground freezing projects based on electromechanical impedance technique: Theoretical modeling and experimental validation. J. Intell. Mater. Syst. Struct. 2020, 31, 1477–1494. [Google Scholar] [CrossRef]
  18. Humar, J.L.; Xia, H. Dynamic response analysis in the frequency domain. Earthq. Eng. Struct. Dyn. 1993, 22, 1–12. [Google Scholar] [CrossRef]
  19. Zimmerman, A.T.; Shiraishi, M.; Swartz, R.A.; Lynch, J.P. Automated modal parameter estimation by parallel processing within wireless monitoring systems. J. Infrastruct. Syst. 2008, 14, 102–113. [Google Scholar] [CrossRef]
  20. Singh, M.; Trivedi, A.; Shukla, S.K. Influence of geosynthetic reinforcement on unpaved roads based on CBR, and static and dynamic cone penetration tests. Int. J. Geosynth. Ground Eng. 2020, 6, 13. [Google Scholar] [CrossRef]
  21. Trivedi, A.; Singh, S. Cone resistance of compacted ash fill. J. Test. Eval. 2004, 32, 429–437. [Google Scholar] [CrossRef]
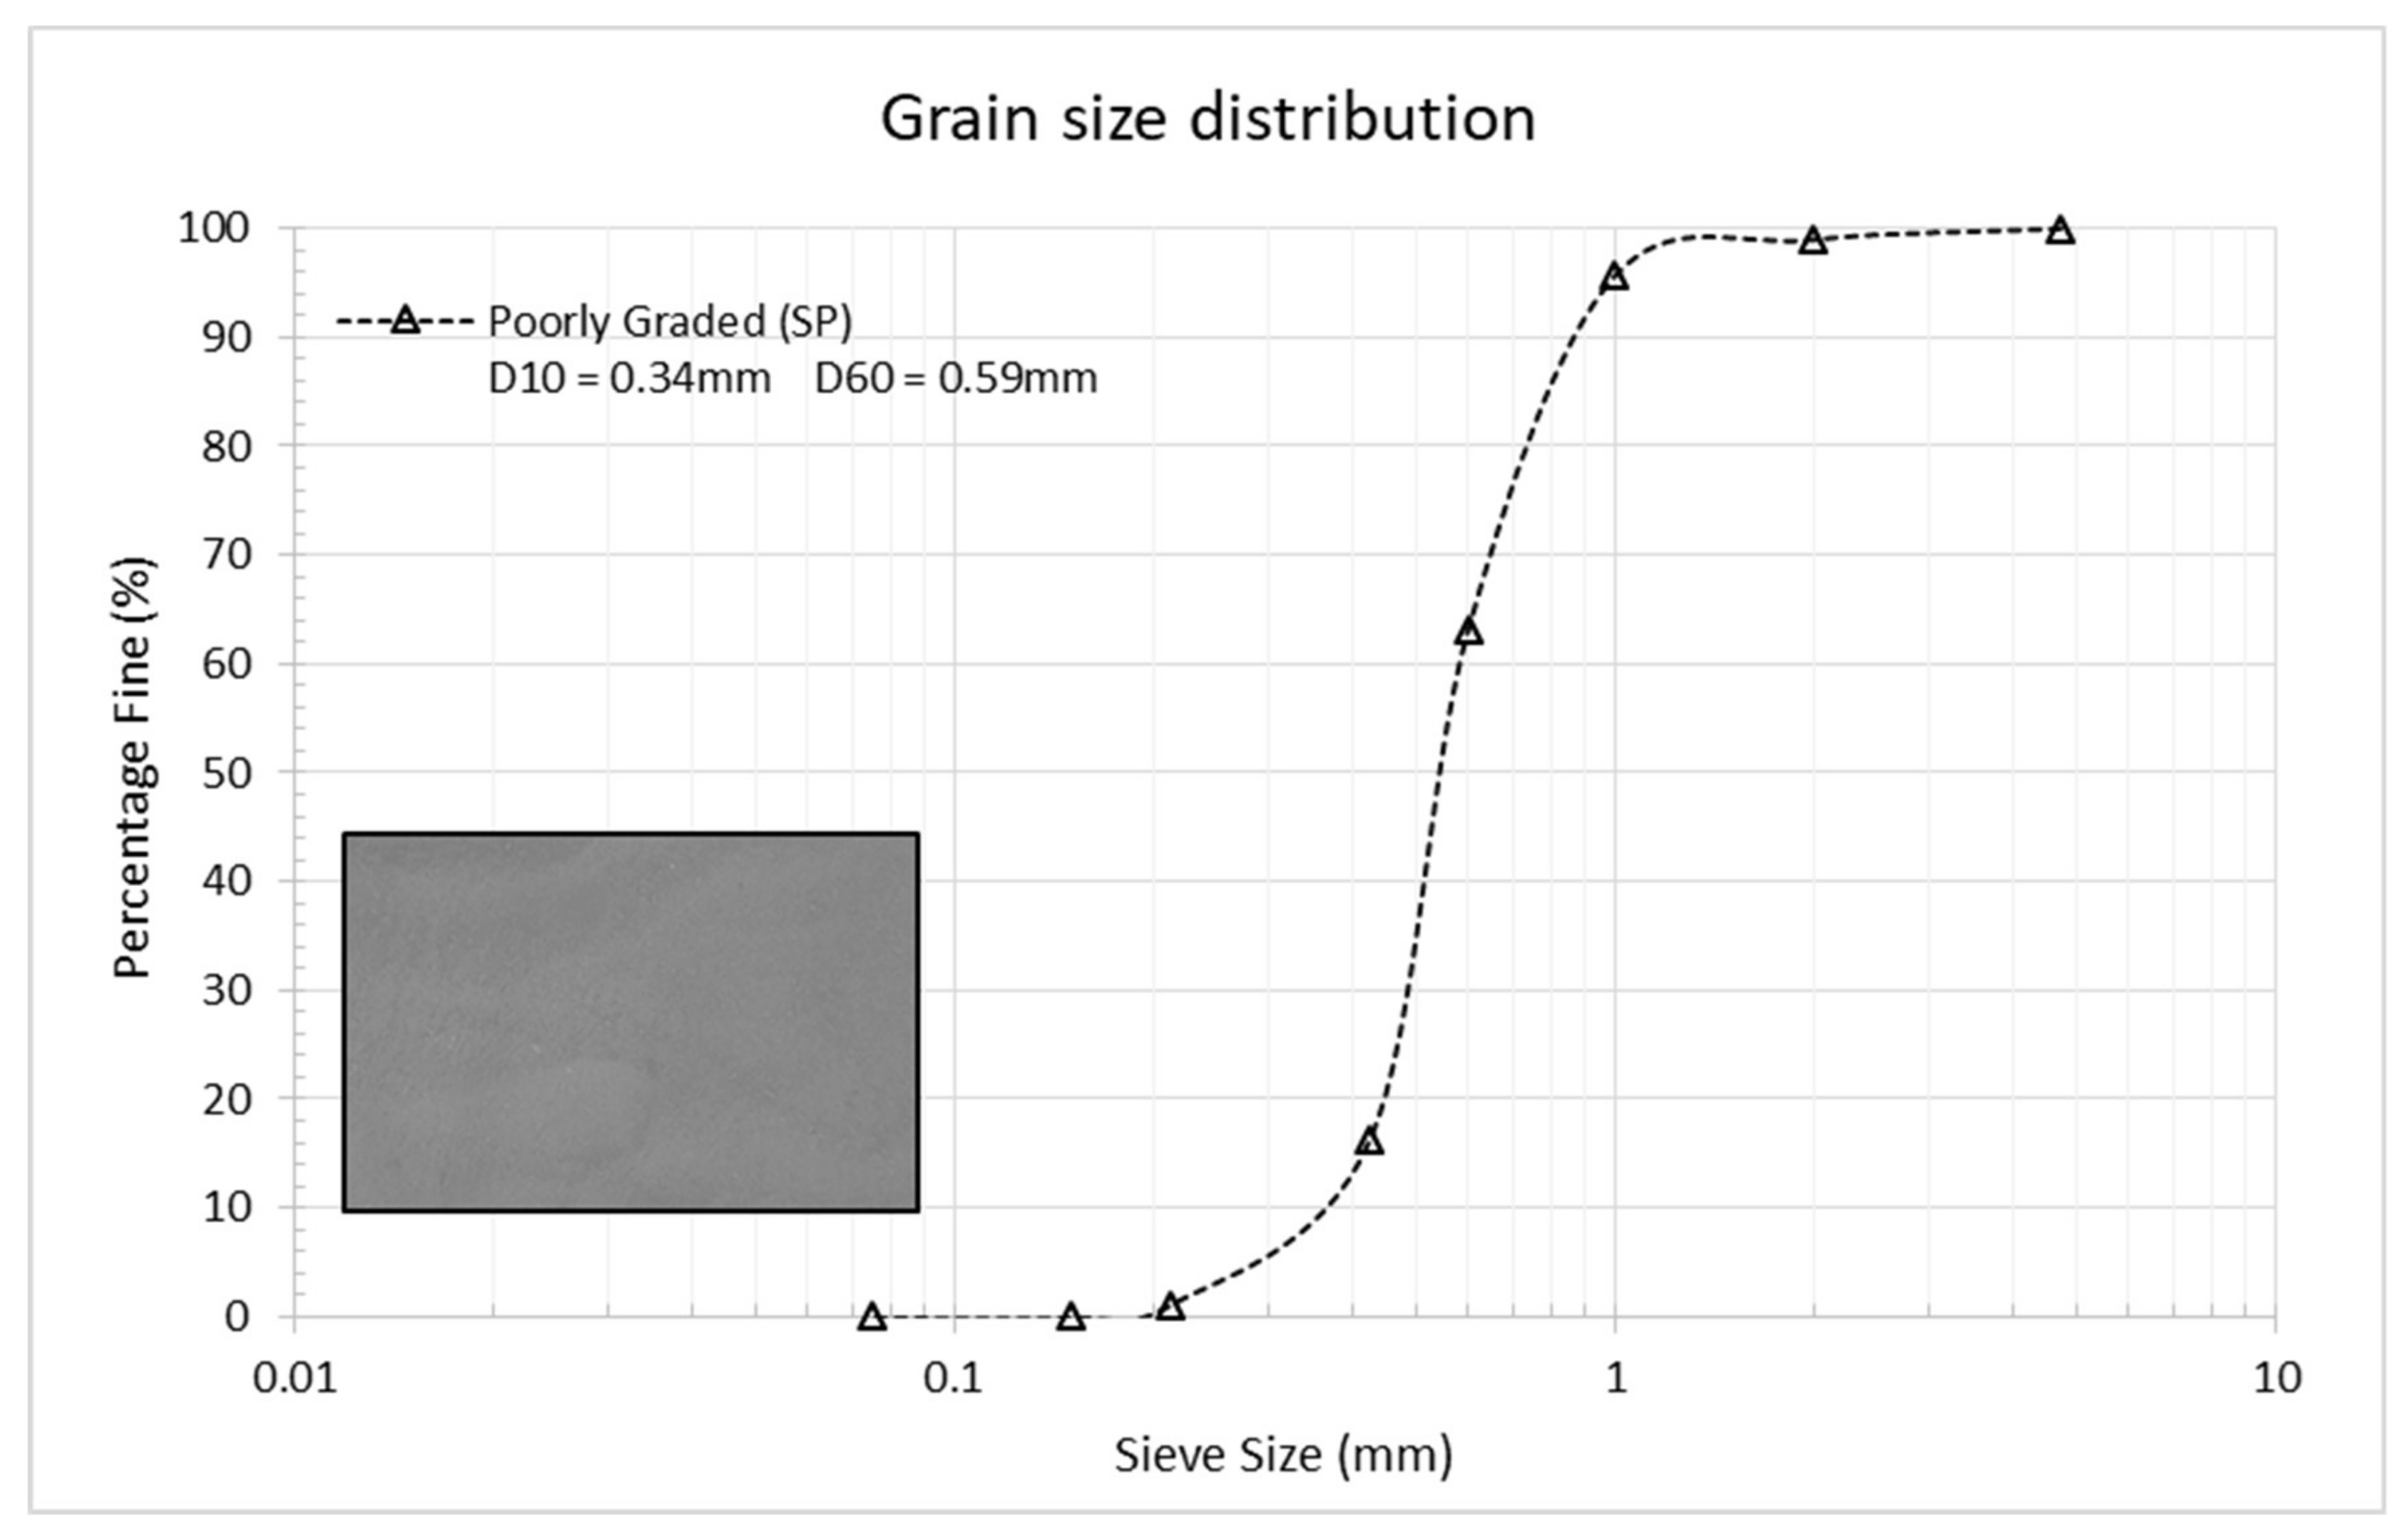
Figure 1. Particle size distribution of granular material (grey in colour) used in the present study.
Applsci 12 09711 g001
Figure 2. Laboratory experimental set-up for dynamic response and voltage measurement.
Applsci 12 09711 g002
Figure 3. (a) Layout of the PZT patch embedded into the confined granular fill for the vertical and transverse vibrations; (b) The optical image of the embedded PZT patches in pavement at various depth.
Applsci 12 09711 g003
Figure 4. Layout of the test section measurement and testing locations A, B, C and D of digital SCP test.
Applsci 12 09711 g004
Figure 5. Influence of depth of granular fill (20–40 cm) on the displacement spectrum at an excitation frequency of (A) 10 Hz; (B) 20 Hz; (C) 30 Hz; (D) 40 Hz; (E) 50 Hz.
Applsci 12 09711 g005aApplsci 12 09711 g005bApplsci 12 09711 g005c
Figure 6. Cone resistance obtained from digital SCP data for confined granular fill with and without excitation frequency of (A) 10–30 Hz; (B) 40–50 Hz.
Applsci 12 09711 g006
Figure 7. Output voltage for PZT patches embedded at varying depths in the vertical direction.
Applsci 12 09711 g007
Figure 8. Output voltage for PZT patches embedded at varying depths in the transverse direction.
Applsci 12 09711 g008
Table 1. Index properties of the confined granular materials.
Maximum Dry Unit Weight (kNm−3)Degree of Compaction (%)Specific GravityOptimum
Moisture
Content (%)
IS Classification
18.496.72.513.91SP
Table 2. Properties of the PZT patch.
PropertiesSymbolMagnitude
Dielectric constant ε 33 T ε o 3270
Dielectric losstanδ0.016
Electromechanical coupling factor k 31 0.52
Piezoelectric charge constant (pC N−1)d31−275
Piezoelectric voltage constant (10−3 Vm N−1)g31−9.5
Young’s modulus (GPa)Y61
Unit weight (kNm−3)γ7.2
Table 3. Peak amplitude of vibration in vertical and transverse direction for confined granular fill.
Input Excitation Frequency (Hz)Vertical VibrationTransverse Vibration
Acceleration
(µm/s2)
Velocity
(µm/s)
Displacement
(µm)
Acceleration
(µm/s2)
Velocity
(µm/s)
Displacement
(µm)
102579520.5371243200.290
20913.260.7590.00777.12810.008
30272,00014415.90815,000438918.33
40103,0002330.9357,9202991.19
502102460.0231766450.018
Table 4. Damping loss factor and natural frequency of the confined granular fill.
Excitation Frequency (Hz)1020304050
Natural frequency (Hz)3131303249
Damping loss factor (ξ)0.1210.1270.1320.1760.122
Table 5. Fitting parameters α and β for the confined granular fill at varying excitation frequency.
Exciting Frequency (Hz)αβR2
10−3 × 10−50.11570.9976
20−3 × 10−50.10350.9988
30−7 × 10−50.15390.9978
40−6 × 10−50.14390.9946
50−8 × 10−50.14320.9814
Table 6. Voltage output efficiency of PZT patch embedded in poorly graded soil for various excitation frequencies.
Depth Ratio (hr)Input
Excitation Frequency
(Hz)
Voltage Output in Vertical
Direction (Vv)
Efficiency (%)Voltage Output in the
Transverse
Direction (Vt)
Efficiency (%)
0.5102.6 2.3
201.2542.24.3
301.7352.44.3
401.4461.917.4
502.1192.24.3
0.6102 2.4
201.145158
301.3352.68
401.3350.963
501.5251.729
0.7102.4 1.9
201.3461.237
301.1541.521
401.5381.616
501.729147
0.8101.6 2.4
201.562.817
301.4132.28
402.3442.34
502.247217
1103.2 2.2
202.3282.514
302.13429
402.1342.15
503.061.914
Publisher’s Note: MDPI stays neutral with regard to jurisdictional claims in published maps and institutional affiliations.

