Article

Geometric Accuracy Evaluation Method for Subway Stations Based on 3D Laser Scanning

1
School of Transportation and Civil Engineering, Nantong University, Nantong 226019, China
2
School of Geographical Sciences, Nantong University, Nantong 226019, China
3
China Railway 19th Bureau Group Co., Ltd., Suzhou 215000, China
4
Key Laboratory of Urban Land Resources Monitoring and Simulation, Ministry of Natural Resources, Shenzhen 518034, China
*
Authors to whom correspondence should be addressed.
Appl. Sci. 2022, 12(19), 9535; https://doi.org/10.3390/app12199535
Submission received: 30 August 2022 / Revised: 18 September 2022 / Accepted: 19 September 2022 / Published: 22 September 2022

Abstract

:
The rapid development of three-dimensional (3D) laser scanning technology has provided a new technical means for the geometric accuracy evaluation of subway stations. With high precision and high efficiency, laser scanning technology can present the construction site condition in a panoramic way, which is essential for achieving high precision and all-round geometric accuracy evaluation. However, when the survey coordinate system of the design building information modeling (BIM) predefined in the design stage is not applied during the laser scanning data acquisition or the BIM loses the survey coordinate system during the interaction, the objects will have different coordinate positions in the point cloud and BIM, which will limit the accuracy comparison between the two data sources. Meanwhile, the existing methods mainly focus on the above overground buildings, and the accuracy evaluation of underground structures mainly focuses on the overall deformation monitoring. So far, the existing methods do not constitute a hierarchical index system to assess the geometric accuracy of various objects in the subway station. This study proposes a method to evaluate the geometric accuracy of subway stations based on laser scanning technology. A coarse-to-fine coordinate registration from point cloud to the design BIM is used to unify coordinates in different reference systems; and geometric accuracy evaluation of different structures in subway stations is achieved by developing geometric accuracy evaluation indexes and technical systems. The method is applied to the geometric accuracy monitoring of the Hongqi Road subway station, and the experimental results verify the reliability of the method.

1. Introduction

In recent years, the rapid development of underground rail systems around the world has greatly facilitated people’s daily travel and promoted economic development [1]. The construction of subway stations, as links to subways, is the key to underground rail systems. However, the construction of subway stations is difficult and technically demanding [2]. Ensuring geometric accuracy is important in urban subway construction. Subway station construction includes a series of dynamic processes from planning, to design, to construction, and to maintenance; the building information modeling (BIM) created in the design stage is often divorced from reality in the construction phase. The efficient construction monitoring and accuracy evaluation of subway stations are important to ensure the quality of subway construction and reduce construction problems [3].
Traditional construction monitoring of subway stations relies on point-to-point measurements by construction personnel using instruments such as steel rulers or total stations. However, the construction site environment is complex, and the target points to be measured are distributed in regular or irregular surface patterns, which makes it difficult for traditional measurement methods to achieve complete data acquisition on the surface of the building structure [4,5]. Three-dimensional (3D) laser scanning allows panoramic, high precision, and fast acquisition of object surface information and is widely used in various applications of civil engineering, such as automated modeling, construction progress tracking, construction safety management, and automated construction [6,7,8,9,10,11,12,13,14,15]. In the field of project quality inspection, some scholars [16,17] have used laser scanning techniques for dimensional quality inspection to compare information about the size [18], shape [19], and location [20] of construction project infrastructure with design models to identify potential quality problems. In building construction, the surface flatness of concrete slabs is usually measured using the industry-specified F-number method [21,22]. The F-number method samples concrete slabs at 300 mm intervals and statistically processes them to generate F values that reflect the surface condition. However, due to the sparseness of the measurements, it is not only impossible to pinpoint the precise site of the deviation but also fails to adequately reflect the geometrical properties of the entire surface. At the same time, for the geometric accuracy evaluation of large sites (e.g., subway stations), this method can only be applied to the bottom slab, which lacks flexibility. Some scholars have tried to reduce potential problems during the construction of subway stations by developing prefabricated component technologies [23] or controlling the assembly accuracy [24]. However, these methods concentrate on the accuracy control of specific regions and do not involve a part to whole assessment of subway stations.
The key to geometric accuracy evaluation is the comparison of differences, and current problems include the following two aspects [25]: (1) The inconsistency of coordinate systems. In the design stage, if the survey coordinate system is predefined for the BIM, and the laser scanning point cloud uses the same survey coordinate system as BIM, then the coordinate system is consistent between BIM and the point cloud. The object has the same position coordinates in both data, which can satisfy the difference comparison between BIM and the point cloud; if a survey coordinate system different from the predefined BIM is used in the process of obtaining the actual point cloud, then the two coordinate systems are inconsistent, which will limit the comparison, and the point cloud needs to be registered with BIM. (2) Evaluation index and evaluation system. Existing accuracy inspection methods are designed for the precise assembly of prefabricated components [26], which cannot be applied to the geometric accuracy evaluation of an entire subway station construction site, and systematic evaluation indexes and evaluation systems need to be established to provide efficient guidance for the subway station geometric accuracy evaluation process.
The main contributions of this study are summarized as follows: (1) a coarse-to-fine registration method is proposed to effectively integrate point cloud and BIM to the same survey coordinate reference, and (2) a hierarchical evaluation index and system applicable to the structural surface of subway station buildings is proposed to achieve effective geometric accuracy evaluation through statistical analyses and visualization.
This article is organized as follows. In Section 2, existing registration problems and geometric accuracy evaluation methods are reviewed. Section 3 describes the proposed registration method and evaluation index. A case study is presented in Section 4. The experimental results are discussed in Section 5. Finally, conclusions are presented in Section 6.

2. Related Work

In recent years, researchers have applied laser scanning techniques to a wide range of essential construction tasks. The work closely related to this study includes both registration and geometric accuracy evaluation [6,16]. Therefore, this chapter reviews the related research works in these two aspects.

2.1. Registration Issues

Registration is a classical problem in point cloud processing, which usually refers to the process of converting point clouds in two different coordinate systems to the same coordinate system. Point cloud registration includes coarse registration and fine registration. Coarse registration achieves rough registration and provides initial transformation values for fine registration [27]. The fine registration further registers the roughly aligned two point clouds to obtain more accurate pose information [28]. The registration from point cloud to BIM is similar to point-cloud-to-point-cloud registration, and its goal is to achieve the coordinate consistency of the point cloud and BIM through coordinate transformation.

2.1.1. Registration between Point Clouds

Coarse registration between point clouds can be divided into target-based registration and feature-based registration. Target-based registration requires placing targets in the scene that are easy to identify and match. The most common target is a sphere because the angle of the sphere remains constant in all directions and the center of the sphere can be used as a common point in multiple datasets. Franaszek et al. [29] proposed a method to rapidly and automatically identify 3D spherical targets in point clouds. The target-based matching method is often widely used in the architecture, engineering, and construction (AEC) fields due to its accuracy [30]; however, the method requires advance deployment of the scanning site and high-precision scanning of each sphere separately, and these limitations limit its application.
A feature-based registration method identifies significant geometric features of two datasets for registration by extracting feature points or primitives from the point cloud surface, including point features [31], line features [32], planes [33], local normal vectors [34], and combinations of geometric primitives. Compared to point features, the use of higher latitude geometric primitives can improve the robustness of identifying correspondences [35]. Bassier et al. [36] proposed an online pose voting algorithm based on the extended reality technique, which integrates two-dimensional (2D) and 3D data, and first uses the Global Navigation Satellite System (GNSS) to estimate the poses for global registration, followed by registering selected image data and point cloud data separately, achieving reliable registration accuracy by using multiple data sources and registration methods. Compared with target-based registration methods, feature-based registration methods do not rely on target points, and the research focuses on the automated extraction and automated registration of features [27].
The iterative closest point (ICP) algorithm [37] is the most classical fine registration method, which derives several variants by iterating several times to achieve the best local registration results [38,39,40]. Nevertheless, these variant algorithms still need to ensure that the two datasets are close enough to each other to minimize the overall difference.

2.1.2. Registration between Point Clouds and BIM

In recent years, the use of BIM in AEC has increased, and while registration problems are not limited to point clouds, point clouds for BIM registration have received more attention. In essence, point-cloud-to-BIM registration can be accomplished using the point-cloud-to-point-cloud registration technical approach, since BIM can be quantified as sampled points or meshes [41]. Using the geometric, semantic, and topological information of a building structure, much work has been conducted by many scholars on the registration of point clouds with BIM.
Bosche et al. [20] first proposed a point-based manual coarse registration method for registering point clouds with BIM. The method selects at least three pairs of corresponding points in two datasets for manual coarse registration and subsequently optimizes the registration results using the ICP algorithm. However, this method involves many manual operations. To reduce the number of manual operations, some scholars have investigated feature-based automatic registration methods. Bosche et al. [27] performed coarse registration based on planar pair point clouds with BIM by extracting planar surface elements from two datasets separately and calculating transformation parameters for coarse registration using the known relationship. This method avoids the tedious process of determining the corresponding points one by one and improves the automation of the registration. However, manual intervention is still required in the initial registration process.
The BIM in the design phase and the point cloud belong to different modal data, and there may be significant differences between the datasets, making it more challenging to obtain the homonymous features in the point cloud from the BIM for registration. In practice, registration is performed by finding the corresponding points, lines, and planes. However, BIM contains a series of building geometry objects and semantic property definitions, and point elements only exist in the corner points of objects, which are difficult to capture in point clouds and difficult to extract automatically. Therefore, it is more convenient to use line elements and plane elements as corresponding features. Chen et al. [42] proposed an automated column-based coarse registration method to measure geometric accuracies by locating the center of mass of each column to register the point cloud with the BIM, using random sample consistency (RANSAC) to determine the transformation parameters. However, this method requires pre-segmentation of the point cloud and a high accuracy of the extracted column centers, because the column fitting will cause the accumulation of errors. The premise of the existing registration methods is that two kinds of data (Point cloud and BIM) have the same coordinate system. For the cases that datasets in different survey coordinate systems, objects need to be aligned to the same coordinate system before registration.

2.2. Geometric Accuracy Evaluation

Recently, the application of soft computing techniques in the reliability analysis of buildings and structures is ever increasing [43]. Bülbül et al. [44] integrated a Genetic Algorithm (GA) and Artificial Neural Network (ANN) to predict the risk priority of buildings in highly seismic front regions. ANN was used by Harirchian et al. [45] and Guptha et al. [46] to simulate climate change scenarios to evaluate the reliability of urban drainage systems. The experimental results can ensure the sustainable development of the city. Among them, laser scanning has been widely used in the accuracy inspection of construction components, such as precast elements, construction panels, and steel reinforcement. Some scholars measure the accuracy of concrete surfaces based on methods defined by construction industry standards (e.g., the straightedge method, the F value method, and the corrugation index method). Additionally, existing methods rely on the accuracy inspection of a small number of measurement points on a construction surface, which interferes with a comprehensive and complete accuracy inspection of the surface [46]. Some scholars [21] have used laser scanning technology to obtain the data required for the F value method to calculate the surface flatness, which overcomes the time-consuming sampling and low accuracy disadvantages of traditional methods. However, this method is still unable to accurately describe the geometric details of the entire plane.
Kim et al. [47] used 3D laser scanning to evaluate the accuracy of rectangular precast concrete elements. Their method measured the dimensional size characteristics of the elements and evaluated their accuracy by detecting the boundary points of the precast concrete elements. Li et al. [25] proposed a method to evaluate the flatness quality of building structure surfaces by segmenting the wall point cloud using the RANSAC algorithm and calculating the deviation of the point cloud data from the plane after fitting the point cloud data to the plane to obtain the unit normal vector. Puri et al. [46] proposed a method based on laser scanning to detect the flatness of building surfaces, applying a continuous wavelet transform (CWT) to obtain information such as the period and position of the undulations of the building surface. Geometric accuracy evaluation is different from the quality inspection of individual components and focuses more on the comprehensive evaluation of the construction site and the construction status, involving a variety of building structures and building components. It is thus difficult to form an effective evaluation system by considering only individual parts of the evaluation process (such as registration and inspection). The existing methods are only evaluated for a single object, and no hierarchical evaluation index system is proposed for subway stations to meet the evaluation of different construction objects of facades, slabs, and columns.
Geometric accuracy evaluation has been an important topic within the AEC fields [6]. Geometric accuracy evaluation refers to comparing the size, location, and orientation of objects in the point cloud with the design BIM to avoid potential quality problems. In recent years, scholars have started to use 3D laser scanning to evaluate the quality of construction sites. There have been studies combining construction specifications and proposing frameworks for geometric accuracy evaluation. A generic framework for accuracy control integrating sensors, laser scanning, and design models proposed by Akinci et al. [48] consists of five steps: creating a design model, identifying inspection objects according to project construction specifications, developing an inspection plan, collecting data, and accuracy control. Kim et al. [49] proposed a framework for the accuracy evaluation of precast concrete components based on 3D laser scanning and BIM, which first determines the inspection list and quality assessment procedures based on construction specifications, determines the scanner and scanning parameters after obtaining the design BIM, and finally decides whether to rework based on the tolerance of the point cloud data and BIM. Existing evaluation systems focus on the geometric accuracy evaluation of aboveground structures [50], there is less research on geometric accuracy evaluation processes for subway stations.
Unlike previous studies, this study proposes a coarse-to-fine registration method to overcome the difficulty of obtaining eponymous features in register point clouds with BIM by aligning two datasets to the same survey coordinate system; a hierarchical evaluation index and a system to meet the geometric accuracy evaluation for subway stations are proposed, and a complete evaluation process is established to ensure the geometric accuracy evaluation of different objects in subway stations.

3. Research Method

3.1. Overview

The workflow of geometric accuracy evaluation using 3D laser scanning in this study is shown in Figure 1a. The methodology proposed in this study consists of four main steps (Figure 1b).
  • A coarse registration based on a grid is used to convert the point cloud to the survey coordinate system predefined in BIM;
  • The point-to-line iterative closest point (PL-ICP) algorithm based on the inner wall lines is used to achieve fine registration;
  • The structural elements of the subway station are extracted from the point cloud;
  • The evaluation indexes are proposed and statistically analyzed for geometric accuracy evaluation.

3.2. The Coordinate Registration of the Point Cloud and BIM

If the survey coordinate system predefined in BIM is not used during the point cloud measurement, it is necessary to register the point cloud with BIM. The BIM grid, as the construction release benchmark, is the main framework of architectural mapping and is closely related to the positioning of the building structure. A laser scanner uses the survey coordinate system in the process of measurement, and it can obtain the precise coordinates of the building structure under the survey coordinate system during operation [51]. Since the scanner itself includes a gyroscope to achieve vertical orientation of the acquired data, the registration of the measured laser point cloud with the BIM can be decomposed into XOY plane coordinate registration and Z-axis coordinate registration. Thus, the coarse-to-fine registration method proposed in this study consists of two steps: coarse registration based on the BIM grid and fine registration based on the inner wall lines.

3.2.1. Coarse Registration Based on Grid

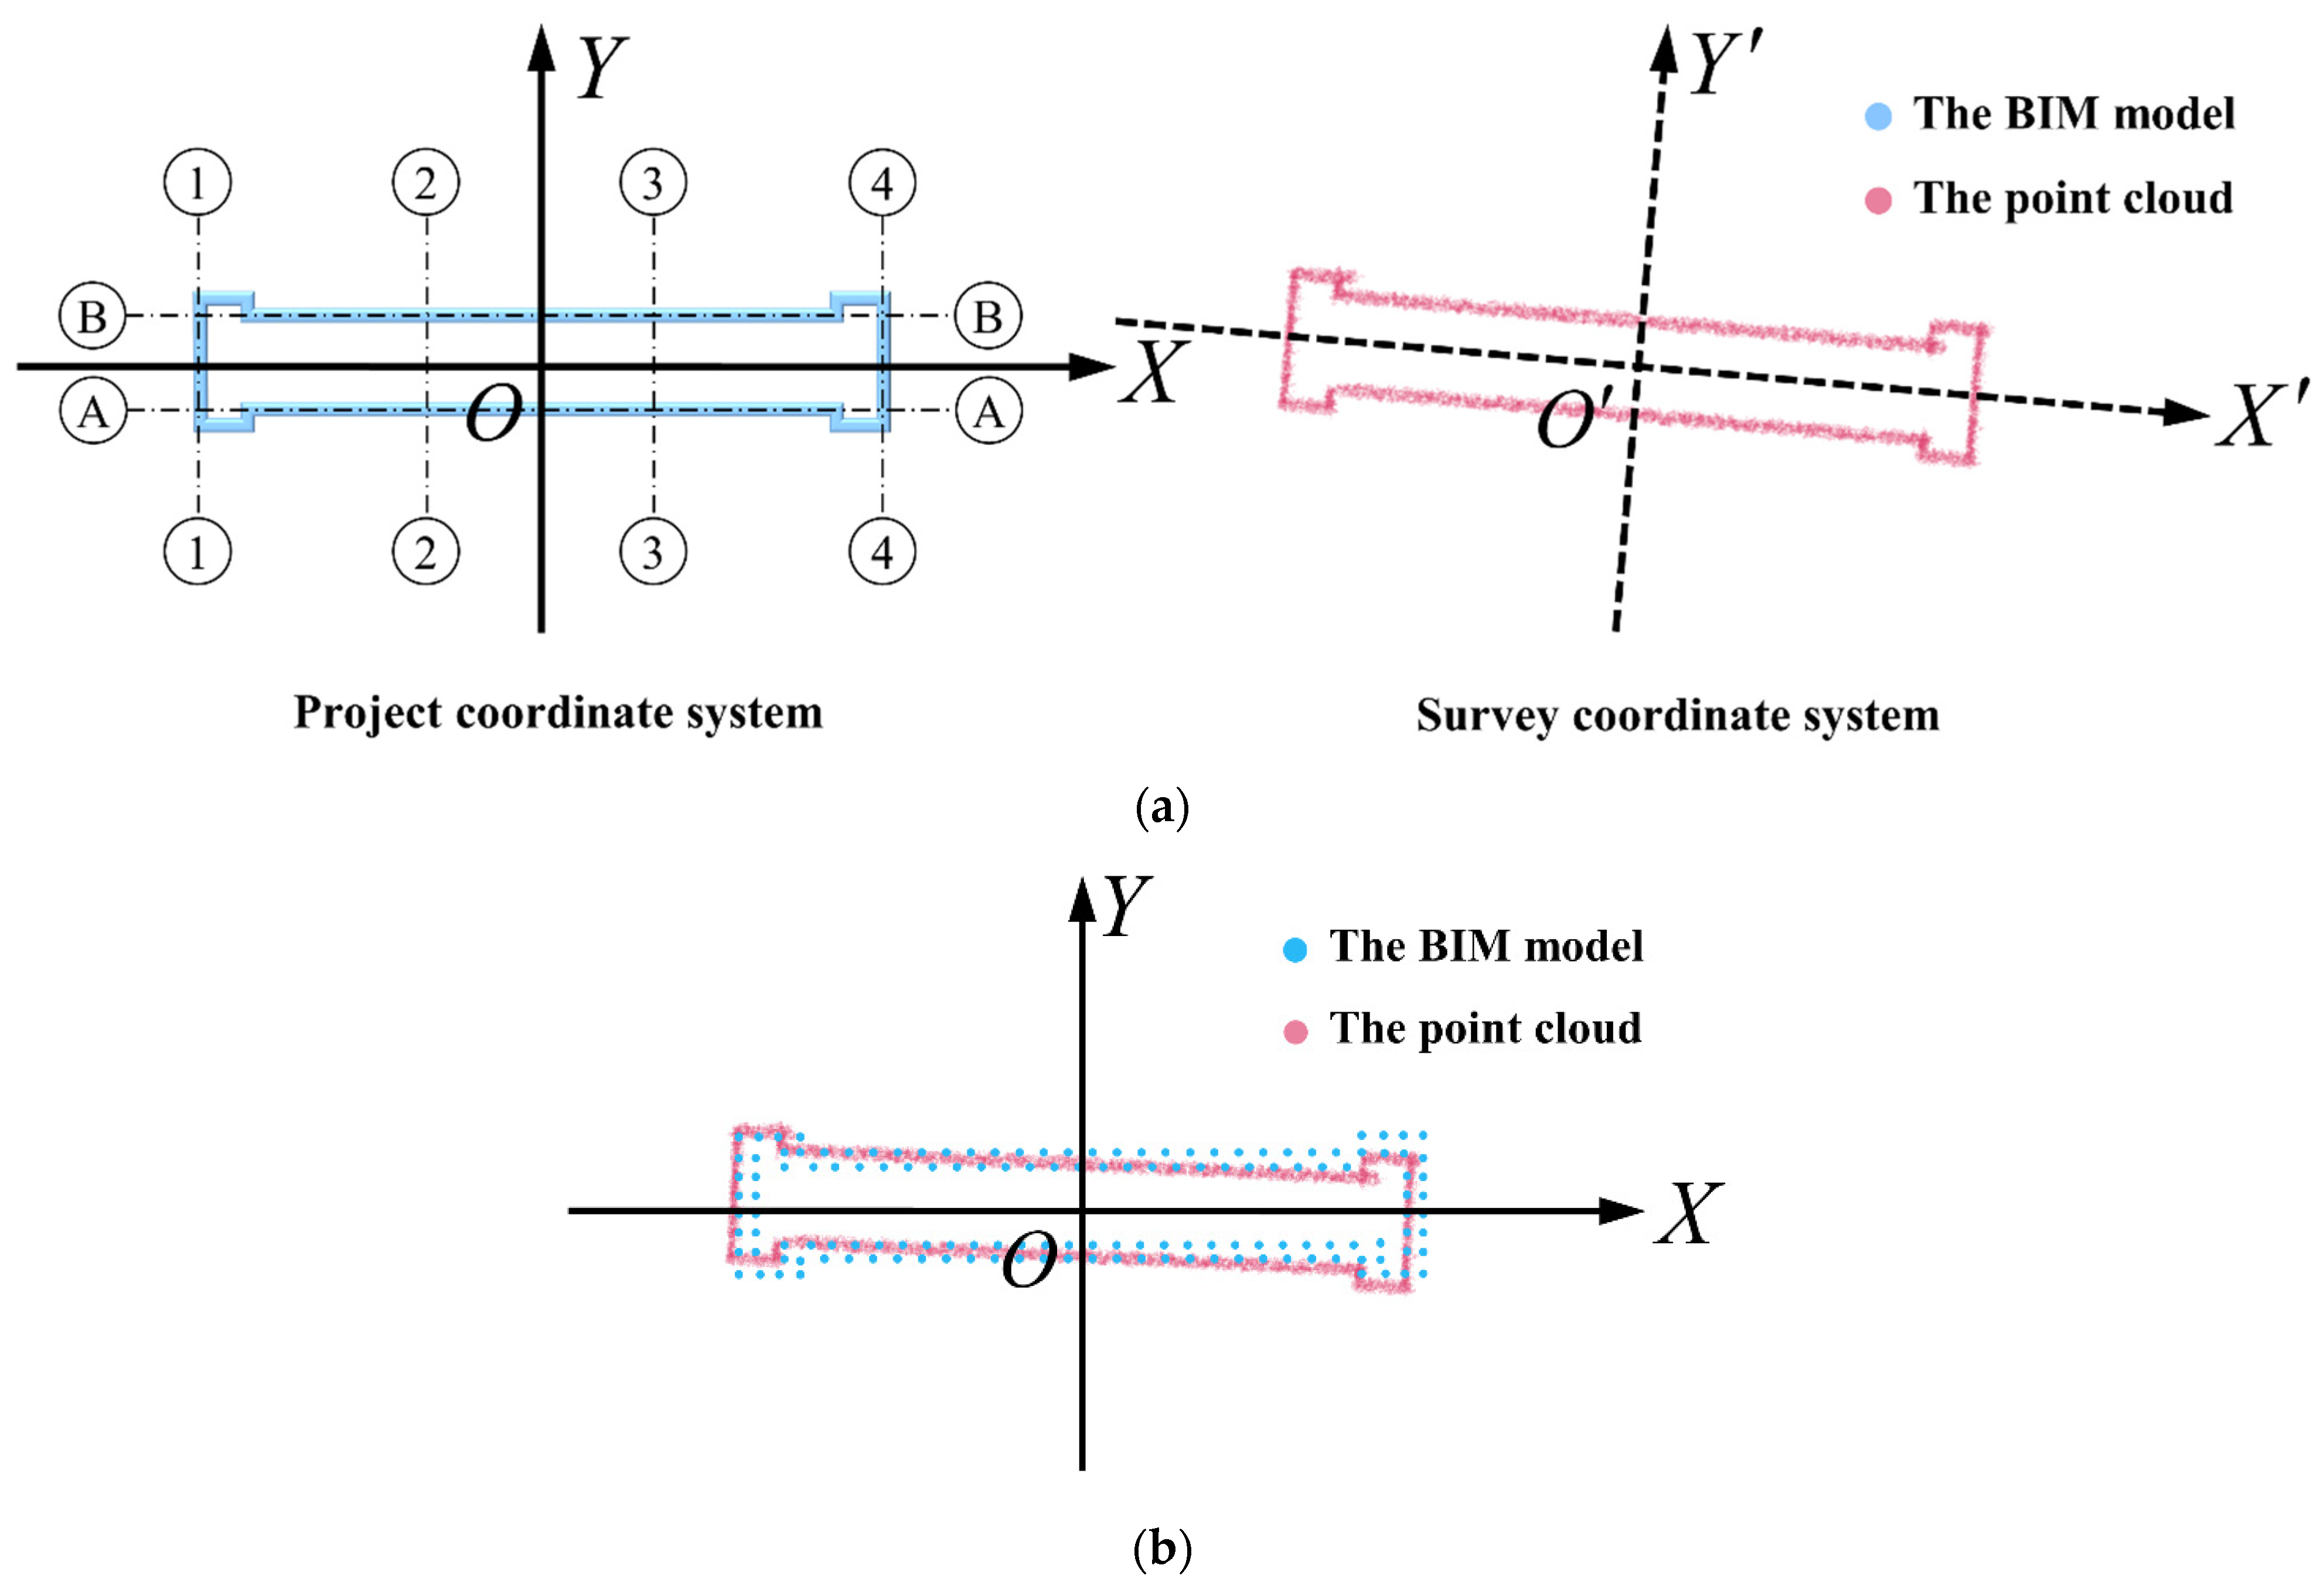
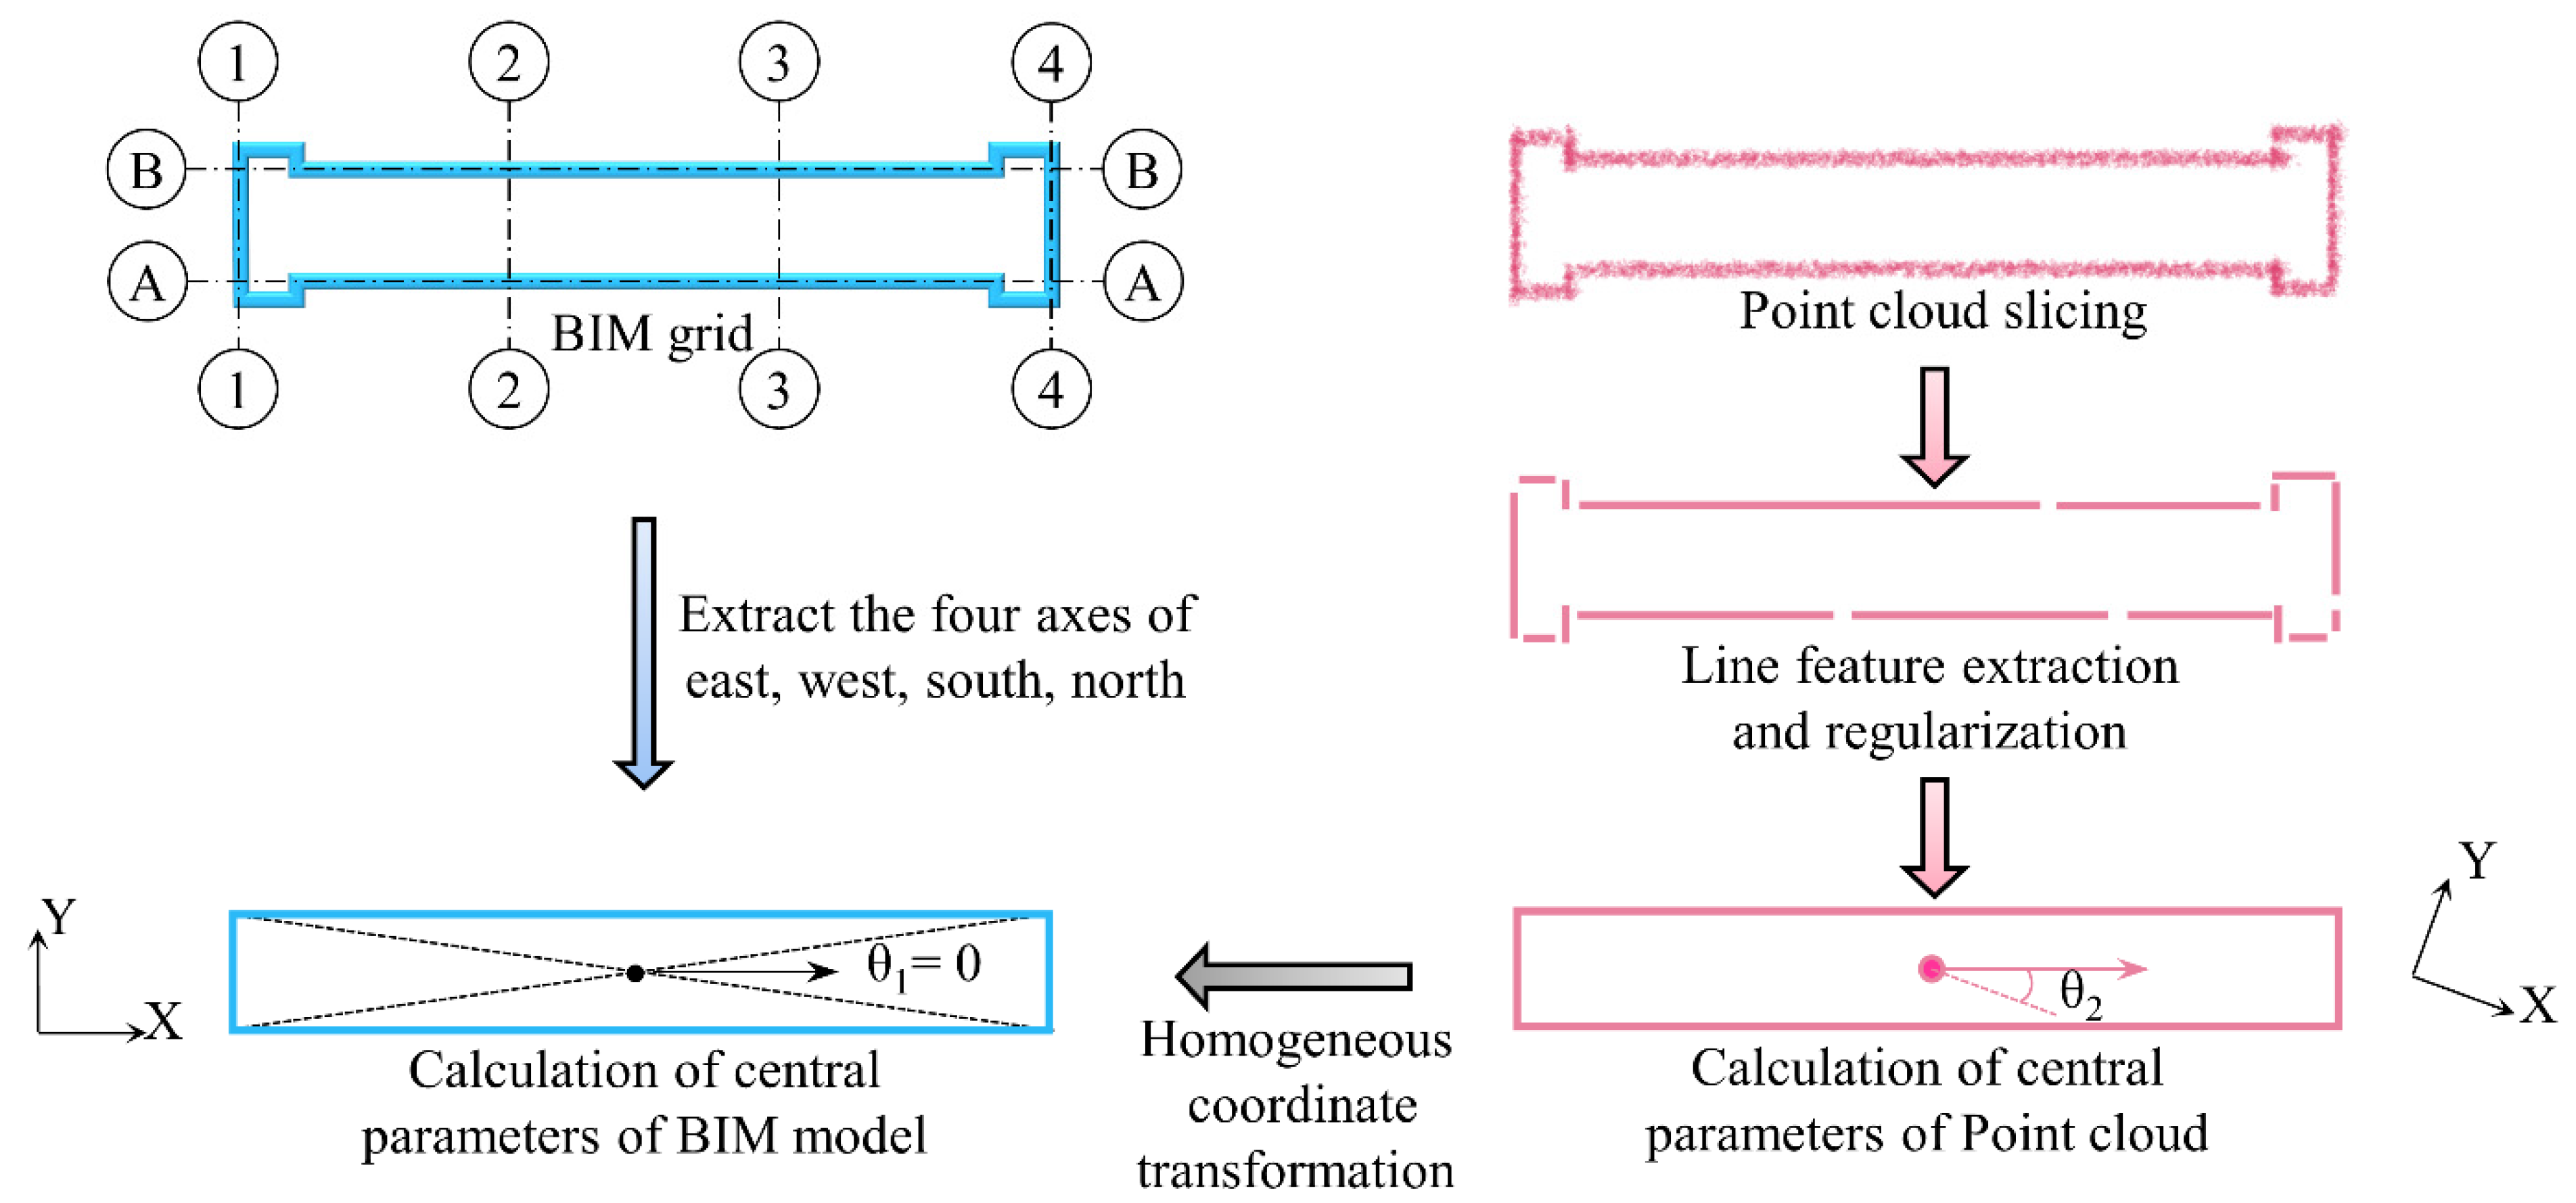
After obtaining the point cloud data, a coarse registration of the point cloud is performed with the design BIM, as shown in Figure 2a, where the blue line frame represents the design BIM, and the pink point represents the point clouds. Figure 2b shows a schematic result of the coarse registration. Similar to [52], the original point cloud is sliced into multiple layers, and the line features are extracted using the double radius threshold line tracking method. After the line features are extracted, they are regularized using the constrained least squares method.
In subway stations, typical underground structures, i.e., facades, slabs (top and bottom slabs), and structural columns, are composed of straight lines that usually exhibit parallel or orthogonal spatial geometric relationships [52]. As noise is inevitable in measurements, the extracted line features are subject to accuracy errors. Therefore, it is necessary to regularize the line features; the condition is defined in Equation (1), where θ is the angle between the line to be measured and the reference line, and tθ is the empirical threshold (set to 10° in this study). If condition 1 is satisfied, the line to be measured will be marked as parallel; if condition 2 is satisfied, the line to be measured will be marked as perpendicular.
Condition 1 : if cos ( θ ) > cos t θ / / cos ( θ ) < cos π t θ , L i is parallel . Condition 2 : if cos ( θ ) < sin t θ , L i is orthogonal . cos ( θ ) = v ref · v i v ref · v i
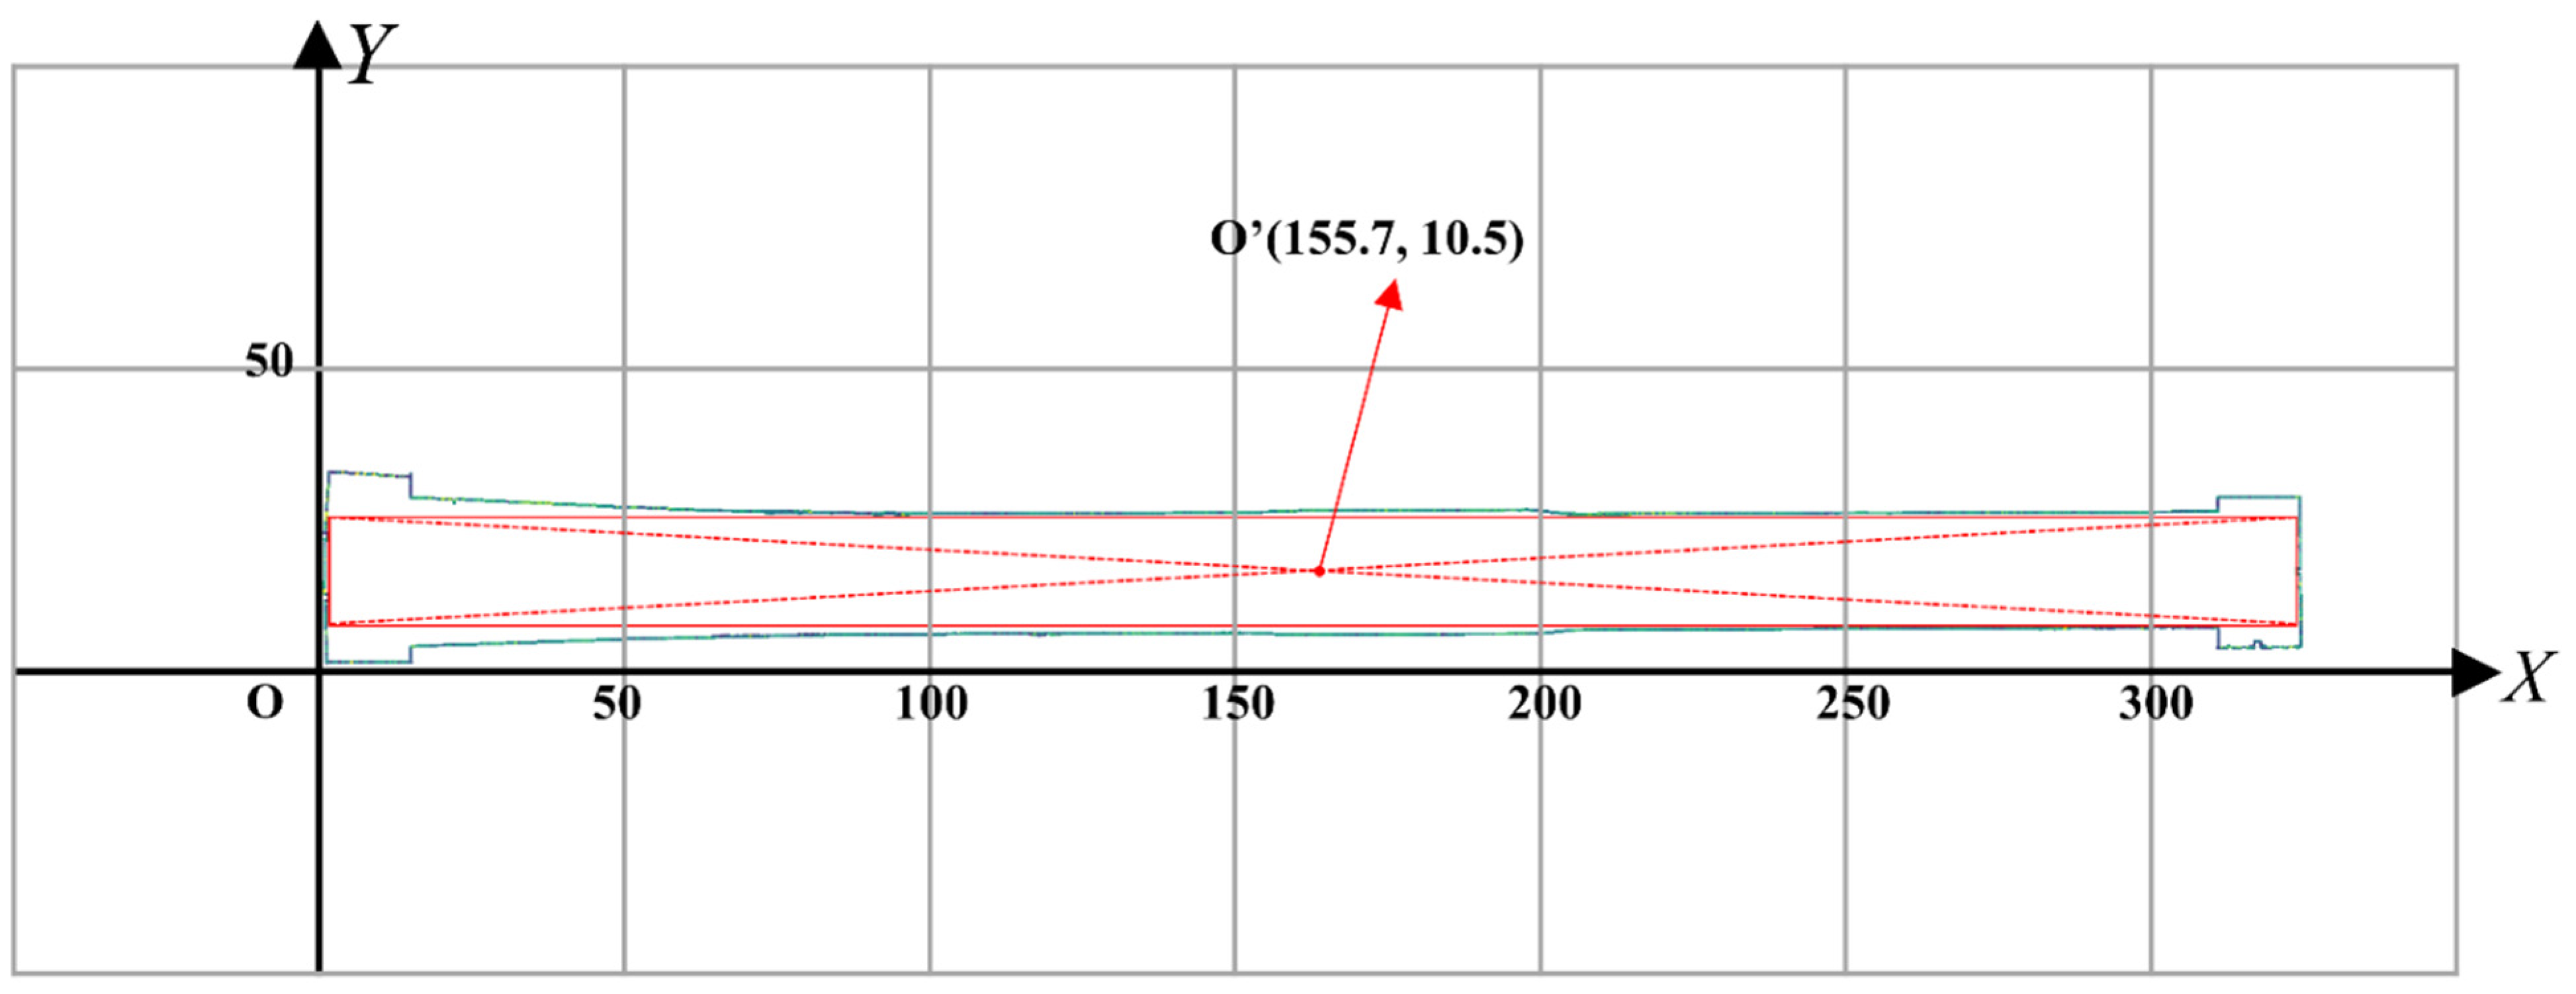
After regularization is completed, the remaining straight-line segments are extended to form a rectangle, and the geometric center and quadrant angle of the point cloud slices are calculated and used as a virtual grid to roughly match the BIM grid. The geometric center of the BIM grid is represented as p0x, αy, 0) and the quadrant angle is θ1; the point cloud center is represented as p1x, βy, 0) and the quadrant angle is θ2. Then, the point cloud is transformed into the predefined survey coordinate system in BIM by Equation (2). The coarse registration process is shown in Figure 3. After horizontal registration, the z-axis is adjusted according to the height of the top and bottom slabs.
M = T p 0 R z θ 2 θ 1 T p 1

3.2.2. Fine Registration between Point Cloud and BIM

After coarse registration, the point cloud model and BIM roughly overlap in the main direction. However, the registration accuracy still does not meet the requirements of geometric accuracy evaluation. Next, a trimmed iterative ICP algorithm based on the point-to-line distance is proposed for the fine registration between the point cloud sliced inner wall lines and the BIM inner wall lines. The “inner wall lines” refer to the projection of inner wall surfaces and inner surfaces of exterior walls in the XOY plane. In this study, the inner surfaces of exterior walls are used in most cases.
The PL-ICP algorithm uses the point-to-line distance as an error measure [38], and its objective function seeks to minimize the sum of squared distances between the target point and the line segment that connects two adjacent points, as shown in Figure 4. PL-ICP is a robust algorithm that can effectively eliminate the influence of outlier points on the matching results. In this study, the incorrectly located inner wall lines are considered outliers, and two strategies are used to locate the correctly constructed “inner wall lines”: (1) a distance threshold is set (r = 0.01 m) to eliminate the corresponding points with larger distances; and (2) a trimmed strategy [53]. In each iteration, we sort the distances of corresponding point pairs and select the top α (α = 80%) points for the next iteration. This robust strategy implicitly indicates that only the correct position construction is involved in the registration. The distance measurement used by the PL-ICP is a point-to-line distance and the distance r is calculated using Equation (3) as follows:
r i = r ( T k p i ,   p i ) = T k p i p i n i 2
where Tk = R k t k 0 0 , pi is the 3D coordinate of the target point of the design model, pi′ is the midpoint of the line connecting the two nearest target points in the point cloud, and ni is the normal vector of pi′.
After the transformation matrix Tk is obtained using the PL-ICP algorithm, a coordinate transformation is performed on the coarse matching point cloud using transformation matrix Tk. Note that if the coarse registration step is omitted, it may lead to an upside-down situation in the point cloud registration [54]. Through the above steps, the registration of the point cloud with BIM is finally achieved.

3.3. Subway Station Structure Element Extraction

The scanning area of a subway station is large, and the input data always consist of hundreds of millions of points [46]. Data preprocessing is particularly important to avoid a computational burden caused by data overload. The finely registered 3D point cloud model is voxelized and down-sampled. If there are discrete points in the voxel, the set of points within the voxel is replaced by the center coordinates Vi of that voxel. After all the voxels are searched, the down-sampled point cloud model P′ is derived. Subsequently, element extraction is performed on the point cloud model P′ to obtain the facade, slab, and structural column information.
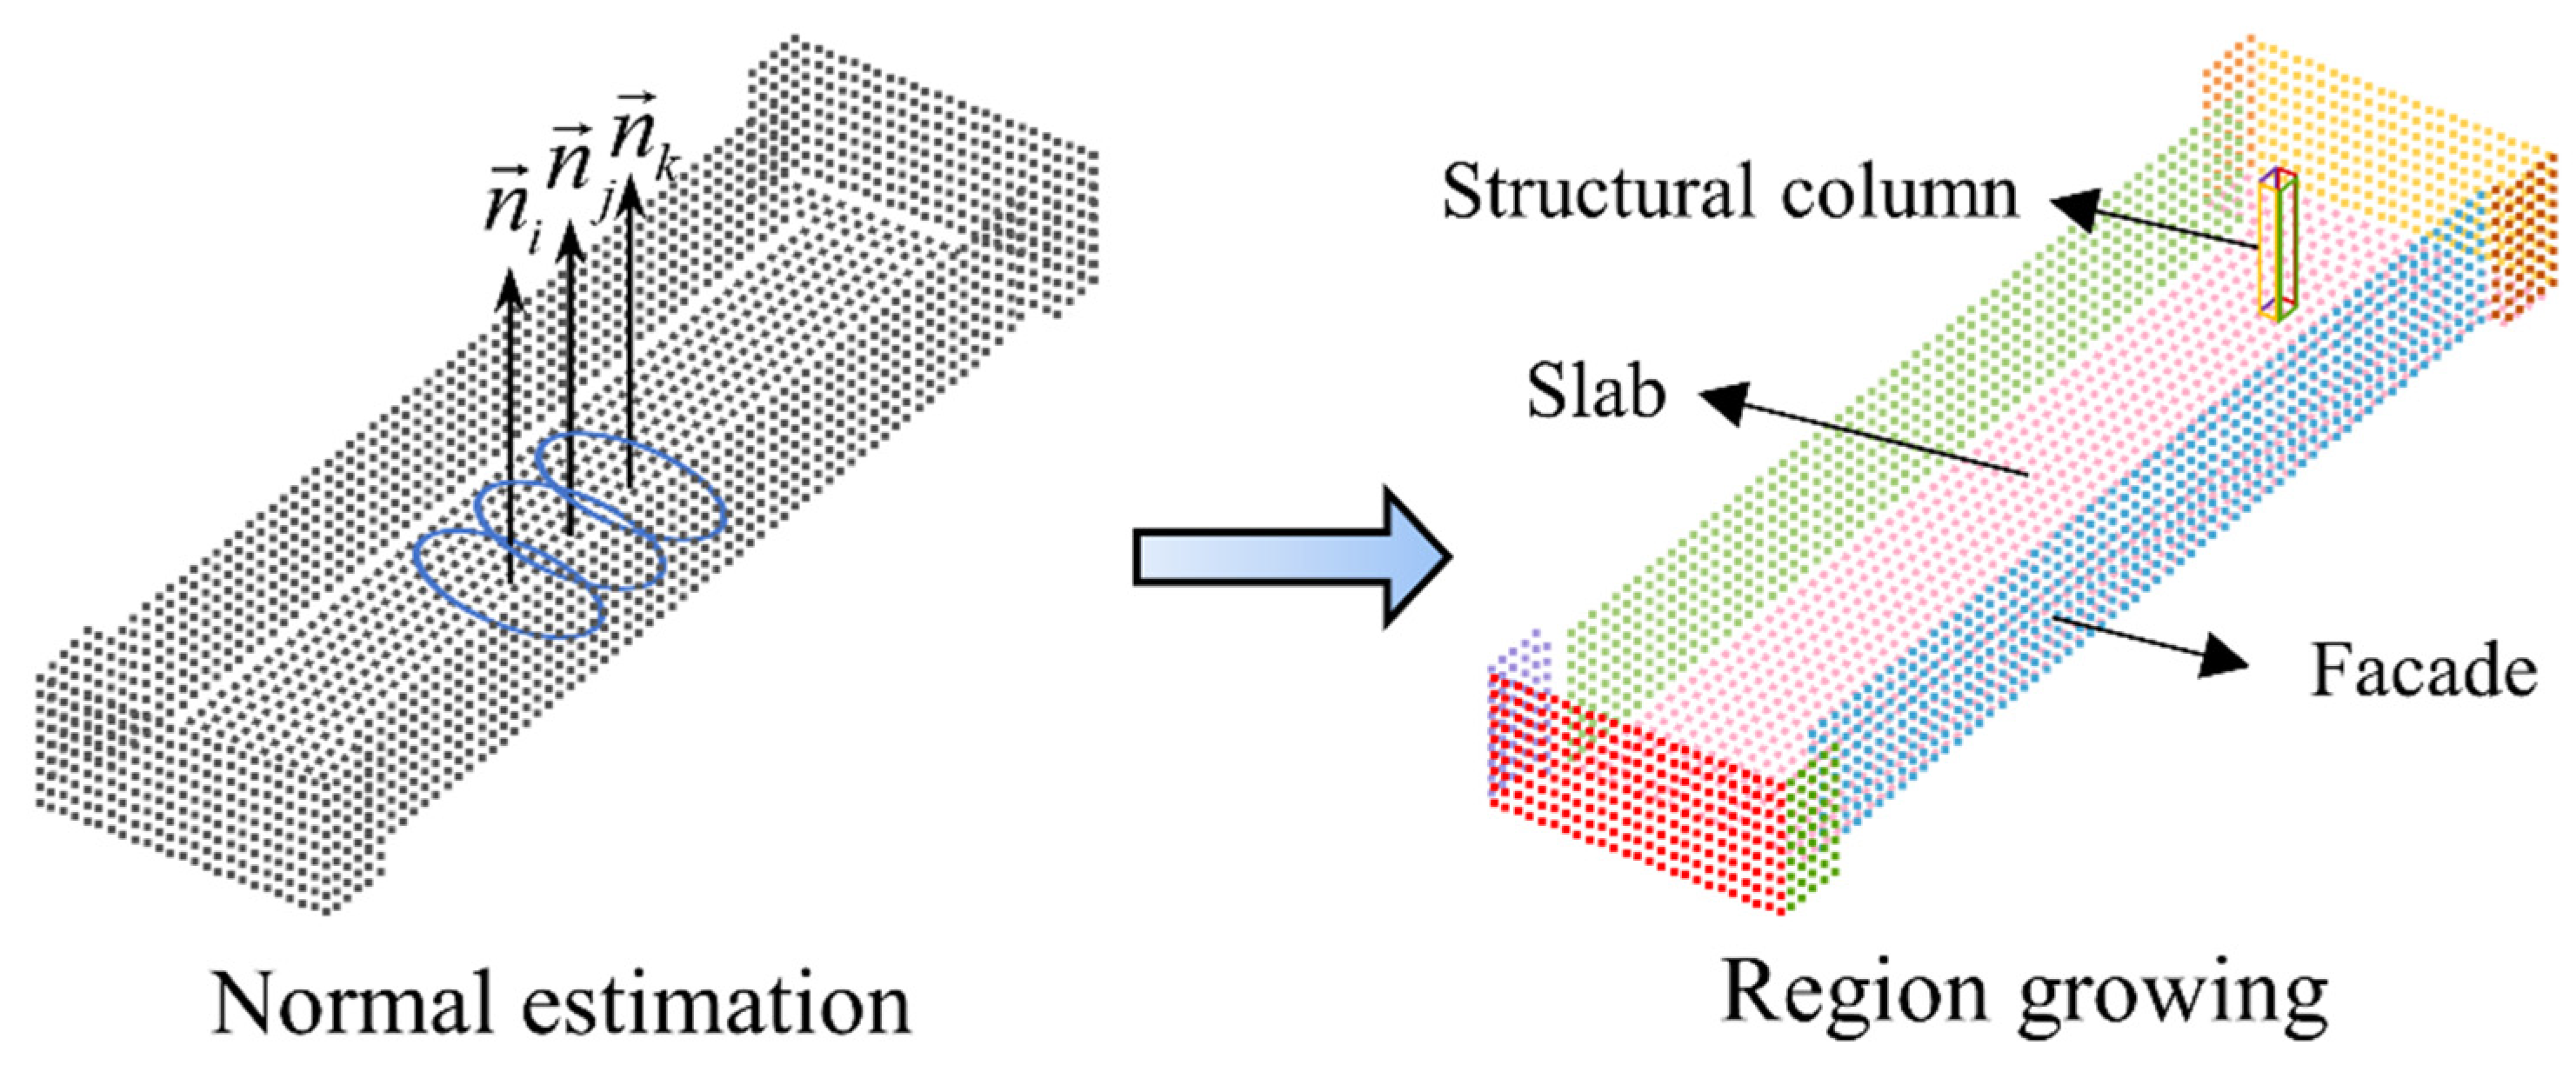
Element extraction is the process of labeling unstructured measurements in a point cloud and extracting structured information [55]. Over-segmentation can be avoided using a smoothness constraint-based segmentation method [56], which is achieved through the following two steps: (1) Normal estimation: a k-dimensional (KD) tree is constructed for the point cloud by searching the K nearest neighbors of each point, and least-squares fitting is applied to the points in the neighborhood to obtain the best-fit plane. The normal vector of each point is calculated and the residual values are used to detect regions with large curvature variations. (2) Region growth selects the point with the smallest residual as the initial seed. The points in the nearest neighbor that meet the angle threshold θth are marked as the current region, and the points that meet the residual threshold rth are marked as the candidate seed points. After the search of all the nearest neighbors is completed, the next available seed is accessed from the list of candidate seed queues, and the above operation is repeated until all points are labeled. A region growth of subway station structure element extraction is shown in Figure 5, where n i , n j , and n k are the normal vector of each initial seed, and different structure surfaces, i.e., facades, slabs, and structural columns, are extracted using the region growing algorithm. Moreover, the surfaces of different structures are shown in different colors.

3.4. Geometric Accuracy Evaluation Index

3.4.1. Surface Accuracy Evaluation

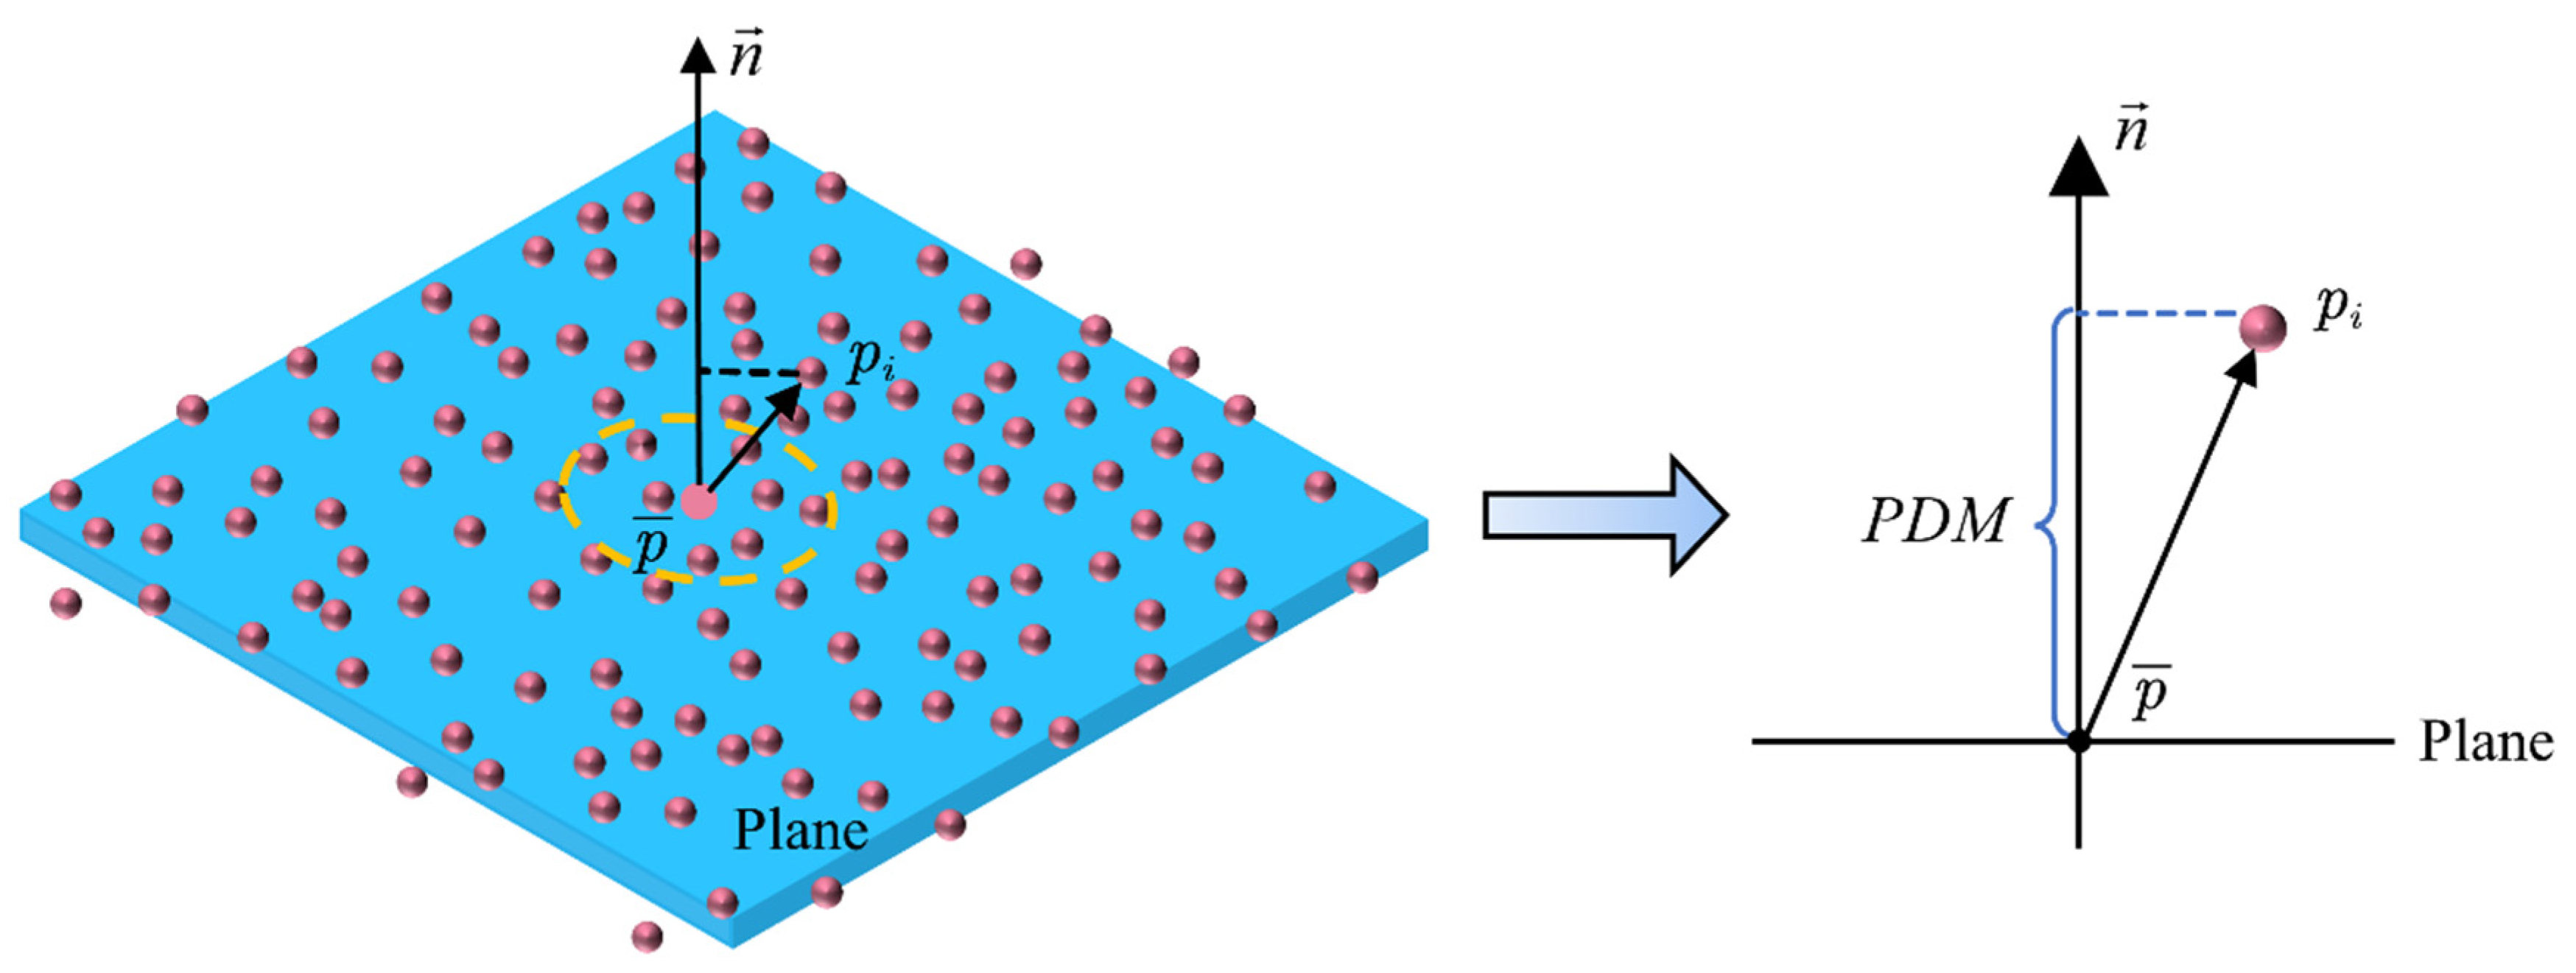
Once the structural elements are extracted, a plane discrepancy metric (PDM) is used to calculate the surface error as shown in Figure 6, where the blue plane represents the surface in BIM and the point cloud is uniformly distributed on the surface, represented by pink points. The target point p ¯ is selected randomly on the BIM surface, and the normal vector n is calculated. Then, the nearest point p i is selected as the target point, the direction vector between the nearest point p i and the target point p iscalculated, and the PDM is defined as the projection of the direction vector on the normal vector. The direction vector is compared with the direction of the normal vector, and if the two vectors have the same direction, the distance error value is positive; otherwise, the distance error value is negative.
P D M = n p i p ¯

3.4.2. Structural Column Accuracy Evaluation

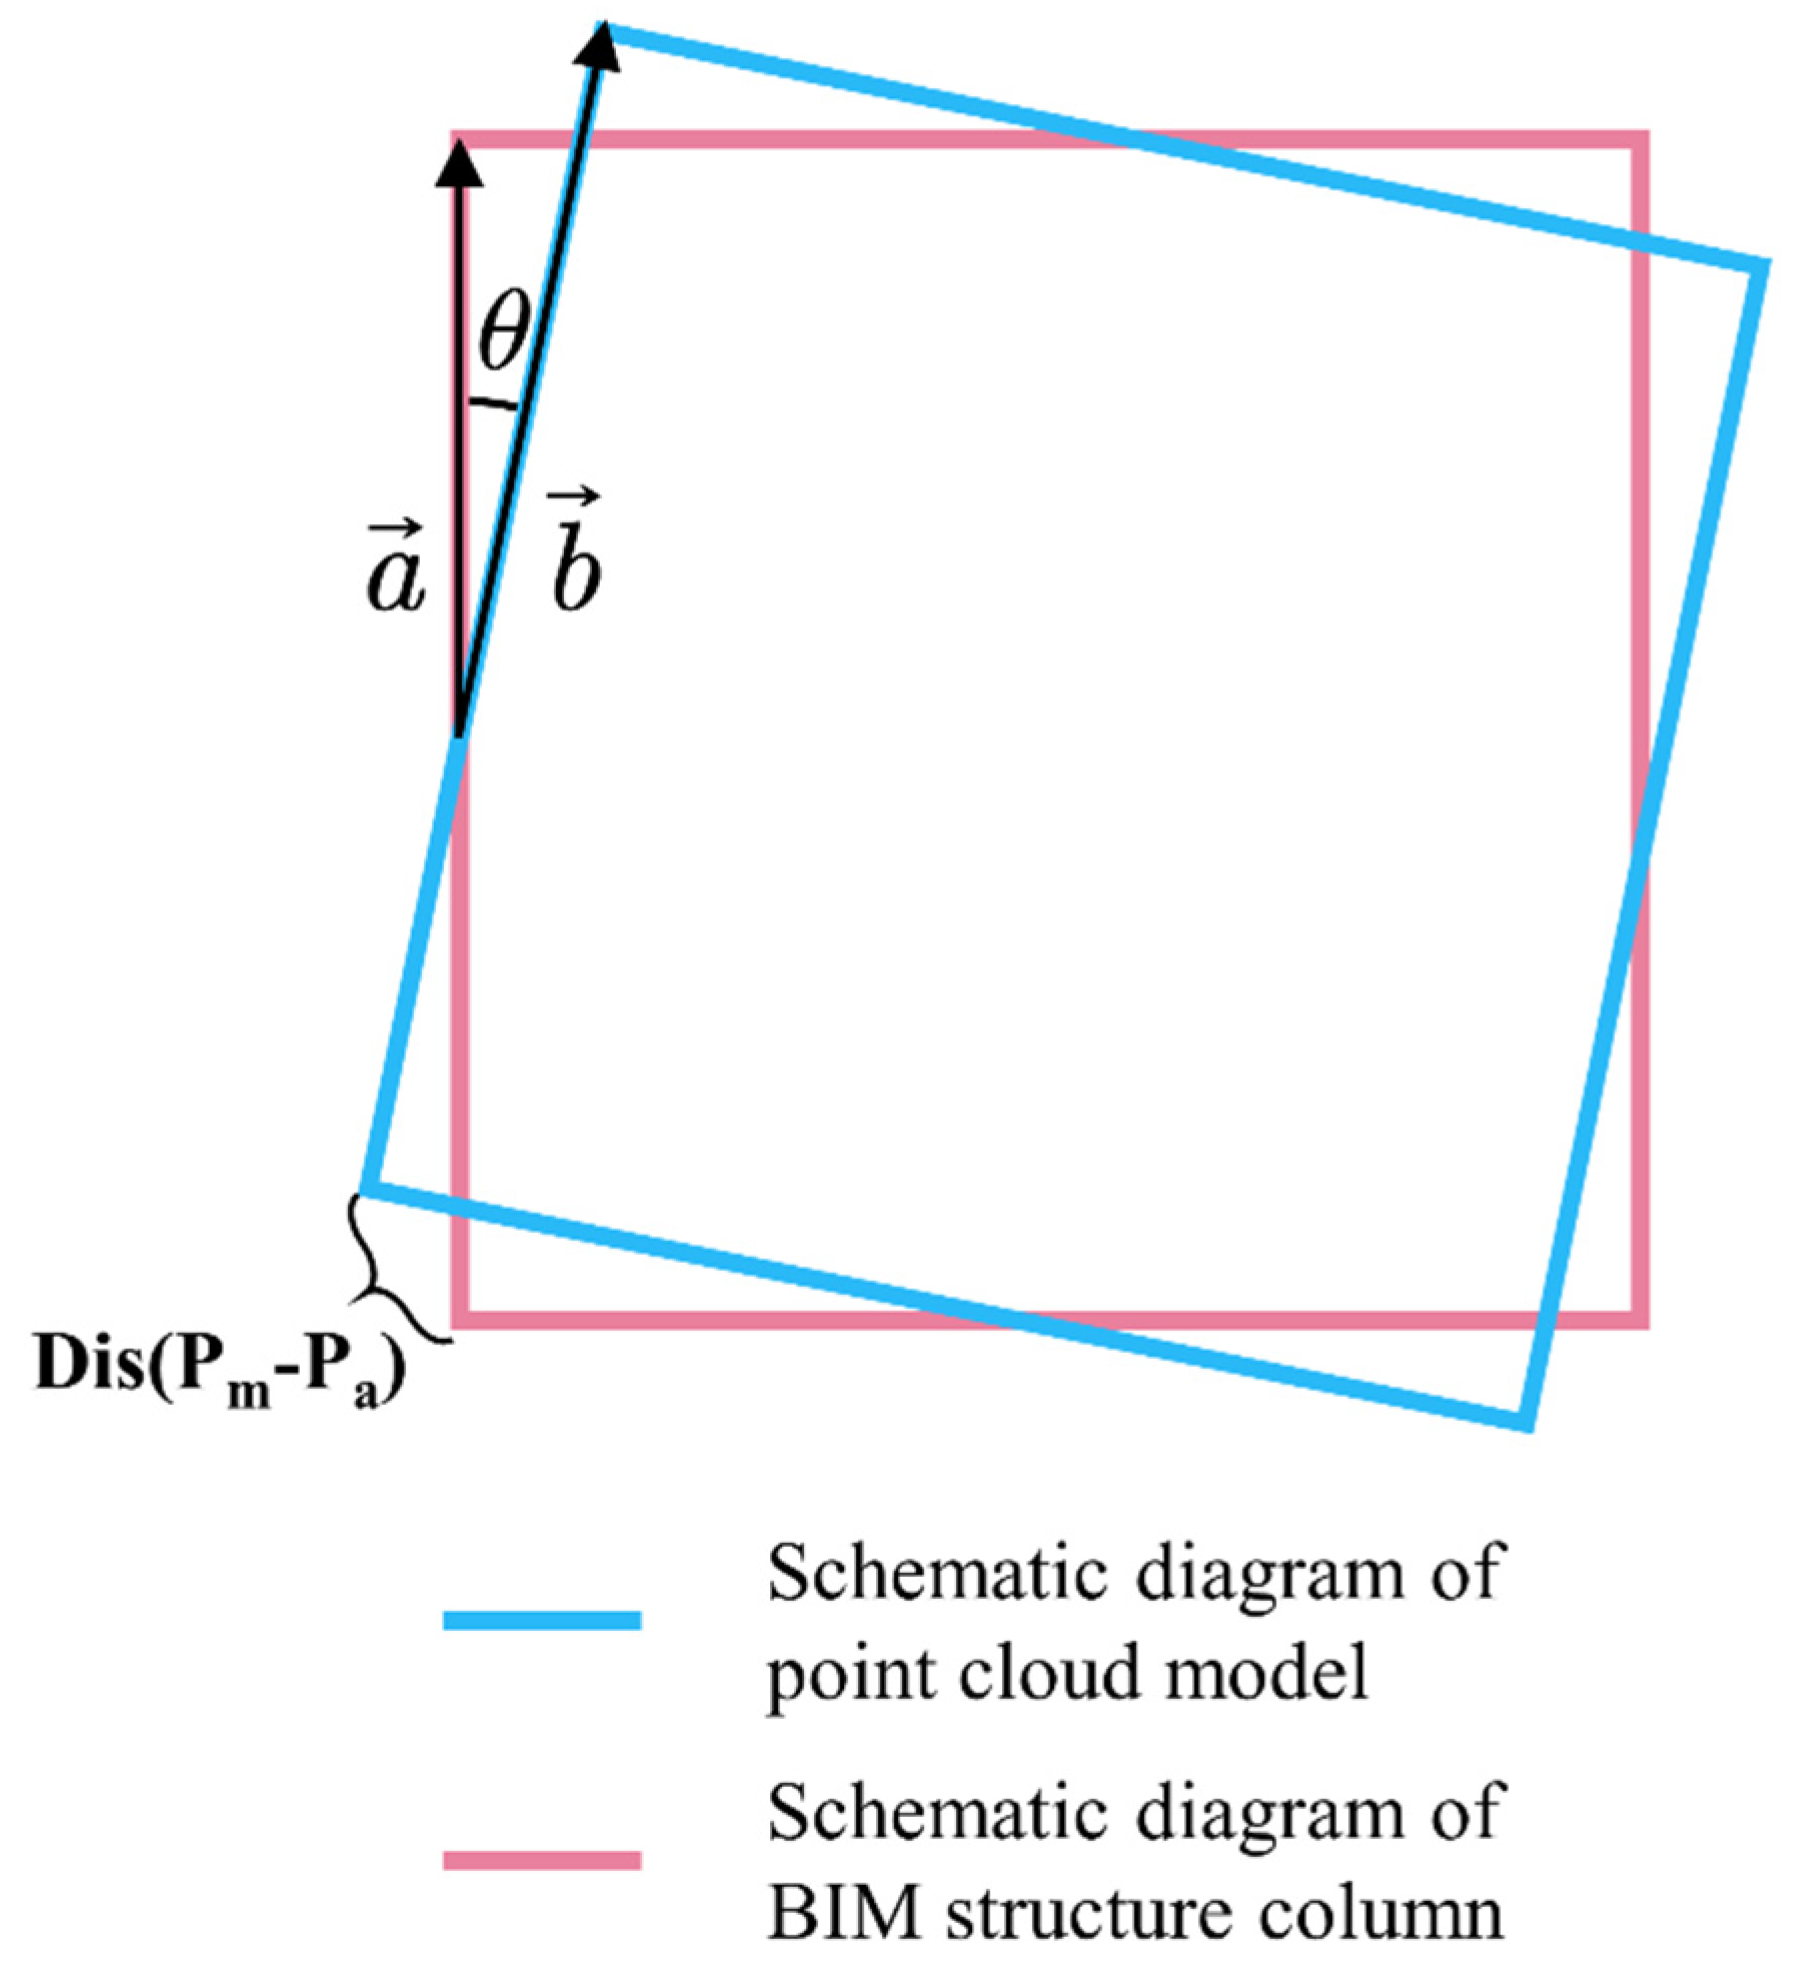
The accuracy of the generated structural column planes is quantitatively assessed using two metrics: the structural column discrepancy metric (SCDM) and the angular distance deviation (ADD). Similar to other studies [52,57], the SCDM is used to calculate the differences in the relative positions of the structural columns and the Euclidean distances of all point pairs for the structural columns, where Pm is the true coordinates of the structural column corner points and Pa is the measured coordinates of the same corner point after registration. The ADD is used to reflect the deviation of the angle between the corner points of the structure columns, defined as the angular distance between the corner points of the wall and the referenced column in BIM. As shown in Figure 7, the result of coarse registration is represented by the superposition of two boxes; the blue box and red box represent BIM and point cloud, respectively.
S C D M = d i s P m P a
A D D = arccos a , b = arccos a b a b

3.4.3. Statistical Analysis and Visualization of Deviation Results

Due to the unavoidable occlusion of the construction site, the corresponding scan data are missing in some areas. In the subsequent calculation, the deviation values in the invisible region are defined as infinity and eliminated in this study, and the deviation chromatogram is generated for visualization. The deviation distances are shown in different colors. Specifically, positive values are indicated in red, and negative values are indicated in blue. The deviation magnitude is reflected by color shades, and a cutoff distance is defined as a limitation to the maximum deviation value of each surface.
Additionally, the results are shown in statistical histograms according to different surface deviations, and the distance deviations are usually characterized by a peak distribution. Using Gaussian fitting of the deviation distances, peak distributions with different means and standard deviations are obtained. If the geometric accuracy condition is good, the bandwidth of the peak distribution is narrow, and the peaks are basically symmetrical on both sides; in contrast, if the bandwidth of the peak distribution is wide, and the peak is offset to the center, and multiple peaks may even appear. If there are multiple peaks, then intercept the plane with higher flatness and calculate the distance between the elevation and the fitted plane to detect the area where the tolerance is over limit. According to the deviation distribution of the deviation chromatogram, the over-limit area with large deviations is located.

4. Case Study

To verify the feasibility of laser scanning-based technology for the geometric accuracy evaluation of subway stations, we applied the proposed method to evaluate the geometric accuracy of the Hongqi Road subway station. The Hongqi Road Station is the eighth station in the Suzhou Subway Line S1, it has an east–west layout and is located on the west side of the intersection of Qianjin West Road, as shown in Figure 8. The main body of the station is an underground two-story single-column, double-span closed frame structure constructed by the open excavation method. It has a length of 313.6 m, a width of 32.2 m, and a bottom slab burial depth of approximately 16.6 m.

4.1. Construction Site Data Collection and Preprocessing

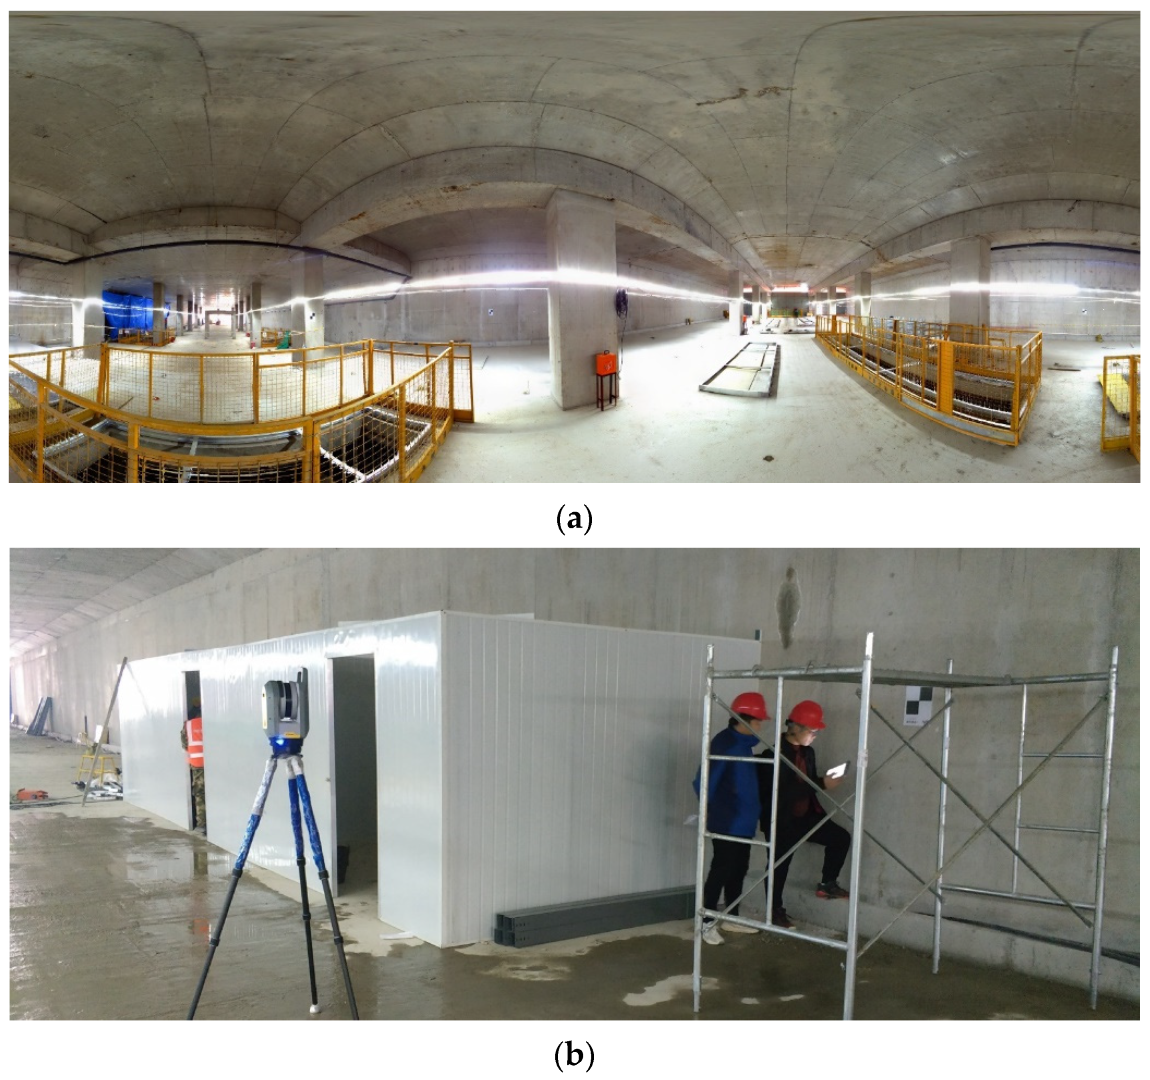
According to the technical requirements of the specification in [58], we used a Trimble TX8 scanner to perform 3D laser scanning of the Hongqi Road construction site. A checkerboard target with height flush was used during the measurement. A measuring station was set up every 25–30 m, making a total of 85 stations. The scanner has a scanning speed of 1 million points per second and takes approximately 3 min per scan. A total station was also used to conduct control measurements and establish a survey control network. The point cloud was automatically registered using Trimble RealWork v11.2 software, and all points containing x, y, and z coordinate information were exported as input data. Figure 9 shows a panoramic view of the subway station construction site and the acquisition process.
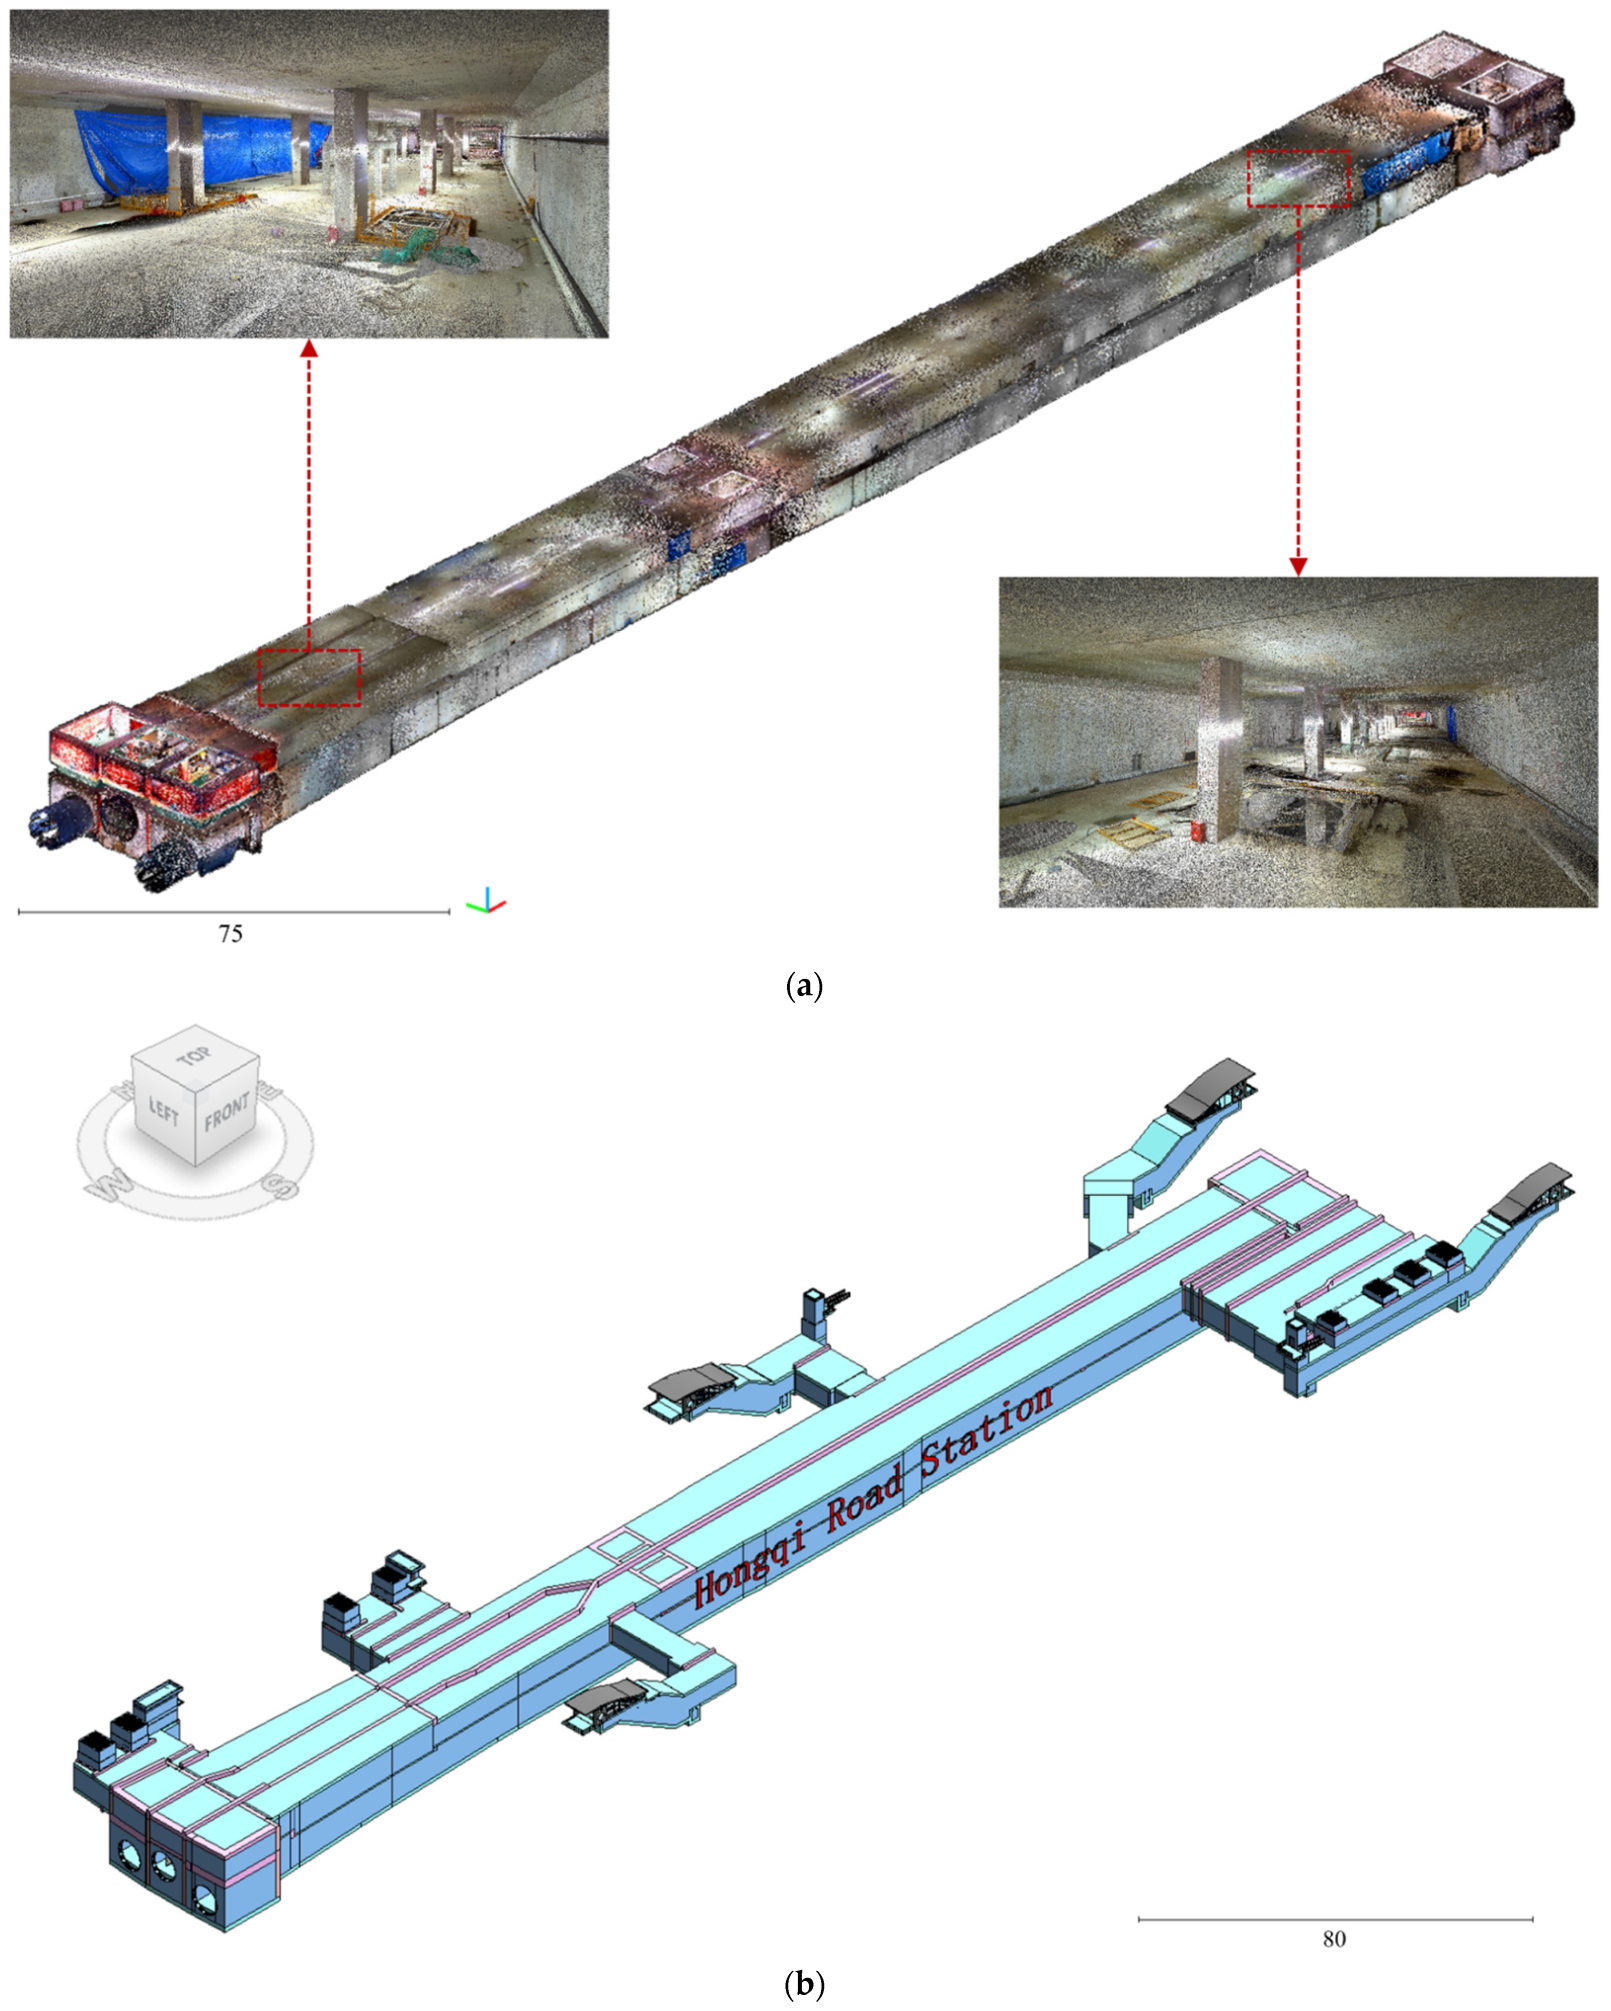
The 3D scene of the subway station after point cloud registration is shown in Figure 10a. The measured data include a total of 1.10 × 10⁸ points, and the average density of the point cloud is 5316 pts/m2, which includes richly detailed characteristics and clearly shows the internal components. The data show that the density of the point cloud data of the subway station is high enough to accurately represent the geometric information of each facade, slab, and structural column in the subway station. Figure 10b shows the BIM model of the subway station. The BIM is created in the design stage, and the interior of the model includes some typical structures, i.e., facades, slabs (top and bottom slabs), and structural columns.

4.2. Point Cloud and BIM Registration

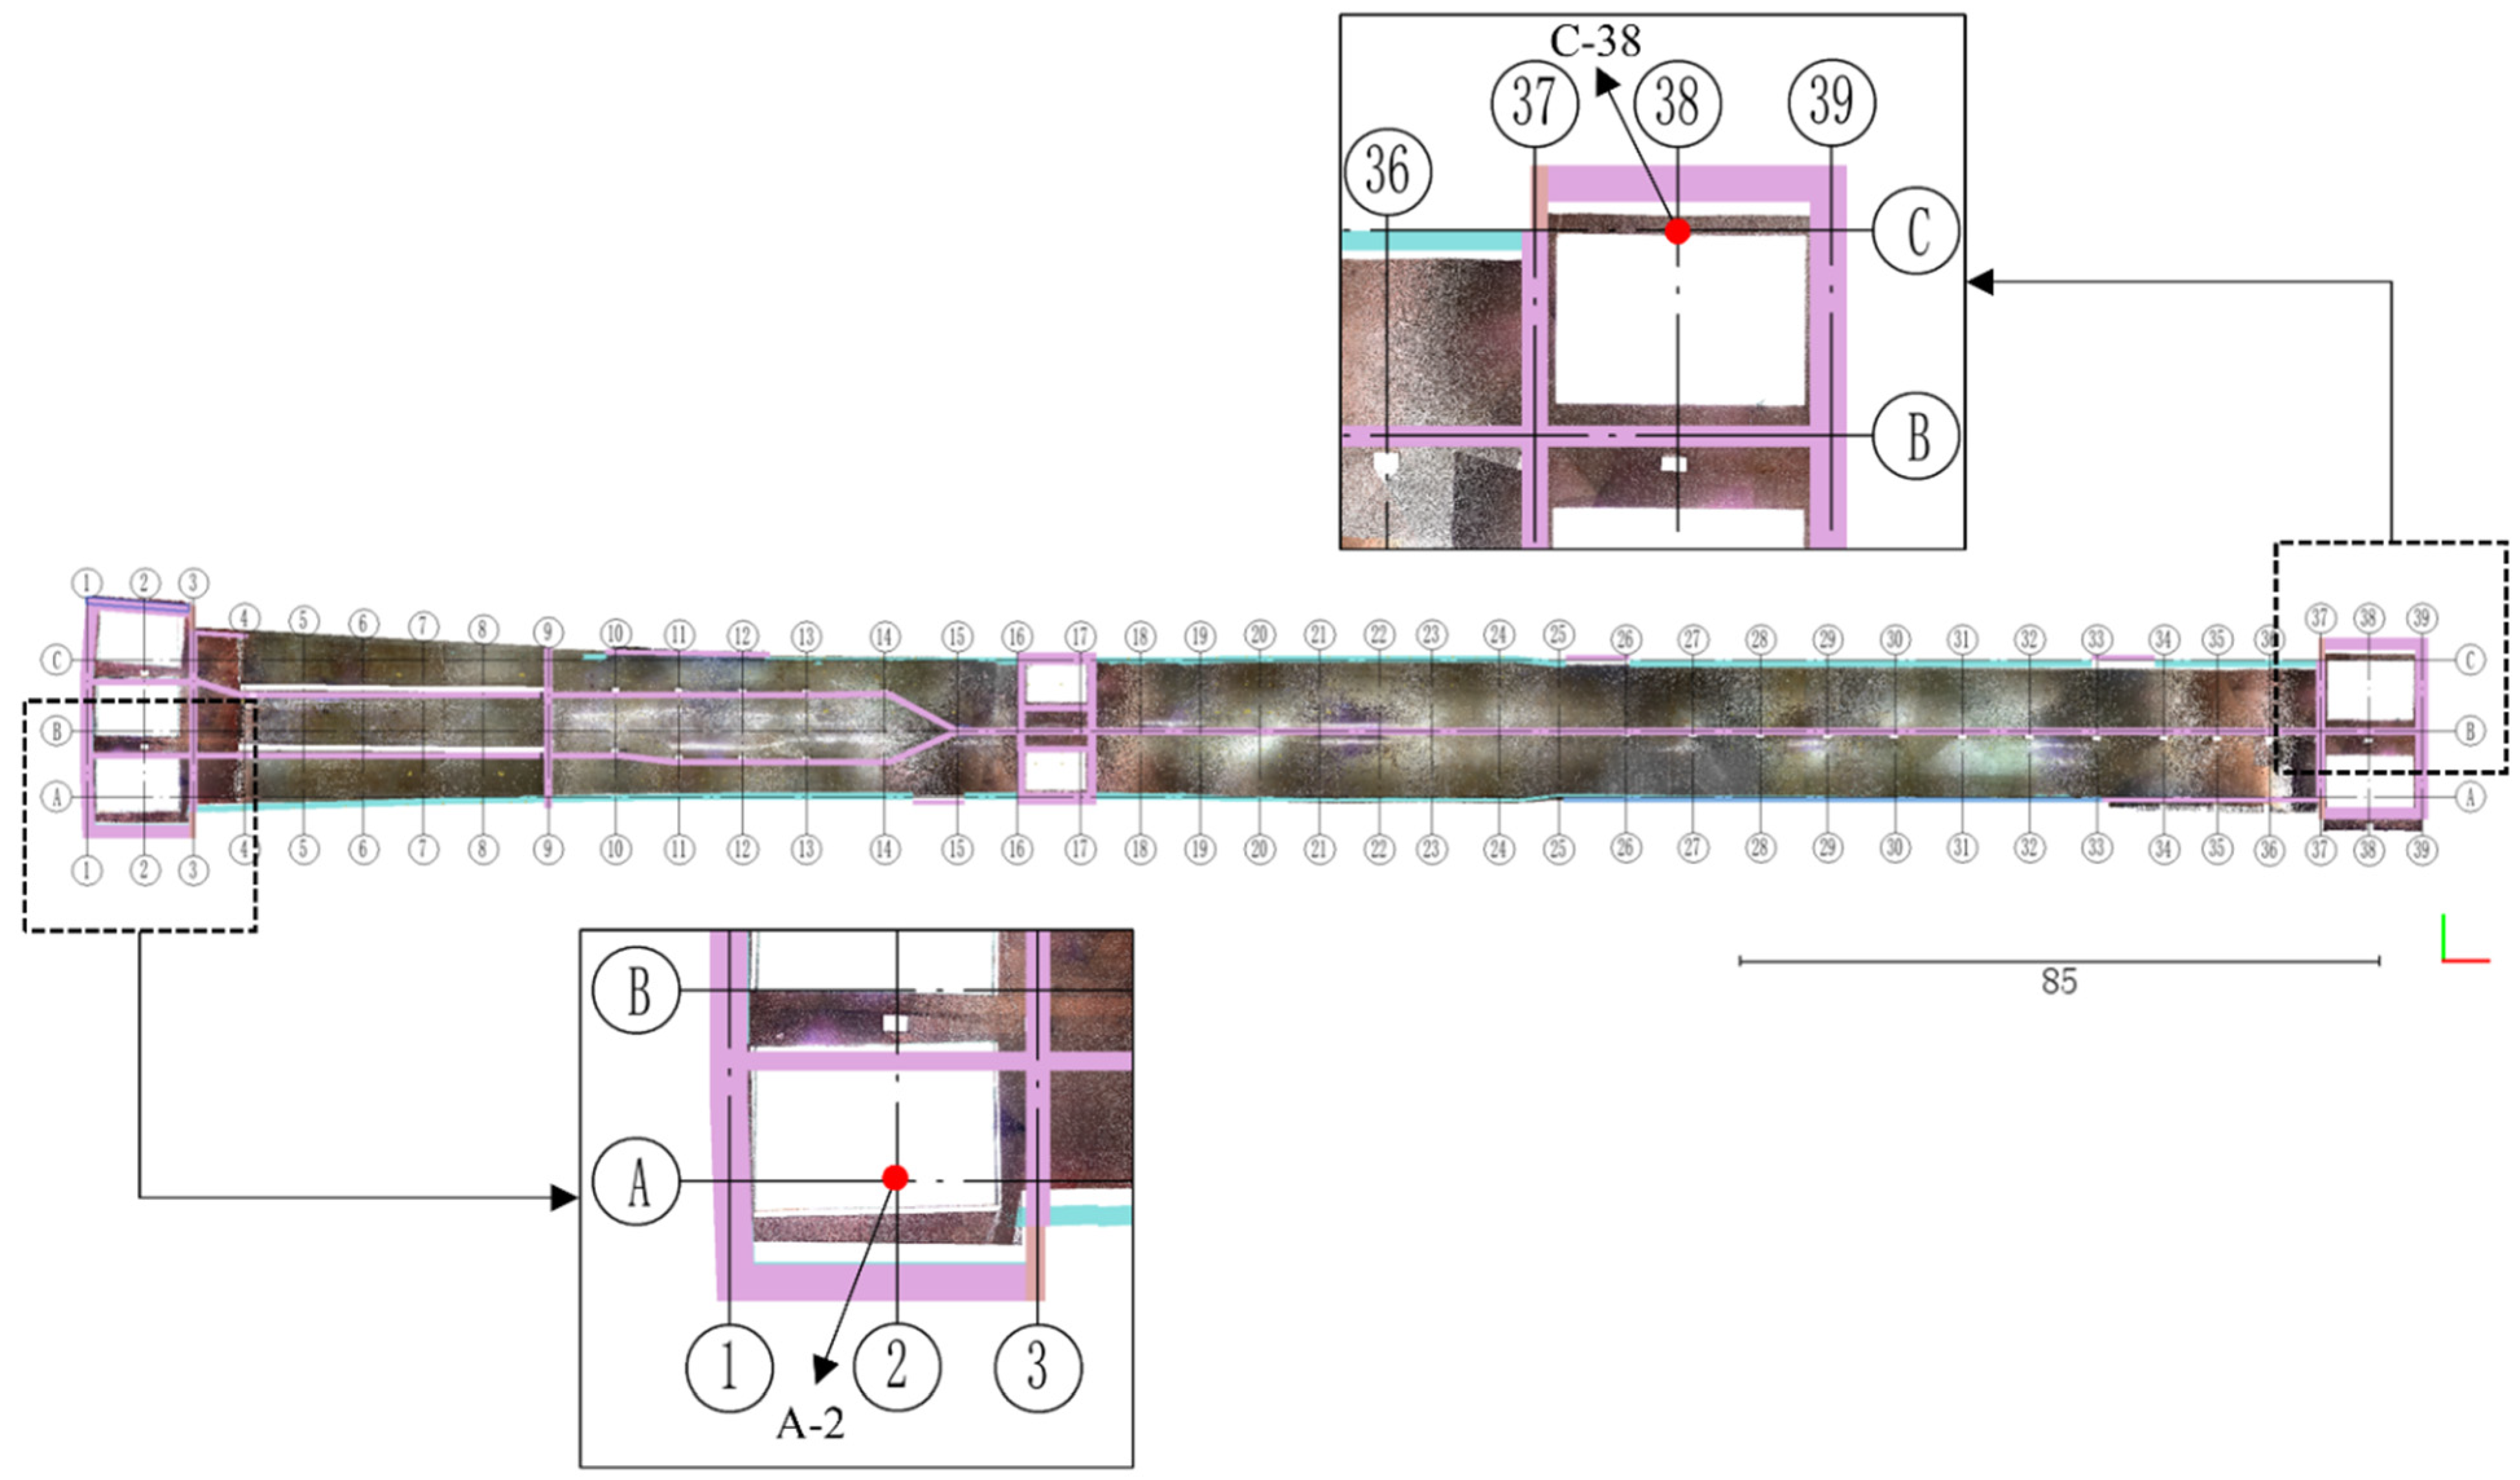
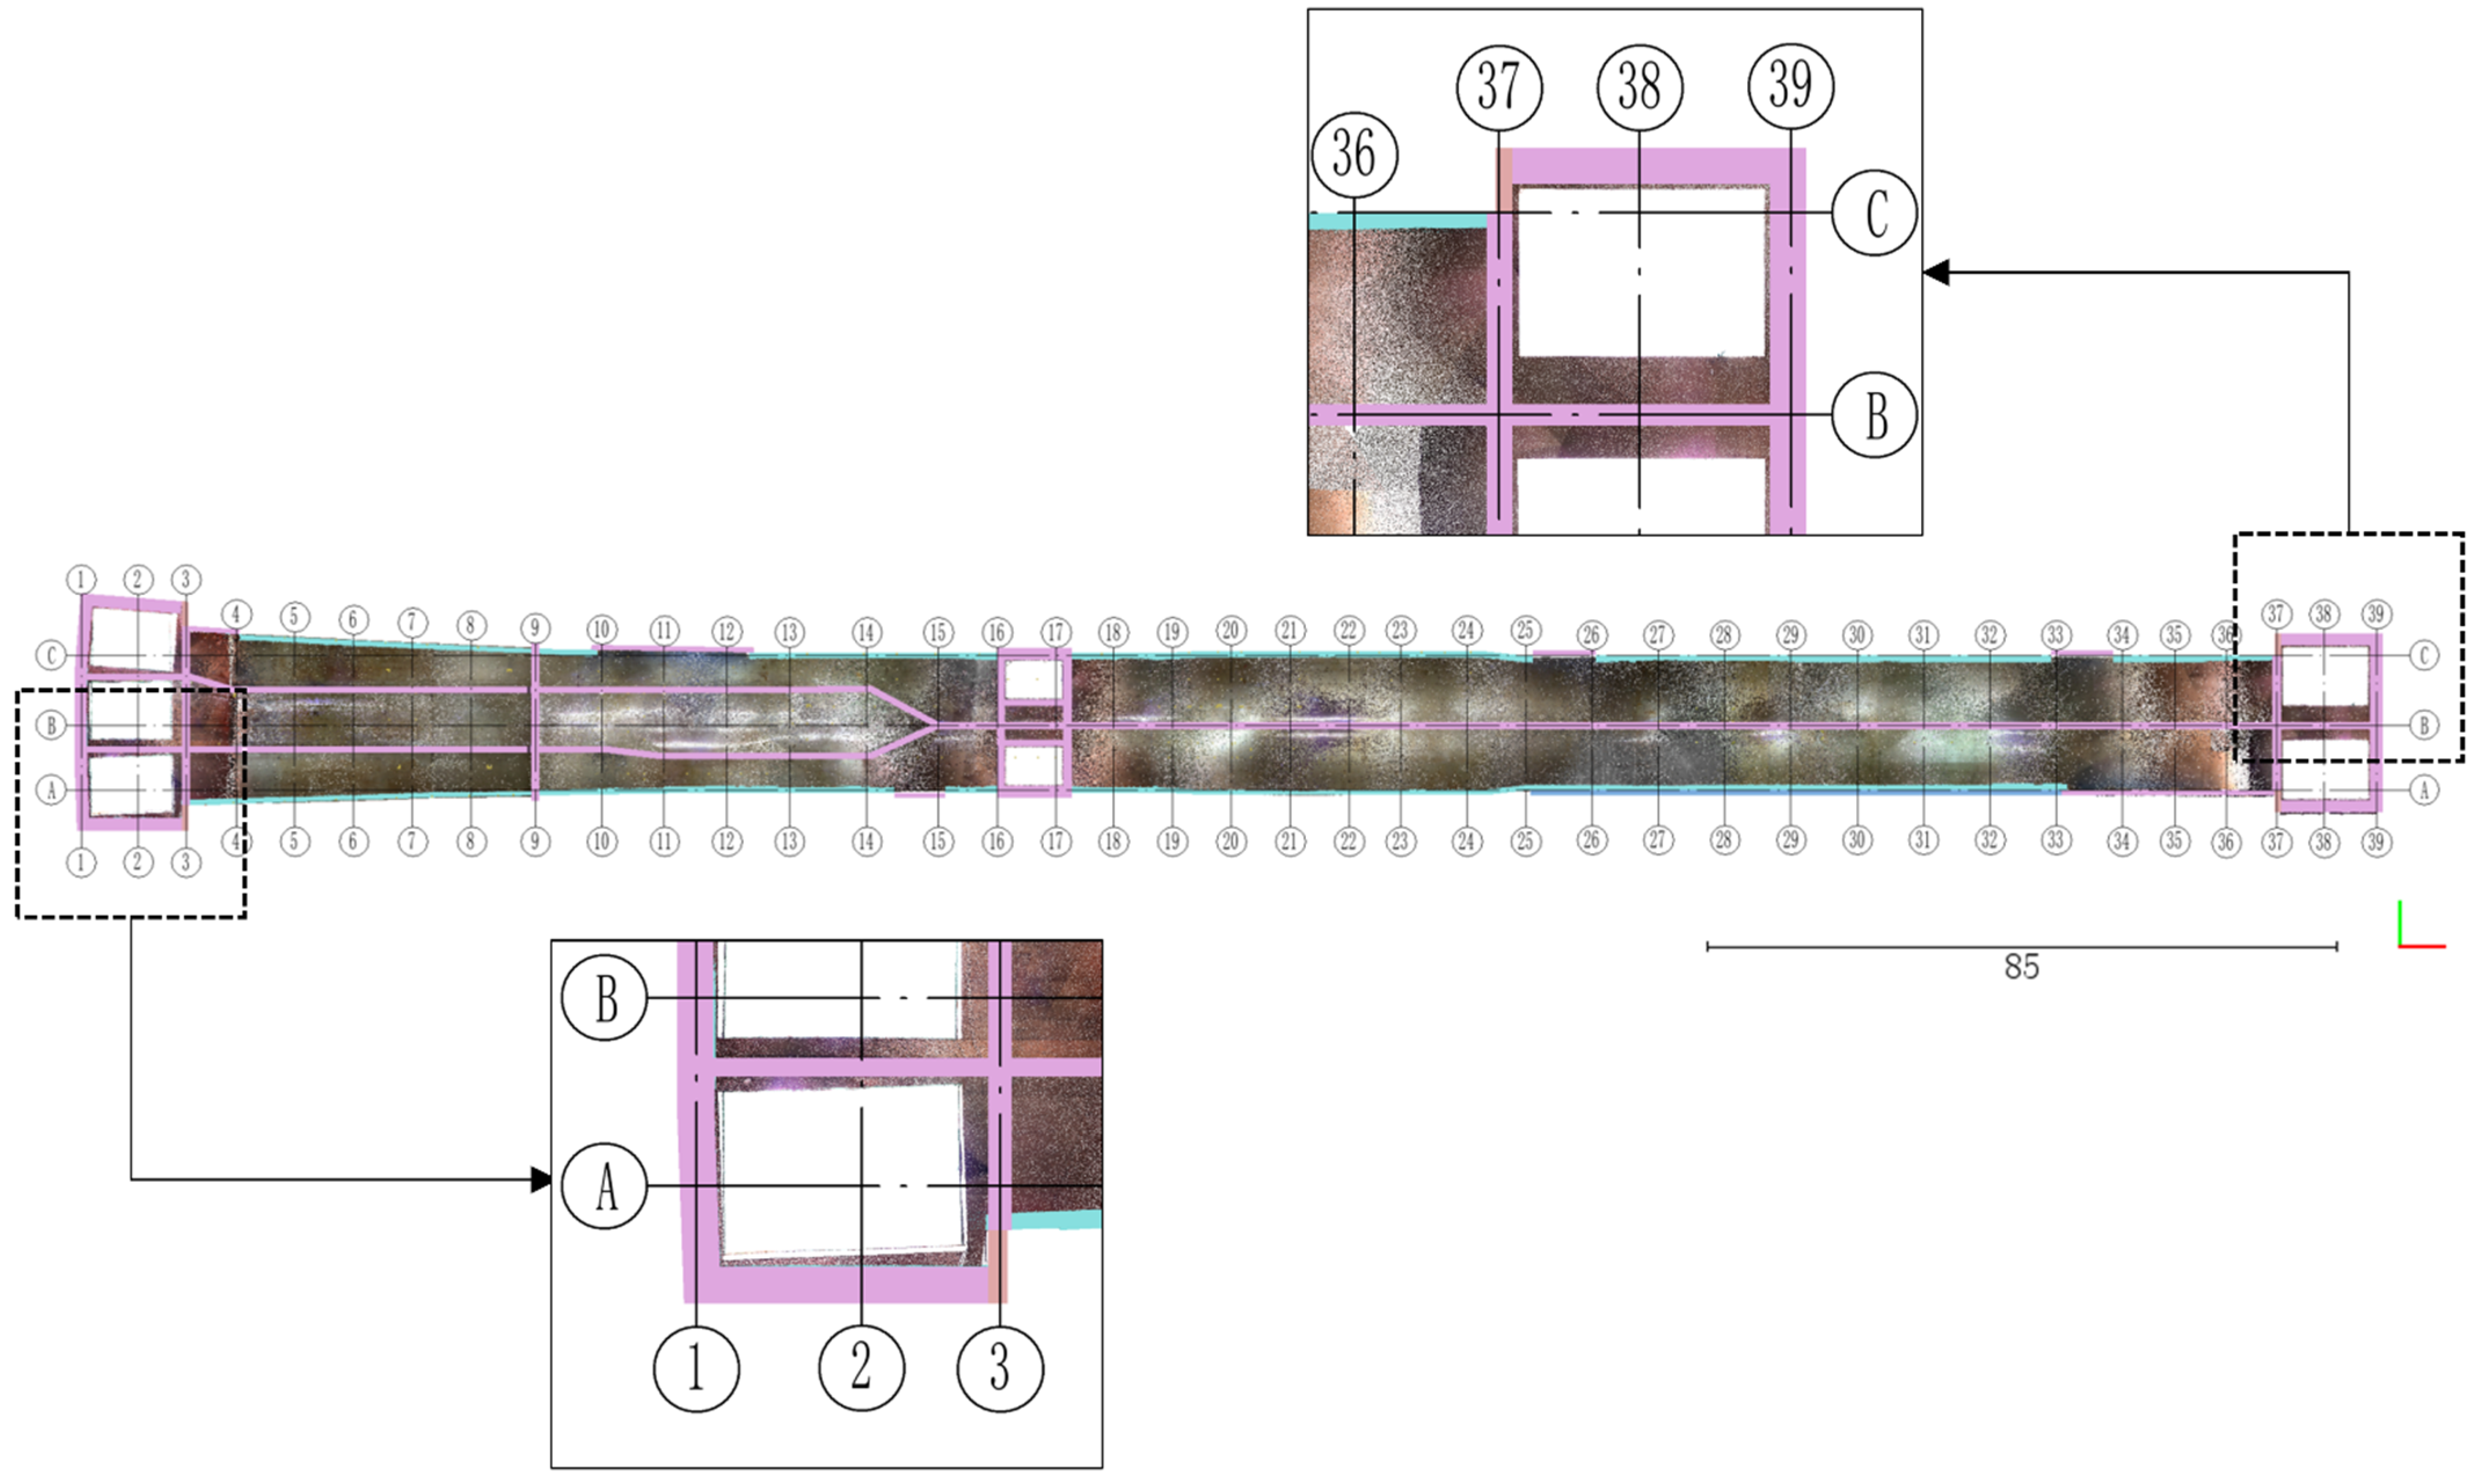
To achieve the coordinate registration of the two models and obtain transformation matrix M1, the rigid transformation is calculated based on the poses of the BIM grid center and the virtual grid center. Figure 11 shows the registration result of the point cloud slice and the BIM grid, resulting in the approximate alignment of the BIM with the point cloud model. However, it is challenging to meet the evaluation requirements of geometric accuracy. Figure 12 (enlarged area) shows that there are still obvious gaps in the areas on both sides of the subway station (A-2 and C-38). Therefore, fine registration is used to further improve the registration accuracy. The inner wall lines are extracted from the BIM, and the transformation matrix M2 is obtained after the point cloud is finely registered with the inner wall lines using the PL-ICP method. The initial point cloud coordinate is transformed using M = M 2 M 1 to obtain the final point cloud model. The inverse transformation of the aforesaid transformation is the coordinate transformation from the BIM to the point cloud model. Figure 13 shows the result of fine registration from the point cloud model to the BIM. The average deviation value is 17.8 ± 0.94 mm, and the fine registration result distributes the deviation evenly on the inner wall lines. The coarse-to-fine registration of the point cloud achieves centimeter-level registration accuracy, which provides reliable results for further geometric accuracy evaluation.

4.3. Point Cloud Structure Element Extraction

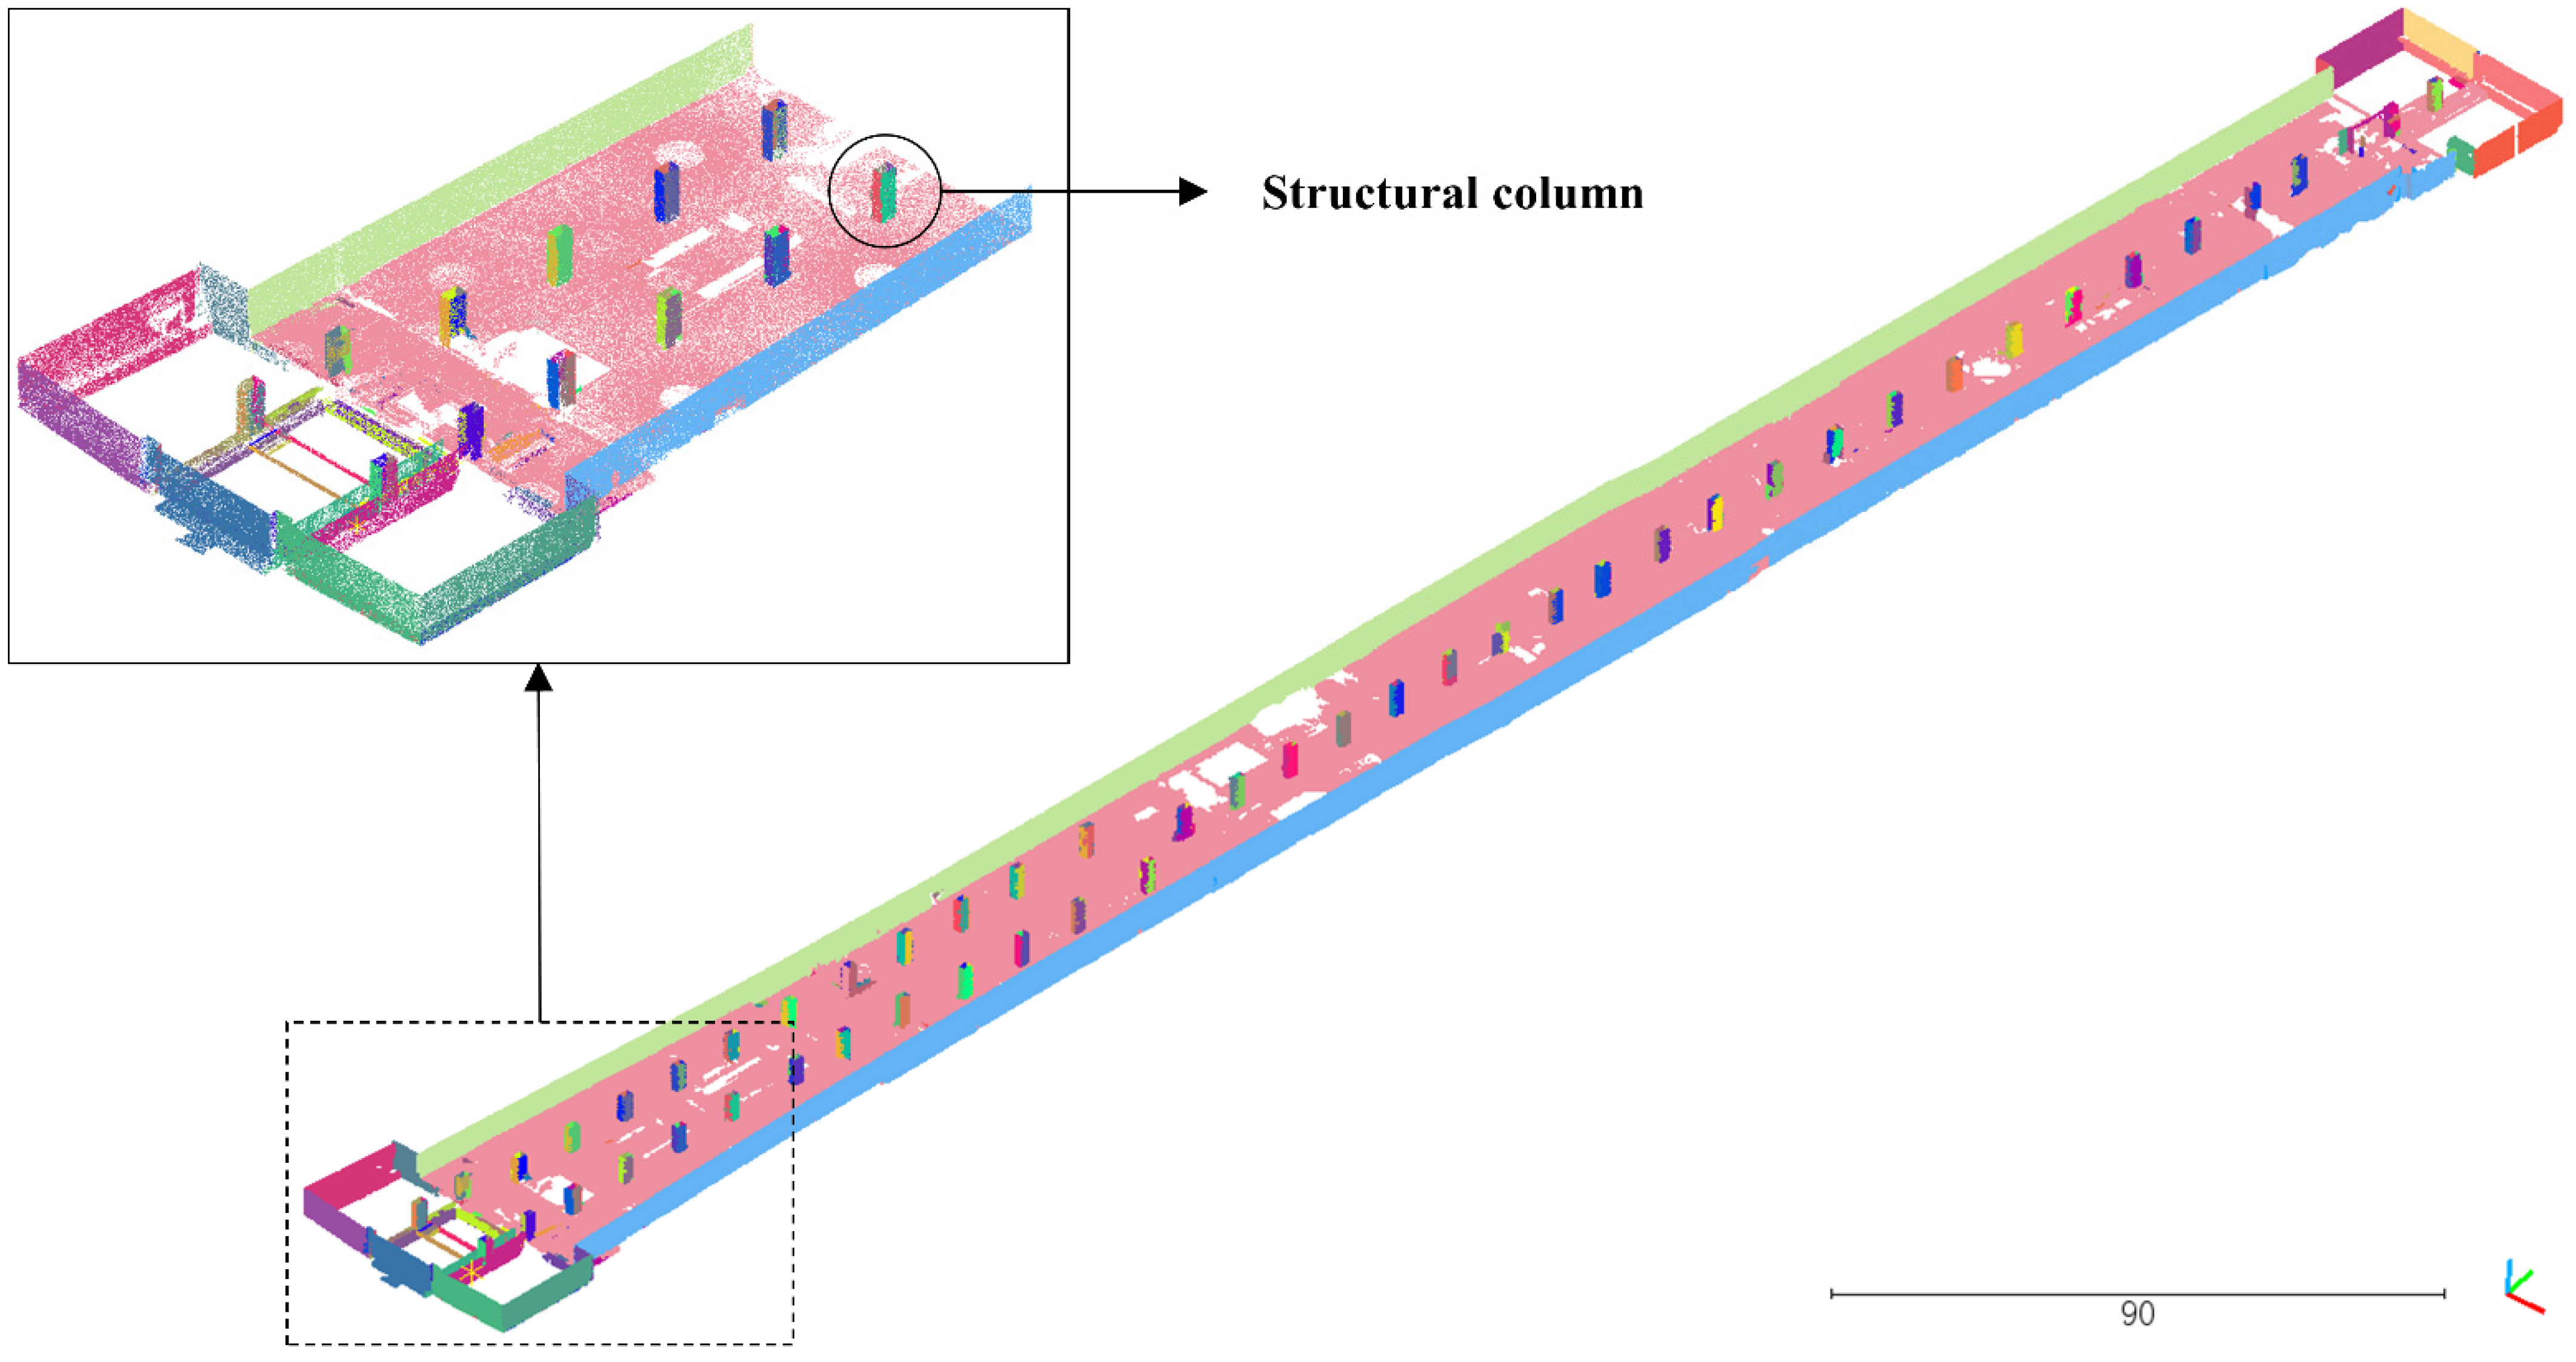
To evaluate the geometric accuracy of each surface and structural column, structural element extraction from subway station point cloud data is needed. A spatial octree is established for voxel down-sampling of the point cloud data. The structural elements of the subway station are extracted after region growth. The angle threshold θth is set to 15° and 30 nearest neighbors were used (k = 30); the residual threshold rth is calculated by the 98th percentile of the plane fitting residuals. The results of the structural element extraction of the subway station are shown in Figure 14, where each surface is distinguished by a different color, and corresponding features of the interior of the station are obtained, including 4 facades, 2 slabs, and 50 structural columns. Table 1 shows the results of the quantitative analysis of the structural elements of the point cloud; the point cloud is dense enough to accurately display the geometric characteristics of the components. Then, all the structural elements extracted are evaluated in order according to the method proposed in this paper.

4.4. Surface Accuracy Evaluation

4.4.1. Facade Evaluation

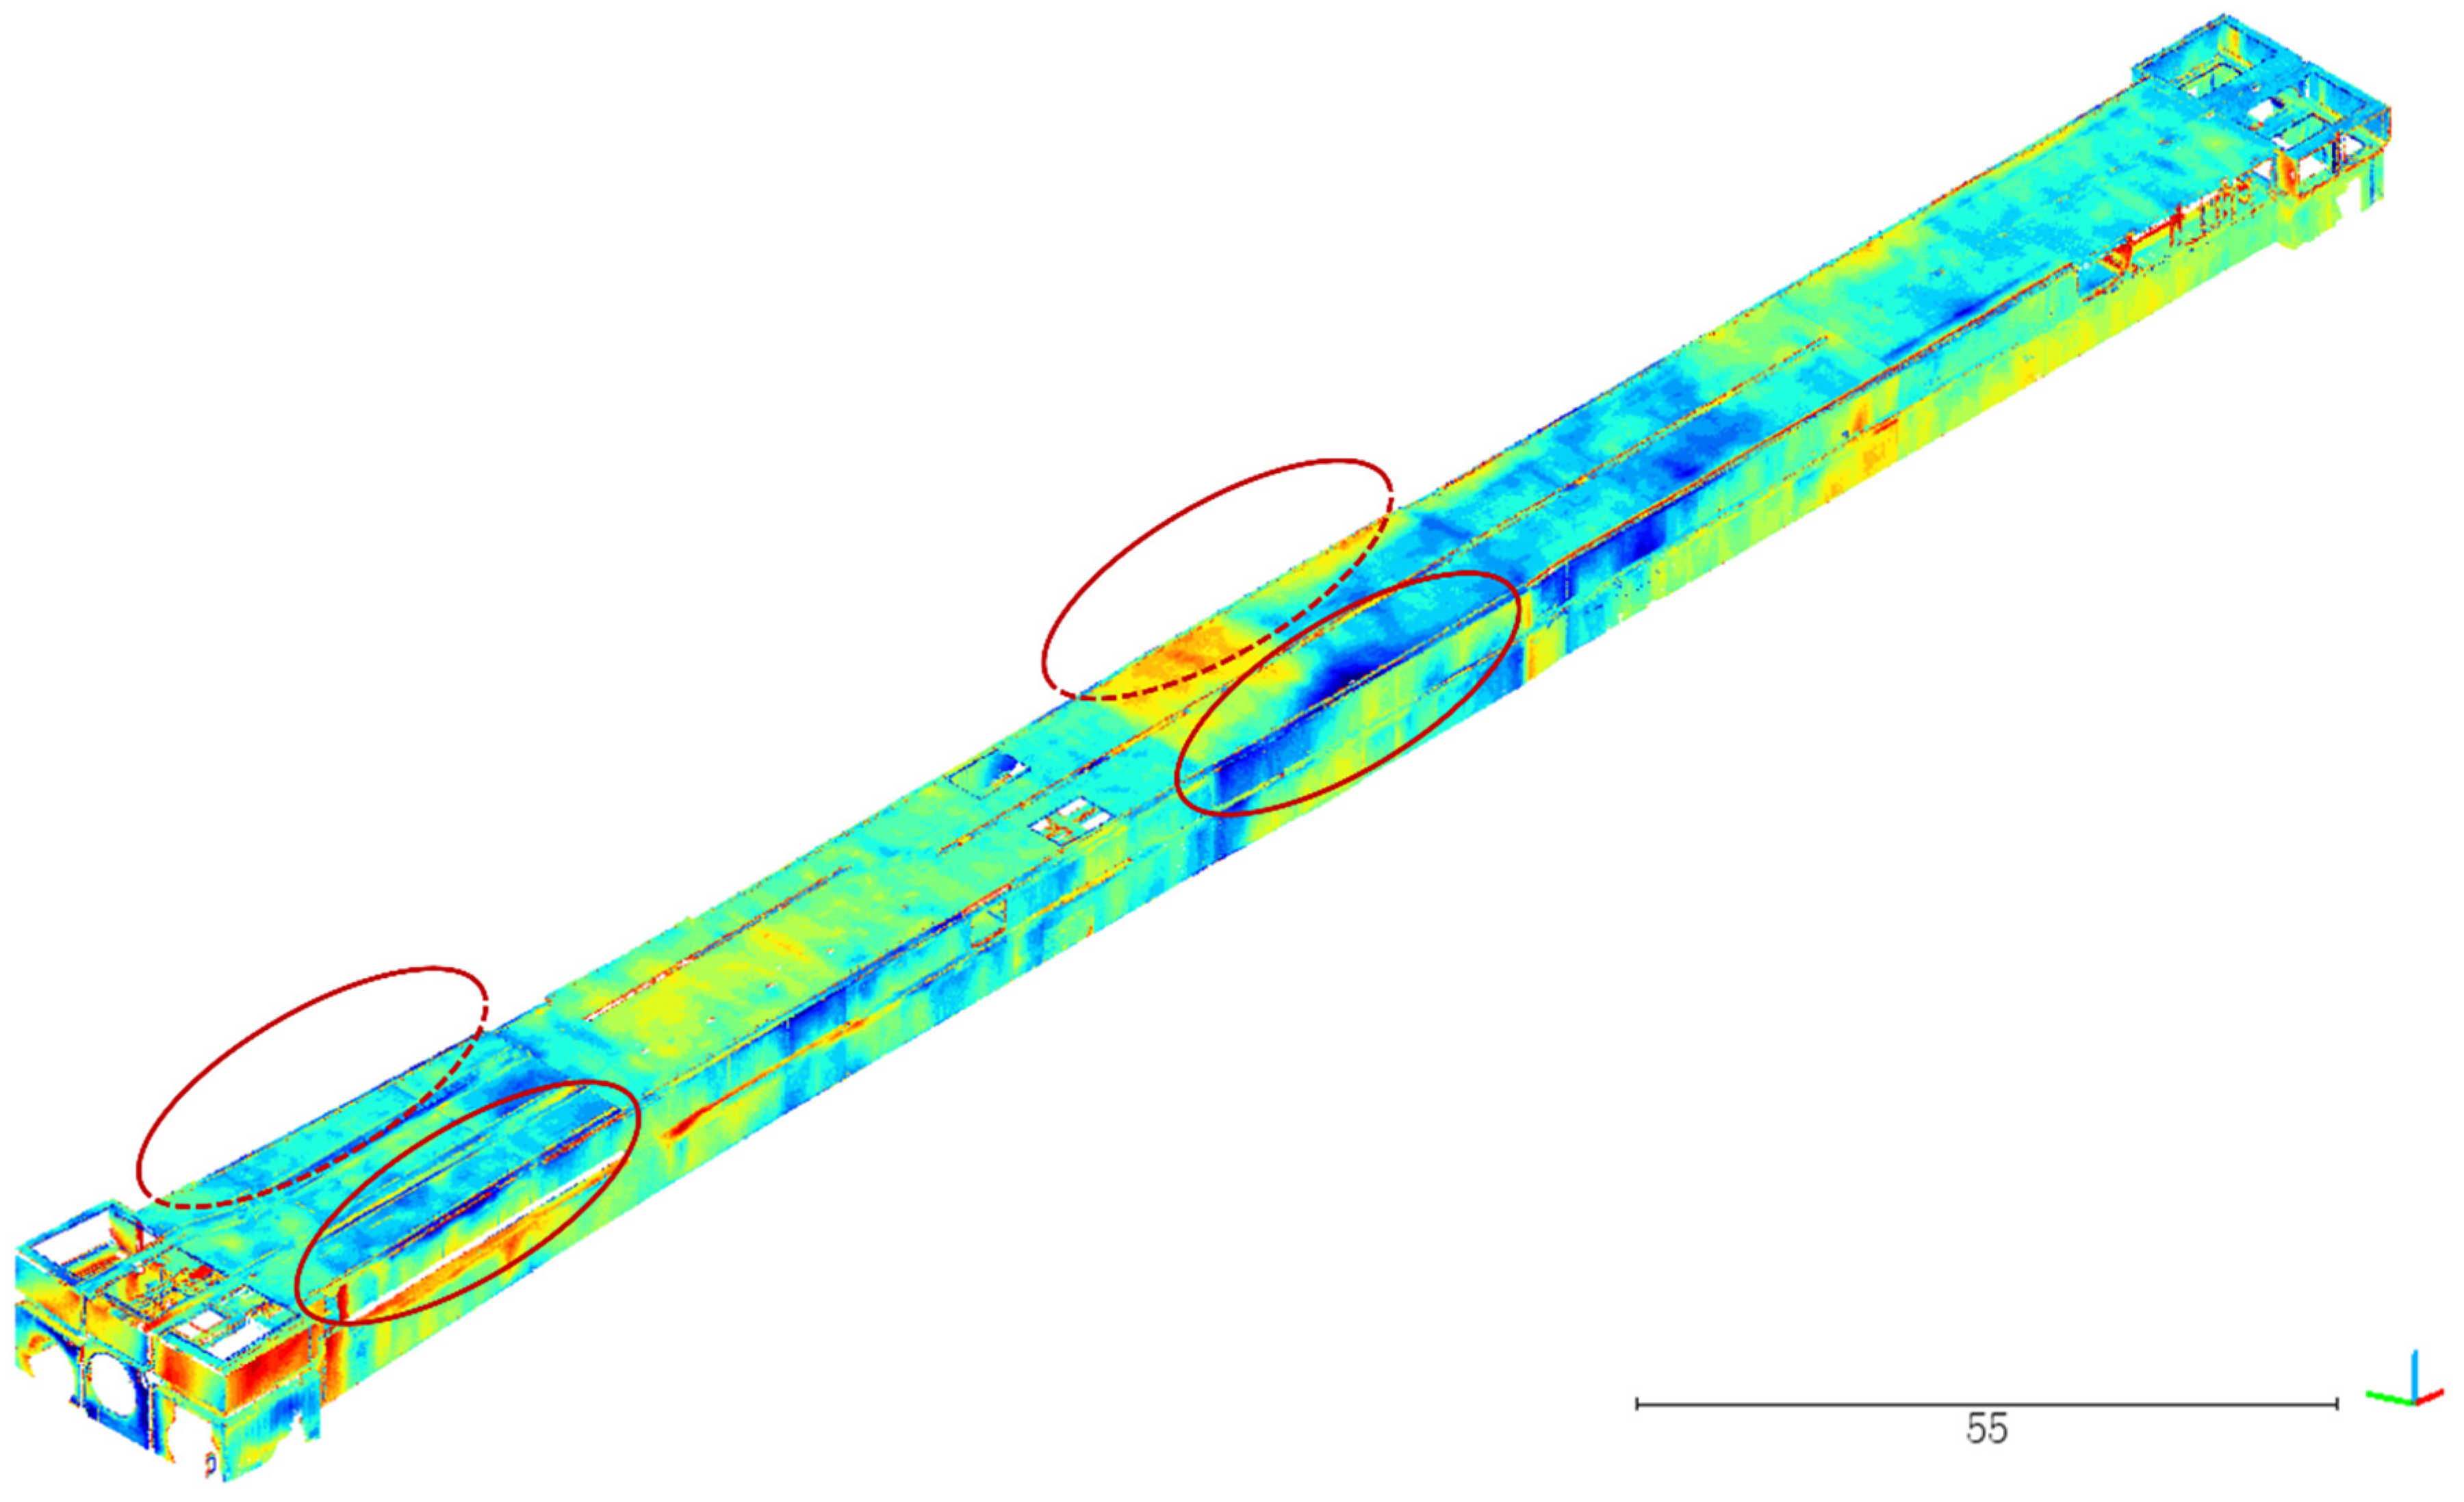
To verify the effectiveness of the accuracy evaluation method proposed in this paper for subway station structures, experiments were conducted at the Hongqi Road subway station. The experimental results for the subway station are shown in Figure 15, Figure 16, Figure 17, Figure 18, Figure 19, Figure 20 and Figure 21. Specifically, Figure 15 shows the deviation chromatogram of the overall subway station. The area of the east and west facades is smaller compared to the south and north elevations; the north and south facades are regarded as a single enormous plane with some areas consisting of curved surfaces, as shown in the area within the red ellipse in Figure 15. Figure 16, Figure 17, Figure 18 and Figure 19 show the deviation chromatograms and statistical histograms for the four facades.
The deviation chromatogram of east and west facades both have two peaks, and Figure 17a and Figure 18a display the findings of the over-limit area’s identification; The E-1 and E-2 areas in Figure 16 have distance deviations that are more than 30 mm, which is the first basement level, and there are a few areas on the second basement level where the distance deviation exceeds 30 mm as well. The deviation of the west facade is shifted to the west, and the deviation fluctuates greatly; the areas where the distance deviation exceeds 30 mm in Figure 17 are W-1, W-2, W-3, and W-5, which are actually in the middle of the first and second basement levels. There are also some areas in Figure 17 where the distance deviation is greater than 30 mm at W-4 and W-6 on the second basement level. Figure 18a and Figure 19a show the deviation chromatograms of the north and south facades and a small number of areas where the distance deviation exceeds 30 mm. The deviation of the north and south facades is symmetrically distributed along the peak, with a narrow bandwidth and location close to 0 mm.

4.4.2. Evaluation of the Top and Bottom Slabs

Figure 20 and Figure 21 show the experiments of the top and bottom slabs of the first basement level. The deviation chromatograms of the top and bottom slabs are shown in (a), and the statistical histograms are shown in (b). The statistical histogram of the top slab has the narrowest bandwidth, and the deviations have a tendency to shift downward. Although the suggested approach may successfully display the deviation results, the surface cannot be assessed in the absence of data. As shown in Figure 21, there is a lack of data in the bottom slab, which prevents accuracy evaluation.

4.5. Structural Column Accuracy Evaluation

In this study, 50 structural columns in a subway station are evaluated. Since the structural columns and the four planes of the structure columns have been segmented into independent objects during point cloud structure element extraction, each structural column is used as a unit in this step of the evaluation. By horizontal slicing, four edge lines to the east, west, south, and north of the structural column were extracted. Then, the four corner points fitted from the four edges were considered to be the four corner points of the structural column in the as-built data. In the case that the point cloud and BIM are moved to the same survey coordinate system, the one-to-one correspondence of corner points can be achieved.
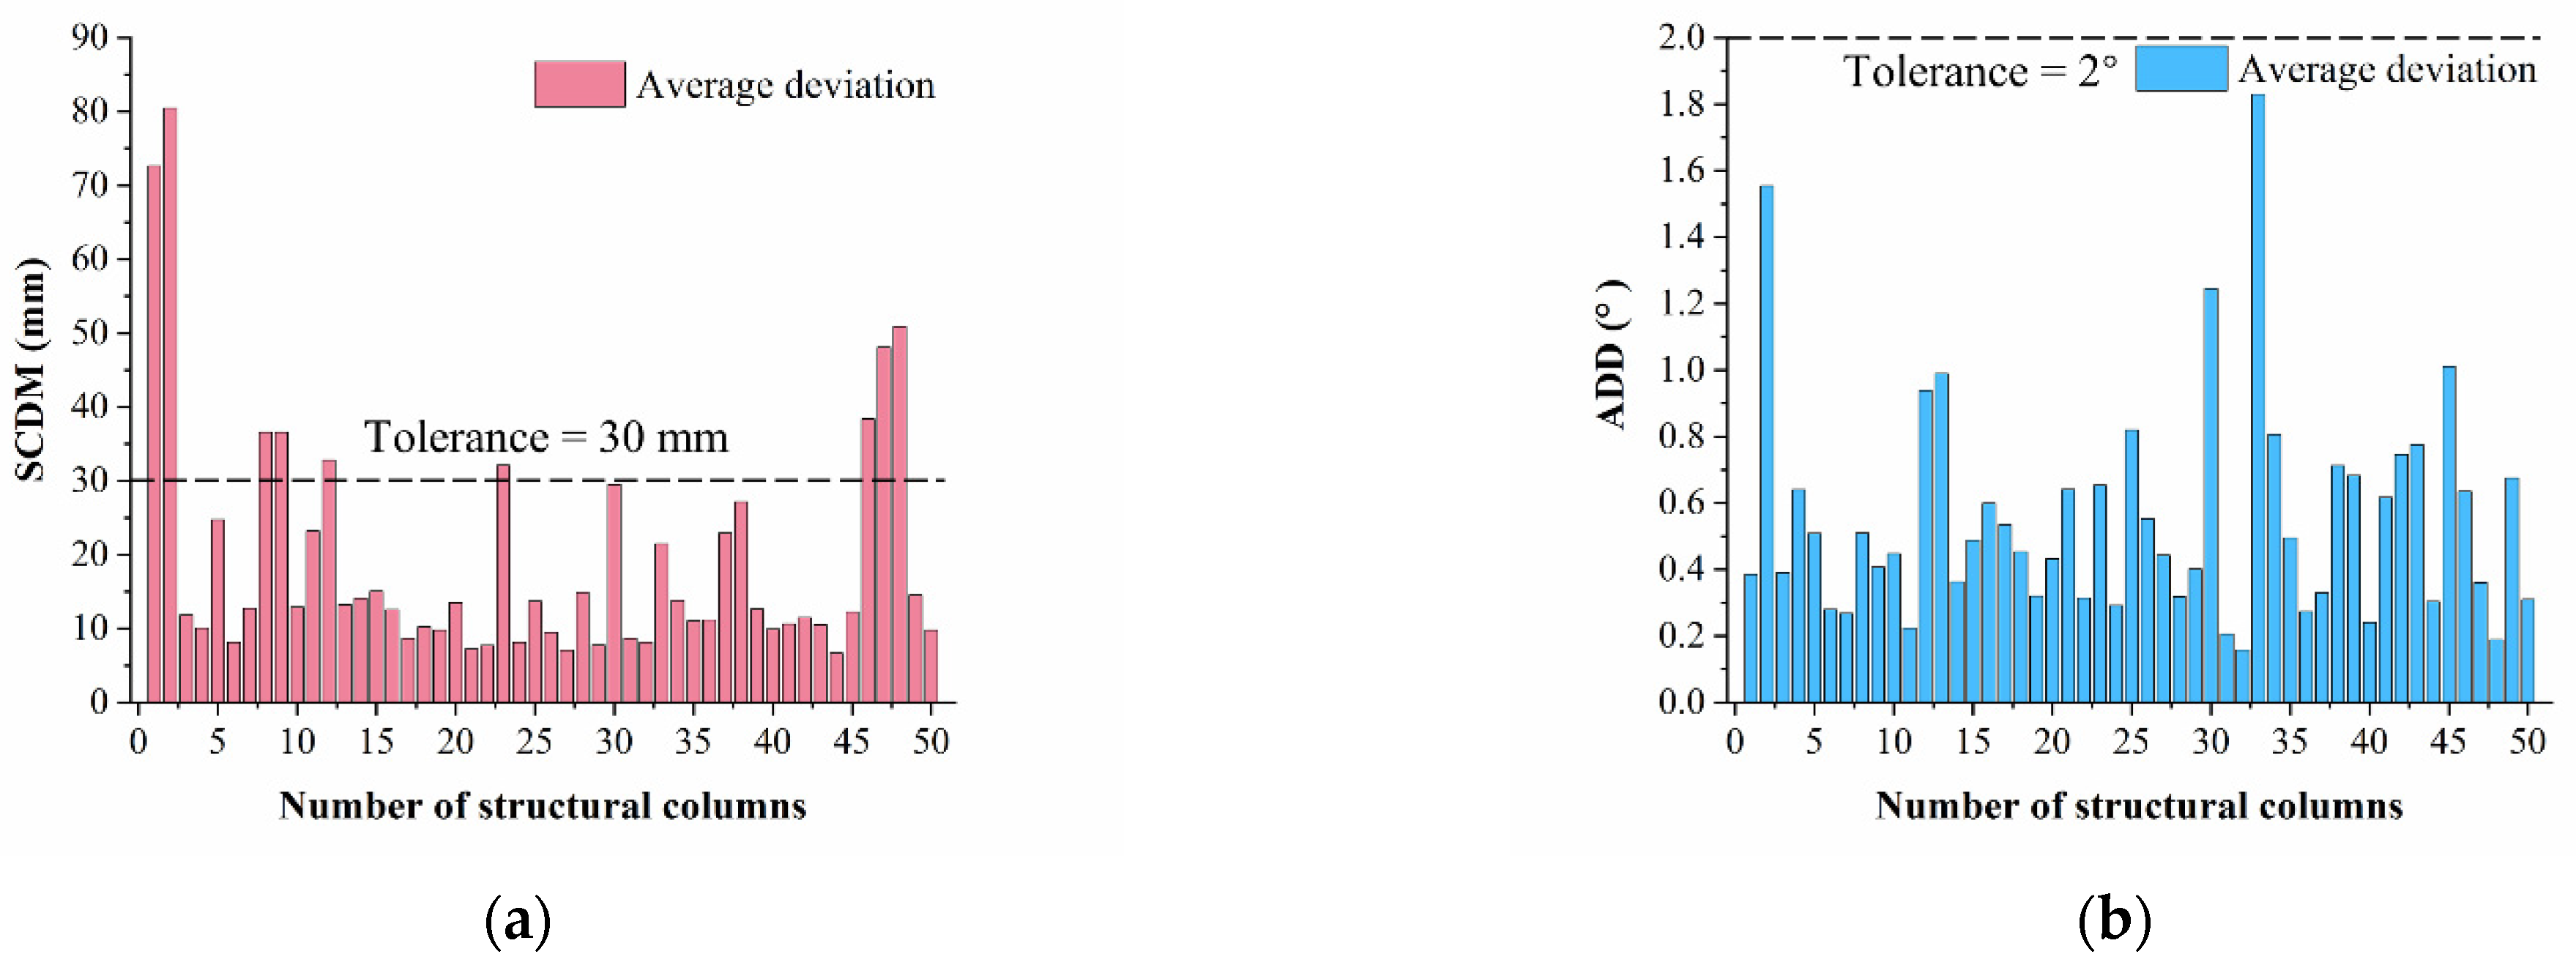
To clearly identify each structural column, the structural columns are numbered using the grid. Among them, the structural columns that are not set on central axis B are indicated using axes A and C according to the north–south orientation of their location, respectively. All structural columns are quantitatively evaluated using the two metrics (SCDM, ADD) proposed in this paper, with the average value of the deviations of the four column angles used as the final indicator. According to the construction requirements, the deviation of structural columns should not exceed 30 mm and the angular deviation should not exceed 2°.
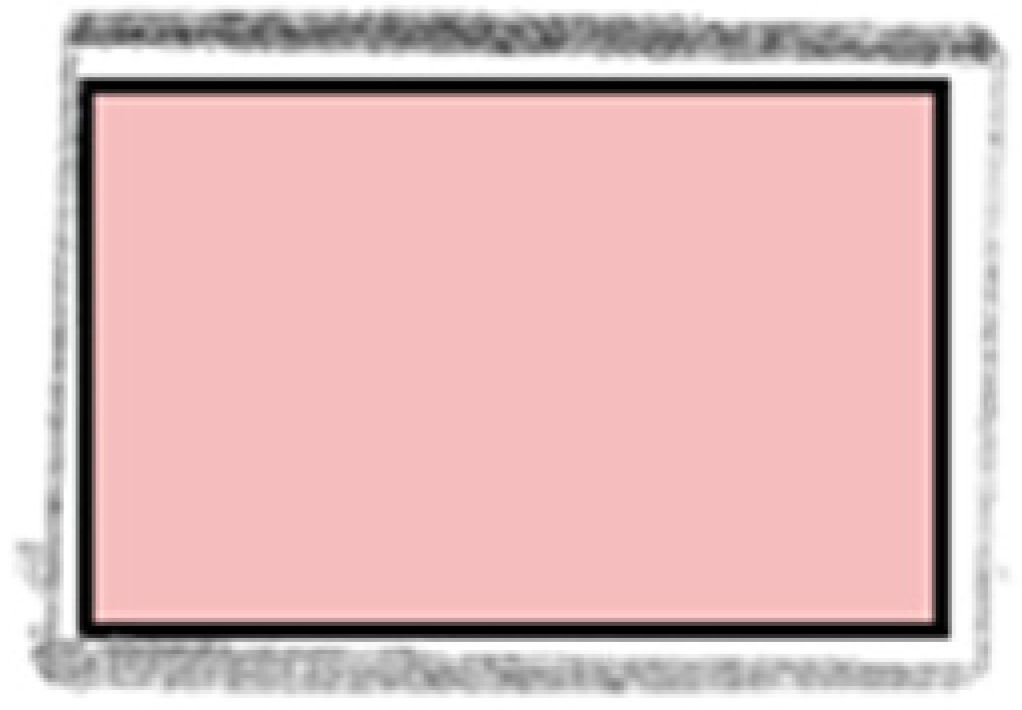
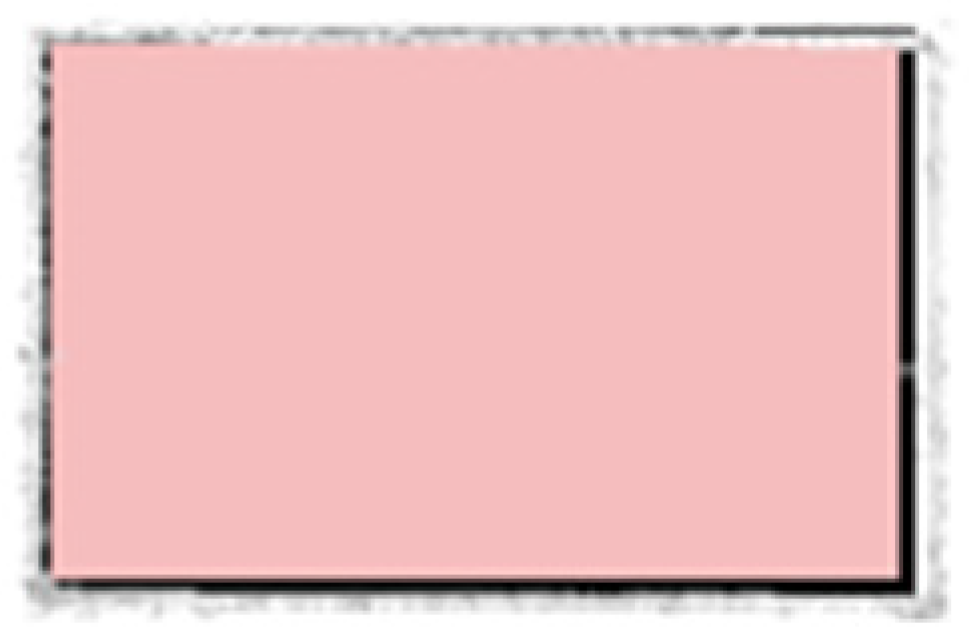
The experimental results of the structural column are shown in Figure 22. Table 2 summarizes a display of columns in the point cloud and BIM that exceed or do not exceed the tolerance. The 2D planes of the structural columns are obtained by projecting the point cloud of the first floor on the XOY plane, and the pink rectangles represent the structural column models at the design phase. Table 3 lists the SCDM and ADD results of structural columns that exceed the tolerances. Figure 23, Figure 24 and Figure 25 present three typical cases of relatively large deviations. The SCDM and ADD of all structural columns are shown in Figure 26. The method proposed in this paper can solve the problem of accuracy evaluation of different structures, as shown in Figure 16, Figure 17, Figure 18, Figure 19, Figure 20, Figure 21 and Figure 22.

5. Discussion

The accuracy of the building surfaces and structural columns of the Hongqi Road subway station is evaluated in the experiments described above. The average deviation value of the east facade of the Hongqi Road subway station is −12.9 ± 19.3 mm, showing a double peak distribution, with error values of −22.5 mm and 0.4 mm at the two peaks (Figure 16). The deviation range remains at the centimeter level. The mean deviation value of the west facade is 4.5 ± 33.7 mm, which also shows double peak distribution, with error values of −29.8 mm and 20.2 mm at the two peaks (Figure 17), located in the W1 and W4 areas. The mean deviation values of the south and north facades are 0.00 ± 25.8 mm and −5.4 ± 26.4 mm, respectively (Figure 18 and Figure 19), both of which show a peak distribution. The deviation ranges of the four facades in the east, west, north, and south are all at the centimeter level, and the deviation distributions are relatively similar, which indirectly reflects the rationality of the coarse-to-fine registration method proposed in this paper. Additionally, there are relatively large distance deviations at the edge of adjacent surfaces, which is a normal phenomenon due to the local shrinkage or expansion near the mold caused by concrete pouring [25]. The mean value of deviation of the top slab is −8.8 ± 21.2 mm, showing an obvious peak distribution, and the peak of deviation is distributed in the T1 area. The mean value of deviation of the bottom slab is −6.9 ± 36.6 mm. Because of the presence of ponding water in the second underground layer during the data acquisition, the high reflective property of this ponding water causes the acquired point cloud data to be missing. The missing data area cannot meet the requirements of geometric accuracy evaluation.
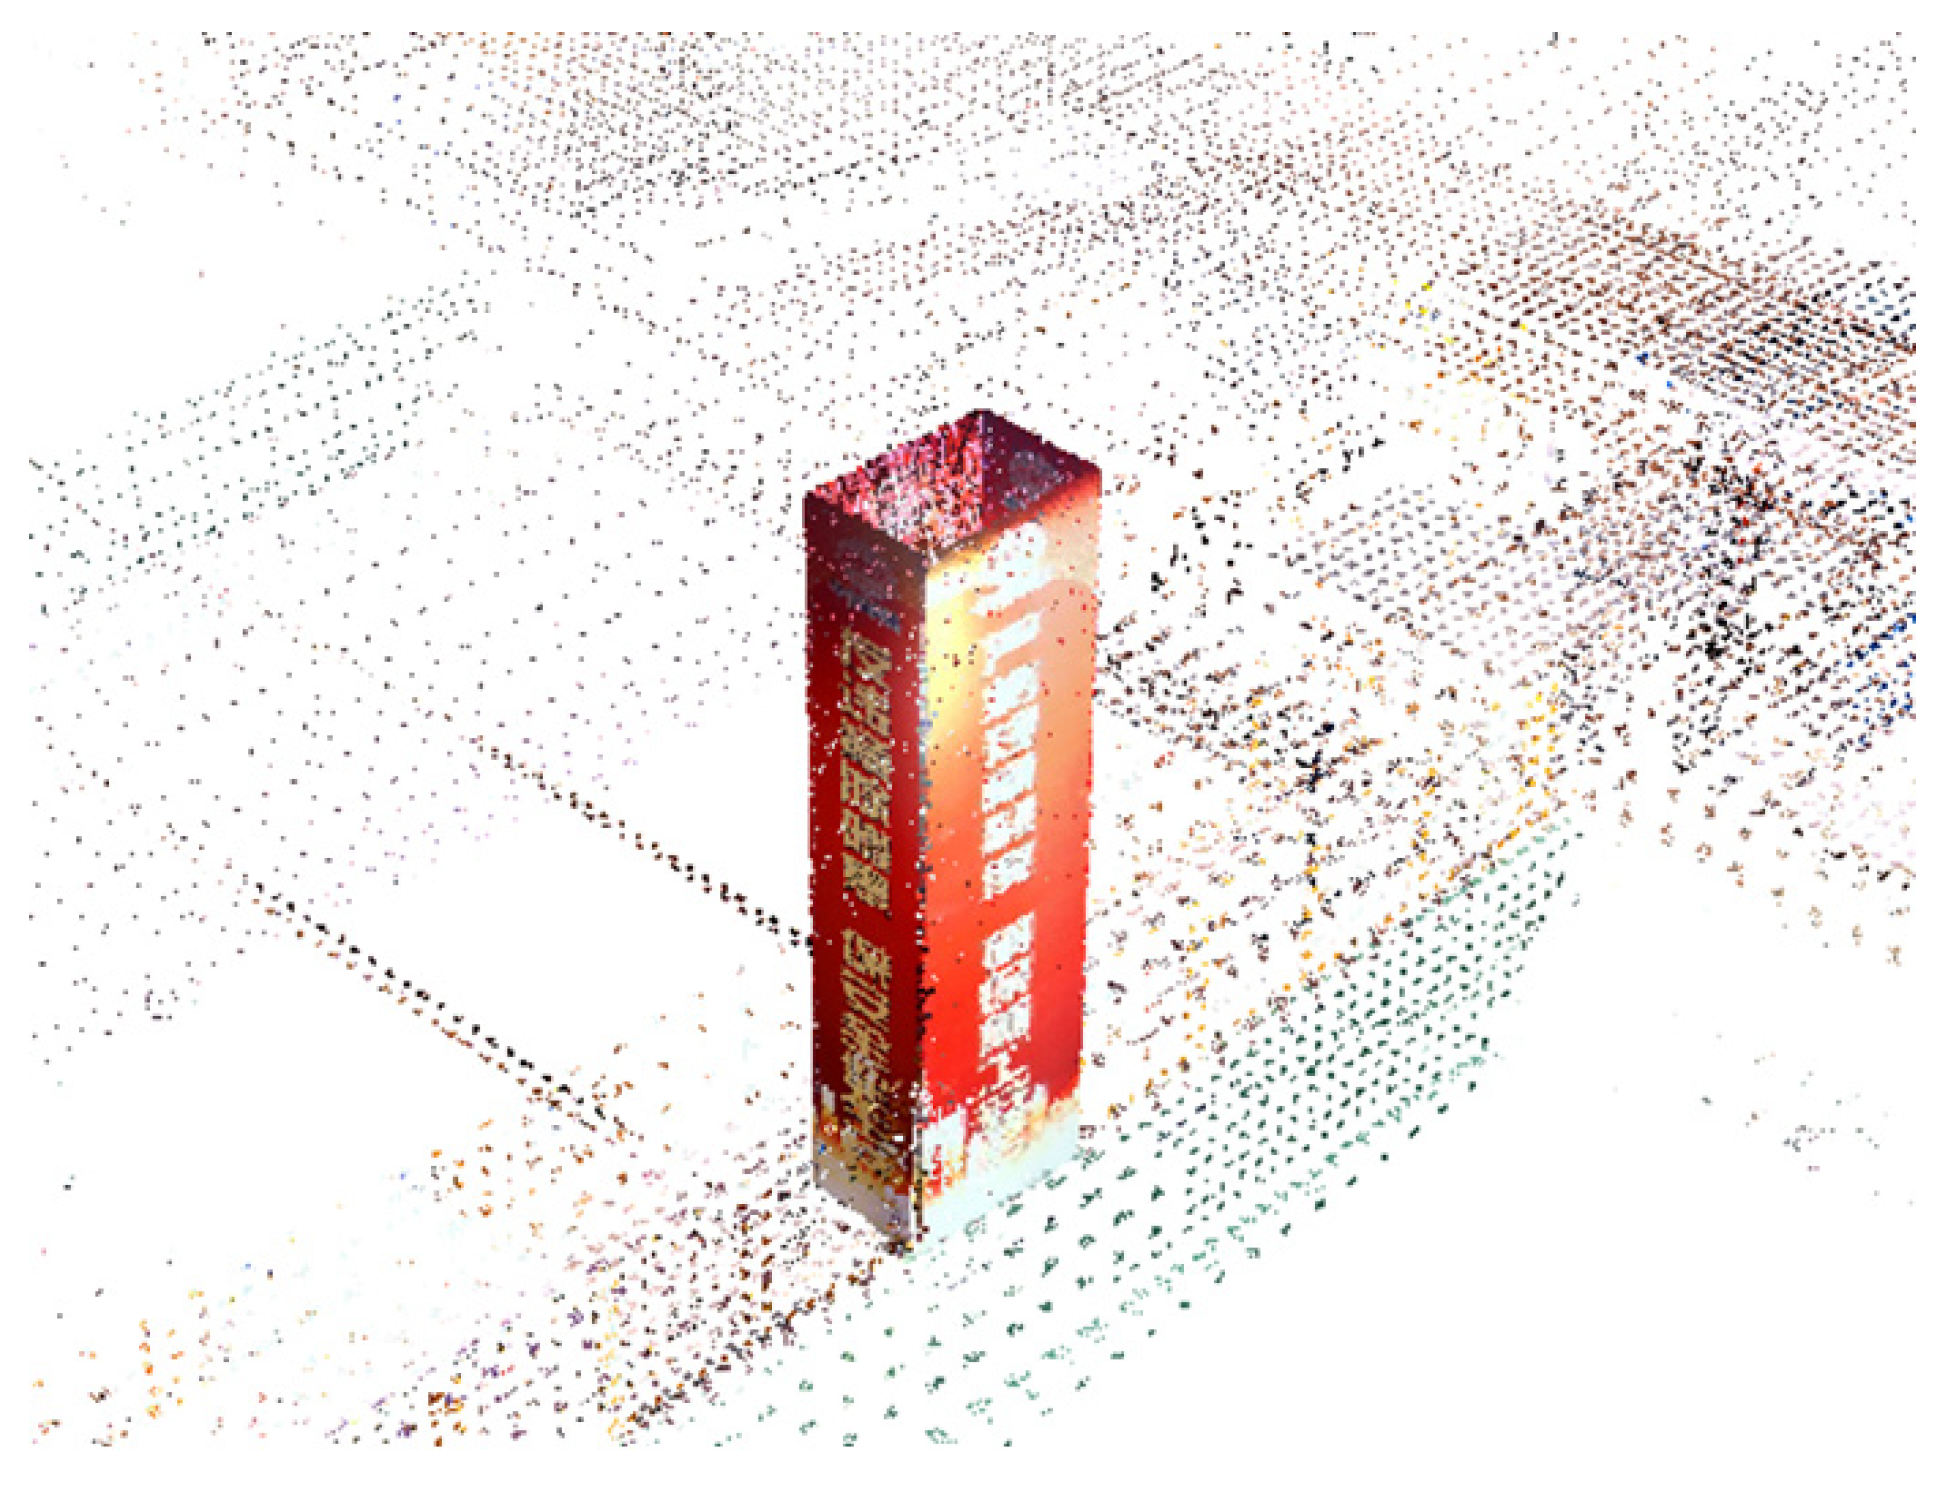
By evaluating 50 structural columns of the Hongqi Road subway station, the average value of their deviations is 5.5 ± 19.9 mm (Figure 22b), and the overall deviation shows a peak distribution, with significant deviations in the structural columns on the east and west sides (Figure 22a). The dimensions of the measured point clouds of structural columns C-2 and A-2 are significantly larger than those of the structural columns in the design state (Figure 26a), which is a measurement error caused by site occlusion. A red curtain was wrapped around the perimeter of the structural columns, as shown in Figure 27. Among them, A-2 has the largest SCDM of 80.5 mm; the mean deviation of structural column C-2 is 61.8 ± 15.7 mm (Figure 23). The average value of deviation of structural column B-35 is 9.7 ± 40.2 mm (Figure 24), the medial axis of the structural column is inclined to the north, and the deviation is mainly concentrated in the upper part of the structural column (Figure 22a). The reasons for the deviations of B-34 and B-36 are similar to those of B-35. Therefore, the projection of the point cloud of these three structural columns has a greater thickness in the north-to-south direction compared to the other structural columns (Table 2). The accuracy evaluation results of all structural columns are presented in Figure 27, most of which have an SCDM within the tolerance range and meet the construction requirements, and all of which have ADD values that meet the construction requirements.
The experimental analyses show that the subway station is large in space and long in depth, and the construction layout is easily affected by the subjective judgment of construction personnel, which may lead to the generation of deviations. In this case, the choice of benchmarks is crucial to the registration accuracy of point clouds and BIM. In this study, “inner wall lines” are treated as objects whose as-built pose and shape are known in the reference coordinate system. PL-ICP is a robust algorithm, which can effectively eliminate the influence of outlier points on the matching results. The incorrectly located walls are considered outliers. This robust strategy implicitly indicates that only the correct position construction is involved in the registration. However, the accumulation and transmission of deviations may still cause the deviation of structural columns to become larger.

6. Conclusions

In this paper, an automatic geometric accuracy evaluation method based on laser scanning is proposed and applied to the geometric accuracy evaluation of the Hongqi Road subway station. The method uses coarse-to-fine point cloud and BIM coordinate registration, and the problem of inconsistent coordinate reference between the design BIM and point cloud is resolved. A hierarchical index system is constituted to assess the geometric accuracy evaluation of various subway objects. Evaluation indexes are used to achieve the surface accuracy evaluation and structural column accuracy evaluation. The over-limit areas can be located automatically; using statistical analysis and visualization, structural column deviations are also quantitatively analyzed. The accuracy of the coarse-to-fine registration was 17.8 ± 0.94 mm. Centimeter-level accuracy evaluation is realized in large-scale sites such as subway stations that have floor surface areas that are larger than 10,000 m2. The successful application in the Hongqi Road subway station demonstrates the potential of this proposed method. It can be applied to other comparable applications.
However, the building objects do not fit closely with the grid for subway stations with special form structures. The grid-based coarse matching cannot be used, and manually coarse matching is needed. In future work, we will extend to special form underground structures to make the method more general.

Author Contributions

Conceptualization, Q.W. and F.Y.; methodology, Q.W. and F.Y.; software, Q.W. and F.Y.; validation, Q.W., P.Q. and F.Y.; formal analysis, F.Y.; investigation, L.Y.; resources, F.Y.; data curation, Y.L. and T.L.; writing—original draft preparation, Q.W.; writing—review and editing, Q.W.; visualization, Q.W.; supervision, P.Q. and F.Y.; project administration, P.Q. and F.Y.; funding acquisition, F.Y. All authors have read and agreed to the published version of the manuscript.

Funding

The project was supported by the Open Fund of Key Laboratory of Urban Land Resources Monitoring and Simulation, Ministry of Natural Resources (no. KF-2021-06-022). This research was funded by the National Natural Science Foundation of China (nos. 42001322, 41871015, and 41671003).

Institutional Review Board Statement

Not applicable.

Informed Consent Statement

Not applicable.

Data Availability Statement

Not applicable.

Acknowledgments

The authors would like to gratefully acknowledge China Railway 19th Bureau Group Co. for their help in accessing and processing the data.

Conflicts of Interest

The authors declare no conflict of interest.

Nomenclature

A description of the nomenclature used in this article.
Abbreviation    Nomenclature
3DThree-dimensional
BIMBuilding Information Modeling
AECArchitecture, Engineering, and Construction
2DTwo-dimensional
GNSSGlobal Navigation Satellite System
ICPIterative Closest Point
RANSACRandom Sample Consistency
PCAPrincipal Component Analysis
EGenetic Algorithm
ANNArtificial Neural Network
CWTContinuous Wavelet Transform
PL-ICPPoint-to-line Iterative Closest Point
KD treeK-Dimensional tree
PDMPlane Discrepancy Metric
SCDMStructural Column Discrepancy Metric
ADDAngular Distance Deviation

References

  1. Wang, L.; Zhang, S.; Tang, L.; Lu, Y.; Liu, Y.; Liu, Y. Optimizing Distribution of Urban Land on the Basis of Urban Land Use Intensity at Prefectural City Scale in Mainland China. Land Use Policy 2022, 115, 106037. [Google Scholar] [CrossRef]
  2. Zhou, Z.; Irizarry, J.; Zhou, J. Development of a Database Exclusively for Subway Construction Accidents and Corresponding Analyses. Tunn. Undergr. Space Technol. 2021, 111, 103852. [Google Scholar] [CrossRef]
  3. Guo, Q.; Amin, S.; Hao, Q.; Haas, O. Resilience Assessment of Safety System at Subway Construction Sites Applying Analytic Network Process and Extension Cloud Models. Reliab. Eng. Syst. Saf. 2020, 201, 106956. [Google Scholar] [CrossRef]
  4. Zhang, C.; Arditi, D. Automated Progress Control Using Laser Scanning Technology. Autom. Constr. 2013, 36, 108–116. [Google Scholar] [CrossRef]
  5. Navon, R. Research in Automated Measurement of Project Performance Indicators. Autom. Constr. 2007, 16, 176–188. [Google Scholar] [CrossRef]
  6. Mirzaei, K.; Arashpour, M.; Asadi, E.; Masoumi, H.; Bai, Y.; Behnood, A. 3D Point Cloud Data Processing with Machine Learning for Construction and Infrastructure Applications: A Comprehensive Review. Adv. Eng. Inform. 2022, 51, 101501. [Google Scholar] [CrossRef]
  7. Yan, Y.; Hajjar, J.F. Automated Extraction of Structural Elements in Steel Girder Bridges from Laser Point Clouds. Autom. Constr. 2021, 125, 103582. [Google Scholar] [CrossRef]
  8. Jia, S.; Liu, C.; Guan, X.; Wu, H.; Zeng, D.; Guo, J. Bidirectional Interaction between BIM and Construction Processes Using a Multisource Geospatial Data Enabled Point Cloud Model. Autom. Constr. 2022, 134, 104096. [Google Scholar] [CrossRef]
  9. Reja, V.K.; Varghese, K.; Ha, Q.P. Computer Vision-Based Construction Progress Monitoring. Autom. Constr. 2022, 138, 104245. [Google Scholar] [CrossRef]
  10. Angjeliu, G.; Cardani, G.; Coronelli, D. A Parametric Model for Ribbed Masonry Vaults. Autom. Constr. 2019, 105, 102785. [Google Scholar] [CrossRef]
  11. Bassier, M.; Hadjidemetriou, G.; Vergauwen, M.; Van Roy, N.; Verstrynge, E. Implementation of Scan-to-BIM and FEM for the Documentation and Analysis of Heritage Timber Roof Structures. In Proceedings of the Digital Heritage. Progress in Cultural Heritage: Documentation, Preservation, and Protection, Nicosia, Cyprus, 31 October–5 November 2016; Ioannides, M., Fink, E., Moropoulou, A., Hagedorn-Saupe, M., Fresa, A., Liestøl, G., Rajcic, V., Grussenmeyer, P., Eds.; Springer International Publishing: Cham, Switzerland, 2016; pp. 79–90. [Google Scholar]
  12. Angjeliu, G.; Coronelli, D.; Cardani, G. Development of the Simulation Model for Digital Twin Applications in Historical Masonry Buildings: The Integration between Numerical and Experimental Reality. Comput. Struct. 2020, 238, 106282. [Google Scholar] [CrossRef]
  13. Liu, J.; Fu, L.; Cheng, G.; Li, D.; Zhou, J.; Cui, N.; Chen, Y.F. Automated BIM Reconstruction of Full-Scale Complex Tubular Engineering Structures Using Terrestrial Laser Scanning. Remote Sens. 2022, 14, 1659. [Google Scholar] [CrossRef]
  14. Stepinac, M.; Lulić, L.; Ožić, K. The Role of UAV and Laser Scanners in the Post-Earthquake Assessment of Heritage Buildings after the 2020 Earthquakes in Croatia. In Advanced Nondestructive and Structural Techniques for Diagnosis, Redesign and Health Monitoring for the Preservation of Cultural Heritage; Springer: Cham, Switzerland, 2022; pp. 167–177. [Google Scholar] [CrossRef]
  15. Bae, J.; Lee, J.; Jang, A.; Ju, Y.K.; Park, M.J. SMART SKY EYE System for Preliminary Structural Safety Assessment of Buildings Using Unmanned Aerial Vehicles. Sensors 2022, 22, 2762. [Google Scholar] [CrossRef]
  16. Wang, Q.; Kim, M.K. Applications of 3D Point Cloud Data in the Construction Industry: A Fifteen-Year Review from 2004 to 2018. Adv. Eng. Inform. 2019, 39, 306–319. [Google Scholar] [CrossRef]
  17. Chi, H.L.; Kim, M.K.; Liu, K.Z.; Thedja, J.P.P.; Seo, J.; Lee, D.E. Rebar Inspection Integrating Augmented Reality and Laser Scanning. Autom. Constr. 2022, 136, 104183. [Google Scholar] [CrossRef]
  18. Wang, Q.; Kim, M.K.; Cheng, J.C.P.; Sohn, H. Automated Quality Assessment of Precast Concrete Elements with Geometry Irregularities Using Terrestrial Laser Scanning. Autom. Constr. 2016, 68, 170–182. [Google Scholar] [CrossRef]
  19. Kim, M.K.; Wang, Q.; Park, J.W.; Cheng, J.C.P.; Sohn, H.; Chang, C.C. Automated Dimensional Quality Assurance of Full-Scale Precast Concrete Elements Using Laser Scanning and BIM. Autom. Constr. 2016, 72, 102–114. [Google Scholar] [CrossRef]
  20. Bosché, F. Automated Recognition of 3D CAD Model Objects in Laser Scans and Calculation of As-Built Dimensions for Dimensional Compliance Control in Construction. Adv. Eng. Inform. 2010, 24, 107–118. [Google Scholar] [CrossRef]
  21. Wang, Q.; Kim, M.K.; Sohn, H.; Cheng, J.C. Surface Flatness and Distortion Inspection of Precast Concrete Elements Using Laser Scanning Technology. Smart Struct. Syst. 2016, 18, 601–623. [Google Scholar] [CrossRef] [Green Version]
  22. Bosché, F.; Biotteau, B. Terrestrial Laser Scanning and Continuous Wavelet Transform for Controlling Surface Flatness in Construction—A First Investigation. Adv. Eng. Inform. 2015, 29, 591–601. [Google Scholar] [CrossRef]
  23. Xiuren, Y.; Meiqun, H.; Zhiyong, P.; Fang, L. Calculation of Dynamic Assembly and Tensioning Loads at Multiple Points of Prefabricated Structure. Tunn. Undergr. Space Technol. 2022, 126, 104564. [Google Scholar] [CrossRef]
  24. Yang, X.; Lin, F. Prefabrication Technology for Underground Metro Station Structure. Tunn. Undergr. Space Technol. 2021, 108, 103717. [Google Scholar] [CrossRef]
  25. Li, D.; Liu, J.; Feng, L.; Zhou, Y.; Liu, P.; Chen, Y.F. Terrestrial Laser Scanning Assisted Flatness Quality Assessment for Two Different Types of Concrete Surfaces. Measurement 2020, 154, 107436. [Google Scholar] [CrossRef]
  26. Kim, M.K.; Wang, Q.; Yoon, S.; Sohn, H. A Mirror-Aided Laser Scanning System for Geometric Quality Inspection of Side Surfaces of Precast Concrete Elements. Measurement 2019, 141, 420–428. [Google Scholar] [CrossRef]
  27. Bosché, F. Plane-Based Registration of Construction Laser Scans with 3D/4D Building Models. Adv. Eng. Inform. 2012, 26, 90–102. [Google Scholar] [CrossRef]
  28. Guo, Y.; Sohel, F.; Bennamoun, M.; Lu, M.; Wan, J. Rotational Projection Statistics for 3D Local Surface Description and Object Recognition. Int. J. Comput. Vis. 2013, 105, 63–86. [Google Scholar] [CrossRef]
  29. Franaszek, M.; Cheok, G.S.; Witzgall, C. Fast Automatic Registration of Range Images from 3D Imaging Systems Using Sphere Targets. Autom. Constr. 2009, 18, 265–274. [Google Scholar] [CrossRef]
  30. Guarnieri, A.; Vettore, A.; Remondino, F.; Church, O.P. Photogrammetry and Ground-Based Laser Scanning: Assessment of Metric Accuracy of the 3D Model of Pozzoveggiani Church; The Pennsylvania State University: State College, PA, USA, 2004. [Google Scholar]
  31. Weinmann, M. Reconstruction and Analysis of 3D Scenes; Springer: Berlin/Heidelberg, Germany, 2016. [Google Scholar]
  32. Stamos, I.; Leordeanu, M. Automated Feature-Based Range Registration of Urban Scenes of Large Scale. In Proceedings of the 2003 IEEE Computer Society Conference on Computer Vision and Pattern Recognition, Madison, WI, USA, 18–20 June 2003; Proceedings. IEEE: Piscataway, NJ, USA, 2003; Volume 2, pp. II–Ii. [Google Scholar]
  33. Xu, Y.; Boerner, R.; Yao, W.; Hoegner, L.; Stilla, U. Automated Coase Registation of Point Clouds in 3D Urban Scenesusing Voexl Baesd Plane Constraint. ISPRS Ann. Photogramm. Remote Sens. Spat. Inf. Sci. 2017, IV-2/W4, 185–191. [Google Scholar] [CrossRef]
  34. Dold, C. Extended Gaussian Images for the Registration of Terrestrial Scan Data. In Proceedings of the ISPRS Workshop Laser scanning, Enschede, The Netherlands, 12–14 September 2005; pp. 180–185. [Google Scholar]
  35. Dong, Z.; Liang, F.; Yang, B.; Xu, Y.; Zang, Y.; Li, J.; Wang, Y.; Dai, W.; Fan, H.; Hyyppä, J.; et al. Registration of Large-Scale Terrestrial Laser Scanner Point Clouds: A Review and Benchmark. ISPRS J. Photogramm. Remote Sens. 2020, 163, 327–342. [Google Scholar] [CrossRef]
  36. Vermandere, J.; Bassier, M.; Vergauwen, M. Two-Step Alignment of Mixed Reality Devices to Existing Building Data. Remote Sens. 2022, 14, 2680. [Google Scholar] [CrossRef]
  37. Besl, P.; McKay, N. Method for Registration of 3-D Shapes. In Sensor Fusion IV: Control Paradigms and Data Structures International Society for Optics and Photonics; SPIE: Bellingham, WA, USA, 1992; pp. 586–607. [Google Scholar]
  38. Censi, A. An ICP Variant Using a Point-to-Line Metric. In Proceedings of the 2008 IEEE International Conference on Robotics and Automation, Pasadena, CA, USA, 19–23 May 2008; pp. 19–25. [Google Scholar]
  39. Rusinkiewicz, S.; Levoy, M. Efficient Variants of the ICP Algorithm. In Proceedings of the Third International Conference on 3-D Digital Imaging and Modeling, Quebec City, QC, Canada, 28 May–1 June 2001; pp. 145–152. [Google Scholar]
  40. Segal, A.; Haehnel, D.; Thrun, S. Generalized-Icp. In Robotics: Science and Systems; University of Washington: Seattle, WA, USA, 2009; Volume 2, p. 435. [Google Scholar]
  41. Bueno, M.; Bosché, F.; González-Jorge, H.; Martínez-Sánchez, J.; Arias, P. 4-Plane Congruent Sets for Automatic Registration of as-Is 3D Point Clouds with 3D BIM Models. Autom. Constr. 2018, 89, 120–134. [Google Scholar] [CrossRef]
  42. Chen, J.; Cho, Y.K. Point-to-Point Comparison Method for Automated Scan-vs-Bim Deviation Detection. In Proceedings of the 2018 17th International Conference on Computing in Civil and Building Engineering, Tampere, Finland, 4–7 June 2018; pp. 5–7. [Google Scholar]
  43. Harirchian, E.; Aghakouchaki Hosseini, S.E.; Jadhav, K.; Kumari, V.; Rasulzade, S.; Işık, E.; Wasif, M.; Lahmer, T. A Review on Application of Soft Computing Techniques for the Rapid Visual Safety Evaluation and Damage Classification of Existing Buildings. J. Build. Eng. 2021, 43, 102536. [Google Scholar] [CrossRef]
  44. Bülbül, M.A.; Harirchian, E.; Işık, M.F.; Aghakouchaki Hosseini, S.E.; Işık, E. A Hybrid ANN-GA Model for an Automated Rapid Vulnerability Assessment of Existing RC Buildings. Appl. Sci. 2022, 12, 5138. [Google Scholar] [CrossRef]
  45. Harirchian, E.; Jadhav, K.; Kumari, V.; Lahmer, T. ML-EHSAPP: A Prototype for Machine Learning-Based Earthquake Hazard Safety Assessment of Structures by Using a Smartphone App. Null 2022, 26, 5279–5299. [Google Scholar] [CrossRef]
  46. Puri, N.; Valero, E.; Turkan, Y.; Bosché, F. Assessment of Compliance of Dimensional Tolerances in Concrete Slabs Using TLS Data and the 2D Continuous Wavelet Transform. Autom. Constr. 2018, 94, 62–72. [Google Scholar] [CrossRef]
  47. Kim, M.K.; Sohn, H.; Chang, C.C. Automated Dimensional Quality Assessment of Precast Concrete Panels Using Terrestrial Laser Scanning. Autom. Constr. 2014, 45, 163–177. [Google Scholar] [CrossRef]
  48. Akinci, B.; Boukamp, F.; Gordon, C.; Huber, D.; Lyons, C.; Park, K. A Formalism for Utilization of Sensor Systems and Integrated Project Models for Active Construction Quality Control. Autom. Constr. 2006, 15, 124–138. [Google Scholar] [CrossRef]
  49. Kim, M.K.; Cheng, J.C.P.; Sohn, H.; Chang, C.C. A Framework for Dimensional and Surface Quality Assessment of Precast Concrete Elements Using BIM and 3D Laser Scanning. Autom. Constr. 2015, 49, 225–238. [Google Scholar] [CrossRef]
  50. Valero, E.; Bosché, F.; Bueno, M. Laser Scanning for BIM. J. Inf. Technol. Constr. (ITcon) 2022, 27, 486–495. [Google Scholar] [CrossRef]
  51. Jiang, Q.; Shi, Y.E.; Yan, F.; Zheng, H.; Kou, Y.Y.; He, B.G. Reconstitution Method for Tunnel Spatiotemporal Deformation Based on 3D Laser Scanning Technology and Corresponding Instability Warning. Eng. Fail. Anal. 2021, 125, 105391. [Google Scholar] [CrossRef]
  52. Yang, F.; Zhou, G.; Su, F.; Zuo, X.; Tang, L.; Liang, Y.; Zhu, H.; Li, L. Automatic Indoor Reconstruction from Point Clouds in Multi-Room Environments with Curved Walls. Sensors 2019, 19, 3798. [Google Scholar] [CrossRef] [PubMed]
  53. Chetverikov, D.; Svirko, D.; Stepanov, D.; Krsek, P. The Trimmed Iterative Closest Point Algorithm. In Proceedings of the 2002 International Conference on Pattern Recognition, Quebec City, QC, Canada, 11–15 August 2002; Volume 3, pp. 545–548. [Google Scholar]
  54. Liu, J.; Zhang, Q.; Wu, J.; Zhao, Y. Dimensional Accuracy and Structural Performance Assessment of Spatial Structure Components Using 3D Laser Scanning. Autom. Constr. 2018, 96, 324–336. [Google Scholar] [CrossRef]
  55. Zhang, R.; El-Gohary, N. A Deep Neural Network-Based Method for Deep Information Extraction Using Transfer Learning Strategies to Support Automated Compliance Checking. Autom. Constr. 2021, 132, 103834. [Google Scholar] [CrossRef]
  56. Rabbani, T.; Van Den Heuvel, F.; Vosselmann, G. Segmentation of Point Clouds Using Smoothness Constraint. Int. Arch. Photogramm. Remote Sens. Spat. Inf. Sci. 2006, 36, 248–253. [Google Scholar]
  57. Yang, F.; Li, L.; Su, F.; Li, D.; Zhu, H.; Ying, S.; Zuo, X.; Tang, L. Semantic Decomposition and Recognition of Indoor Spaces with Structural Constraints for 3D Indoor Modelling. Autom. Constr. 2019, 106, 102913. [Google Scholar] [CrossRef]
  58. CH/Z 3017—2015; Technical Specifications for Terrestrial Three-Dimensional Laser Scanning. The Central Peoples Government of the People’s Republic of China: Beijing, China.
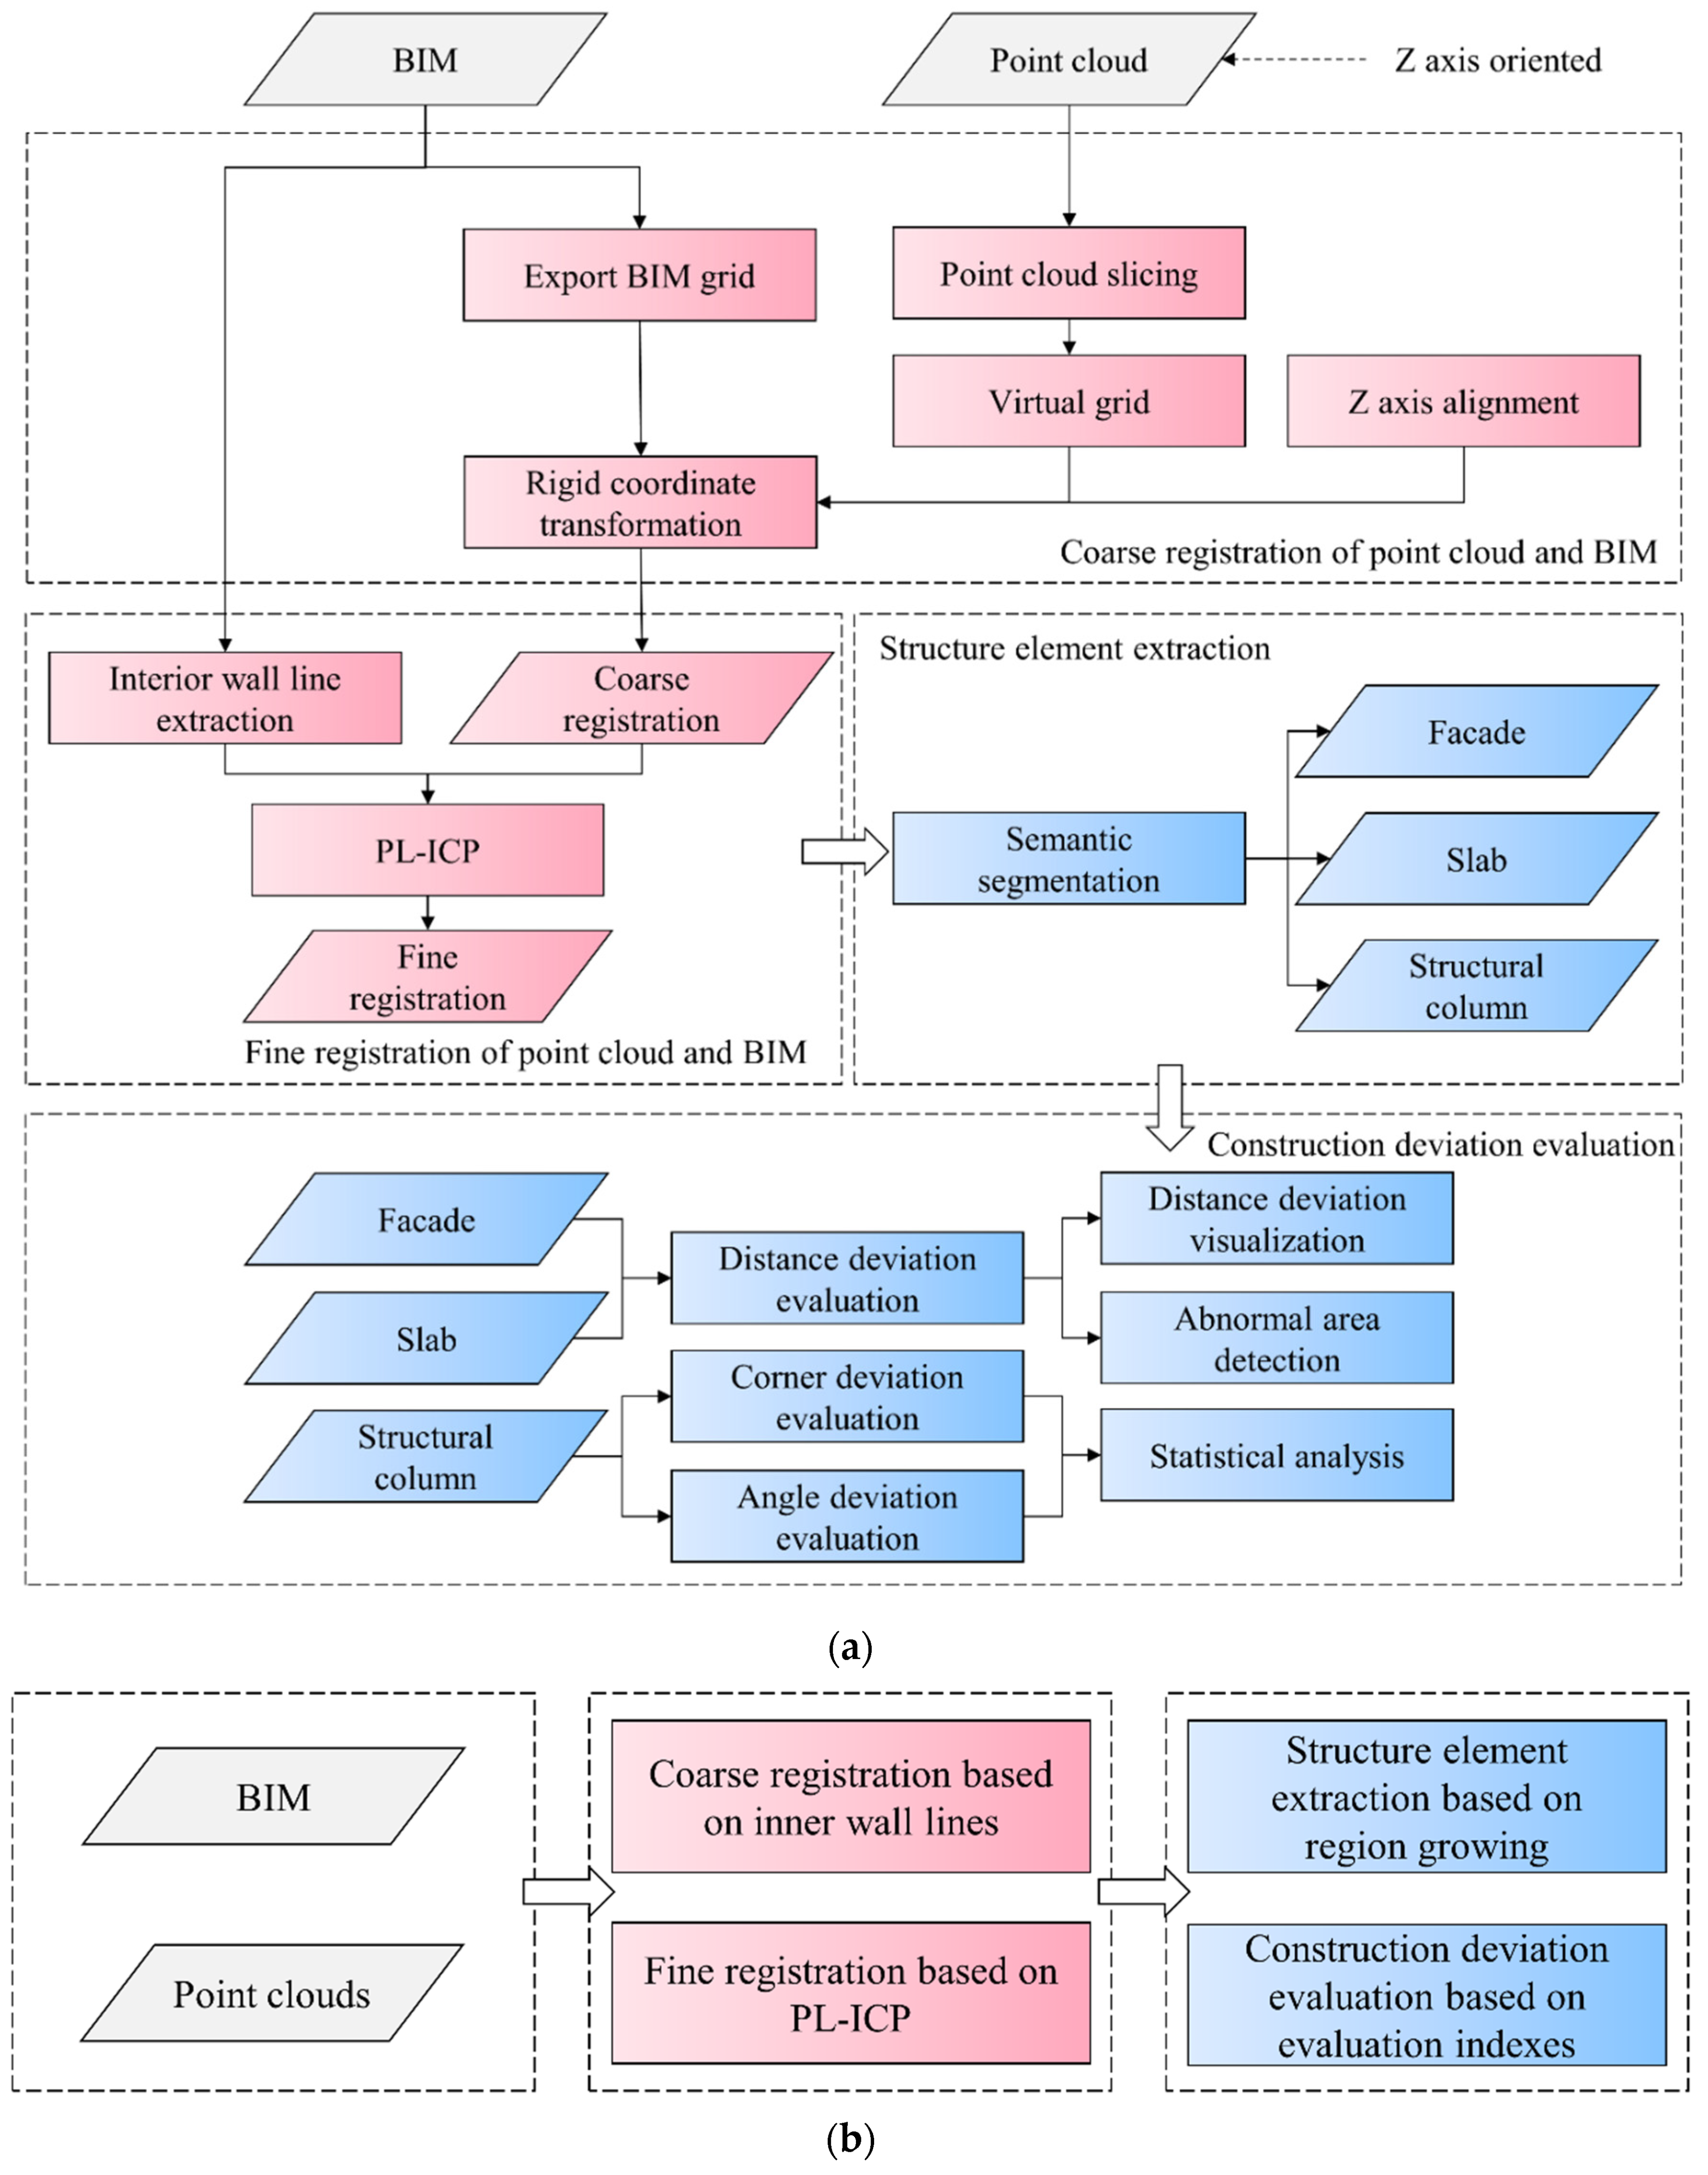
Figure 1. (a) Workflow of geometric accuracy evaluation using 3D laser scanning; (b) data processing method.
Applsci 12 09535 g001
Figure 2. (a) Before coarse registration; (b) after coarse registration.
Applsci 12 09535 g002
Figure 3. Workflow of coarse registration.
Applsci 12 09535 g003
Figure 4. Principle of the PL-ICP algorithm, aiming at minimizing the sum of squared distances between the target point and the line segment that connects two adjacent points.
Applsci 12 09535 g004
Figure 5. The process of structure element extraction.
Applsci 12 09535 g005
Figure 6. Graphical representation of the calculated surface error.
Applsci 12 09535 g006
Figure 7. Schematic diagram of the structural column accuracy evaluation.
Applsci 12 09535 g007
Figure 8. Location of Hongqi Road station.
Applsci 12 09535 g008
Figure 9. (a) Subway station construction site; (b) data collection process.
Applsci 12 09535 g009
Figure 10. (a) Scanning point cloud of the subway station; (b) the design BIM of the subway station.
Applsci 12 09535 g010
Figure 11. Registration result of point cloud slice and BIM grid.
Applsci 12 09535 g011
Figure 12. Coarse registration results between the point cloud and BIM.
Applsci 12 09535 g012
Figure 13. Fine registration results between the point cloud and BIM.
Applsci 12 09535 g013
Figure 14. Subway station structure information segmentation results.
Applsci 12 09535 g014
Figure 15. Subway station accuracy visualization results.
Applsci 12 09535 g015
Figure 16. Evaluation of east facade: (a) deviation distance accuracy visualization result; (b) histogram of the error distribution.
Applsci 12 09535 g016
Figure 17. Evaluation of west facade: (a) deviation distance accuracy visualization result; (b) histogram of the error distribution.
Applsci 12 09535 g017
Figure 18. Evaluation of north facade: (a) deviation distance accuracy visualization result; (b) histogram of the error distribution.
Applsci 12 09535 g018
Figure 19. Evaluation of south facade: (a) deviation distance accuracy visualization result; (b) histogram of the error distribution.
Applsci 12 09535 g019
Figure 20. Roof slab: (a) deviation distance accuracy visualization result; (b) histogram of the error distribution.
Applsci 12 09535 g020
Figure 21. Base slab: (a) deviation distance accuracy visualization result; (b) histogram of the error distribution.
Applsci 12 09535 g021
Figure 22. (a) Visualization results of the 3D deviation of structural columns; (b) histogram of the error distribution of the structural columns.
Applsci 12 09535 g022
Figure 23. Structural column C-2: (a) 3D deviation visualization results; (b) error distribution histogram.
Applsci 12 09535 g023
Figure 24. Structural column B-18: (a) 3D deviation visualization results; (b) error distribution histogram.
Applsci 12 09535 g024
Figure 25. Structural column B-35: (a) 3D deviation visualization results; (b) error distribution histogram.
Applsci 12 09535 g025
Figure 26. Results of the structural column accuracy evaluation: (a) SCDM of structural column corner points; (b) ADD of structural column corner points.
Applsci 12 09535 g026
Figure 27. Measured point cloud of structure column A-2. A red curtain was wrapped around the perimeter of structural column A-2.
Applsci 12 09535 g027
Table 1. Quantitative analysis results of the point cloud model.
Structural ElementNumber of PointsPoint Density (pts/m2)
East facade755,4245502
West facade902,9864386
North facade15,022,9816351
South facade14,858,6476533
Roof slab19,793,3975182
Base slab6,799,7133742
Structural column2,252,2905513
Table 2. A display of columns in the point cloud and BIM that exceed or do not exceed the tolerance.
Exceed ToleranceNot Exceed Tolerance
Applsci 12 09535 i001Applsci 12 09535 i002Applsci 12 09535 i003Applsci 12 09535 i004
C-2A-2A-4C-12
Applsci 12 09535 i005Applsci 12 09535 i006Applsci 12 09535 i007Applsci 12 09535 i008
B-35B-36A-12A-13
Applsci 12 09535 i009Applsci 12 09535 i010Applsci 12 09535 i011Applsci 12 09535 i012
B-34C-6B-15B-17
Applsci 12 09535 i013Applsci 12 09535 i014Applsci 12 09535 i015Applsci 12 09535 i016
A-5A-7B-20B-32
Table 3. The SCDM and ADD results of structural columns that exceed the tolerances.
Structural ColumnSCDM (mm)ADD (°)
A-280.51.55
C-272.60.39
B-3650.90.19
B-3548.10.36
B-3438.30.64
C-636.60.41
A-536.60.39
A-732.80.94
C-1332.10.65
Publisher’s Note: MDPI stays neutral with regard to jurisdictional claims in published maps and institutional affiliations.