Abstract
This research describes an experimental solution used for estimating the positions of pedestrians from video recordings. Additionally, clustering algorithms were utilized to interpret the data. The system employs the You Only Look Once (YOLO) algorithm for object detection. The detection algorithm is applied to video recordings provided by an unmanned aerial vehicle (UAV). An experimental method for calculating the pedestrian’s geolocation is proposed. The output of the calculation, i.e., the data file, can be visualized on a map and analyzed using cluster analyses, including K-means, DBSCAN, and OPTICS algorithms. The experimental software solution can be deployed on a UAV or other computing devices. Further testing was performed to evaluate the suitability of the selected algorithms and to identify optimal use cases. This solution can successfully detect groups of pedestrians from video recordings and it provides tools for subsequent cluster analyses.
1. Introduction
It is a common practice to estimate traffic loads in specific locations. However, doing the same with pedestrians is rather rare. The detection of pedestrians (along with the deployment of clustering techniques) may provide a means to limit the spread of COVID-19. Due to the COVID-19 pandemic, many object detection systems have been developed to monitor the situation and provide pandemic mitigation measures. There are systems that feature drug delivery [1], disinfection spraying [2], face mask detection, or body temperature detection; however, there is the potential for more general-purpose systems that could be used even after the COVID pandemic.
Our objective was to estimate where people form groups using input from unmanned aerial vehicles (UAVs). To do this, it is necessary to know their positions and numbers. To achieve this, a detection process is required. There are many approaches to the detection process, e.g., neural networks (NN), support vector machine (SVM), or clustering techniques [3,4]. Once detected, we can estimate locations following our proposed algorithm; the output is then used by the clustering algorithm.
Such information may have a dramatic impact on where to establish stores, which paths to keep, or even build; other use cases may even be related to the military (to track the formations of groups of people).
Our contributions to this paper are as follows:
- We propose a comprehensive system for the detection of pedestrians, estimations of their locations based on UAV data, and evaluations of their ’groupings’; based on this, we could obtain a visual representation in the form of a heat map.
- We designed and tested our approach for estimating the geolocations of pedestrians.
- To provide more variability, the solution was separated into three individual parts: UAV as the source of the visual data and their locations; the application for detection and estimation of pedestrian geolocations; and the web interface for the end user, which implements clustering algorithms. The solution was designed to be universal and utilizable on various UAV devices.
2. Algorithms of Pedestrian Detection from Images
To analyze groups of pedestrians, it is first necessary to have a means of gathering the required data. Data can be represented in many forms, but the most basic and efficient abstraction may involve representing people as points with their locations and time of detection. Modern devices can provide accurate time readings. The remaining issue involves determining the precise locations of pedestrians at any given moment. To detect the positions of people in a video frame, we employ methods of computer vision, namely object detection. A suitable algorithm, in our case YOLO, is used to perform detection on an image frame. The algorithm then proceeds to mark rectangular areas containing each of the detected objects. Furthermore, these objects can be filtered based on their class, which makes it possible to display people and disregard all of the remaining objects.
2.1. Histogram of Oriented Gradients
A histogram of oriented gradients (HOG) is an older algorithm of object detection; however, it is still very popular for human recognition, see [5] or [6]. Unlike most modern algorithms, a HOG is based on feature detection rather than being trained as a neural network. This means that it follows certain computational steps and does not require training. The first step of the algorithm is to normalize the gamma and color of a given image frame. The step is not always required, but it is often used as a means of preparing the image for gradient calculation. The gradients are calculated using a Gauss filter, which simplifies the image at the cost of some data loss. To further simplify the process of detection, the image is divided into smaller image cells. A weighted voting system is then utilized to evaluate each pixel. The output values from voting for each pixel are assigned to each histogram cell.
For many reasons, such as insufficient lighting, the contrasts of different cells may not be properly adjusted. Mitigating this problem involves using a sliding window of so-called “blocks”. A block is a square-shaped area consisting of four or more histogram cells. The HOG algorithm slides select blocks over all of the cells and normalize the gradient values. The normalized blocks are labeled as histograms of oriented gradients and can be used for object classification. Support vector machines are employed to classify objects based on gathered histogram data.
The HOG algorithm, along with a specific machine learning algorithm, has also been tested for pedestrian detection by Oliveira and Wehrmeister [7]. They report that better results are achieved by the convolutional neural network (CNN). We also considered the HOG algorithm but it will not be used in the proposed solution.
2.2. YOLO Algorithm
One of the most popular and influential algorithms in recent years has been YOLO [8] (i.e., “You Only Look Once”). The algorithm delivers precisely what the name suggests, i.e., the detection is performed by iterating over every image sector only once. Rather than viewing object detection as a classification problem, YOLO follows the route of regression detectors. The image frame is divided into smaller segments that can vary in size. By performing detection over these segments, the algorithm cannot only determine the class of an object but also its bounding boxes relative to the image segments.
YOLO achieves much of its efficiency by utilizing the MobileNet [9] neural network. Similar to the YOLO algorithm, MobileNet is highly optimized for speed and resources. In essence, this means that the neural network is primarily designed for low-power computing systems, e.g., unmanned aerial vehicles or mobile devices (see the comparison of the performance of YOLO v3, v4, and v5 by Nepal and Eslamiat [10]). However, given its efficient design, it can be utilized by more computationally capable systems as well.
Despite its efficiency and popularity, the YOLO algorithm faces several problems, including limitations in how many objects can be detected per image, the efficiency of detection in varying image resolutions, and small object detection. These problems can be alleviated (as YOLO is highly configurable) but they can also provide challenges in certain implementations.
The YOLO algorithm was used by Shao et al. [11] for the detection of pedestrians when using UAVs (similar to this research). The authors achieved an AP (average precision) of 93.2% for YOLOv3, while mask R-CNN achieved 95.5%; the method based on YOLOv3, called AIR-YOLOv3, reached 91.5%. Other similar [12] research using the YOLOv3 tiny method reported 99.8% accuracy in testing. Ma et al. [13] used a more novel version of YOLOv4; the authors reported an even smaller AP for the detection of pedestrians—YOLOv3 (59.54%) and YOLOv4 (74.34%).
2.3. R-CNN Algorithm
Newer methods of object detection employ neural networks to provide state-of-the-art efficiency. This has allowed modern algorithms to greatly surpass the old methods, which employ the use of detection by comparing segments of image frames. This distinction changed after algorithms, such as the region-based convolutional neural network (R-CNN) [14], were proposed. In other words, R-CNN combines newer and older techniques to optimize object detection even further. Moreover, R-CNN uses two separate forms of training to increase the robustness of the results. First, the model is pre-trained on high-quality data with supervision to accelerate the training. This is followed by unsupervised domain-specific training on low-quality data. This ensures that the model is capable of object detection (even with sub-optimal data) and prevents overfitting.
Recognition using regions [15] is used to segment images and provide the first iteration of object detection. Objects are viewed as compounds of several parts, which together form an object. For example, in the case of detecting a car, it can be divided into several parts, such as wheels, doors, etc. These can be further subdivided, e.g., tires can be viewed as separate parts of a wheel. The process of segmentation increases detection robustness as it allows for objects to be partially obstructed. A car will be detected as a car, even if one of the wheels is not visible, as long as the rest of the regions are detected. Although R-CNN is generally much slower than most of the other state-of-the-art algorithms, the provided detection robustness and accuracy make this algorithm widely used.
Over the last few years, R-CNN has evolved and several improved versions of the algorithm were proposed. Perhaps one of the most used versions is faster R-CNN [16], which improves the computational speed of the algorithm (e.g., used by Liu et al. [17] in their proposed drone detection method). Mask R-CNN [18] provides a way to outline a detected image instead of only providing a rectangular detection window. It is also based on faster R-CNN. The efficiency of this method was proved by several types of research studies that also utilized input from UAVs. Zhang et al. [19] used it for the segmentation and identification of canopy. Yu and Nishio [20] utilized it along with YOLOv3 in a bridge inspection via UAV, with an accuracy of over 90%. Despite this speed optimization, it is necessary to note that R-CNN variations still achieve lower speeds than most of the other state-of-the-art algorithms. The main benefit of using R-CNN is its robustness and accuracy. Despite the benefits, R-CNN has proven to be less efficient than YOLO [8] during experimental testing.
R-CNN methods used on UAV output were used in research by Hung et al. [21]. The authors reported close results in pedestrian detection when compared to YOLO algorithms, both having precisions of approximately 97%. Another research study [22] focused on the detection of trees, reporting a precision of 95.65%. The authors post-processed the imagery from UAVs.
2.4. SSD Algorithm
A single shot multibox detector (SSD) [23] is one of the newest state-of-the-art algorithms. The algorithm’s advantage is based on its ability to detect objects by using a single neural network under various image resolutions. This is attained through the creation of feature maps for a multitude of resolutions, which are subsequently combined to provide maximum robustness. Additionally, it employs a mechanism for the accurate determination of bounding boxes. The algorithm predicts directional offsets for bounding boxes during the class prediction phase. The algorithm offers competitive accuracy and speed. However, SSD also faces several problems, which are common among many similar algorithms, i.e., small object detection. This is further amplified by the need for correcting the bounding boxes during the prediction phase. SSD is nevertheless a highly efficient and popular algorithm.
Even though SSDs are widely used in experimental testing, the YOLO algorithm is proven to be the better solution, as confirmed by [24]. The decision to use the YOLO algorithm stems from the combined efficiency, robustness, and ease of configuring the algorithm compared to the other discussed options.
Research on the detection of grain from UAV imagery was conducted by Li, Wang, and Huang [25]; the authors compared SSD to YOLOv4 and reported the latter to be superior. Another research [26] study evaluated SSD and faster R-CNN algorithms for human detection in aerial thermal images. The authors concluded that SSD methods are suitable for real-time applications, while faster R-CNN is better in terms of accuracy.
3. Cluster Analysis
Object detection provides the means to localize pedestrians from video frames. These raw data do not provide a lot of useful information on their own and require further processing. A highly efficient way of organizing and evaluating data involves the use of cluster analyses. Clustering algorithms are used to divide data points into useful groups, so-called clusters. Assigning data points into groups is based on similarity, given a certain metric, e.g., distance or density. This section categorizes different clustering algorithms based on the categories chosen by Raschka [27] in a contribution from 2015.
3.1. Centroid-Based Clustering
Centroid-based clustering divides data points into clusters based on the distance from the cluster center. Algorithms of this type start with a predetermined amount of clusters to create. Centroids, i.e., central points of clusters, are then chosen and data are assigned to them based on distance. The centroid positions are adjusted over several iterations to find the best cluster division. Perhaps the most widely used and well-known algorithm of this type is K-means, which follows these steps:
- Choose the K value determining the cluster count.
- Assign data points into clusters based on distance.
- Calculate new cluster centers.
- Repeat steps 2 and 3 until the K clusters are chosen, i.e., no or a very small amount of data points are changing the assigned clusters.
As mentioned, the algorithms of centroid-based clustering depend on the prior choice of the cluster amount. This is equally true for K-means, which requires the user to specify a positive integer K as the number of clusters. This is very simple and intuitive. Therefore, it is easy to predict the outcomes and choose the correct value of K.
3.2. Hierarchy-Based Clustering
Hierarchy-based clustering is based on the fact that it is possible to know the distances between each data point right from the outset. In other words, if our goal is to create clusters containing points with the lowest relative distances, then it is possible to create a distance-based hierarchy of clusters from singular points to a single cluster. The final cluster encompasses all of the data points. This can be achieved by following two different directions, as discussed by Raschka [27]. Firstly, we can start with a single cluster and divide it into smaller clusters. This occurs over several iterations until each cluster contains only one point and is no longer divisible. Secondly, it is possible to start by assigning each point to its cluster and keep merging the clusters over several iterations until only one remains. This is an example of hierarchy-based clustering, which follows the second method:
- Calculate the distance matrix between every point.
- Assign each data point into its cluster.
- Connect the two nearest clusters based on distance.
- Recalculate the matrix (hierarchy).
- Repeat steps 2, 3, and 4 until only one cluster remains.
The obvious advantage of using hierarchy-based clustering is that the hierarchy is calculated implicitly. There is no need for any input from a user, such as the number of clusters in the K-means algorithm. Huang et al. [28] used this algorithm along with YOLO to detect and recognize elements of road traffic, yielding the mAP (mean Average Precision) of 90.45%. Perhaps the only real disadvantage is that the resulting hierarchy needs to be processed further to provide clear data, which may undermine the reasons to avoid implementations such as K-means in the first place.
3.3. Density-Based Clustering
A great disadvantage of many clustering algorithms is that they are limited in cluster shapes. For instance, the K-means algorithm is only capable of producing circular clusters as the assignment of data points is always based on the distance from the cluster center. Figure 1 shows an example of clusters formed irregularly. If we wish to analyze these two parallel streets separately, it is impossible to do so with distance-based forms of clustering. In the displayed example, points A1 and A2 as well as B1 and B2 are further apart from each other than A1 from B1 and A2 from B2. Therefore, applying algorithms such as K-means would cause the closest points to be assigned to the same clusters, which would not achieve this irregular shape. However, the analysis of such non-circular shapes is possible with the use of so-called density-based clustering.
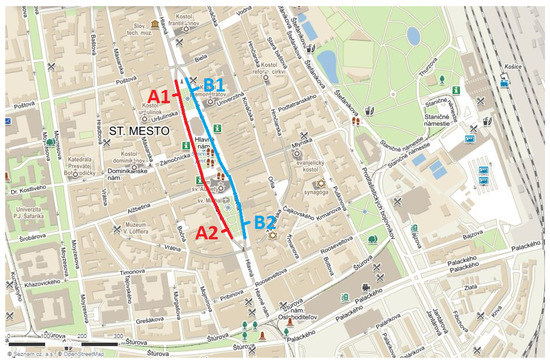
Figure 1.
Two clusters (red and blue) with non-circular shapes.
One of the most famous density-based algorithms is DBSCAN (density-based spatial clustering of applications with noise). This algorithm defines density as the number of data points in a specific radius and the parameter . DBSCAN defines three types of points. A core point is a point that contains at least points within its radius. A border point is a point that has less than points within its radius but exists within the radius of at least one core point. All other data points are considered to be noise and they are not taken into consideration. Finally, connected core points are core points located within each other’s radius. The algorithm goes as follows:
- Assign the correct point type to each data point.
- Create a cluster for each core point or a group of connected core points.
- Assign every border point to the cluster of its nearest core point.
This implementation of the algorithm ensures that virtually any connected shape can be represented as its cluster. Therefore, the analysis of various shapes of data, such as two parallel streets, is possible. Hierarchical DBSCAN has been successfully implemented by Fekry et al. [29] for clustering of a canopy cover acquired by UAV. Very similar functionality is also provided by the OPTICS algorithm. As such, both of these algorithms can be utilized to achieve similar results.
3.4. Distribution-Based Clustering
One of the problems with clustering based on distance is that the shapes are limited. The solution to this problem was shown in the previous section using density-based methods. However, in some situations, it may be beneficial to retain the flexibility of algorithms, such as K-means, i.e., requiring only the target number of clusters, rather than setting up more complicated values for radii and point amount thresholds. Distribution-based clustering answers this by employing a similar technique to K-means while allowing not only circular but also elliptical shapes.
One of the most used algorithms of this type is the Gaussian mixture model (GMM). The way the algorithm operates is that it estimates the center and standard deviation for each cluster. These two values, together with the number of K clusters, form the algorithm’s parameters. After initialization of these values, the algorithm follows these steps:
- For every data point, calculate the probability that it belongs to each of the clusters, based on the distance to the cluster centers.
- Recalculate the parameters to maximize the probabilities.
- Repeat the previous steps until (1) maximization of the probabilities or (2) stagnation.
The initial values for the centers of clusters and standard deviations may be chosen randomly at first. The values are optimized with each algorithm iteration. The final result is similar to K-means but with more flexibility in the cluster shape.
The experimental solution utilizes algorithms—K-Means, DBSCAN, and OPTICS. K-mean provides a way to cluster data into a specified amount of groups based on distance, which proves to be a simple and efficient way of cluster analysis. For more specific cases with irregular data shapes, DBSCAN and OPTICS are utilized.
4. Materials and Methods
The goal of this research described was to estimate the locations of pedestrians, detect the groups of pedestrians, and visualize the possible forming of groups. The proposed experimental solution is divided into three individual parts, visualized in Figure 2. The first component is an unmanned aerial vehicle (UAV), which is responsible for providing video recordings and additional data about the location and time of the recording. The second component is the application written in Python language for processing the input from the UAV and calculation of the pedestrians’ positions. The method is further discussed in Section 4.1. The data file from the second component is input to the last, the web application, being a graphical user interface (GUI), which implements clustering algorithms to visualize the formation of groups; more is discussed in Section 4.2.
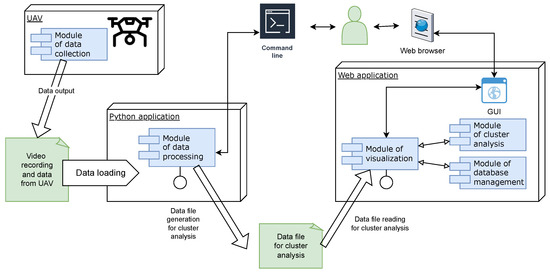
Figure 2.
Component diagram of the designed system.
The approaches mentioned in the YOLO Section 2.2 of the analysis presume that detection is done on the UAV. In the case of this research, we provide the option to separate the detection from the UAV to the separate machine. This approach still allows a near real-time detection process or later post-processing. The Python application may also be applied to the UAV.
As mentioned, the video and data file from a UAV is processed by the designed Python application. The YOLOv3 algorithm [8] is used to detect pedestrians. This algorithm provides faster speeds at the cost of some accuracy. Our method to calculate the real-world location of pedestrians based on their positions in an image frame is proposed to achieve visualization of the pedestrians’ positions and visualize the formation of possible groups.
The data file produced by the designed Python application is further utilized by a web application. The data are provided by a database management module. This means that the data can be stored and analyzed over several video recordings and long periods. Clustering analysis algorithms, such as K-Means, DBSCAN, and OPTICS, were implemented for visualization.
4.1. Pedestrian Localization from Video
Object detection performed by the YOLO algorithm [8] resulted in an output of rectangular bounding boxes. The bounding boxes represent video frame segments containing certain objects, e.g., pedestrians. However, these data are insufficient for providing the real-world locations of people on their own. Suppose we have (x, y) coordinates of each detected person within an image frame. To transform these coordinates into real-world geographical locations, the following steps must be performed:
- Calculation of the offset position relative to the image center (in pixels).
- Conversion of all offsets into angles in degrees.
- Acquisition of horizontal and vertical camera angles.
- Calculation of the direction of a detected person.
- Calculation of the “flat” distance between a person and the camera.
- Conversion of meters into geographic distances.
- Calculation of latitude and longitude.
An important factor for successful calculations is the knowledge of the field of view (FOV) of the camera, as well as the resolutions of the video recordings. A typical example could be a FOV of 90 degrees and a resolution of 1920 × 1080 pixels. Additionally, there is a distinction between horizontal and vertical FOV. Both of these values are required for accurate localization (from a video). However, it is common practice to only include the information about a horizontal FOV, which is why our implementation uses this method for calculating vertical FOV from horizontal FOV:
where is a vertical FOV in radians (See Figure 3), is a horizontal FOV in radians, and represents the camera resolution. Additionally, it is necessary to convert this value to degrees; this is done by calculating horizontal and vertical offsets of points relative to the center of the image frame. This ensures that all resulting angles in the later calculations will be relative to the camera center. With the knowledge of the vertical and horizontal fields of view and the relative offsets, the degree angles of the offsets can be calculated. The calculations of horizontal and vertical angles are as follows:
where and represent the horizontal and vertical offsets in degrees, and are the horizontal and vertical offsets in pixels, w is the width, and h is the height of the video frame. Additionally, the vertical angle is flipped. This ensures that positive vertical values will face up, whereas negative vertical values will face down; thus, the detected objects will be below the camera’s center, as opposed to the default orientation in OpenCV.
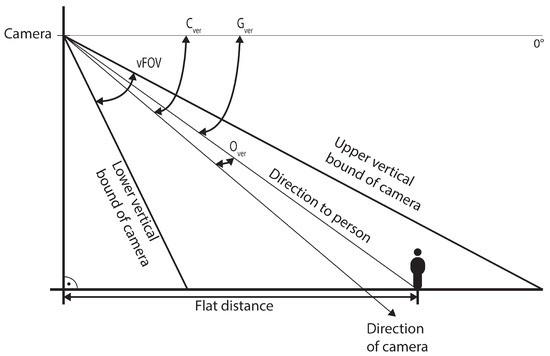
Figure 3.
Vertical angles.
Calculating the geographic coordinates of a person is impossible without the knowledge of the latitude, longitude, altitude, and camera rotation in the vertical and horizontal directions. When using a video recording from a UAV, it is necessary to acquire the data per frame, as the pedestrian is not stationary and the values change. As per camera rotation, we assume the knowledge of the global horizontal and vertical orientation of the camera. We define 0 degrees as the vertical angle of the horizon, negative values as facing down, and positive values as facing up. The horizontal angle is relative to the north, which is represented as 0 degrees. The values change from 0 to 360 degrees in the clockwise direction on a map. Given the knowledge of camera angles as well as the angle offsets of the detected people, it is possible to calculate their global angles, these are acquired as follows (see Figure 4):
where and , in degrees, represent the global horizontal and vertical angles of a person relative to the UAV. Values and are the horizontal and vertical angles of the camera.
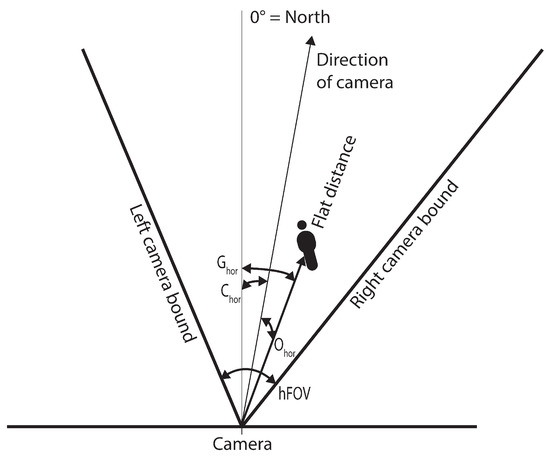
Figure 4.
Horizontal angles.
Given the knowledge of the altitude difference between the ground and UAV, it is possible to calculate the flat distance between the UAV and a detected person. Flat distance is the distance between objects without taking altitude into account. We use the following equation to calculate the distance:
where is the flat distance between the camera and an object, is the height difference, represents the conversion between degrees and radians, and, finally, is the previously acquired global vertical angle. The resulting distance is represented in meters by default. To convert the value into geographic coordinates, a conversion equation is as follows:
since a geographic degree represents an approximate distance of km in metric units, we multiply this value by 1000 to convert it into meters. The result of the following division is , which is the geographic distance in degrees.
Given the knowledge of geographic distance and the global horizontal angle , it is possible to calculate the geographic directional vector P. This vector specifies the exact location of a person relative to the UAV. We calculate this using the following equations:
where is the geographic distance in latitude and is an analogous value for longitude. If we are given the geographic location of the UAV, which we may represent as , then it is finally possible to calculate the real-world geographic coordinates of a detected person. By performing the addition between the P and D vectors, we acquire the latitude and longitude of the person as . These values are saved into an output data file, together with the video frame timestamp for the subsequent cluster analysis.
4.2. Visualization of Groups Through Clustering
The data visualization are performed by a web application developed in ASP.NET. The application allows the loading of data from files and storing them into a database. This enables the user to analyze data from several sources even over longer periods of time. With data available, the user is provided with the option to select the area and time range for the analysis.
After selecting the area and time, the user may begin the process of cluster analysis. Figure 5 shows the default heatmap of data points. In addition, the user is provided with several options for analysis. Other than the default heatmap, algorithms (K-means, DBSCAN, and OPTICS) are also provided.
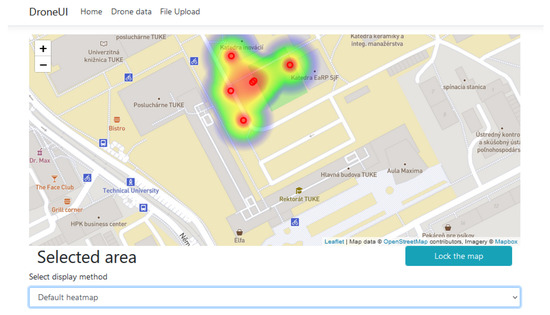
Figure 5.
Data points displayed using a heatmap.
The displayed heatmap may be switched between the mode to display each point individually or to show only the heatmap of the cluster center. Additionally, the different points can be connected for better visualization. Lastly, each cluster center can be displayed in the form of a blue marker, as seen in Figure 6. The selection of a given marker provides further information about the number of people in the cluster, as well as the average and minimum distance between people within the cluster.
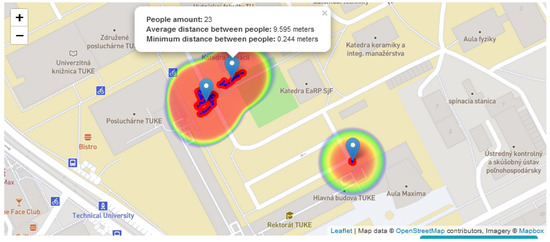
Figure 6.
Cluster analysis using K-means algorithm.
5. Results
Object detection models and their variations were tested on free stock available video data and our own imagery from UAV, with parameters such as different resolutions or detection distances. Estimations of the pedestrians’ positions are shown in the example of the single detected pedestrian. The solution for cluster analysis was tested on UAV imagery gathered from the city of Košice.
5.1. Object Detection Testing
During the testing of object detection, several different algorithms were selected and compared under various conditions. These data provided useful feedback for the implementation of the proposed experimental solution. The main algorithms considered were YOLO [8] and mask R-CNN [18]. The YOLO algorithm was tested with various input blob resolutions, which highly affected the speed and detection count of the algorithm.
Table 1 includes the results of testing given the main tested configurations. The detection was performed from distances of around 30 to 50 m and an image resolution of 1920 × 1080 pixels. The results show an increase in detection relative to the increase in input resolution, as well as an increase in the image processing time. This is to be expected, as higher resolution inputs contain more data to iterate through. Interestingly, the detection efficiency stagnates and falls after about 1248 × 1248 input resolution. Furthermore, mask R-CNN has shown a lower detection to time ratio than YOLO. Even at input blob resolutions of 608 × 608 pixels, YOLO achieves not only more true positive detections but also lower processing times than mask R-CNN.

Table 1.
Pedestrian detection from distance. Resolution 1920 × 1080. Number of pedestrians 24.
Another set of testing was performed on video data with shorter detection distances of 10 to 30 m. Additionally, the video recording contained dense groups of people. This provided an efficient method of testing the accuracies in highly populated areas, as shown in Table 2. Several observations were made; firstly, the YOLO algorithm continued to outperform mask R-CNN in the detection to processing time ratio. Similarly, the number of detections increased steadily with the increase in input blob resolution. However, unlike during the detection from higher distances, the resolution of 2496 × 2496 pixels had an increase in detection compared to lower resolutions. Despite this, YOLO 1248 × 1248 continued to outperform other configurations in accuracy, while maintaining high detection speeds.

Table 2.
Pedestrian detection from a low distance. Resolution 1920 × 1080. Number of pedestrians 323.
The YOLO [8] algorithm proved to be highly efficient in detection under all of the tested conditions. The blob input resolution of 1248 × 1248 proved to provide the highest efficiency in terms of detection count and processing time ratio. The configuration was selected during the experimental system implementation. Figure 7 shows the application of the selected configuration on an image containing a large cluster of pedestrians from short and high distances respectively.

Figure 7.
Sample of pedestrian detection from a low distance (left) and high distance (right).
5.2. Estimating the Position of Pedestrians
In this section of the paper, we present the testing of the proposed algorithm for the estimation of the pedestrians’ coordinates. The input data used in this scenario are sample real-world data from the campus of the Technical University of Košice. The position of a pedestrian in the image was and , both in pixels, see Figure 8.
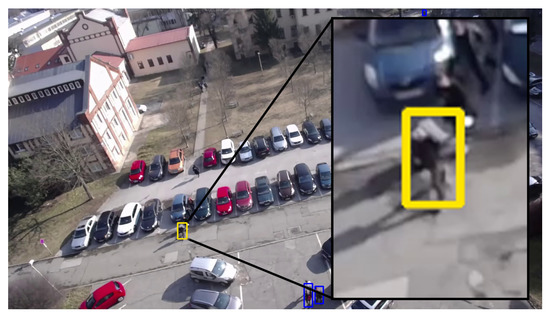
Figure 8.
Estimating the position of a pedestrian—highlighted in the yellow square.
Thus, offset to the center of the image is:
where h is the height of the image, in this case, 1920 pixels. Using Formulas (2) and (3), we get:
Results of (Equation (4)) and (Equation (5)) are then:
where is the horizontal degree of and is the vertical degree of , both as received from UAV.
Calculation of the flat distance between the UAV and a detected person follows the Formula (6):
where is the altitude from UAV and is equal to 29 m. Note that this is not the result of . Finally, we can obtain geographic coordinates following Formula (7):
Knowing the and the geographic distance in latitude and longitude we obtain:
The input values of latitude and longitude are provided by the UAV.
The final estimated position is depicted in Figure 9, on the left, and the real position of the person is on the right. The overall deviation to real value is up to 2 m. Analogous deviations were reported for another testing of the algorithm. Deviation in the final results is due to inaccurate data from the UAV (angle of camera and altitude).
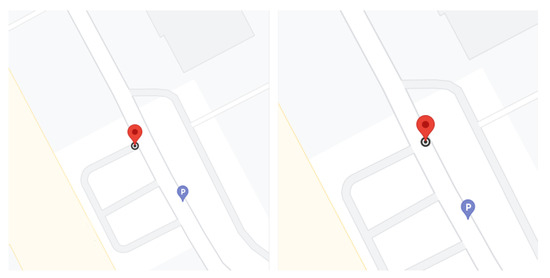
Figure 9.
The estimation position of the pedestrian (left). The real position of the pedestrian (right).
5.3. Clustering Functionality Testing
Cluster analysis in this development stage serves to visualize the groups of pedestrians (clusters). Figure 6 shows the use of the K-means algorithm for separating data points into three individual clusters. This has been achieved by choosing its parameter K value of 3. The algorithm performed as expected given the input data and parameters. Additionally, density-based algorithms DBSCAN, OPTICS, and K-means were tested. The first two proved capable of successfully clustering data of the non-circular shape. To show this, a scenario similar to the one shown in Section 3.3 was established. This can be seen in Figure 10, where two parallel streets see separate pedestrian clustering. Density-based clustering algorithms are capable of determining the correct locations of cluster centers, as indicated by the blue markers. Additionally, the positions of data points have accurately reflected the actual geographical locations of detected people. However, as for the K-means algorithm, the algorithm failed to separate these data correctly. This is also depicted in Figure 10.

Figure 10.
Analysis of irregular cluster shapes using DBSCAN (left) and K-means (right).
6. Discussion
The collected data were compared in terms of the efficiency and speed of the described algorithms and their setup. Configurations with different video resolutions, distances, and visibilities were tested, whether due to different lighting, tilt angles, or image focus. It was found that virtually all conditions were better handled by the YOLO [8] algorithm. The algorithm surpassed the competing mask R-CNN [18] algorithm for both short and long-distance detection. Another output from the testing was the most optimal choice of video input resolution to create a so-called blob video, which served as an input to the selected YOLO object detection algorithm. The configuration with 1248 × 1248 blob input resolution proved to be highly computationally efficient concerning speed and detection capabilities. The YOLO algorithm is widespread mainly due to its use in low-performance devices and, therefore, despite the loss of speed, it should also be efficient when running on the UAV device.
Detection outputs proved the high accuracy and robustness of detection under given conditions, i.e., suitable distance, lighting, and video quality. The result yields a preference for a camera with a resolution of at least 1920 × 1080 pixels with a horizontal field of view of 90 degrees and a height above the ground of up to 30 m. The algorithm is recommended for performing detection when there are no sudden or rapid changes in camera rotation.
Testing on the estimations of the geo-positions of pedestrians was performed using data obtained from the campus of the Technical University in Košice; their positions were mapped to the appropriate geographical coordinates. Data were then stored in the database. Subsequently, it was possible to display the output on the map and perform a cluster analysis. The detection and estimation of their positions were accurate, with a precision of up to 2 m. This confirms the functionality of the algorithm we proposed and implemented to convert the position from the image to the actual geographical position.
The cluster analysis was available as a part of the experimental software solution. The algorithms exhibited the expected behavior and provided efficient visualization of data points, thermal maps, and map markers.
The proposed solution can quickly and robustly detect people from the camera and calculate the geographical locations of pedestrians from the image. The object detection algorithm YOLO [8] is proven to be highly efficient within a height of up to 30 m. The selected clustering algorithms (K-means, DBSCAN, and OPTICS) also performed as expected and were successfully applied to regularly and irregularly shaped data. Further improvements to the system can be made by improving the accuracy and robustness of object detection from higher distances and providing more useful metrics alongside cluster visualization.
7. Conclusions
The research focused on the detection of groups of pedestrians with subsequent estimations of their geolocations and cluster analyses performed on the geolocation results. The YOLOv3 algorithm was used for the detection of pedestrians. We conclude that the highest efficiency was achieved with the YOLO algorithm having an input blob resolution of 1248 × 1248. The geolocations of pedestrians were based on the original authors’ solution for calculating the real geographical location of pedestrians from a video recording. Coordinates of the pedestrians yielded deviations up to 2 m. The solution uses K-means, DBSCAN, and OPTICS clustering algorithms. All algorithms were able to correctly and efficiently visualize groups of people on the map. However, for the highly irregular shapes of data, DBSCAN and OPTICS provide better alternatives.
The main contribution of the research is the possibility to extract the geolocations of pedestrians and determine the formation of groups. The system is robust for UAV flight, at an altitude of about 30 m above the ground, with a minimum video resolution of 1080p. Due to the separation of the system (into a user web application and a processing program), it is also possible to transfer processing to different devices. The whole system is composed of two separate parts. The first is a Python application, which is responsible for detecting pedestrians from video recordings and determining their real geographical locations. Due to its implementation in Python, the program can run on a wide variety of hardware, e.g., UAVs or desktop computers. The output of this part of the system is a data file with the geographical coordinates of pedestrians at the time of detection. This file is then used as input to the second program, implemented as a web application in ASP.NET. This application is responsible for storing the obtained data in a database, filtering, and selecting data for analysis, as well as selecting clustering algorithms.
Due to the use of a highly efficient YOLOv3 algorithm, object detection can be performed on a vast variety of hardware, e.g., desktops, UAVs, etc. Further improvements in robustness, analysis tools, and additional terrain testing may be considered. YOLOv5 or newer versions may be utilized to further improve detection accuracy.
Author Contributions
Conceptualization, O.K. and M.G.; methodology, M.M.; software, M.G.; validation, F.J. and M.M.; formal analysis, F.J.; investigation, O.K.; resources, F.J.; data curation, M.G.; writing—original draft preparation, O.K. and M.G.; writing—review and editing, M.M. and F.J.; visualization, M.M.; supervision, F.J.; project administration, O.K.; funding acquisition, F.J. All authors have read and agreed to the published version of the manuscript.
Funding
This research received no external funding.
Institutional Review Board Statement
Not applicable.
Informed Consent Statement
Not applicable.
Data Availability Statement
Not applicable.
Acknowledgments
This publication was realized with support from the Operational Programme Integrated Infrastructure in frame of the project: Intelligent systems for UAV real-time operation and data processing, code ITMS2014+: 313011V422, and co-financed by the European Regional Development Fund.
Conflicts of Interest
The authors declare no conflict of interest.
References
- Sham, R.; Siau, C.S.; Tan, S.; Kiu, D.C.; Sabhi, H.; Thew, H.Z.; Selvachandran, G.; Quek, S.G.; Ahmad, N.; Ramli, M.H.M. Drone Usage for Medicine and Vaccine Delivery during the COVID-19 Pandemic: Attitude of Health Care Workers in Rural Medical Centres. Drones 2022, 6, 109. [Google Scholar] [CrossRef]
- Restás, Á.; Szalkai, I.; Óvári, G. Drone Application for Spraying Disinfection Liquid Fighting against the COVID-19 Pandemic—Examining Drone-Related Parameters Influencing Effectiveness. Drones 2021, 5, 58. [Google Scholar] [CrossRef]
- Nawaz, M.; Yan, H. Saliency Detection Using Deep Features and Affinity-Based Robust Background Subtraction. IEEE Trans. Multimed. 2021, 23, 2902–2916. [Google Scholar] [CrossRef]
- Nawaz, M.; Qureshi, R.; Teevno, M.A.; Shahid, A.R. Object detection and segmentation by composition of fast fuzzy C-mean clustering based maps. J. Ambient. Intell. Hum. Comput. 2022. [Google Scholar] [CrossRef]
- Patel, C.I.; Labana, D.; Pandya, S.; Modi, K.; Ghayvat, H.; Awais, M. Histogram of Oriented Gradient-Based Fusion of Features for Human Action Recognition in Action Video Sequences. Sensors 2020, 20, 7299. [Google Scholar] [CrossRef] [PubMed]
- Chen, G.-H.; Ni, J.; Chen, Z.; Huang, H.; Sun, Y.-L.; Ip, W.H.; Yung, K.L. Detection of Highway Pavement Damage Based on a CNN Using Grayscale and HOG Features. Sensors 2022, 22, 2455. [Google Scholar] [CrossRef] [PubMed]
- De Oliveira, D.C.; Wehrmeister, M.A. Using Deep Learning and Low-Cost RGB and Thermal Cameras to Detect Pedestrians in Aerial Images Captured by Multirotor UAV. Sensors 2018, 18, 2244. [Google Scholar] [CrossRef] [PubMed]
- Redmon, J.; Divvala, S.; Girshick, R.; Farhadi, A. You only look once: Unified, real-time object detection. In Proceedings of the IEEE Conference on Computer Vision and Pattern Recognition, Las Vegas, NV, USA, 27–30 June 2016. [Google Scholar] [CrossRef]
- Howard, A.G.; Zhu, M.; Chen, B.; Kalenichenko, D.; Wang, W.; Weyand, T.; Andreetto, M.; Adam, H. Mobilenets: In Computer Vision and Pattern Recognition. arXiv 2017, arXiv:1704.04861. [Google Scholar]
- Nepal, U.; Eslamiat, H. Comparing YOLOv3, YOLOv4 and YOLOv5 for Autonomous Landing Spot Detection in Faulty UAVs. Sensors 2022, 22, 464. [Google Scholar] [CrossRef]
- Shao, Y.; Zhang, X.; Chu, H.; Zhang, X.; Zhang, D.; Rao, Y. AIR-YOLOv3: Aerial Infrared Pedestrian Detection via an Improved YOLOv3 with Network Pruning. Appl. Sci. 2022, 12, 3627. [Google Scholar] [CrossRef]
- Liu, C.; Szirányi, T. Real-Time Human Detection and Gesture Recognition for On-Board UAV Rescue. Sensors 2021, 21, 2180. [Google Scholar] [CrossRef] [PubMed]
- Ma, X.; Zhang, Y.; Zhang, W.; Zhou, H.; Yu, H. SDWBF Algorithm: A Novel Pedestrian Detection Algorithm in the Aerial Scene. Drones 2022, 6, 76. [Google Scholar] [CrossRef]
- Girshick, R.; Donahue, J.; Darrell, T.; Malik, J. Rich feature hierarchies for accurate object detection and semantic segmentation. In Proceedings of the IEEE Conference on Computer Vision and Pattern Recognition, Columbus, OH, USA, 23–28 June 2014. [Google Scholar] [CrossRef]
- Gu, C.; Lim, J.J.; Arbelaez, P.; Malik, J. Recognition using regions. In Proceedings of the IEEE Conference on Computer Vision and Pattern Recognition, Miami, FL, USA, 20–25 June 2009. [Google Scholar] [CrossRef]
- Ren, S.; He, K.; Girshick, R.; Sun, J. Faster R-CNN: Towards Real-Time Object Detection with Region Proposal Networks. In Advances in Neural Information Processing Systems 28; Cornell University: Ithaca, NY, USA, 2015. [Google Scholar] [CrossRef]
- Liu, S.; Li, G.; Zhan, Y.; Gao, P. MUSAK: A Multi-Scale Space Kinematic Method for Drone Detection. Remote Sens. 2022, 14, 1434. [Google Scholar] [CrossRef]
- He, K.; Gkioxari, G.; Dollar, P.; Girshick, R. Mask R-CNN. In Proceedings of the IEEE International Conference on Computer Vision, Venice, Italy, 22–29 October 2017. [Google Scholar] [CrossRef]
- Zhang, C.; Zhou, J.; Wang, H.; Tan, T.; Cui, M.; Huang, Z.; Wang, P.; Zhang, L. Multi-Species Individual Tree Segmentation and Identification Based on Improved Mask R-CNN and UAV Imagery in Mixed Forests. Remote Sens. 2022, 14, 874. [Google Scholar] [CrossRef]
- Yu, W.; Nishio, M. Multilevel Structural Components Detection and Segmentation toward Computer Vision-Based Bridge Inspection. Sensors 2022, 22, 3502. [Google Scholar] [CrossRef]
- Hung, G.L.; Sahimi, M.S.B.; Samma, H.; Almohamad, T.A.; Lahasan, B.H. Faster R-CNN Deep Learning Model for Pedestrian Detection from Drone Images. SN Comput. Sci. 2020, 1, 116. [Google Scholar] [CrossRef]
- Yu, K.; Hao, Z.; Post, C.J.; Mikhailova, E.A.; Lin, L.; Zhao, G.; Tian, S.; Liu, J. Comparison of Classical Methods and Mask R-CNN for Automatic Tree Detection and Mapping Using UAV Imagery. Remote Sens. 2022, 14, 295. [Google Scholar] [CrossRef]
- Liu, W.; Anguelov, D.; Erhan, D.; Szegedy, C.; Reed, S.; Fu, C.-Y.; Berg, A.C. SSD: Single Shot MultiBox Detector. In European Conference on Computer Vision, Proceedings of the 14th European Conference, Amsterdam, The Netherlands, 11–14 October 2016; Springer: Cham, Switzerland, 2016. [Google Scholar] [CrossRef]
- Zhao, J.; Zhang, X.; Yan, J.; Qiu, X.; Yao, X.; Tian, Y.; Zhu, Y.; Cao, W. A Wheat Spike Detection Method in UAV Images Based on Improved YOLOv5. Remote Sens. 2021, 13, 3095. [Google Scholar] [CrossRef]
- Li, H.; Wang, P.; Huang, C. Comparison of Deep Learning Methods for Detecting and Counting Sorghum Heads in UAV Imagery. Remote Sens. 2022, 14, 3143. [Google Scholar] [CrossRef]
- Akshatha, K.R.; Karunakar, A.K.; Shenoy, S.B.; Pai, A.K.; Nagaraj, N.H.; Rohatgi, S.S. Human Detection in Aerial Thermal Images Using Faster R-CNN and SSD Algorithms. Electronics 2022, 11, 1151. [Google Scholar] [CrossRef]
- Raschka, S. Python Machine Learning; Packt Publishing Ltd.: Birmingham, UK, 2015; Volume 3. [Google Scholar] [CrossRef]
- Huang, L.; Qiu, M.; Xu, A.; Sun, Y.; Zhu, J. UAV Imagery for Automatic Multi-Element Recognition and Detection of Road Traffic Elements. Aerospace 2022, 9, 198. [Google Scholar] [CrossRef]
- Fekry, R.; Yao, W.; Cao, L.; Shen, X. Marker-Less UAV-LiDAR Strip Alignment in Plantation Forests Based on Topological Persistence Analysis of Clustered Canopy Cover. ISPRS Int. J. Geo-Inf. 2021, 10, 284. [Google Scholar] [CrossRef]
Publisher’s Note: MDPI stays neutral with regard to jurisdictional claims in published maps and institutional affiliations. |
© 2022 by the authors. Licensee MDPI, Basel, Switzerland. This article is an open access article distributed under the terms and conditions of the Creative Commons Attribution (CC BY) license (https://creativecommons.org/licenses/by/4.0/).