Article

Experimental Investigation of Interface Characteristics between Geogrid and Coarse-Grained Soil in a Seasonally Frozen Area

1
College of Water Conservancy & Architectural Engineering, Shihezi University, Shihezi 832003, China
2
Science and Technology R&D Center, Xinjiang Traffic Planning Survey Design Research Institute Co., Ltd., Urumqi 830006, China
3
College of Transportation and Logistics Engineering, Xinjiang Agricultural University, Urumqi 830006, China
*
Authors to whom correspondence should be addressed.
Appl. Sci. 2022, 12(19), 10187; https://doi.org/10.3390/app121910187
Submission received: 12 September 2022 / Revised: 30 September 2022 / Accepted: 4 October 2022 / Published: 10 October 2022
(This article belongs to the Section Civil Engineering)

Abstract

:
In seasonally frozen soil regions, the influence of temperature change on reinforced-soil engineering cannot be ignored. In particular, the mechanical properties of the reinforced-soil interface have an important impact on the overall stability and long-term service performance of reinforced soil engineering. To explore the interface characteristics and reinforcement mechanism between geogrids and coarse-grained soil under negative temperatures, this paper takes the typical coarse-grained soil in Xinjiang as the material and carries out a direct shear test of the reinforcement–soil interface under different normal stresses, water contents and temperatures. The curve characteristics of the shear displacement-shear stress, the change trend of the peak shear stress and the formation mechanism between the geogrid and coarse-grained soil interface under freezing and nonfreezing conditions are thoroughly analyzed. The formation mechanism of the dilatancy characteristics of the reinforced-soil interface is explained by combining the Mohr-Coulomb strength criterion and apparent friction coefficient. It is concluded that the trend of the shear displacement-shear stress curve between the geogrid and coarse-grained soil interface under the nonfreezing state and freezing state is basically the same. In a state of low normal stress, the curve has no obvious peak, which is closer to the ideal elastic-plastic double linear model. In a state of high normal stress, the curves have more obvious peaks, and the curve type is closer to the elastic-strain softening type. In the nonfreezing state, the shear strength of the reinforcement–soil interface has a great correlation with the water content, which is different in the freezing state. The main sources of the difference are the cementation of pore ice in the soil skeleton in the frozen state, the improvement of the strength of the soil particles themselves, and the further interlocking effect of the geogrid on the soil. In comparison with the reinforced coarse-grained soil under the nonfrozen state, the shear strength under the frozen state is significantly improved. In comparison with coarse-grained soil reinforced by geogrids in the nonfreezing state (0 °C), the shear strength of the frozen state (−5 °C) is significantly improved. Under normal stresses of 40 kPa, 60 kPa, and 80 kPa, when the water content is 2%, the corresponding peak shear stress increases by 19.39%, 21.71% and 11.34%, respectively. When the water content is 4.5%, the corresponding peak shear stress decreases by 29.98%, 16.17%, and 13.83%. When the water content is 7%, the corresponding peak shear stress decreases by 50.85%, 18.64%, and 21.96%. The apparent friction coefficient between the geogrid coarse-grained soil interface in the nonfrozen state and frozen state decreases with increasing normal stress. With the decrease in temperature, the dilatancy phenomenon of the reinforced soil composite is more obvious. The research results can provide a reference for the construction of reinforced engineering in seasonal frozen soil areas.

1. Introduction

Gobi, mountains and deserts are widely distributed in northwest China [1,2,3], and coarse-grained soil exists as a convenient backfill. Coarse-grained soil has significant engineering characteristics, high shear strength and good compaction, which can improve the rigidity of engineering structures. However, coarse-grained soil is mostly composed of noncohesive soil, such as stone, pebbles and gravel, which belong to typical single particles with large looseness. Compared with clay, the tensile strength of coarse-grained soil is lower, which leads to poor structural stability.
A geogrid is a two-dimensional mesh engineering material. It can effectively improve the overall strength of roadbeds, pavement, slopes and retaining walls [4,5,6,7]. More specifically, on the one hand, under the destruction of pressure and shear force, the soil particles locked by a geogrid mesh are blocked by transverse ribs, and the reinforcement–soil interface produces greater friction than the shear surface of the unreinforced soil. On the other hand, under the action of pressure, the stress of the geogrid–reinforced interface changes. The pressure on the upper layer causes the geogrid to form a concave surface, and the geogrid produces an upward lifting force so that the stress of the lower soil of the geogrid is less than the upper stress as a net effect [8].
To further explore the interface characteristics between geogrids and soil, scholars have performed much research based on direct shear and pull-out tests. Yang [9] compared the direct shear test of gravel and cohesive soil and concluded that the interface shear strength of gravel is higher. Wang [10] analyzed the influence of the change in overlying load on the pullout resistance of an HDPE geogrid through a pullout test of expansive soil. Chen [11] obtained the time-history function by pull-out testing of reinforced soil and monitoring the instant strain of the geogrid. Liu [12] carried out geogrid pull-out tests on gravel soils with different gradations and concluded that the particle size had a great influence on the pull-out resistance of the reinforcement–soil interface. When the content of coarse-grained soil with a particle size of 10 mm was more than 30%, the pull-out peak was the largest. Mirzaalimohammadi [13] carried out pull-out tests on geogrids with different cross-sectional areas and concluded that the pull-out resistance increased with increasing cross-sectional area. However, it was noted that the pull-out part of the geogrid in the middle of the fixture was slightly larger than the two ends. Therefore, if a wider geogrid is used for the pull-out test, the stress distribution at the fixture should be noted. Chen [14] found that the shear strength of reinforced soil decreases with decreasing maximum particle size, and the increase in water content will reduce the interfacial shear strength by a direct shear test between a polypropylene biaxial geogrid and soil.
Frozen soil area accounts for 70% of the total land area in China and is concentrated in the Northeast Plain, Xinjiang and Tibet [15]. According to the engineering application of seasonal frozen soil and permafrost areas, geogrids, as flexible reinforced structures, have strong advantages in inhibiting thaw settlements, subgrade frost heaves, and the overturning and displacement of retaining walls and have been applied in a small range [16,17,18,19]. However, most reinforcement projects in cold regions are based on empirical conclusions obtained from field monitoring data and theories obtained from freeze-thaw cycle tests. Freezing and thawing are two long-term processes, and the migration of water in the soil will cause a series of changes in the soil. Due to the uneven distribution of temperature gradient potential energy, water will flow from high potential energy to low potential energy, changing the water distribution inside a structure [20,21]. Based on existing research results, the mechanism of the change in the interface characteristics of reinforced soil under an abnormal temperature environment is not clear. There are still some deficiencies in the study of changes in water content and the interface characteristics of reinforced soil composites under freezing and nonfreezing conditions. Therefore, the coupling of multiple factors limits the application of geogrid reinforcement structures in cold regions, especially in seasonally frozen soil regions.
Therefore, in this paper, a low-temperature direct shear test between a geogrid and coarse-grained soil interface is carried out. The coarse-grained soil in the typical seasonal frozen soil area of Xinjiang, China, is taken as the test soil sample. The normal stress and water content are taken as variables. The curve characteristics of the shear displacement-shear stress, the variation rule of the peak shear stress and the formation mechanism of the dilatancy characteristics of the reinforcement–soil interface under the nonfrozen state and frozen state are studied. This can provide a theoretical basis for the application of geogrids in reinforcement engineering in cold regions.

2. Design of Experiment

2.1. Test Equipment

The test equipment is a YT1200S direct shear pull-out friction instrument for geosynthetics produced by the Zhejiang Wenzhou Jigao Testing Instrument Co., Ltd., China. The temperature control system is installed on the original basis of the equipment to ensure temperature accuracy during the direct shear test. The main part of the equipment is composed of an acquisition system, normal loading system and axial power system, as shown in Figure 1. The axial stress range is 0–50 kN, the displacement range is 200 mm, the servo load normal stress range is 0–200 kPa, and the servo speed range is 0.1–50 mm/min.
The direct shear box consists of two parts, as shown in Figure 2a. The inner wall size of the upper box is 490 mm × 500 mm × 150 mm (L×W×H), and the lower box is the same size as the upper box. A soil support plate is added at one side of the lower box to avoid soil scattering during direct shear. Pins are fixed on both sides of the upper and lower boxes when filling. The area of soil remains unchanged during shearing.
The normal bar at the top of the upper box applies a normal force downward and is fixed jointly by the normal bar and the right fixed bar. The left end of the lower box is a power lever, and the box body is pushed to the right. The unidirectional geogrid is placed between the upper and lower box and is subjected to shear friction together with the soil. When the power plant reaches a given range, the test ends. Figure 2b shows a stress diagram of the specimen during the shearing process.

2.2. Backfill

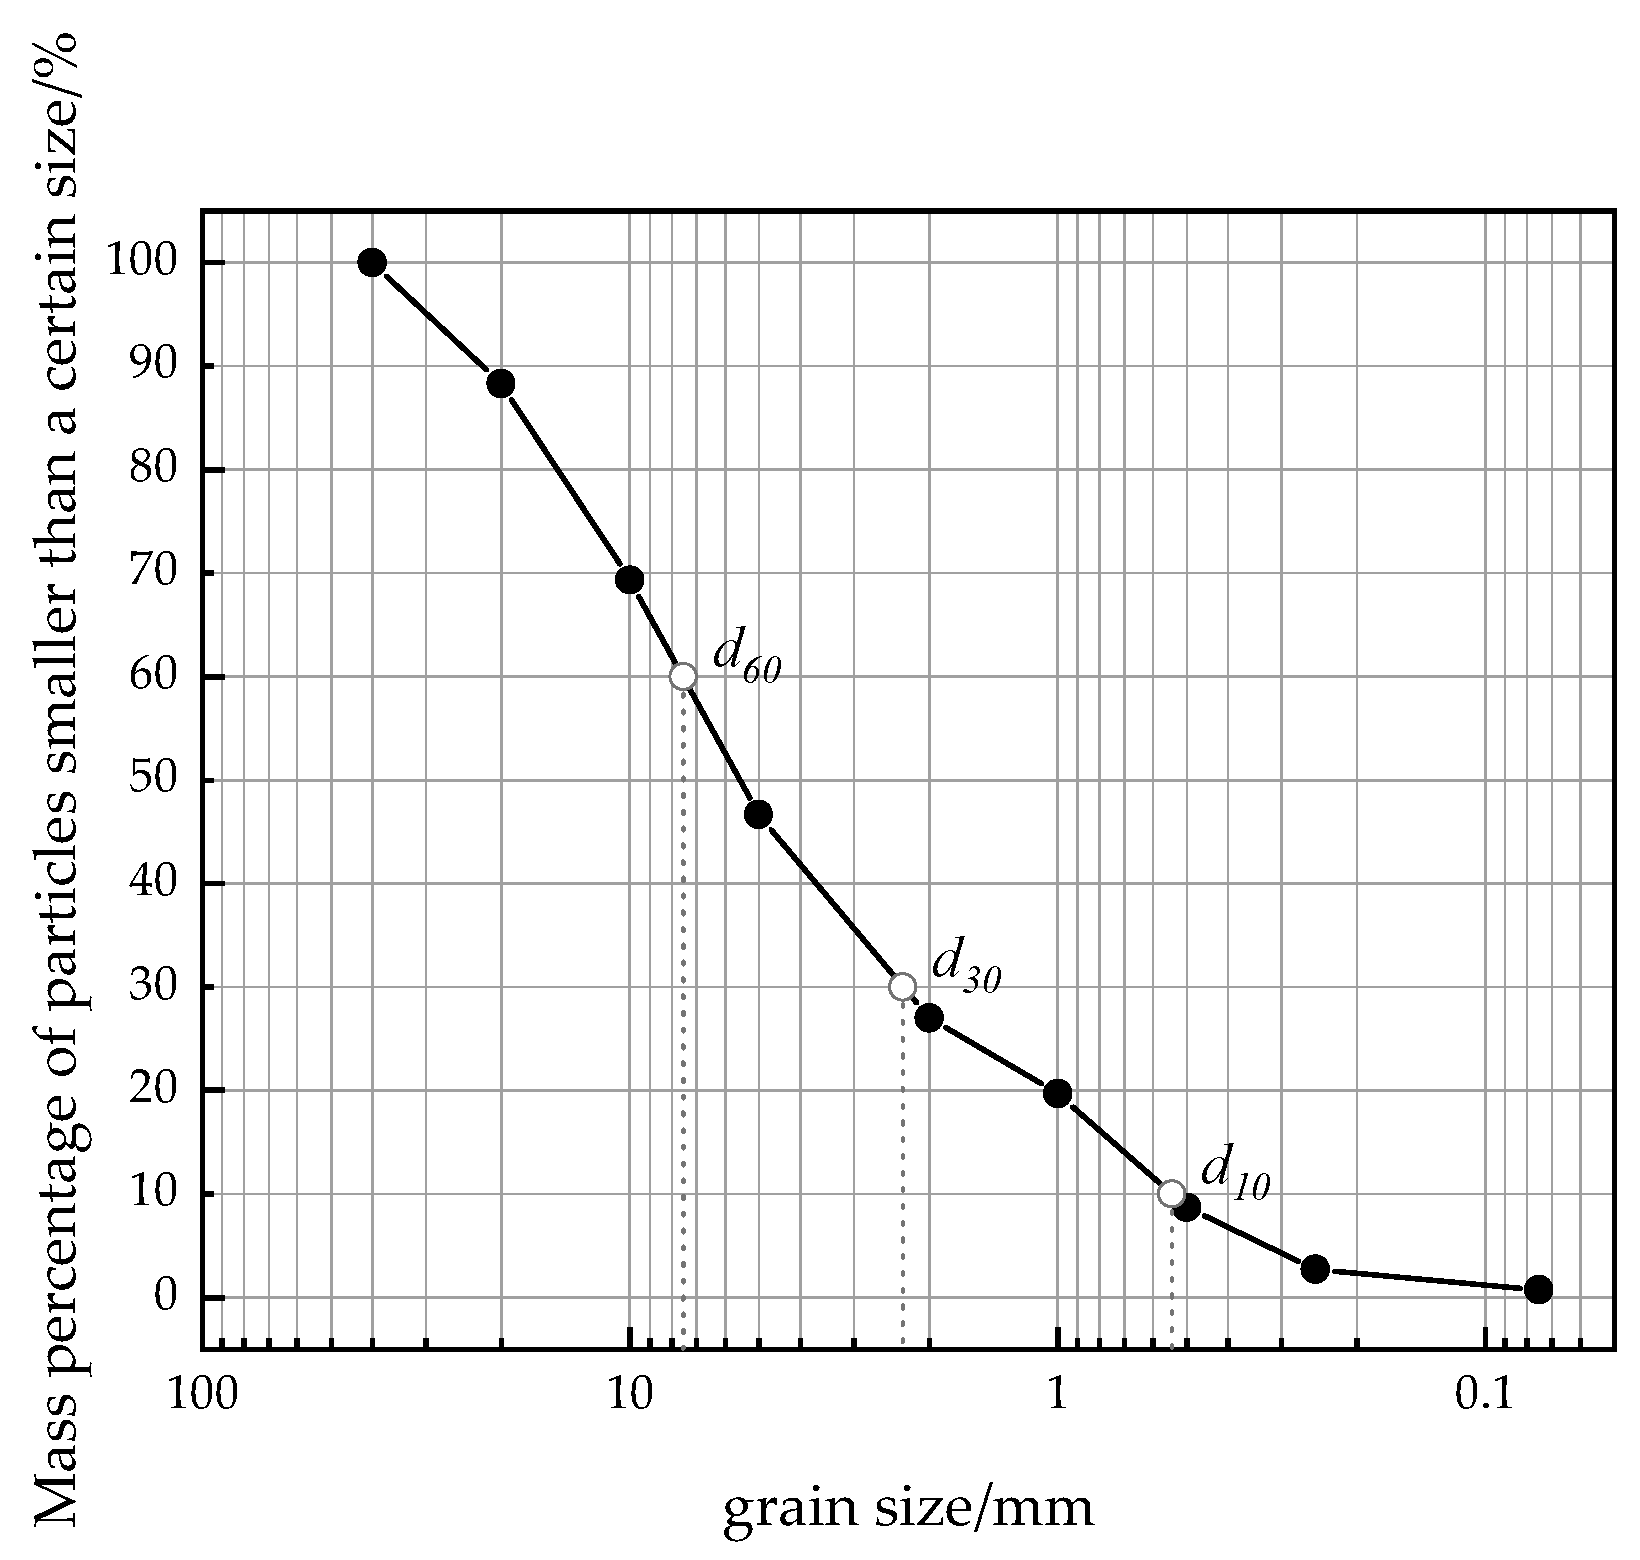
To make the interface characteristics of the reinforced soil close to the actual project, the backfill used in the test is from the material field of a high-speed project in Urumqi (87°23 E, 43°39 N), Xinjiang, China. The physical properties of the backfill are tested according to the “Highway Geotechnical Test Procedure” (JTG 3430-2020). Through the particle size analysis test and compaction test, it is found that the backfill is coarse-grained soil with good gradation, as shown in Figure 3 and Table 1.

2.3. Geogrid

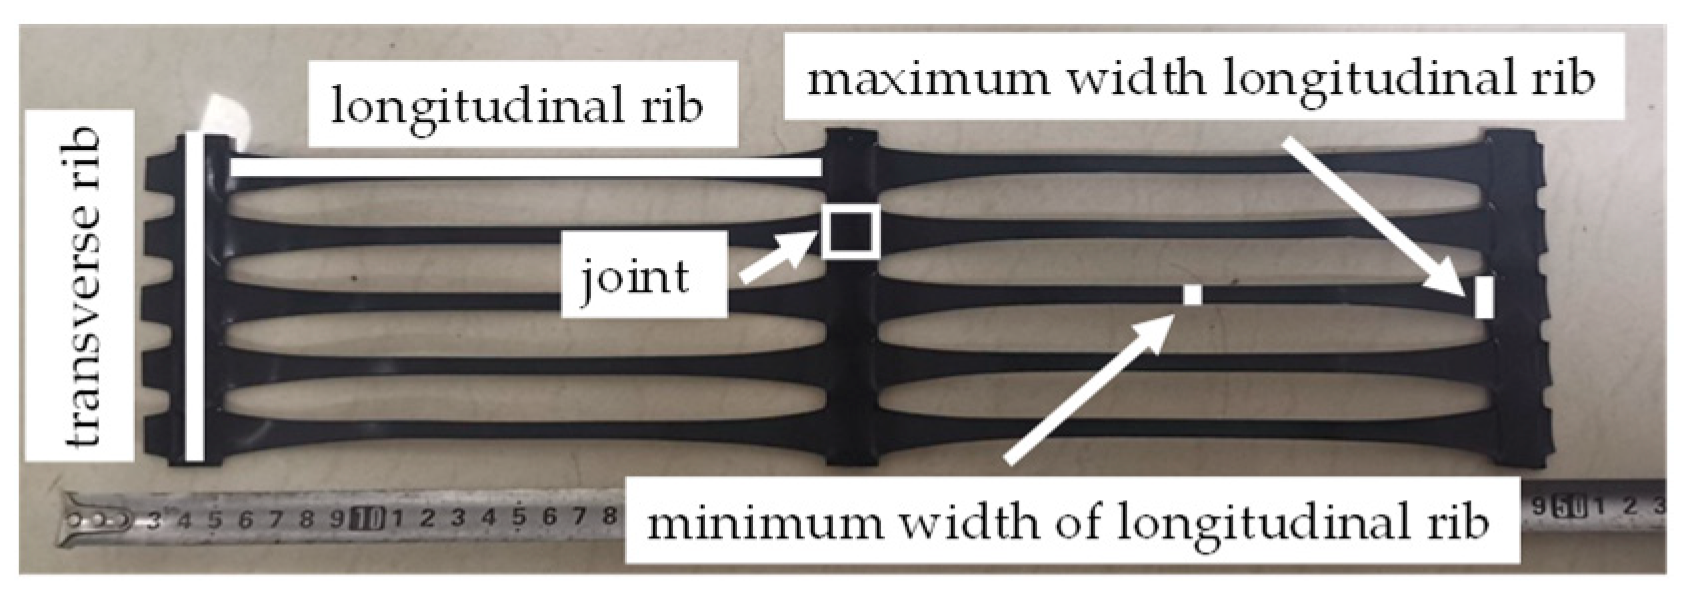
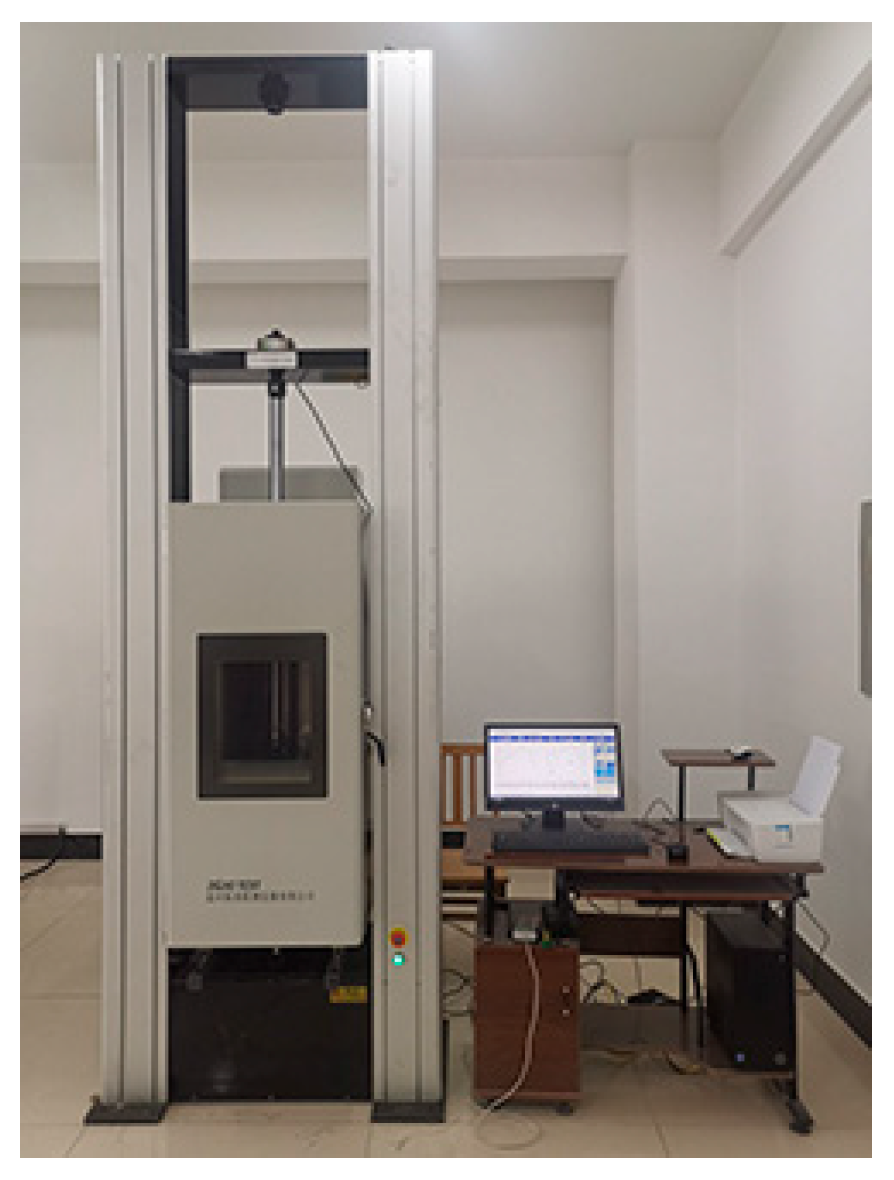
A uniaxial HDPE geogrid (TGDG50HDPE) provided by Qingdao Xuyu Geotechnical Materials Co., Ltd. in Shandong Province, China, was used in this test. The distance between the two transverse ribs of the geogrid is 142 mm, the thickness of the joint between the transverse rib and longitudinal rib is 22 mm, the thickness of the longitudinal rib is 1 mm, and the maximum width and minimum width of the longitudinal rib are 8.5 mm and 4.2 mm, respectively, as shown in Figure 4. According to the “geosynthetic plastic geogrid” (GB/T 17689-2008), the low-temperature tensile mechanical properties of the geogrid were tested by the single rib method. The temperature-controlled tensile testing machine is shown in Figure 5. The test results show that with decreasing temperature, the tensile strength of the geogrid sample is obviously improved, which is consistent with the conclusion of Reference [22], as shown in Table 2.

2.4. Test Method

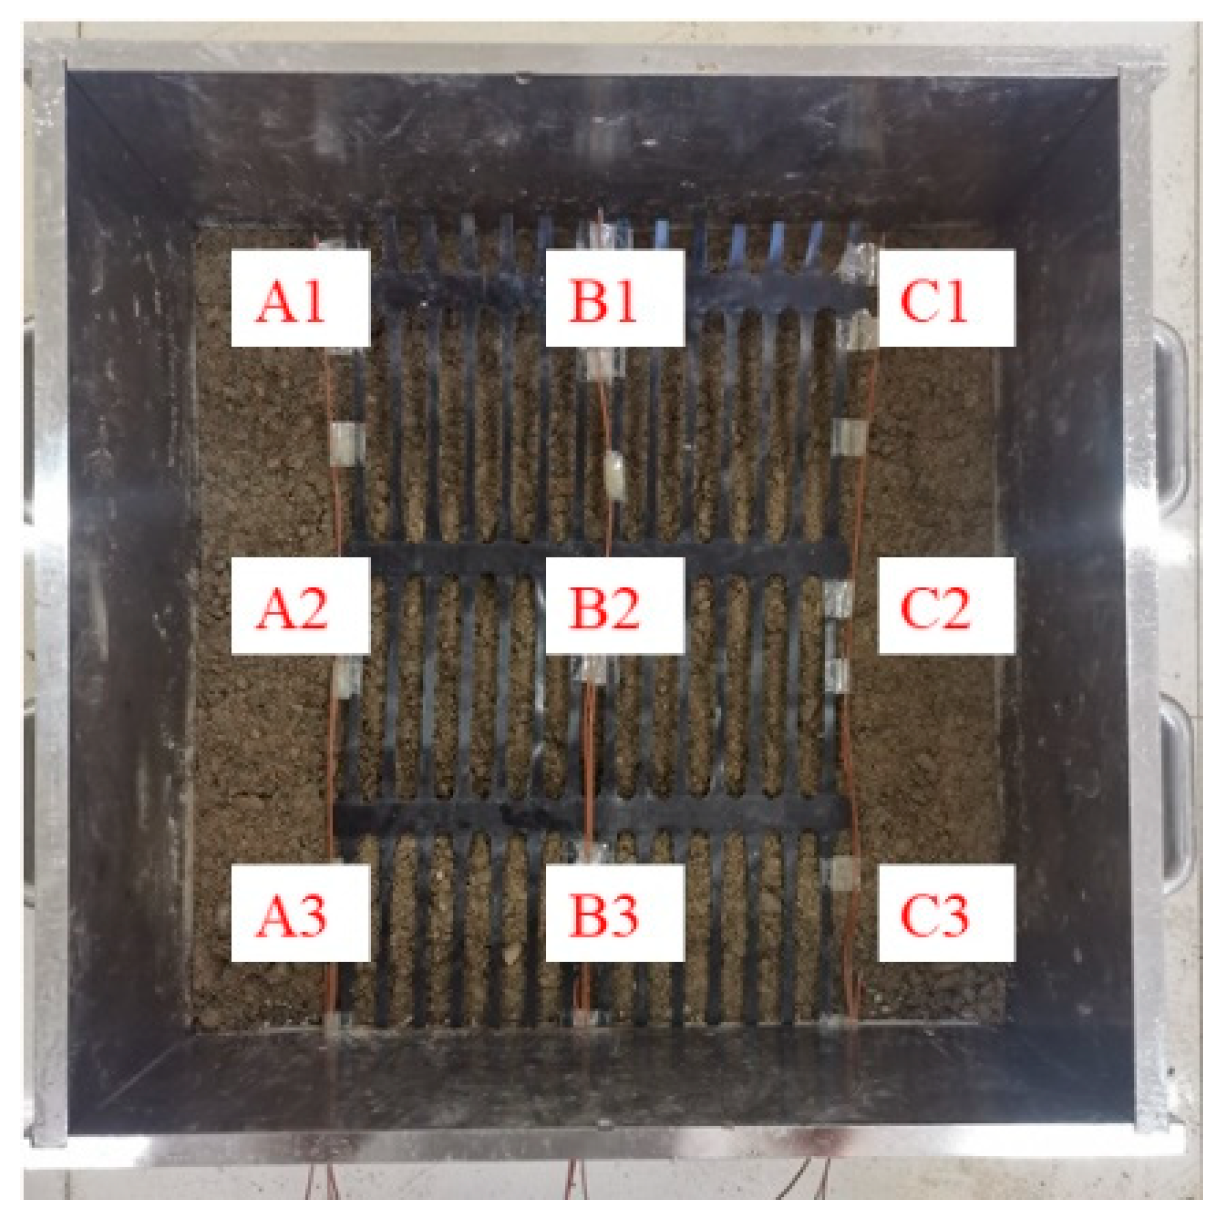
First, considering that the temperature of the soil in the box will be unevenly distributed during the cooling process, the TT-T-24−5M temperature sensor is used to monitor the temperature of the soil in the box, and the temperature distribution of the soil in each part of the shear surface is accurately obtained. The point arrangement of monitoring soil temperature and isotherms is shown in Figure 6 and Figure 7. Second, because the soil in the seasonal frozen soil area undergoes the process of freezing and thawing, the state of the reinforced soil interface under the ice-water mixing state is considered. According to the data, the underground frozen soil temperature in the seasonal frozen soil area of Xinjiang, China, is lower than −5 °C year-round, so the temperature variables are selected as 0 °C and −5 °C, respectively. Through the determination of the basic parameters of backfill, the optimal water content is 4.37%. To reflect the influence of the change in water content on the interface of reinforcement and soil, the water content is taken as a variable in this experiment, and on the basis of the optimal water content (4.5%), the water content is increased and decreased by 2.5%, namely, 2%, 4.5% and 7%. Combined with the Chinese and international test procedures [23,24,25], the normal stress is selected as 40 kPa, 60 kPa and 80 kPa, and the direct shear rate is selected as 1 ± 0.2 mm/min. The backfill is compacted in three layers, and the compaction degree is controlled at 90%.

3. Results and Analysis

3.1. Nonfreezing State (0 °C)-Reinforced Soil Interface Characteristics

Figure 8 shows the shear displacement-shear stress curve of the interface between the geogrid and coarse-grained soil with different water contents under a nonfreezing state (0 °C). In the initial stage of shearing, the shear stress increases with increasing shear displacement, and it is in an elastic stage. As the shear displacement increases, the slope of the curve begins to change, and the curve transitions to an elastic-plastic stage. However, after the turning point, the changes in each curve tend to be different. Figure 8 shows that the curves after obvious turning can be roughly divided into two types under different water contents and different normal stresses. In the case of low water content or small normal stress, the curve has no obvious peak and is closer to the ideal elastic-plastic double linear model. The interface shear displacement-shear stress curves between the geogrid and coarse-grained soil with normal stresses of 40 kPa, 80 kPa under 2% water content and 40 kPa under 7% water content are typical. In the case of high normal stress or water content, the curve has a more obvious peak. After the peak, as the shear displacement continues to increase, the shear stress decreases slightly. The curve type is closer to the elastic-strain softening type. In addition, during the test, it is found that when the shear displacement-shear stress curve passes through the stress peak, the friction sound caused by the interaction between soil particles or the interaction between soil particles and geogrids continues to appear on the shear surface of reinforced soil. At this time, the soil presents an overall sliding failure, and the corresponding curve also shows a slight decrease in shear stress or maintains a horizontal stable state.
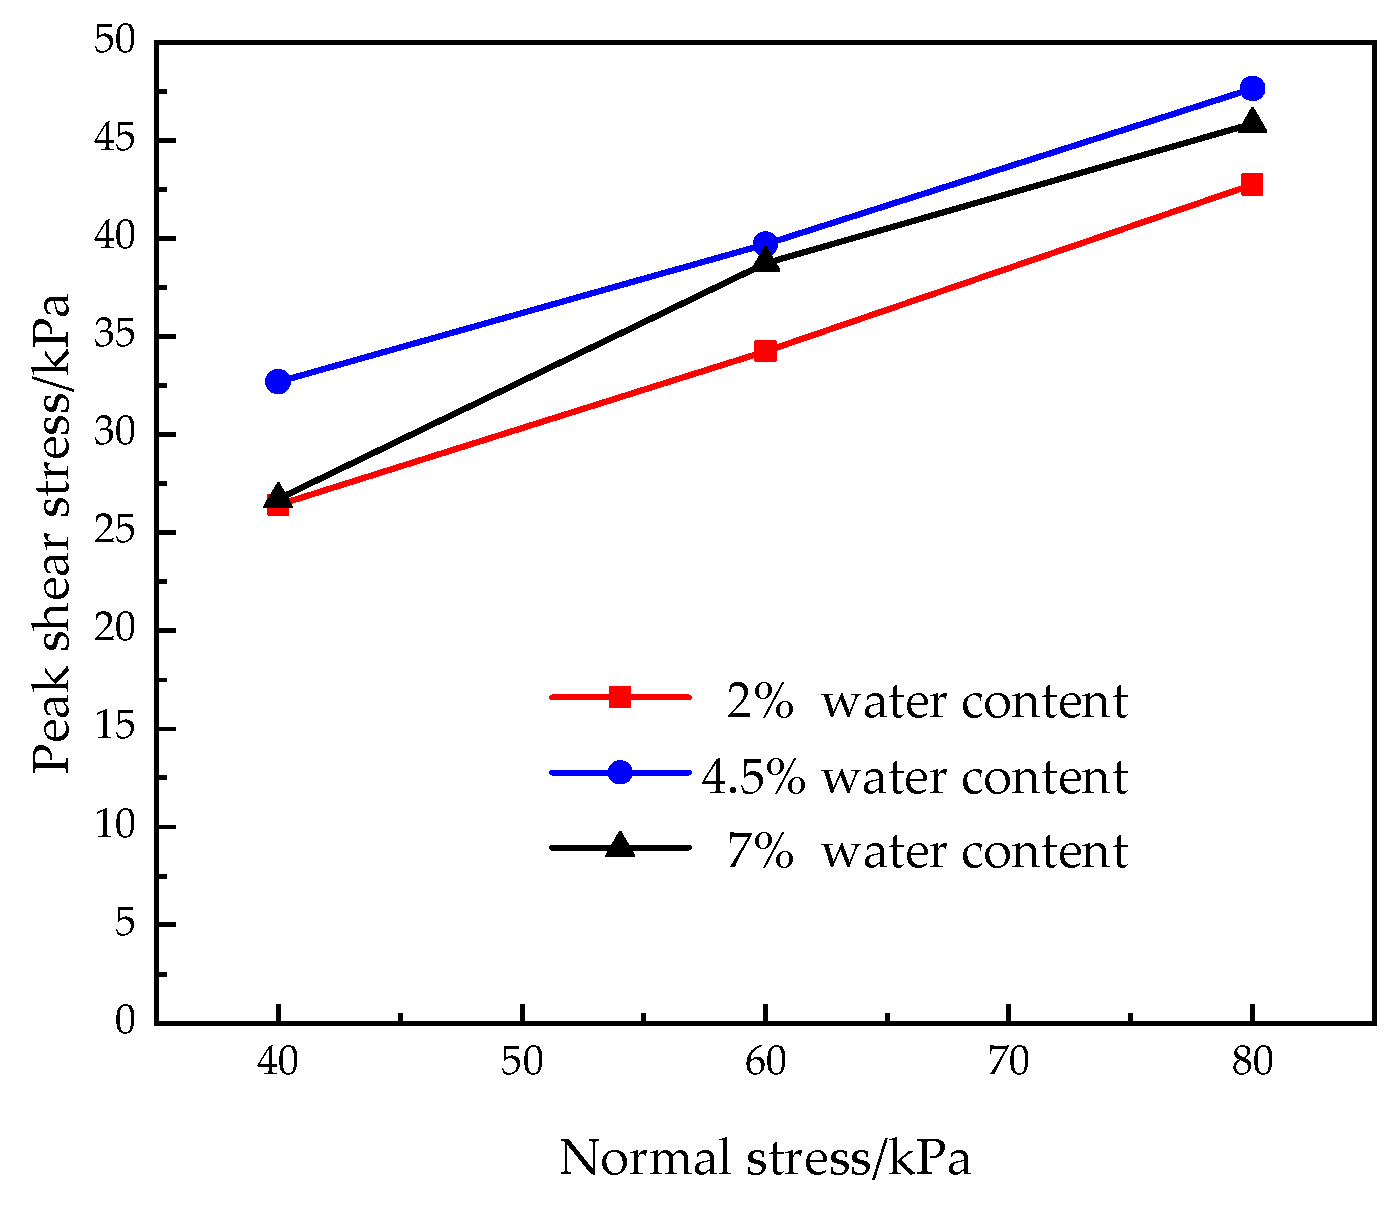
Figure 8 also shows that the peak shear stress of the reinforced soil interface increases with increasing normal stress under different water contents. This is because the increase in the normal stress makes the soil denser, and the mutual occlusion between different graded soil particles is further increased. Therefore, the friction between the soil and soil and between the soil and reinforcement is also greater during direct shear. When the normal stress is 40 kPa, 60 kPa and 80 kPa, the peak shear stress corresponding to 2% water content is 26.408 kPa, 34.238 kPa and 42.734 kPa, respectively. The peak shear stress corresponding to a water content of 4.5% is 32.68 kPa, 39.694 kPa and 47.632 kPa. The peak shear stresses corresponding to a water content of 7% are 26.708 kPa, 38.734 kPa and 45.85 kPa.
The relationship between the shear strength and the normal stress of the reinforced soil interface under the nonfreezing state (0 °C) is shown in Figure 9. When the water content is 2%, the peak shear stress under different normal stresses is the lowest among the three water contents. At 4.5% (optimal) water content, the shear stress under different normal stresses is the highest among the three water contents. The stress curve of 7% water content is between the two. At the same time, according to Figure 10, the effect of water content on the peak shear stress of the reinforced soil interface is more significant in the nonfrozen state (0 °C). Under normal stresses of 40 kPa, 60 kPa and 80 kPa, the peak shear stress of the reinforced soil interface corresponding to 4.5% water content is the highest. The water content has a great correlation with the interface characteristics of the reinforced soil in the nonfreezing state. This is because when the water content is 2%, due to the loose characteristics of coarse-grained soil, less water fails to make the soil particles with different particle sizes more closely arranged and combined, so the mutual occlusion generated by soil particles is small. The composition of the shear strength depends more on the block effect of geogrid transverse ribs and the compactness of the soil itself. When the water content is 4.5%, close to the optimal water content, the density of soil increases significantly so that the interaction between soil particles is enhanced. At the same time, the geogrid ribs have an obvious interlocking effect on the soil particles. Therefore, at 4.5% water content, the peak shear stress under each normal stress is the highest. When the water content is 7%, there is a large amount of water in the soil. The thin water film on the surface of the soil makes the reinforced soil complex in a semisolid state, and the outermost water of the thin water film has little effect on the stress field of the soil skeleton, so it has a greater lubrication effect on the reinforced soil complex. In addition, the compactness at 7% water content is far less than that at 4.5% water content, which leads to the weak barrier and interlocking effect of geogrid ribs, so the soil has a large sliding property and the shear strength is weakened.

3.2. Freezing State (−5 °C) Reinforced Soil Interface Characteristics

Figure 11 shows the shear displacement-shear stress curve of the interface between the geogrid and coarse-grained soil with different water contents under the freezing state (−5 °C). The curve is basically the same as the trend of the interface shear displacement-shear stress curve in Section 3.1. There is no obvious brittle shear failure of soil with decreasing freezing temperature [26,27,28,29]. The author considers analyzing from two aspects. First, the soil sample used in this experiment is coarse-grained soil, which is different from the clay or fine-grained soil used by some scholars. Frozen soil is composed of soil particles, unfrozen water, pore ice and air. The unfrozen water content and pore ice play a major role in the shear strength of reinforced soil composites. Compared with frozen clay and frozen fine-grained soil, the soil samples with more coarse-grained content have larger soil skeleton pores, and there is still a considerable amount of unfrozen water in the negative temperature state, which leads to obvious plastic deformation. The pores of fine-grained soil and clay are small. With the increase in compactness, the interaction between the soil and pore ice is obvious. The cementing force of ice enables the surrounding soil to be more compactly bonded together, increasing the cohesion of the soil. Second, the size of the direct shear box used in this experiment is 490 × 500 × 300 mm (L×W×H). According to Figure 11, the larger direct shear box does not obviously reflect the difference in the failure mode of the reinforced soil interface at different temperatures. The size effect will affect the shear behavior of the reinforced soil interface, but it decreases with the increase in the size of the test model [30,31]. Therefore, the temperature variable in the direct shear between the geogrid and coarse-grained interface has little effect on the trend of the stress curve but more on the shear strength.
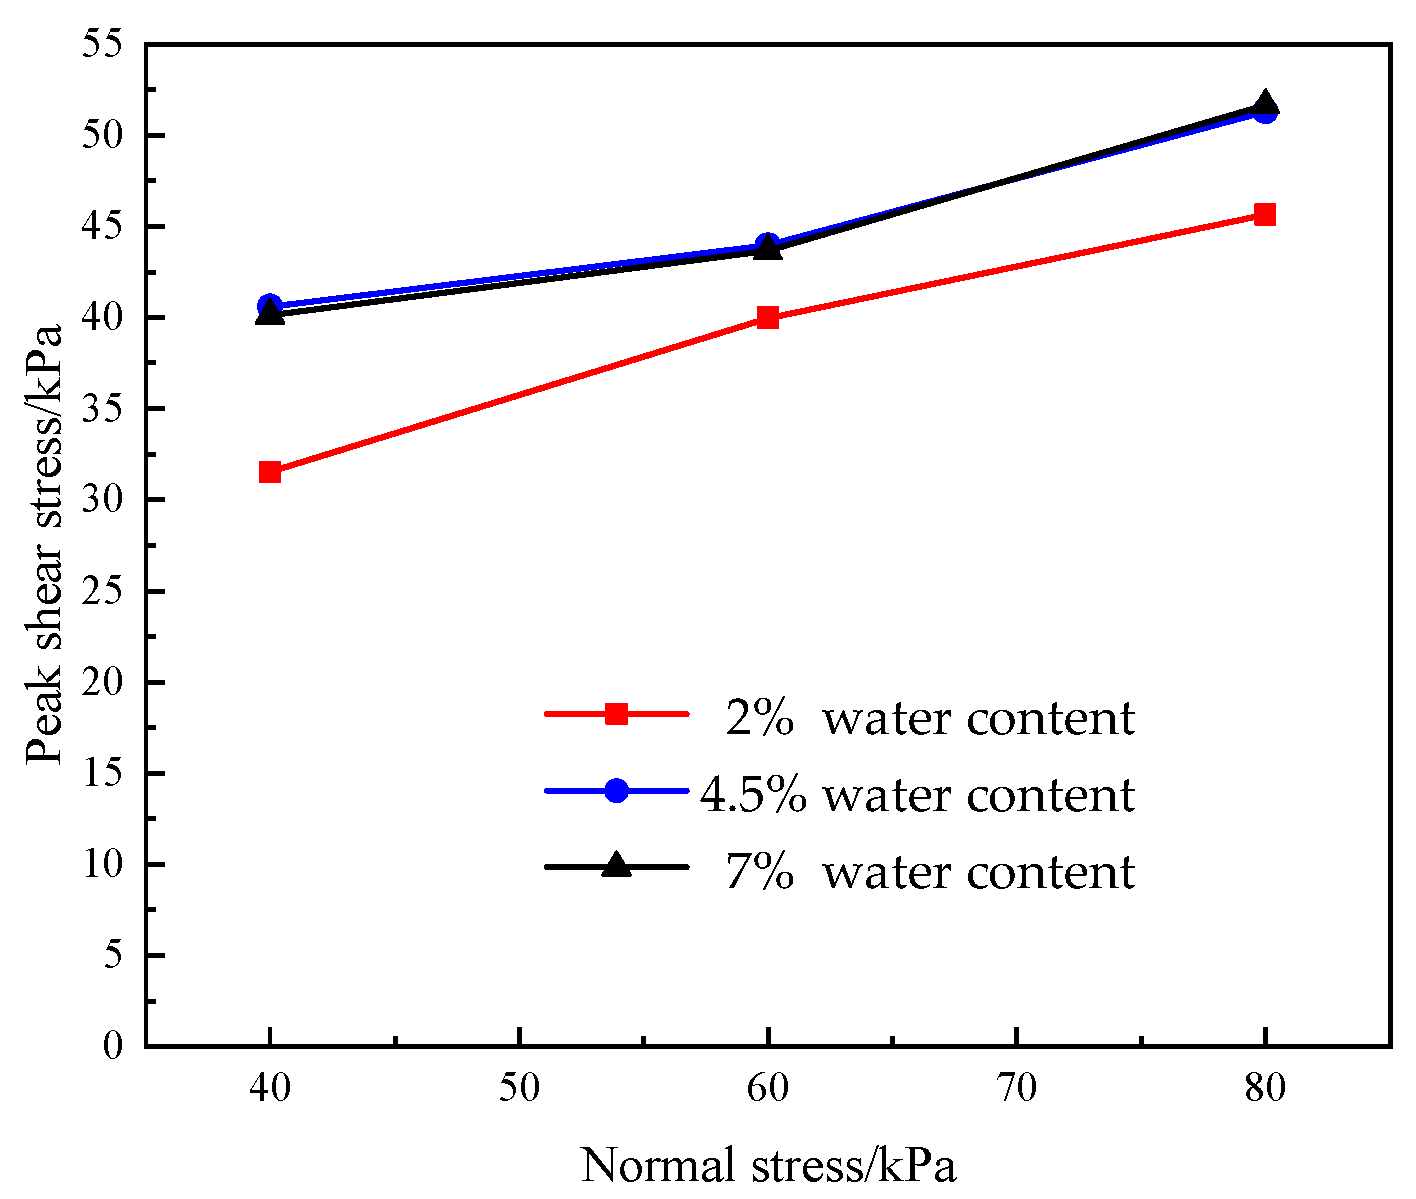
As shown in Figure 11, in the case of different water contents, the peak shear stress of the reinforced soil interface in the frozen state (−5 °C) still increases with increasing normal stress. When the normal stress is 40 kPa, 60 kPa and 80 kPa, the peak shear stress corresponding to 2% water content is 31.53 kPa, 39.62 kPa and 45.73 kPa, respectively. The peak shear stress corresponding to a water content of 4.5% is 40.596 kPa, 43.963 kPa and 51.284 kPa. The peak shear stresses corresponding to a water content of 7% are 40.134 kPa, 43.656 kPa and 51.65 kPa.
The relationship between the shear strength and the normal stress of the reinforced soil interface under the freezing state (−5 °C) is shown in Figure 12. When the water content is 2%, the peak shear stress under different normal stresses is still the lowest among the three water contents. However, when the water content is 4.5% and 7%, the peak shear stress under different normal stresses is very close. This is different from the relationship between the shear strength and normal stress of the reinforced soil interface with different water contents in the nonfreezing state (0 °C). At the same time, according to Figure 13, the influence of the water content on the peak shear stress of the reinforced soil interface under the freezing state (−5 °C) is also different from that under the nonfreezing state (0 °C). When the water content increases from 2% to 4.5%, the peak shear stress corresponding to the normal stress of 40 kPa, 60 kPa and 80 kPa increases by 28.75%, 10.96% and 12.15%, respectively. When the water content increased from 4.5% to 7%, the peak shear stress decreased by 1.15% and 0.7% under normal stresses of 40 kPa and 60 kPa, respectively. Under 80 kPa normal stress, the corresponding peak shear stress increased by 0.7%. When the water content increases from 4.5% to 7%, the peak shear stress changes little and is basically flat. The strength of the reinforced soil interface in the frozen state is jointly contributed by the cohesion between the soil skeleton, bite force, cementation force of the frozen pore ice, strength of the soil particles, interlocking effect of the geogrid on the soil and blocking effect of the transverse ribs [32,33]. When the water content is 2%, the pore ice content generated in the soil is small, and its cementation effect on the soil is weak. Therefore, the peak shear stress of 2% water content is the lowest under the three normal stresses. When the water content is 4.5% and 7%, the peak shear stress is basically the same. However, the analysis of the composite mechanism of frozen soil and reinforcement [33,34] shows that the contribution factors of shear strength are not the same when the water content is 4.5% and 7%. When the water content is 4.5%, the density of the soil increases, and the interlocking effect of the geogrid mesh on the soil particles is enhanced. The blocking effect of the transverse ribs plays a leading role in the contribution of shear stress. The cementation force of pore ice in frozen soil plays a secondary role in the contribution of shear strength. When the water content is 7%, although there is much water, unfrozen water has been converted into pore ice in the frozen state. The pore ice in frozen soil further enhances the cementation between soil particles and between reinforcement and soil. Therefore, increasing the water content does not cause the peak shear stress of the reinforced soil interface to change significantly.

3.3. Influence of Water Content and Temperature on the Shear Strength Index of the Reinforced Soil Interface

To study the influence of the water content and temperature variables on the shear strength between the geogrid and coarse-grained soil interface, the peak shear stress corresponding to normal stresses of 40 kPa, 60 kPa and 80 kPa under each working condition is linearly fitted. The parameters are shown in Table 3. The shear relationship of the reinforced soil interface conforms to the Mohr-Coulomb strength criterion.
The normal stress σ n of the reinforced soil interface in the direct shear test can be calculated by the following formula:
σ n = P A
where P is the normal load of the reinforced soil composite in kN, and A is the shear box area in m2.
The relationship between the interface shear strength τ f and normal stress σ n can be expressed as follows:
τ f = c s + σ n tan φ s
where c s is the interface cohesion of the reinforced soil composite and φ s is the interface friction angle of the reinforced soil composite.
The apparent friction coefficient is a comprehensive strength parameter reflecting the friction effect of the reinforcement–soil interface, which is defined as the ratio of the peak shear stress to the normal stress of the reinforcement-soil composite. To explore the influence of the water content and temperature on the apparent friction coefficient of the reinforced soil interface, the apparent friction coefficient is used as an index to reflect the friction characteristics of the reinforced soil interface. The formula is as follows:
f g s = τ p max σ n
where f g s is the apparent friction coefficient and τ p max is the peak shear stress.
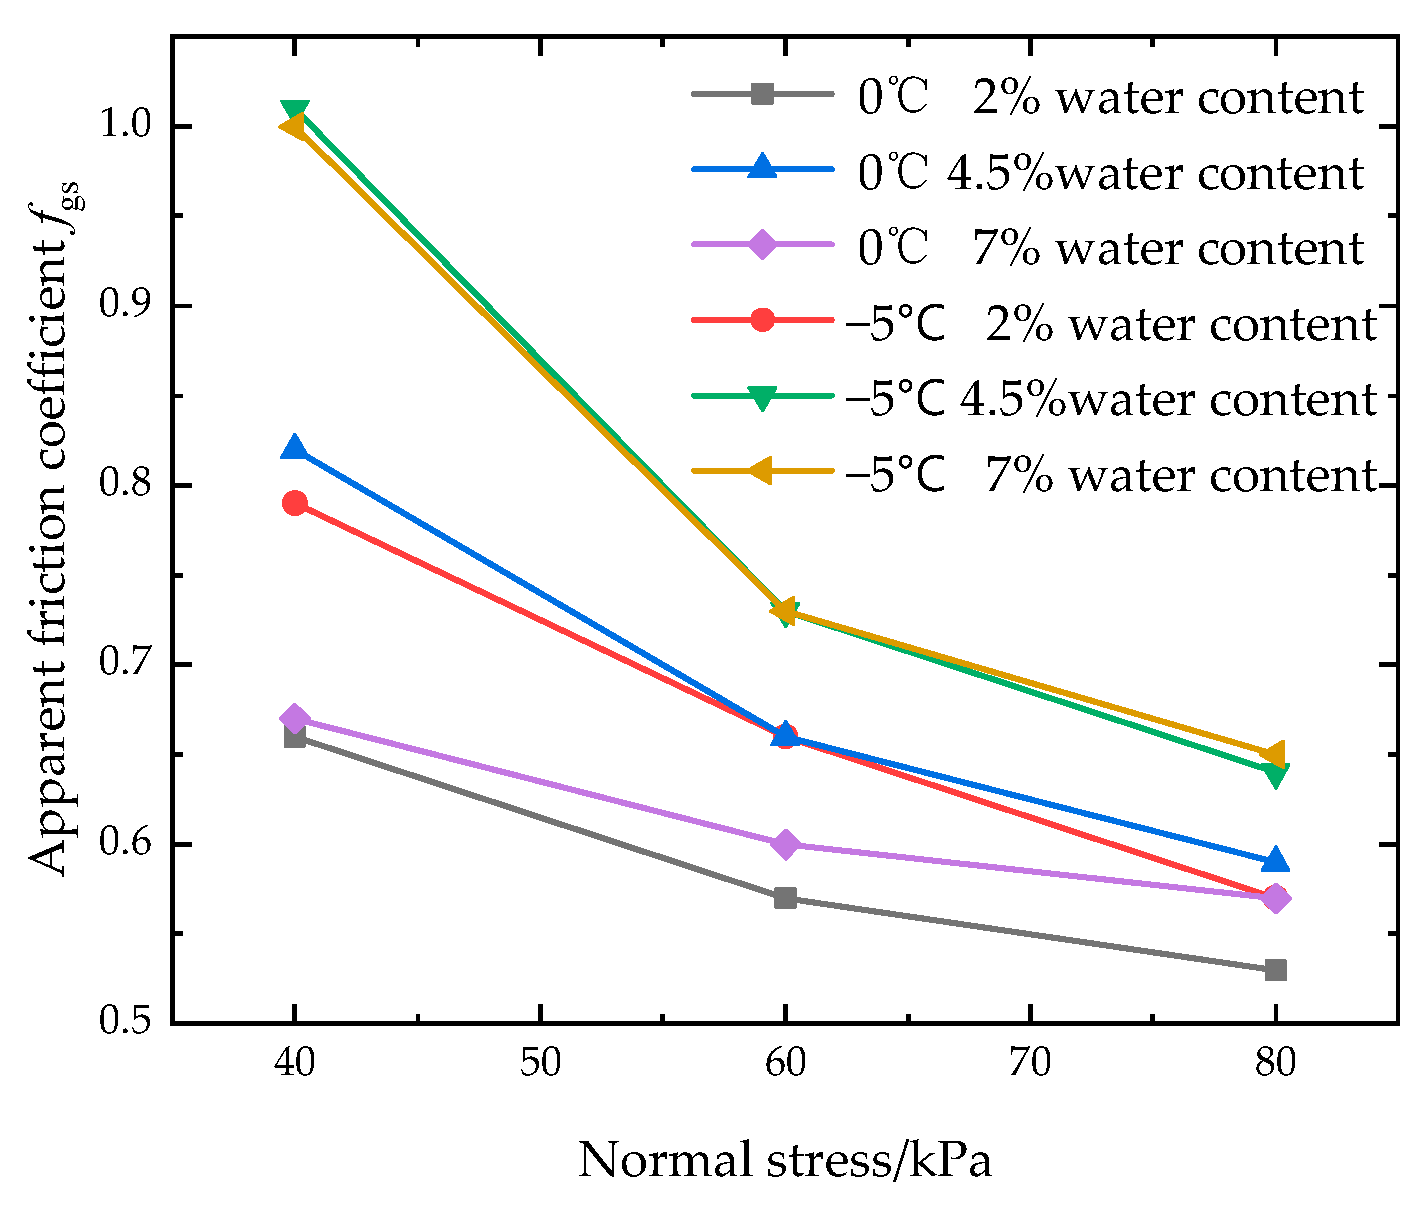
The variation in the apparent friction coefficient is shown in Figure 14. The apparent friction coefficient decreases with increasing normal stress. When the normal stress increases from 40 kPa to 60 kPa, the apparent friction coefficient decreases rapidly. When the normal stress increases from 60 kPa to 80 kPa, the apparent friction coefficient decreases slowly, which is consistent with the conclusion of References [35,36]. This is because the lower normal stress on the soil particle constraint effect is poor. The soil particles have enough adjustment space, and the dilatancy is remarkable. With the increase in normal stress, the ability of normal stress to restrain the interface between reinforcement and soil increases, which limits the displacement and reversal of soil particles [37]. The dilatancy characteristics of the reinforced soil composite will be analyzed in detail in Section 3.4.

3.4. Shear Dilation Characteristics of Reinforced Soil Composite

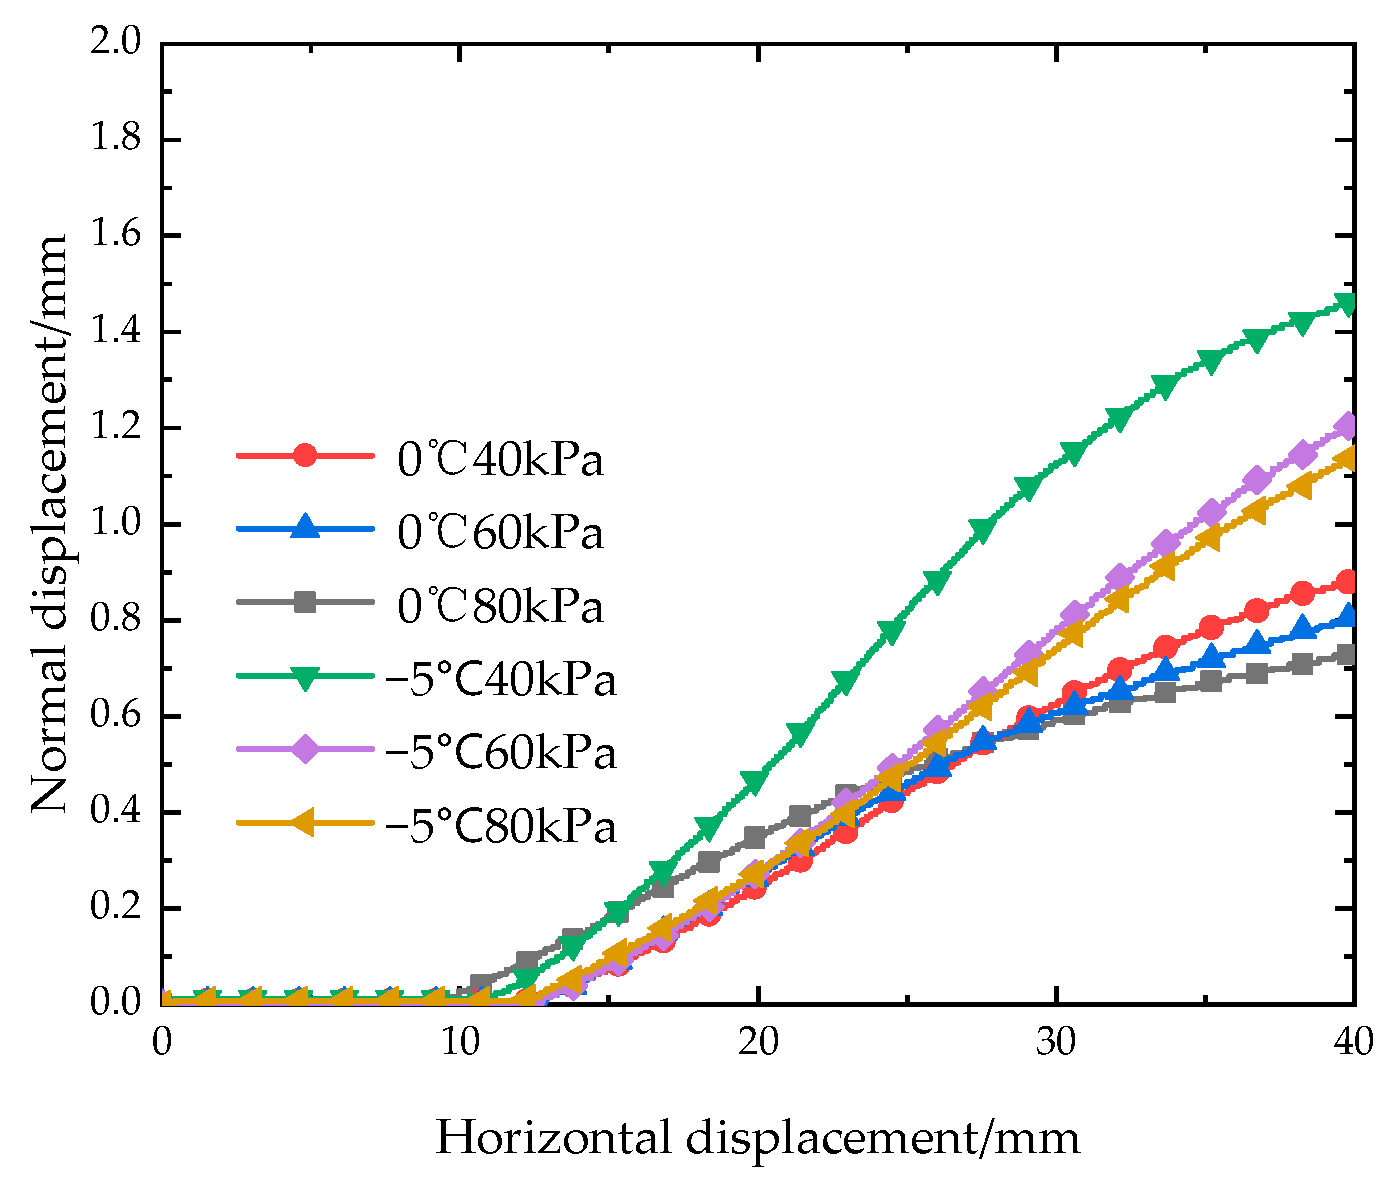
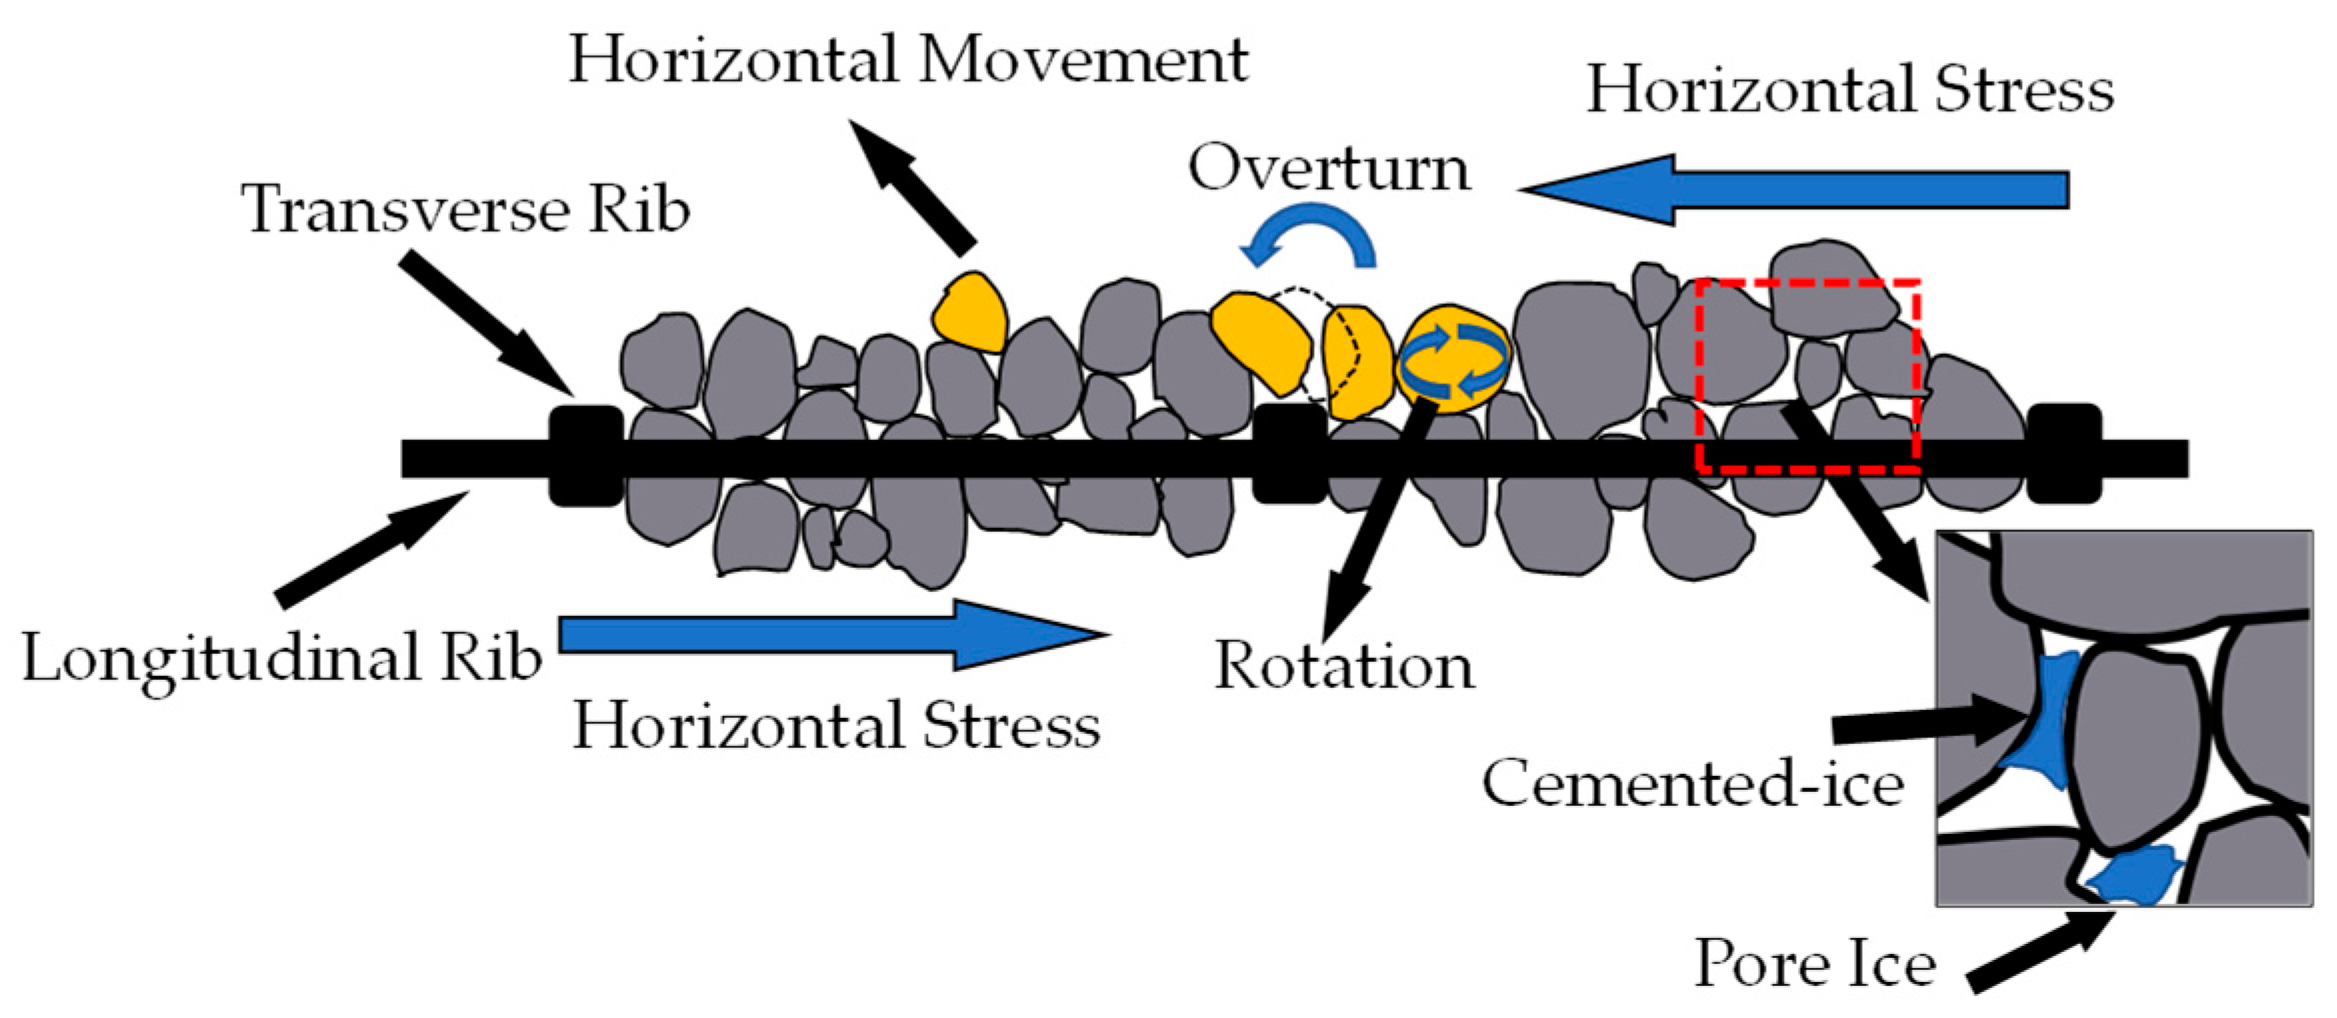
To further explore the interface characteristics between the geogrid and coarse-grained soil, the horizontal displacement and normal displacement data during the direct shear test will be analyzed. In this process, it is found that the dilatancy characteristics are basically the same in various working conditions. Therefore, the relationship curve between the horizontal displacement and normal displacement of the reinforced soil composite under different normal stresses with 7% water content is analyzed, as shown in Figure 15. Whether 0 °C or −5 °C, the dilatancy phenomenon during direct shear decreases with increasing normal stress. When the normal stress is 40 kPa, 60 kPa and 80 kPa, the final normal displacement of the soil reinforced soil composite at −5 °C is 66.36%, 50.75% and 55.19% higher than that at 0 °C, respectively. The shear deformation of the reinforced soil composite at low temperature still conforms to the shear deformation law of dense material. Figure 15 shows that the normal displacement deformation degree under the three normal stresses at −5 °C is higher than that at 0 °C. That is, with decreasing temperature, the shear dilation phenomenon of the reinforced soil composite is more significant. This is because, on the one hand, under the condition of 0 °C, the soil is in a nonfrozen state, the cohesion and internal friction angle of the reinforced soil composite are small, and the shear surface is relatively flat. On the other hand, there are still some pores between the soil and soil and between the soil and reinforcement, which are easily squeezed in the direct shear process, resulting in the recombination of the soil shear surface. For the reinforced soil composite at −5 °C, pore ice has been formed between the soil skeletons, and the cementation force has been generated inside the reinforced soil composite, resulting in an increase in the strength of the shear surface. The relative slip between the upper and lower interfaces is rougher, and the dilatancy is stronger. At the same time, the reinforcement effect of geogrid transverse ribs is more obvious. The soil particles are recombined by cementing ice, and the large-grained soil undergoes microscopic phenomena such as horizontal movement, rotation and crossing under the action of geogrid transverse ribs, as shown in Figure 16. Therefore, with the decrease in temperature, the dilatancy phenomenon of the reinforced soil composite is more obvious.

4. Discussion

In this paper, the interface characteristics between geogrids and coarse-grained soil in a low-temperature environment are analyzed by a direct shear test. However, this experiment only studies the characteristics of the direct shear curve, peak strength and dilatancy mechanism. At the micro level, especially the formation and content of pore ice, the characteristics of water migration in soil, the micromovement of coarse-grained soil under reinforcement and the change in the reinforcement influence zone have not been studied. Subsequently, the direct shear box can be transparently treated on the side surface and combined with particle image velocimetry (PIV) technology to study the microscopic motion of the reinforced soil interface. At the same time, this paper only analyzes the law of peak shear stress and water content through three water contents, and the number of samples is small. However, the regularity reflected in the overall test data remains consistent with the conclusions of most scholars. By comparing the change process of shear strength in non-frozen and frozen states, Reference [38] drew the same conclusion as this paper: the shear strength of frozen soil is higher than that of non-frozen soil, and water content is not positively correlated with shear strength. The mechanism part has been analyzed in Section 3. At the same time, Reference [39] also analyzed that the actual shear plane of soil with large particle size was similar to the up-and-down wave, rather than a plane, during the shear process, which supported the dilatancy characteristics analyzed in Section 3.4. Reference [40] divides the thawing conditions of frozen soil into three stages and the thawing characteristics of frozen soil from the micro level. Reference [41] also confirms that when the soil is close to the optimal water content, the shear strength is the maximum.
At present, direct shear and pull-out tests are the two most effective methods to study the interface characteristics of reinforced soil. However, the failure modes corresponding to the two tests in practical engineering are different, and the test data are different [42,43]. In this paper, the interface characteristics of reinforced soil under low-temperature conditions are analyzed by a direct shear test, and no comparison with a pull-out test is carried out. This experimental study should be continued in the future.

5. Conclusion

To explore the interface characteristics of coarse-grained soil reinforced by geogrids at low temperature, this paper selects the typical coarse-grained soil in Xinjiang, China, and HDPE unidirectional geogrids as materials to carry out large-scale direct shear tests at 0 °C and − 5 °C with water contents of 2%, 4.5%, and 7% and normal stresses of 40 kPa, 60 kPa, and 80 kPa. The variation law of the interface curve characteristics and shear strength under different working conditions was obtained. The apparent friction coefficient and dilatancy mechanism of reinforced soil composites under different working conditions are analyzed and explained by the strength index and calculation formula of the reinforced soil interface. The above research results can provide scientific basis for the construction design and safety evaluation of reinforced soil engineering in frozen soil area, and also promote the popularization and application of reinforced soil technology in frozen soil area. The main conclusions are as follows:
  • The trends of the shear displacement-shear stress curve of the geogrid–coarse-grained soil interface under the nonfreezing state (0 °C) and freezing state (−5 °C) are basically the same. Under the condition of low normal stress, the curve has no obvious peak value, which is closer to the ideal elastic-plastic double linear model. In the state of high normal stress, the curves have more obvious peaks, and the curve type is closer to the elastic-strain softening type.
  • In the nonfreezing state (0 °C), there is a strong correlation between the shear strength and water content. When the water content is 4.5%, the peak shear stress under each normal stress is the largest. However, the larger water content will reduce the interface shear strength of the reinforced soil composite. The shear strength of the interface between the frozen state (−5 °C) and the nonfrozen state (0 °C) is different. When the water content is 4.5% and 7%, the peak shear stresses under different normal stresses are very close. The main sources of the difference are the cementation of pore ice in the soil skeleton under the freezing state (−5 °C), the improvement in the strength of the soil particles and the further interlocking effect of the geogrid on the soil.
  • Compared with coarse-grained soil reinforced by geogrids in the nonfreezing state (0 °C), the shear strength of the frozen state (−5 °C) is significantly improved. Under normal stresses of 40 kPa, 60 kPa and 80 kPa, when the water content is 2%, the corresponding peak shear stress increases by 19.39%, 21.71% and 11.34%, respectively. When the water content is 4.5%, the corresponding peak shear stress decreases by 29.98%, 16.17%, and 13.83%. When the water content is 7%, the corresponding peak shear stress decreases by 50.85%, 18.64%, and 21.96%.
  • The apparent friction coefficient between the geogrid and coarse-grained soil interface in the nonfreezing state (0 °C) and freezing state (−5 °C) decreases with increasing normal stress, and the downward trend is steep to slow. This is mainly because the soil particles are more likely to move under the action of the transverse ribs of the geogrid under the condition of low normal stress. With the decrease in temperature, the dilatancy phenomenon of the reinforced soil composite is more obvious.

Author Contributions

Data curation, Q.B.; Writing—Original draft, Q.B.; Investigation, Q.B., H.D. and B.W.; Formal analysis, Q.B.; Writing—Review and Editing, Q.B., J.L. and Y.W.; Supervision, J.L., Y.W., H.D. and B.W.; Conceptualization, J.L.; Funding acquisition, J.L. and Y.W.; Project administration, H.D. All authors have read and agreed to the published version of the manuscript.

Funding

This study received funding from Xinjiang Transport Planning Survey and Design Institute Co. Ltd (Grant Nos KY2020112301; KY2021100901).

Institutional Review Board Statement

Not applicable.

Informed Consent Statement

Not applicable.

Data Availability Statement

No new data were created or analyzed in this study; data sharing is not applicable to this article.

Conflicts of Interest

The authors declare no conflict of interest.

References

  1. Li, B.Y.; Pan, B.T.; Cheng, W.M.; Han, J.F.; Qi, D.L.; Zhu, C. Research on geomorphological regionalization of China. Acta Geogr. Sin. 2013, 68, 291–306. [Google Scholar] [CrossRef]
  2. Zhu, B.Q.; Yu, J.J.; Qin, X.G.; Liu, Z.T.; Xiong, H.G. Formation and evolution of sandy deserts in Xinjiang: The palaeo-environmental evidences. Acta Geogr. Sin. 2013, 68, 661–679. [Google Scholar] [CrossRef]
  3. Li, J.T.; Wang, K.Z.; Li, Y.P.; Sun, G.H.; Chu, C.H.; Li, L.Q.; Zhu, Z.X. geomorphological features, crustal composition and geological evolution of the Tianshan Mountains. Geol. Bull. China 2006, 8, 895–909. [Google Scholar] [CrossRef]
  4. Shen, L.S.; Yang, G.Q.; Cheng, H.T.; Zheng, R.J.; Chen, J.C. Optimization Technology for Geogrid-Reinforced Subgrade Widening Projects of Highways. Chin. J. Geotech. Eng. 2013, 35, 789–793. [Google Scholar] [CrossRef]
  5. Qian, Y.; Han, J.; Pokharel, S.K.; Parsons, R.L. Performance of Triangular Aperture Geogrid-Reinforced Base Courses over Weak Subgrade under Cyclic Loading. J. Mater. Civ. Eng. 2013, 25, 1013–1021. [Google Scholar] [CrossRef] [Green Version]
  6. Singh, M.; Trivedi, A.; Shukla, S.K. Evaluation of geosynthetic reinforcement in unpaved road using moving wheel load test. Geotext. Geomembr. 2022, 50, 581–589. [Google Scholar] [CrossRef]
  7. Zadehmohamad, M.; Luo, N.; Abu-Farsakh, M.; Voyiadjis, G. Evaluating long-term benefits of geosynthetics in flexible pavements built over weak subgrades by finite element and Mechanistic-Empirical analyses. Geotext. Geomembr. 2022, 50, 455–469. [Google Scholar] [CrossRef]
  8. Su, Q.; Cai, Y. Geogrid- and Geocell-Reinforced Sand Blanket: Model Test and the Ability to Reduce Deformation. J. Southwest Jiaotong Univ. 2001, 36, 176–180. [Google Scholar] [CrossRef]
  9. Yang, G.Q.; Li, G.X.; Zheng, B.J. Experimental Studies on Interface Friction Characteristics of Geogrids. Chin. J. Geotech. Eng. 2006, 8, 948–952. [Google Scholar]
  10. Wang, M.Y.; Gong, X.N.; Bao, C.G.; Shi, G.L. Pull-Out Behavior of The Interface Between Geogrid and Compacted Expansive Soil. Eng. Mech. 2009, 26, 145–151. [Google Scholar]
  11. Chen, R.; Luan, M.T.; Zhao, W.; Xu, X.Y.; Hao, D.X. Research on pull-out test and frictional resistance characteristic of geogrids. Rock Soil Mech. 2009, 30, 960–964. [Google Scholar] [CrossRef]
  12. Liu, J. Study on Mechanical Properties and Reinforcing Mechanism of Geogrid Reinforced Gravelly Soil; Hefei University of Technology: Hefei, China, 2018. [Google Scholar]
  13. Mirzaalimohammadi, A.; Ghazavi, M.; Lajevardi, S.H.; Roustaei, M. Experimental Investigation on Pullout Behavior of Geosynthetics with Varying Dimension. Int. J. Géoméch. 2021, 21, 04021089. [Google Scholar] [CrossRef]
  14. Chen, J.-N.; Ren, X.; Xu, H.; Zhang, C.; Xia, L. Effects of Grain Size and Moisture Content on the Strength of Geogrid-Reinforced Sand in Direct Shear Mode. Int. J. Géoméch. 2022, 22, 04022006. [Google Scholar] [CrossRef]
  15. Zhao, L.; Cheng, G.D.; Ding, Y.J. Studies on Frozen Ground of China. J. Geogr. Sci. 2004, 14, 411–416. [Google Scholar] [CrossRef]
  16. Song, Y.Y. Study on Reinforced Performance of Geogrids in Seasonal Frozen Soil; Northeast Electric Power University: Jilin, China, 2017. [Google Scholar]
  17. Chen, R.; Wang, X.Q.; Hao, D.X.; Song, Y.Y.; Xue, N. Experimental Investigation on Reinforced Characteristics of Geogrids in Seasonal Frozen Soil. Chin. J. Geotech. Eng. 2019, 41, 1101–1107. [Google Scholar] [CrossRef]
  18. Wei, J.; Xu, Z.Y.; Bao, L.M.; Ge, J.J. Experimental Study on Embankment Slope Protection with Geocell in Permafrost Regions of Qinghai-Tibet Railway. Chin. J. Rock Mech. Eng. 2006, 3168–3173. [Google Scholar] [CrossRef]
  19. Bai, Q.; He, G.; Wang, Y.; Liu, J. Experimental Investigation on Mechanical Properties of Geocell Strips at Low Temperature. Materials 2022, 15, 5456. [Google Scholar] [CrossRef]
  20. Xu, J.; Niu, F.J.; Niu, Y.H.; Hou, Z.J. Analysis on The Moisture Migration of Subgrade Soil Under Effect of Temperature Gradient. J. Chongqing Univ. 2013, 36, 150–158. [Google Scholar] [CrossRef]
  21. Wang, Y.H. Macroscopic and Mesoscopic Experimental Study on The Mechanism of Water Migration of Coarse Grained Soil under Freezing-Thawing Cycle And Load; Shijiazhuang Tiedao University: Shijiazhuang, China, 2020. [Google Scholar]
  22. Wang, E.L.; Xu, X.Y. Experimental Study on Tensile Characteristics of Plastic Geogrid under Low Temperature. Rock Soil Mech. 2008, 29, 1507–1511. [Google Scholar] [CrossRef]
  23. JTG E50-2006; Test Methods of Geosynthetics for Highway Engineering. PRC Ministry of Transportation: Beijing, China. (In Chinese)
  24. SL 235-2012; Specification for Test and Measurement of Geosynthetics. China Water Resources and Hydropower Press: Beijing, China, 2012. (In Chinese)
  25. ASTM D6706-01; Standard Test Method for Measuring Geosynthetic Pullout Resistance in Soil. ASTM: West Conshohocken, PA, USA, 2013.
  26. He, P.F.; Ma, W.; Mu, Y.H.; Dong, J.H.; Huang, Y.T. Study on Freezing Strength Characteristics and Formation Mechanism of Frozen Soil-Concrete Interface. Trans. Chin. Soc. Agric. Eng. 2018, 34, 127–133. [Google Scholar] [CrossRef]
  27. Xie, Y.M.; Chen, T.; Wang, J.Z.; Gu, S.B.; Zhu, F.Y. Study on Dynamic Shear Characteristics of Frozen Clay-Concrete Interface. J. Railw. Sci. Eng. 2022. [Google Scholar] [CrossRef]
  28. Ma, D.D.; Ma, Q.Y.; Huang, K.; Yuan, P.; Yao, Z.M. Strength of Artificially Frozen Silty Clay with Different Negative Temperatures under Dynamic and Static Combined Loading and Deformation Characteristic Analysis. J. Vib. Shock. 2022, 41, 154–160. [Google Scholar] [CrossRef]
  29. Esmaeili-Falak, M.; Katebi, H.; Javadi, A.A. Effect of Freezing on Stress–Strain Characteristics of Granular and Cohesive Soils. J. Cold Reg. Eng. 2020, 34. [Google Scholar] [CrossRef]
  30. Wang, J.; Gutierrez, M. Discrete element simulations of direct shear specimen scale effects. Géotechnique 2010, 60, 395–409. [Google Scholar] [CrossRef] [Green Version]
  31. Suits, L.D.; Sheahan, T.; Cerato, A.; Lutenegger, A. Specimen Size and Scale Effects of Direct Shear Box Tests of Sands. Geotech. Test. J. 2006, 29, 6. [Google Scholar] [CrossRef]
  32. Wen, Z.; Yu, Q.H.; Ma, W.; Dong, S.S.; Wang, D.Y.; Niu, F.J.; Zhang, M.L. Experimental Investigation on The Effect of Fiberglass Reinforced Plastic Cover on Adfreeze Bond Strength. Cold Reg. Sci. Technol. 2016, 131, 108–115. [Google Scholar] [CrossRef]
  33. Ma, W.; Wang, D.Y. Frozen Soil Mechanics; China Science Publishing: Beijing, China, 2014. [Google Scholar]
  34. Chen, R.; Hao, D.X.; Luan, M.T.; Zhao, W. Reinforcement Mechanism of Transverse and Longitudinal Geogrid Ribs. J. Build. Materials. 2013, 16, 544–548. [Google Scholar] [CrossRef]
  35. Wang, J.Q.; Zhou, J.; Huang, L.Y.; Huang, S.B. Macroscopic and Mesoscopic Studies of Interface Interaction on Geosynthetics by Use of Large Direct Shear Tests. Chin. J. Geotech. Eng. 2013, 35, 908–915. [Google Scholar]
  36. Zheng, J.J.; Cao, W.Z.; Zhou, Y.J.; Jiang, J.G. Pull-Out Test Study of Interface Behavior Between Triaxial Geogrid and Soil. Rock Soil Mech. 2017, 38, 317–324. [Google Scholar] [CrossRef]
  37. Palmeira, E.M. Soil–geosynthetic interaction: Modelling and analysis. Geotext. Geomembr. 2009, 27, 368–390. [Google Scholar] [CrossRef]
  38. Wang, Q.Z.; Zhu, X.X.; Liu, J.K.; Lv, P.; Liu, Z.Y. Experimental Study on Direct Shear Tests of Coarse-grained Fillings of High-speed Railway Subgrade in Cold Region. J. China Railw. Society. 2016, 38, 102–109. [Google Scholar] [CrossRef]
  39. Tang, L.Y.; Wang, X.; Qiu, P.Y.; Jin, L. Study on Shear Performance of Soil-Rock Mixture at the Freezing-Thawing Interface in Permafrost Regions. Rock Soil Mech. 2020, 41, 3225–3235. [Google Scholar] [CrossRef]
  40. Du, Y.; Tang, L.Y.; Yang, L.J.; Wang, X.; Bai, M.M. Interface Characteristics of Frozen Soil-Structure Thawing Process Based on Nuclear Magnetic Resonance. Chin. J. Geotech. Eng. 2019, 41, 2316–2322. [Google Scholar] [CrossRef]
  41. Liu, K.F.; Xu, J.P.; Zhou, Q.S.; Xie, X.Y.; Hu, Y. Large-Scale Direct Shear Tests on Properties of Geogrid-Soil Interfaces. Chin. J. Geotech. Eng. 2019, 41, 185–188. [Google Scholar] [CrossRef]
  42. Ochiai, H.; Yasufuku, N.; Yamaji, T.; Xu, G.-L.; Hirai, T. Experimental Evaluation of Reinforcement in Geogrid-Soil Structure. In Proceedings of the International Symposium on Earth Reinforcement, Kyushu, Japan, 12–14 November 1996; pp. 249–254. [Google Scholar]
  43. Wang, Z.; Jacobs, F.; Ziegler, M. Experimental and DEM investigation of geogrid–soil interaction under pullout loads. Geotext. Geomembr. 2016, 44, 230–246. [Google Scholar] [CrossRef]
Figure 1. YT1200S direct shear pullout friction instrument for geosynthetics.
Applsci 12 10187 g001
Figure 2. Soil box of the direct shear test and schematic diagram of the specimen stress. (a) Soil box; (b) schematic diagram of specimen stress.
Applsci 12 10187 g002
Figure 3. Particle gradation curve of typical coarse-grained soil in Xinjiang, China.
Applsci 12 10187 g003
Figure 4. Uniaxial HDPE geogrid.
Applsci 12 10187 g004
Figure 5. The electronic machine with controlled temperature.
Applsci 12 10187 g005
Figure 6. Arrangement of soil temperature measuring points in the box.
Applsci 12 10187 g006
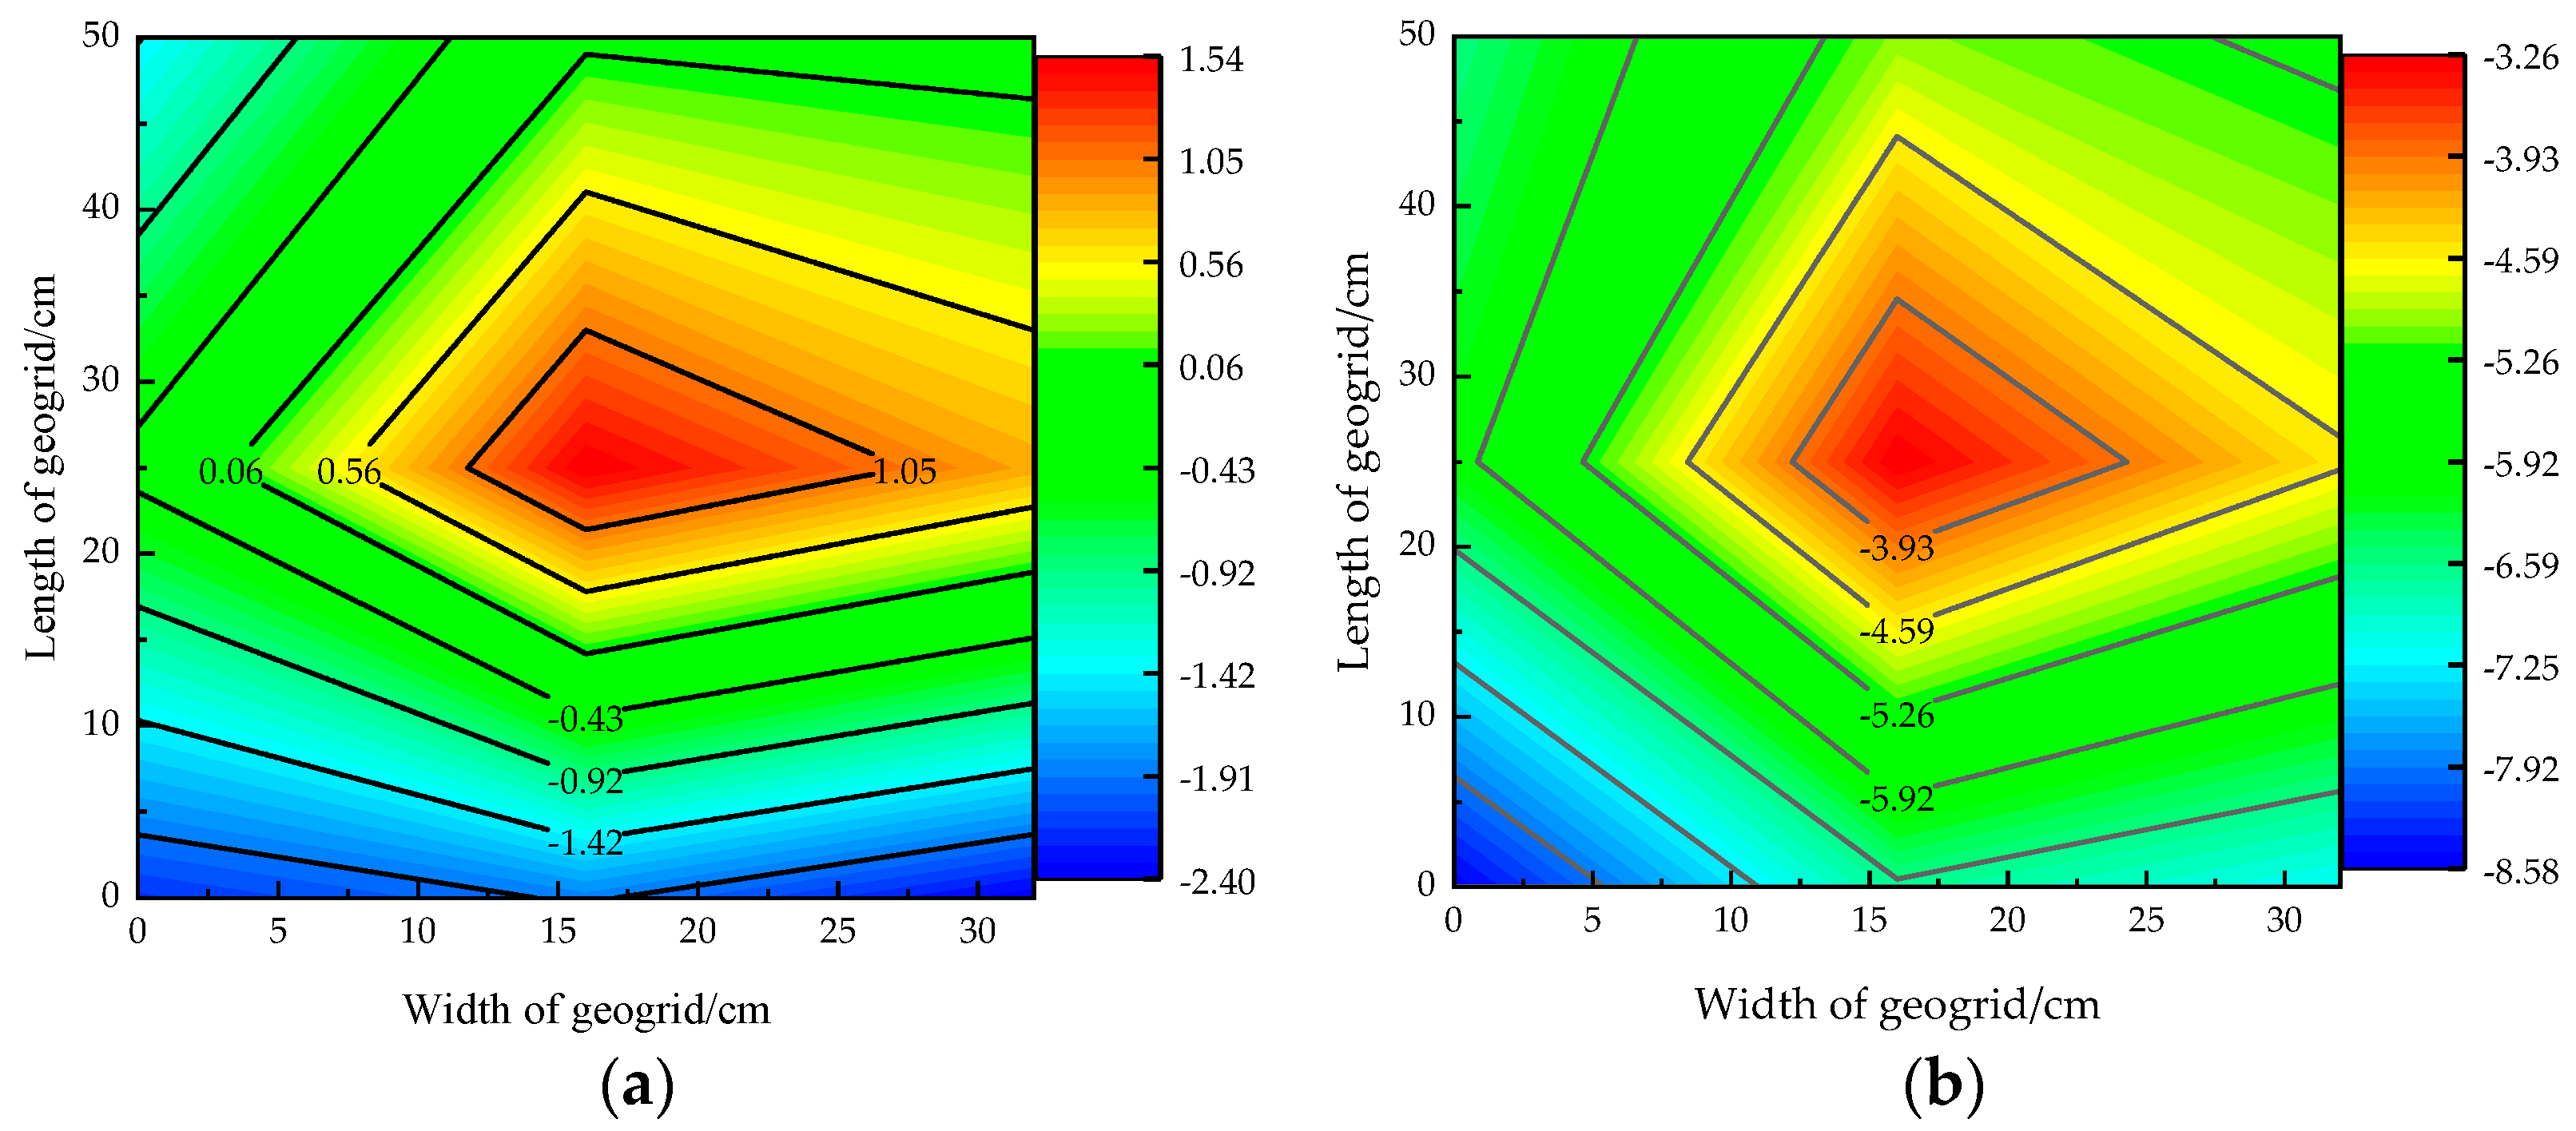
Figure 7. The actual temperature distribution of each point at the reinforced soil interface at different temperatures (based on the sheared end of the soil). (a) 0 °C; (b) −5 °C.
Applsci 12 10187 g007
Figure 8. Shear displacement-shear stress curve of the reinforced soil interface under a nonfrozen state (0 °C): (a) 2% water content; (b) 4.5% water content; (c) 7% water content.
Applsci 12 10187 g008
Figure 9. The relationship curve between the shear strength and normal stress of the reinforced soil interface under a nonfreezing state (0 °C).
Applsci 12 10187 g009
Figure 10. The influence of water content on the peak shear stress of the reinforced soil interface under the nonfreezing state (0 °C).
Applsci 12 10187 g010
Figure 11. Shear displacement-shear stress curve of the reinforced soil interface under a frozen state (−5 °C): (a) 2% water content; (b) 4.5% water content; (c) 7% water content.
Applsci 12 10187 g011
Figure 12. The relationship curve between the shear strength and normal stress of the reinforced soil interface under the freezing state (−5 °C).
Applsci 12 10187 g012
Figure 13. The influence of water content on the peak shear stress of the reinforced soil interface under the freezing state (−5 °C).
Applsci 12 10187 g013
Figure 14. Change curve of apparent friction coefficient.
Applsci 12 10187 g014
Figure 15. The relationship between horizontal and normal displacement of reinforced soil composite under different normal stress during shear process.
Applsci 12 10187 g015
Figure 16. Interaction mechanism of reinforced soil composite under freezing state.
Applsci 12 10187 g016
Table 1. Physical and mechanical properties index of coarse-grained soil.
Characteristic Particle SizeCoefficient of UniformityCoefficient of CurvatureMaximum Dry Density/g·cm−3Optimum Water Content/%
d60d30d10
7.512.30.5413.91.32.394.37
Table 2. Summary table of tensile mechanical property data of geogrids under different low temperatures.
Table 1.Tensile Force of Different Elongation/kN·m−1Fracture Tensile Force
/kN·m−1
Fracture Elongation
/%
F1%F2%F3%F4%F5%
0 °C22.6033.3141.4248.7455.6085.2811.45
−5 °C26.1438.8248.5057.2465.4391.579.90
Note: F1%, F2%, F3%, F4% and F5% are the corresponding tensile forces when the elongation of the geogrid sample is 1%, 2%, 3%, 4% and 5%, respectively.
Table 3. Shear strength index of the reinforced soil interface.
SampleStrength Fitting CurveGoodness of Fit
R2
Cohesion
c/kPa
Internal Friction Angle
φ
0 °C2%y = 0.41x + 9.970.999.9722.29
4.5%y = 0.37x + 17.570.9917.5720.30
7%y = 0.48x + 8.380.968.3825.64
−5 °C2%y = 0.35x + 17.880.9717.8819.29
4.5%y = 0.27x + 29.250.9129.2515.11
7%y = 0.29x + 27.870.9027.8716.17
Publisher’s Note: MDPI stays neutral with regard to jurisdictional claims in published maps and institutional affiliations.