Article

Comparing the Measured and Thermodynamically Predicted AFm Phases in a Hydrating Cement

1
School of Transport & Civil Engineering, Technological University Dublin, D07 EWV4 Dublin, Ireland
2
Institute of Advanced Study, Collegium Basilea, 4053 Basel, Switzerland
3
School of the Natural and Built Environment, Queens University Belfast, Belfast BT9 5PX, UK
*
Author to whom correspondence should be addressed.
Appl. Sci. 2022, 12(19), 10147; https://doi.org/10.3390/app121910147
Submission received: 17 August 2022 / Revised: 30 September 2022 / Accepted: 6 October 2022 / Published: 9 October 2022

Abstract

:
In hydrating Portland cements, more than one of the AFm family of calcium aluminates may exist. Depending on the amount of carbonate and sulfate present in the cement, the most common phase to precipitate is monosulfate, monocarbonate and/or hemicarbonate. It has been reported in the literature that hemicarbonate often appears in measurements such as XRD but not predicted to form/equilibrate in thermodynamic models. With the ongoing use of commercial cements such as CEM I and CEM II containing more and more limestone, it is important to understand which hydrate solids physically precipitate and numerically predict over time. Using 27 cement samples with three w/c ratios analysed at 1, 3 and 28 days, this paper shows that although hemicarbonate was observed in a hydrating commercial Portland cement, as well as being predicted based on its carbonate (CO2/Al2O3) and sulfate (SO3/Al2O3) ratios, thermodynamic analysis did not predict it to equilibrate and form as a solid hydrate. Regardless of the w/c ratio, thermodynamic analysis did predict hemicarbonate to form for calcite contents < 2 wt.%. It appears that the dominant stability of monocarbonate in thermodynamic models leads to it precipitating and remaining as a persistent phase.

1. Introduction

Thermodynamic modelling of cement hydration has been investigated over the past two decades [1,2,3,4] and is considered a reliable means of predicting changes in anhydrous clinker, hydrated phase assemblages and pore solution chemistry of cement systems. This modelling approach requires only oxide proportions, water/cement (w/c) mass ratio, curing temperature, relative humidity and Blaine fineness as input parameters into suitable geochemical software and an appropriately formatted thermodynamic database.
The widely used and freely available geochemical software PHREEQC [5,6] has been shown by the current authors to be capable of predicting the hydration behaviour of Portland cement over time using an appropriate thermodynamic database and the molar reaction equations for the four main clinker phases alite (Ca3SiO5, C3S), belite (Ca2SiO4, C2S), aluminate (Ca3Al2O6, C3A), and aluminoferrite (Ca4Al2Fe3O10, C4AF). PHREEQC employs law of mass action equations to perform complex geochemical simulations, allowing the inclusion of kinetics and rates, solid solutions and competing reactions between solids, and liquids and gases at equilibrium, details of which can be found in [7]. In their most recent work [5], the current authors used PHREEQC to predict various properties, including phase assemblages and pore solution chemistry over time for CEM I cement.
The output from the thermodynamic analysis presented monocarbonate as the AFm phase precipitating, whereas when experimentally using XRD observations, hemicarbonate was also shown to form. Research in this area [8,9,10,11] shows which AFm phase—and several may coexist—is sensitive to the mix of hydroxide, alumina, sulfate or carbonate, or mixtures thereof. Matschei et al. [10] showed that only 3.9 and 7.7 wt.% of carbonate are sufficient to form hemicarbonate or monocarbonate, respectively. Carbonate AFm phases are reported to be more thermodynamically stable than sulfate phases, such as monosulfate. With modern commercial cements containing at least 4–5% calcite, it has a dual function of being reactive with cement and active during hydration and as an inert filler [10].
Subsequent research by Matschei et al. [8] and [12] found that, through XRD measurements, the initial formation of hemicarbonate was slowly transformed into monocarbonate. In aqueous systems, supported by thermodynamic calculations in Portland cement, hemicarbonate is unstable in the presence of calcite [13] even though there is little difference in solubility between the two carbonate phases. However, the difference in the solubility of hemi- and monocarbonate within the pore solution is rather small. Due to little difference in precipitation kinetics between hemi- and monocarbonate [13,14] and the slower dissolution of calcite above pH 9 [15], Matschei et al. [8] suggest the intermediate formation of hemicarbonate is most likely caused by the slow dissolution of limestone as insufficient dissolved carbonate is available. However, over time, with increasing calcite being available, hemicarbonate is converted to monocarbonate.
Georget et al. [11] demonstrated that due to foreign anions in its structure, hemicarbonate is stabilised and forms AFm carbonate–sulfate solid solutions. As a result, AFm phases will be stabilized with respect to ettringite and monocarbonate and these solid solutions could explain the differences between experiments and current thermodynamic models in long-term samples of cement blended with limestone.
In the current study, PHREEQC was used to undertake a full thermodynamic analysis of the hydration of CEM I cement in terms of predicting changes in anhydrous and hydrated phase assemblage and pore solution chemistry using suitable input parameters. Cement hydration is complicated by the need to provide an account of several features, including empirical rate equations to describe the dissolution of OPC clinker phases, oxide components dissolved in the OPC clinker phases, oversaturation of pore solution with respect to specific phases during the first 12 h of hydration, and the release and uptake of the alkali elements K and Na by the C-S-H. All these features were addressed in the current study and have been successfully implemented into PHREEQC to provide live graphical output and comparisons with experimental data from the literature.

2. Materials and Methods

2.1. Specimen Preparation

All experiments were carried out using the same commercial Portland cement, manufactured to meet the requirements of EN197-1 [16]. The chemical compositions (using XRF) and normalised entire clinker phase are shown in Table 1. Three cement pastes were prepared with w/c ratios of 0.4, 0.5 and 0.6 at 20 °C and each was subjected to TGA, XRD and isothermal calorimetry analysis at various stages of hydration (1, 7 and 28 days).
Samples were manually mixed by hand due to their size and mixed with water to create the three w/c ratios. Samples for XRD analysis were 5 g in mass and prepared for analysis by pulverising using a mortar and pestle. Approximately 36–40 mg of cement was used for each TGA analysis, again pulverised using a mortar and pestle ahead of testing. Heat of hydration samples were prepared by preparing 50 g samples of cement with water in a beaker for 2–3 min to create a paste. All samples were cured in sealed steel vials at 20 °C and removed for testing at 1, 7 or 28 days.

2.2. XRD and TGA/DTG Analysis

XRD was carried out on unhydrated and hydrating samples with a PANalytical X’Pert PRO diffractometer applying CuKα radiation of wavelength 1.54 Å. Diffraction patterns were obtained between 5 and 65°2θ with a step size of 0.02° 2θ. The mineralogy of the various samples was determined by using PANalyticals X’Pert Highscore Plus software in conjunction with the Powder Diffraction File database.
Once the various phases were identified, the crystallographic details of each phase were refined using the Rietveld method within the Highscore software to produce a pattern match. TGA was carried out using Netzsch’s TG 209 F1 Libra. The temperature was increased up to 1000 °C at a rate of 10 °C/min in a flowing nitrogen environment. Derivative thermogravimetric analysis (DTG) was used to confirm the presence of phases and hydrates by delineating the peak boundaries.

2.3. Isothermal Calorimetry Analysis

The heat of hydration of the three samples was measured over seven days using a TAM Air isothermal calorimetry apparatus. After preparation, approximately 5 g of each paste was transferred to a plastic ampoule and inserted into the calorimeter at a temperature of 20 °C. The heat evolution after the initial 45 min was measured as a function of time.

3. Experimental Results

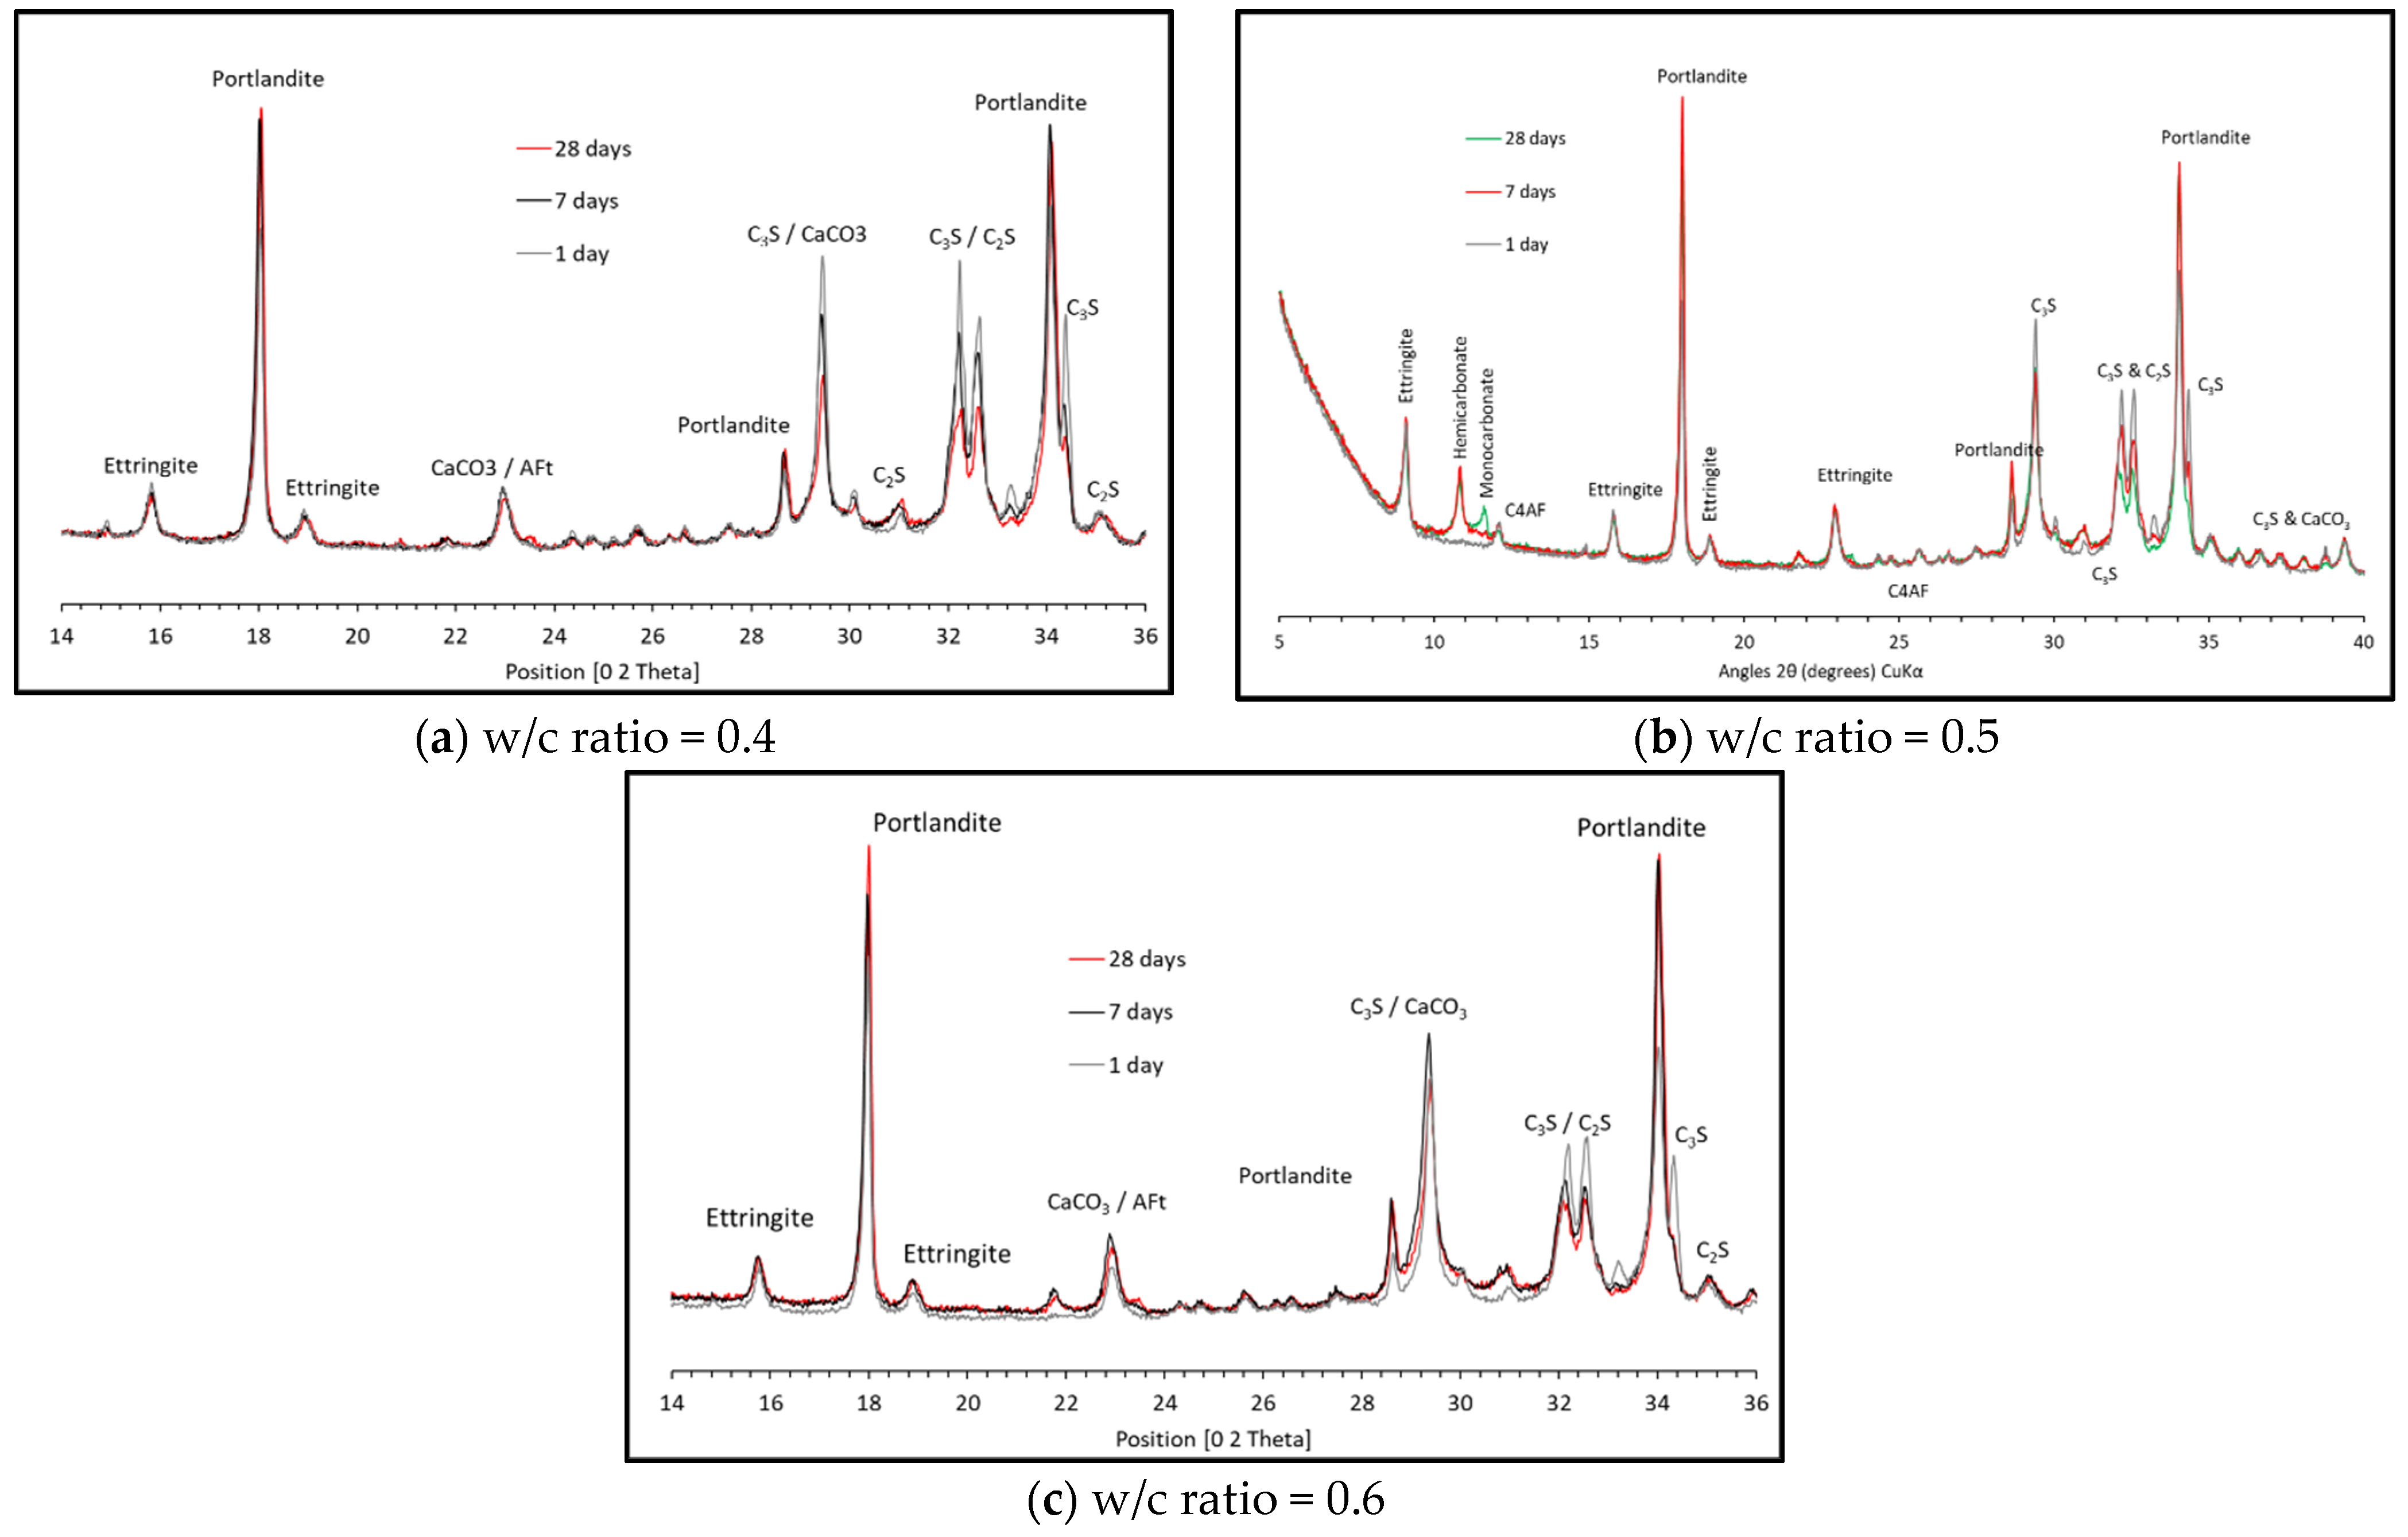
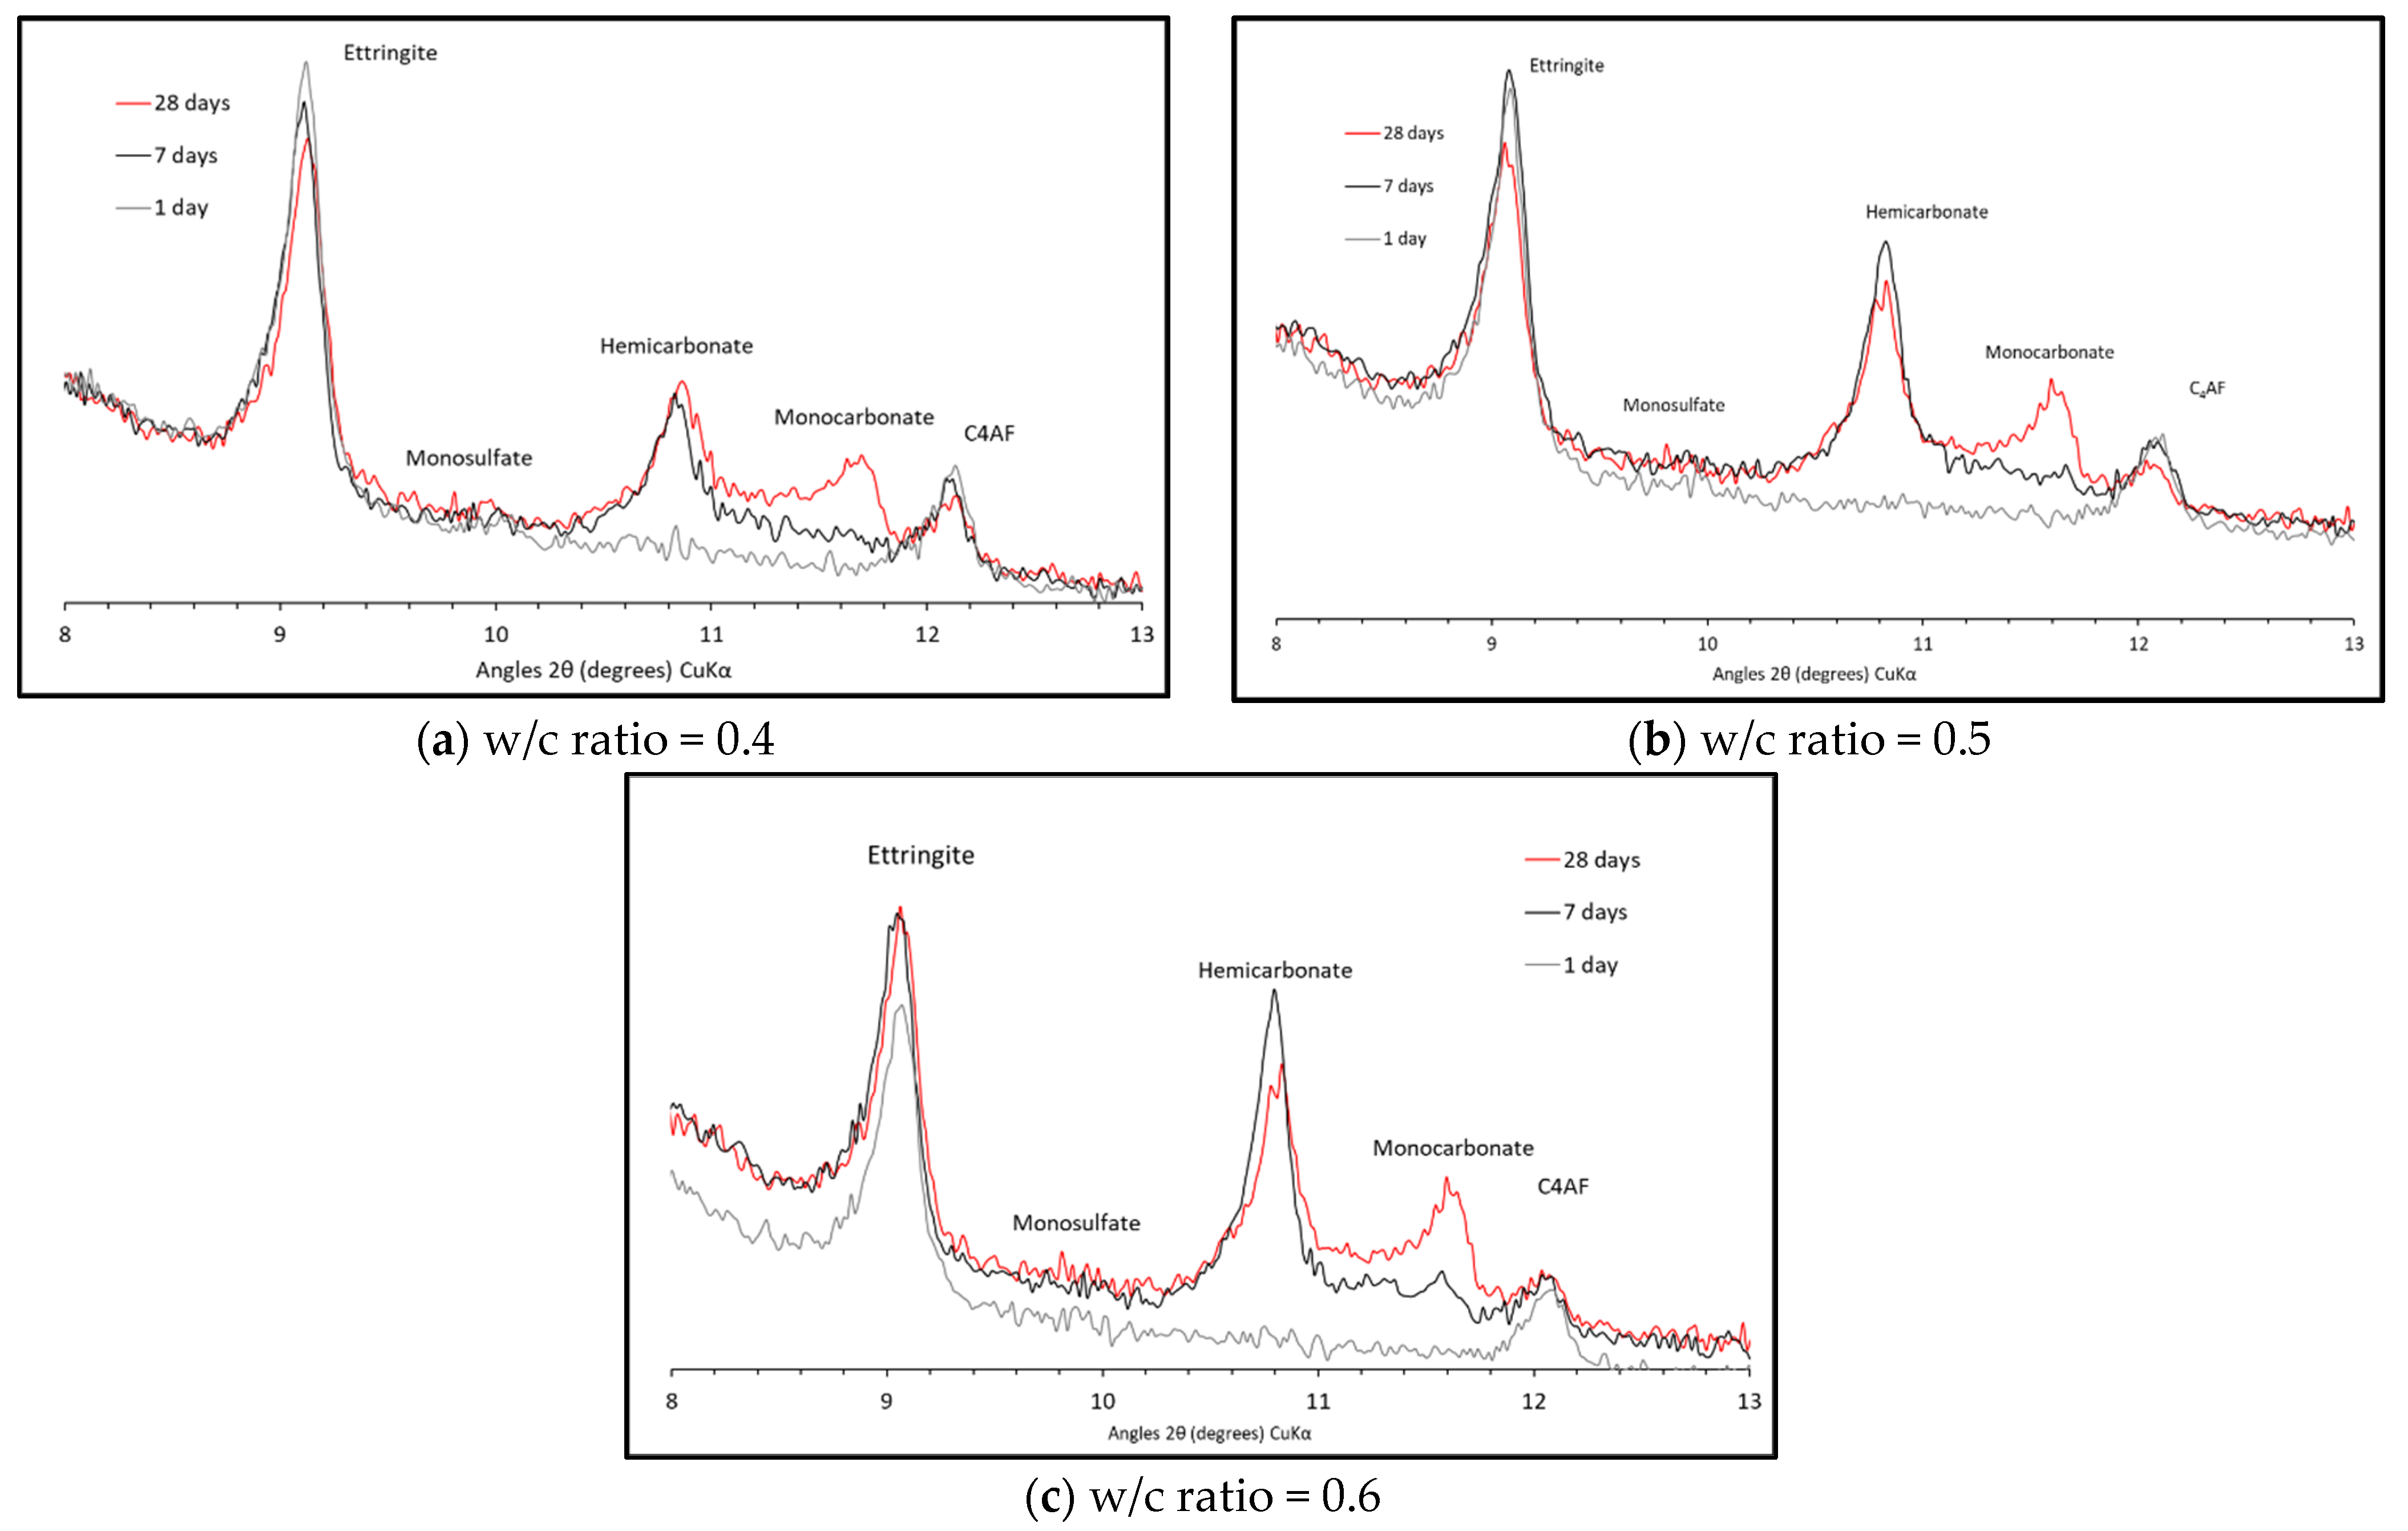
3.1. Solid Phases XRD

Figure 1 shows the XRD pattern at 1, 7 and 28 days for the three w/c ratios. The main hydration products in each are portlandite, ettringite and AFm phases, assumed to be carboaluminates rather than monosulfate as ettringite remains stable over the 28-day period. XRD patterns between 8–13 angle 2θ in Figure 2 for the three w/c ratios show no hemicarbonate and monocarbonate forming after one day of hydration. After seven days, however, both are observed, and again after 28 days. At one day, all the reactive aluminates form ettringite and, as the calcium sulphate is depleted, the remaining calcium aluminates will hydrate and will form hemi- and monocarbonate instead of ettringite.

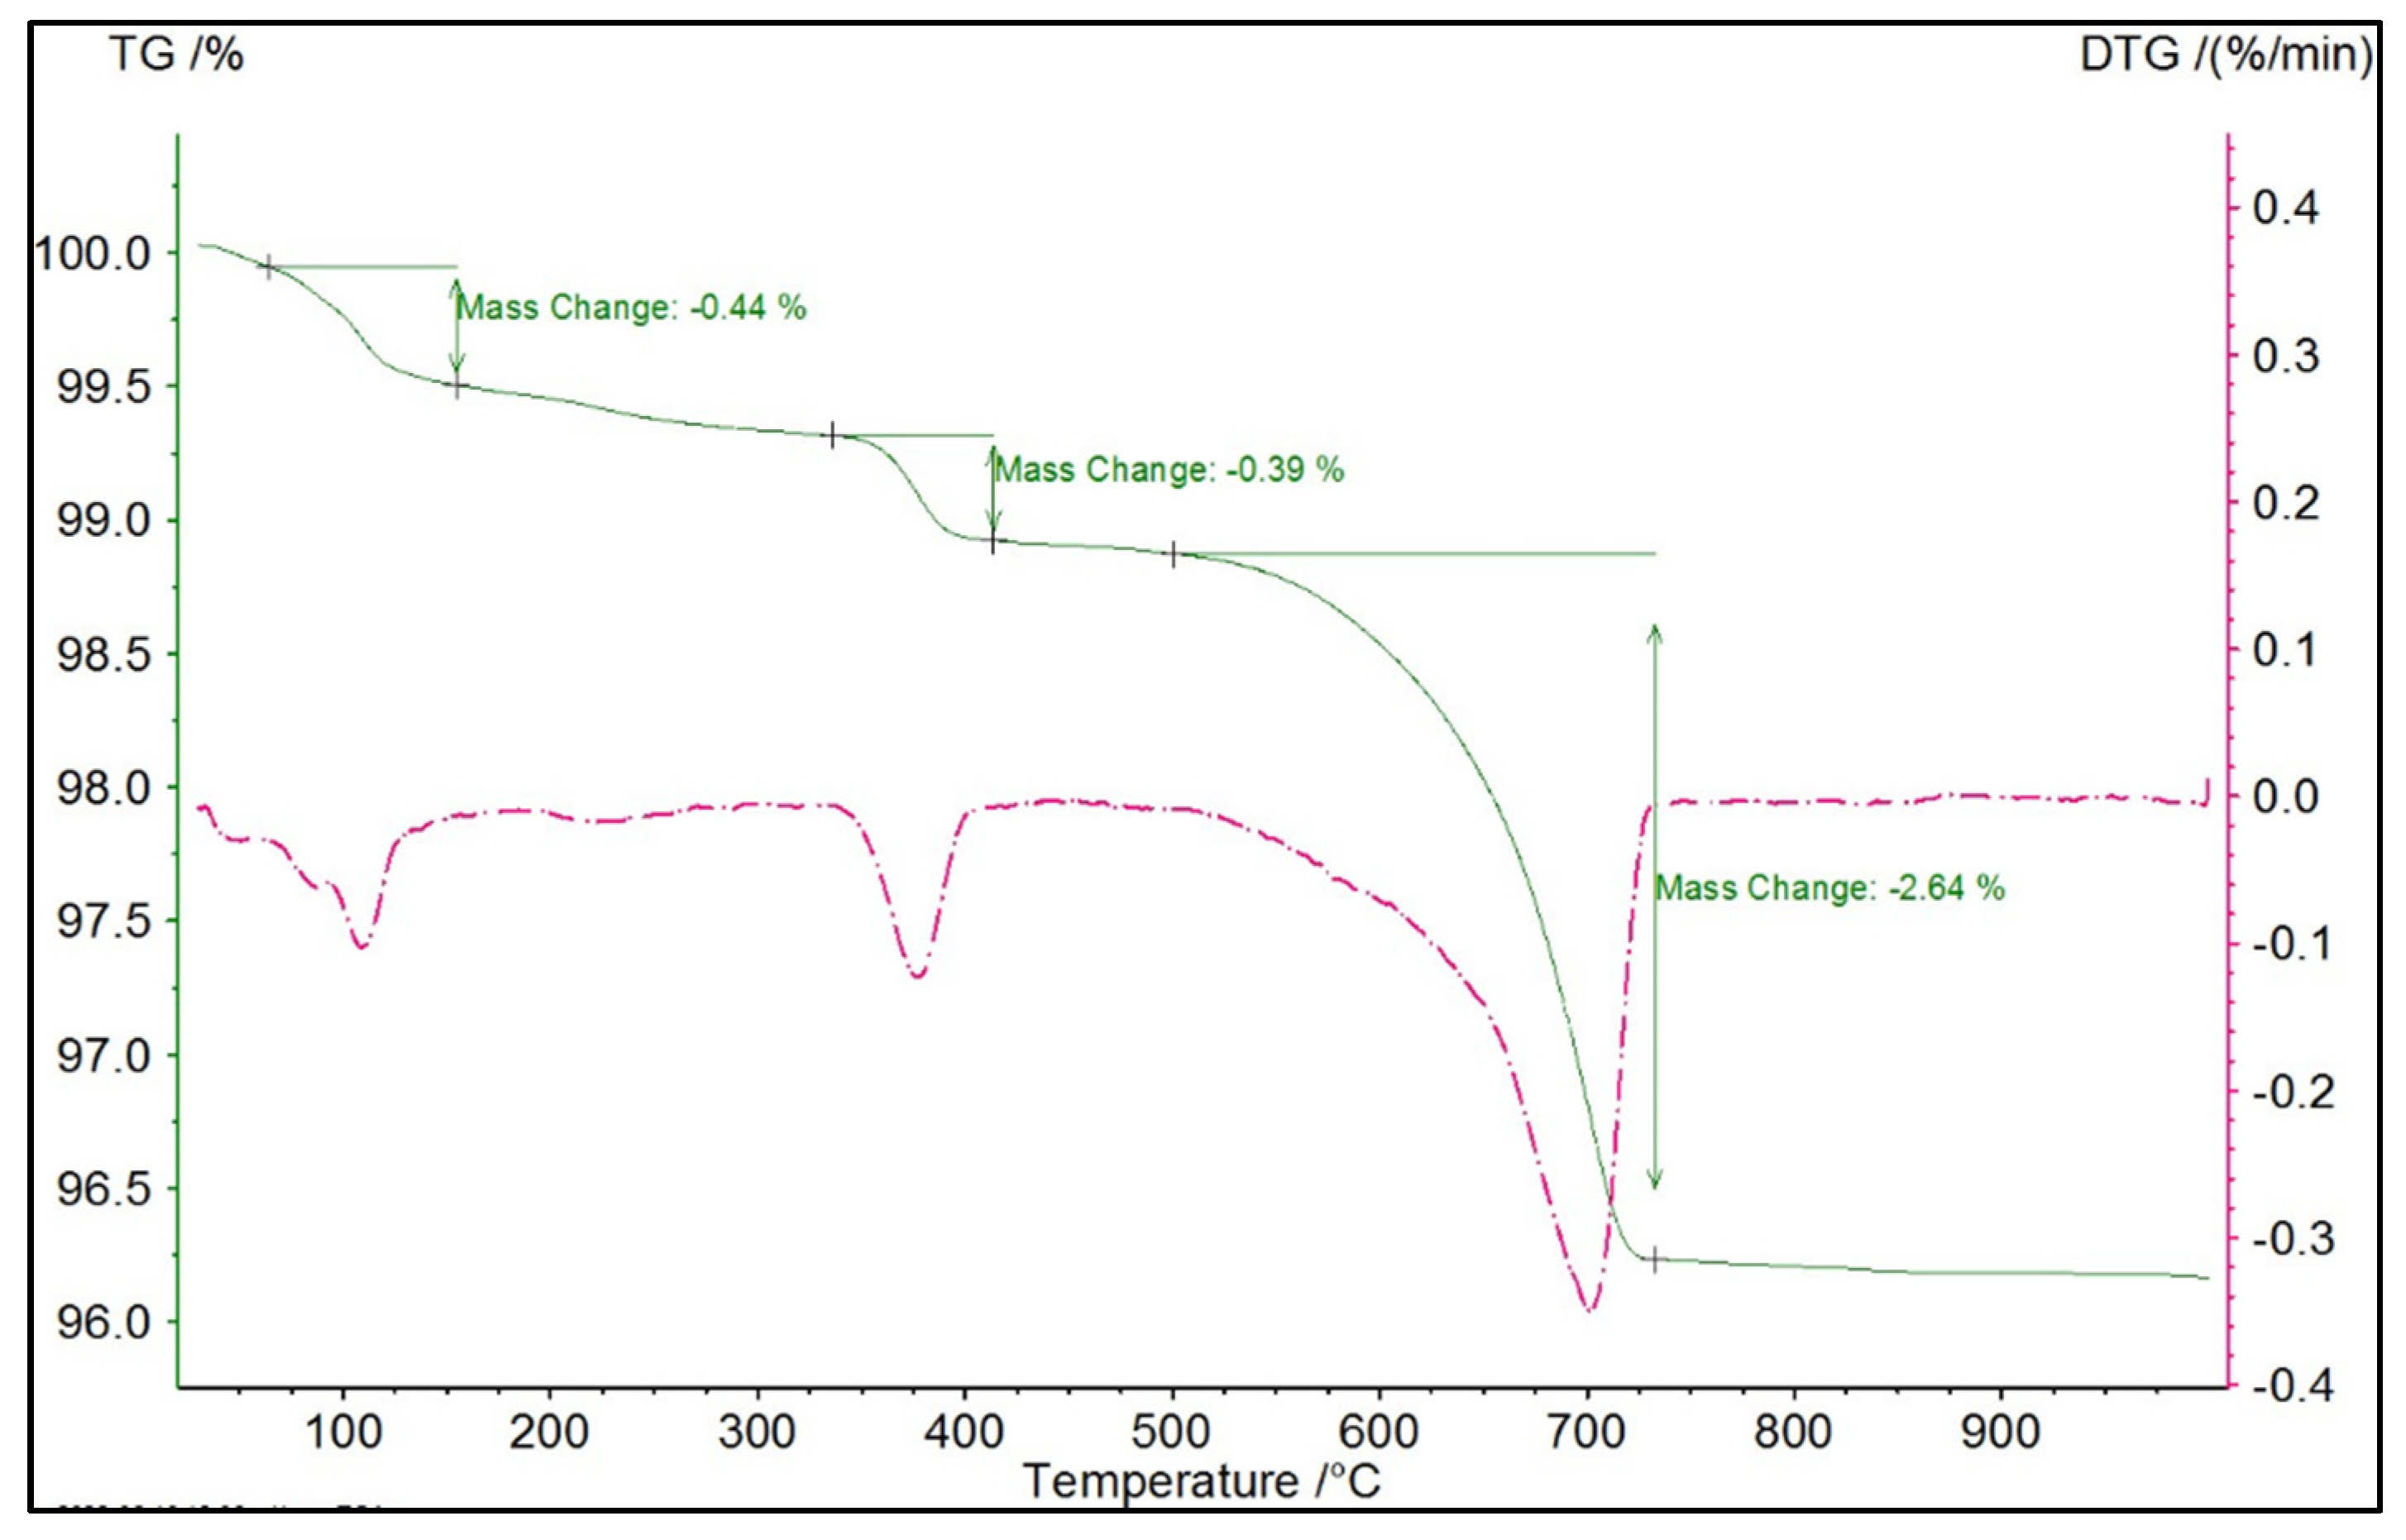
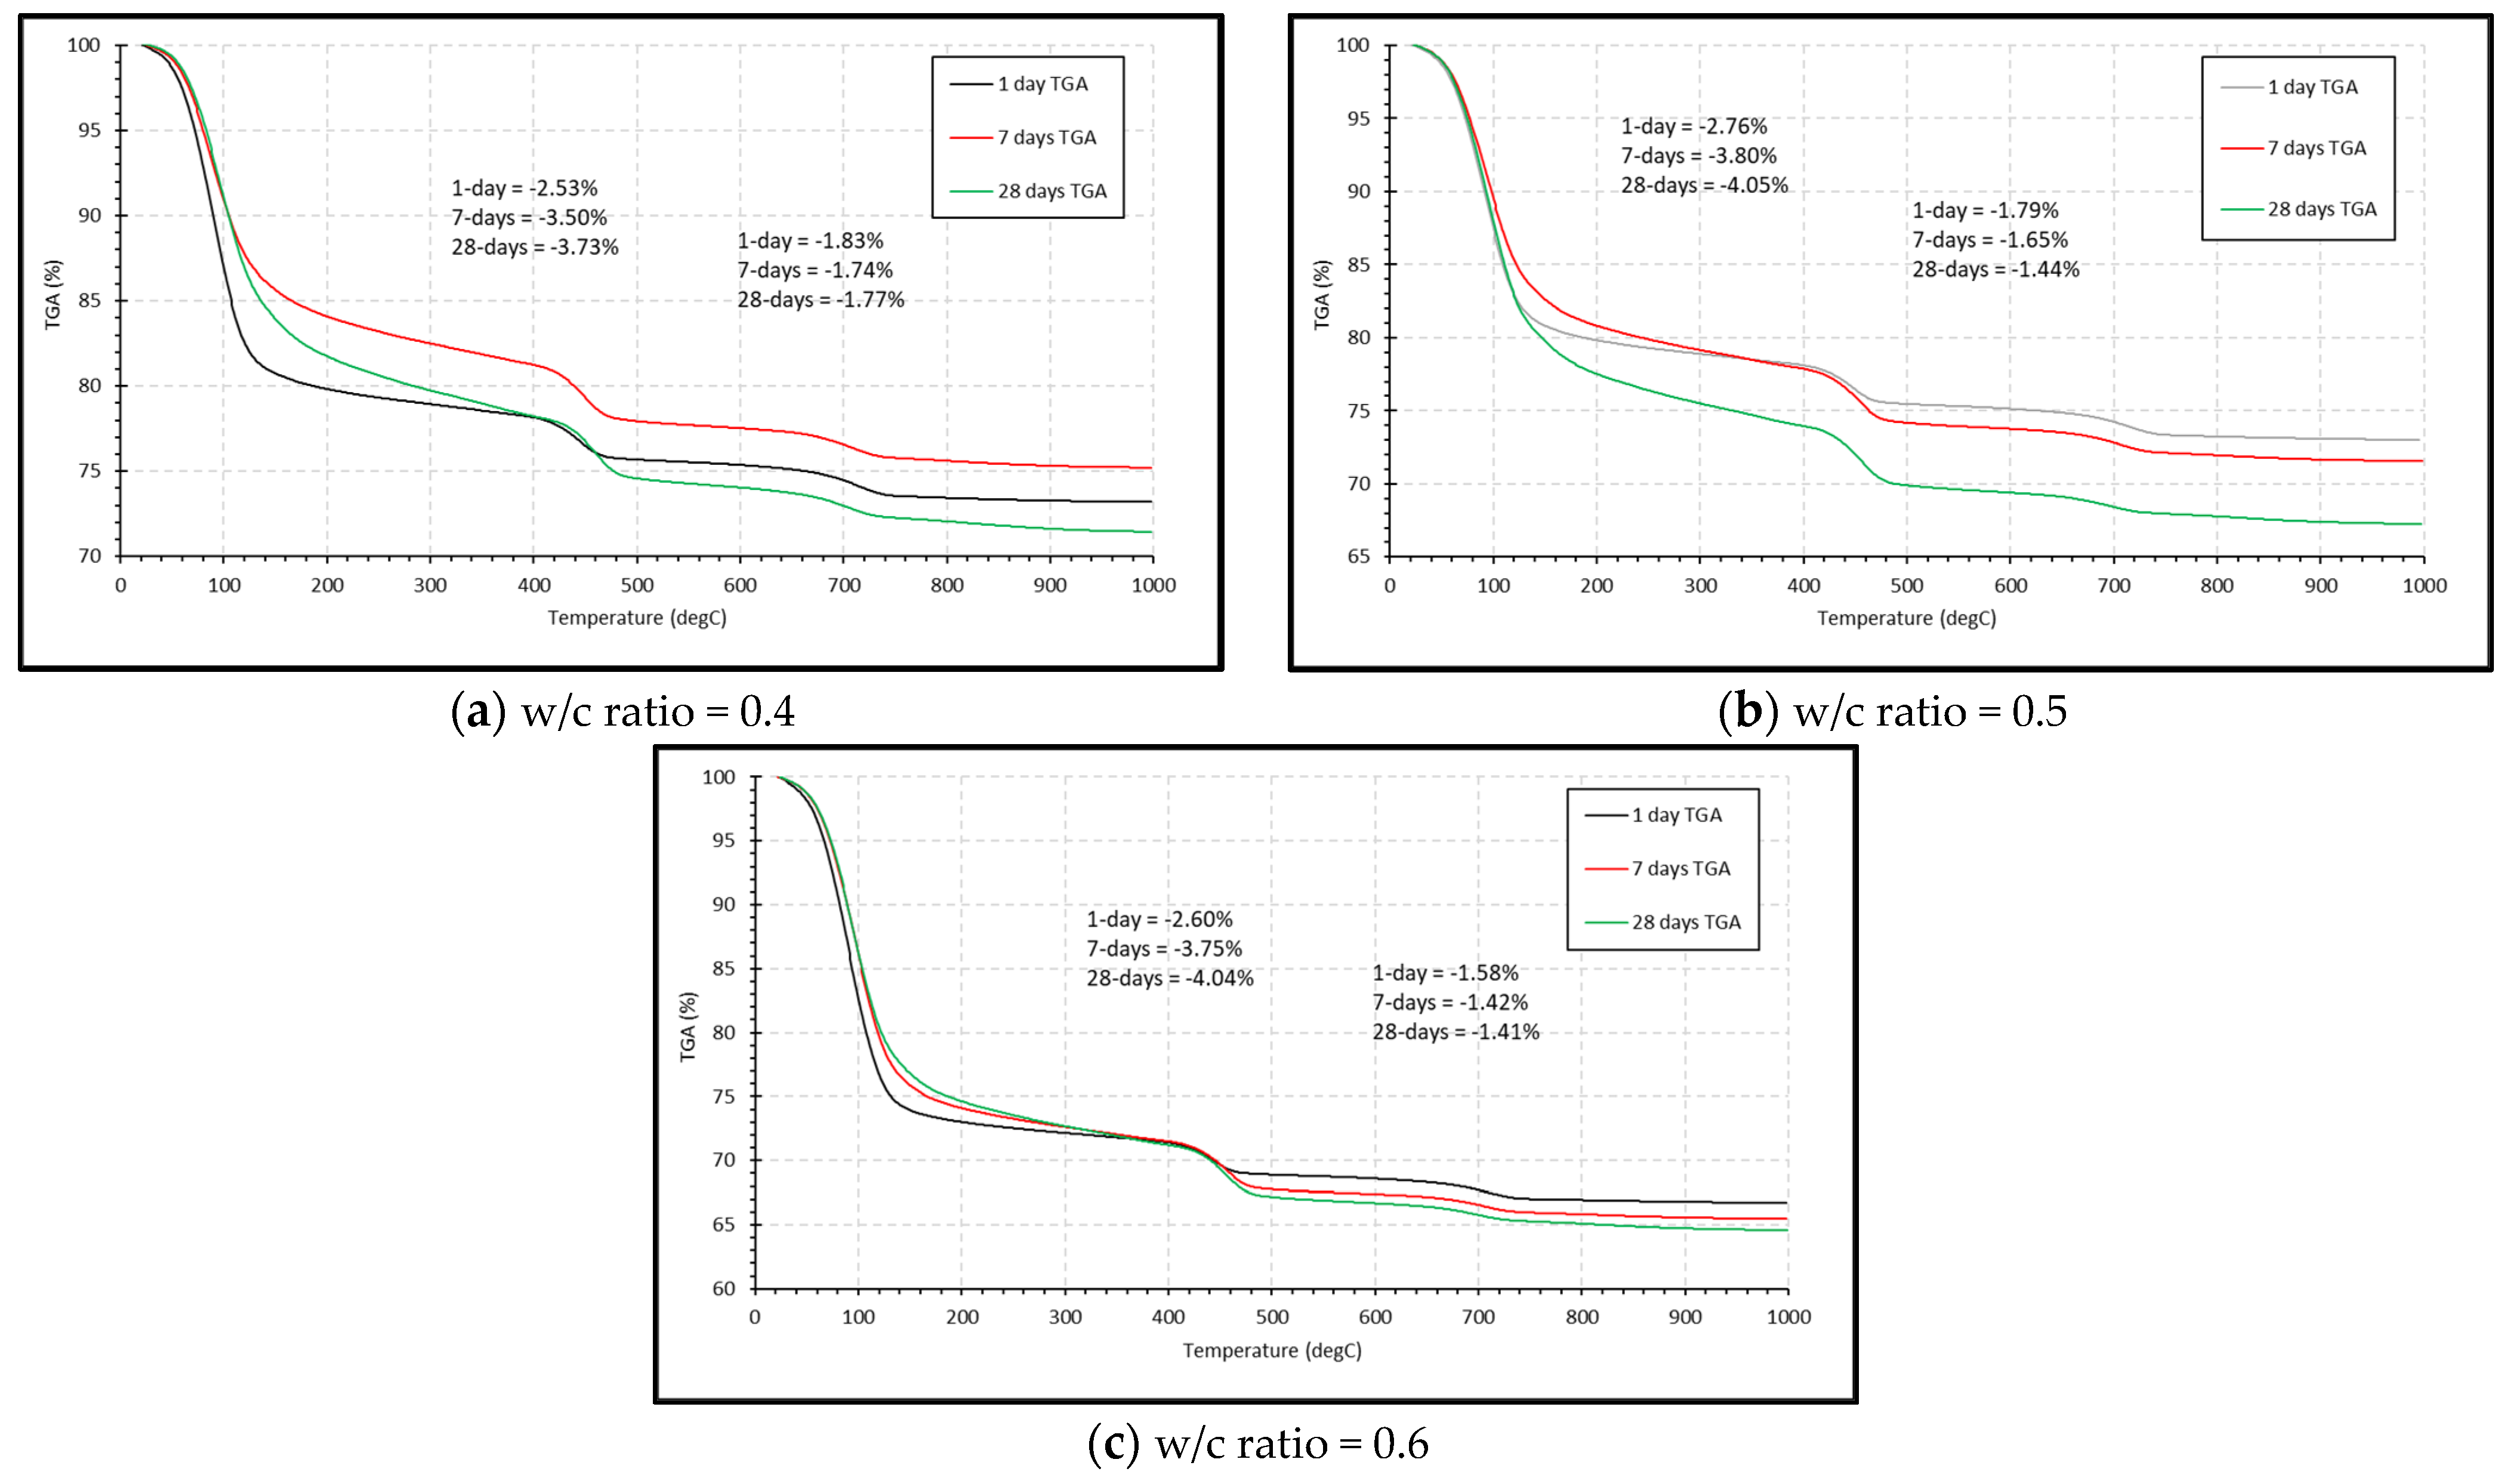
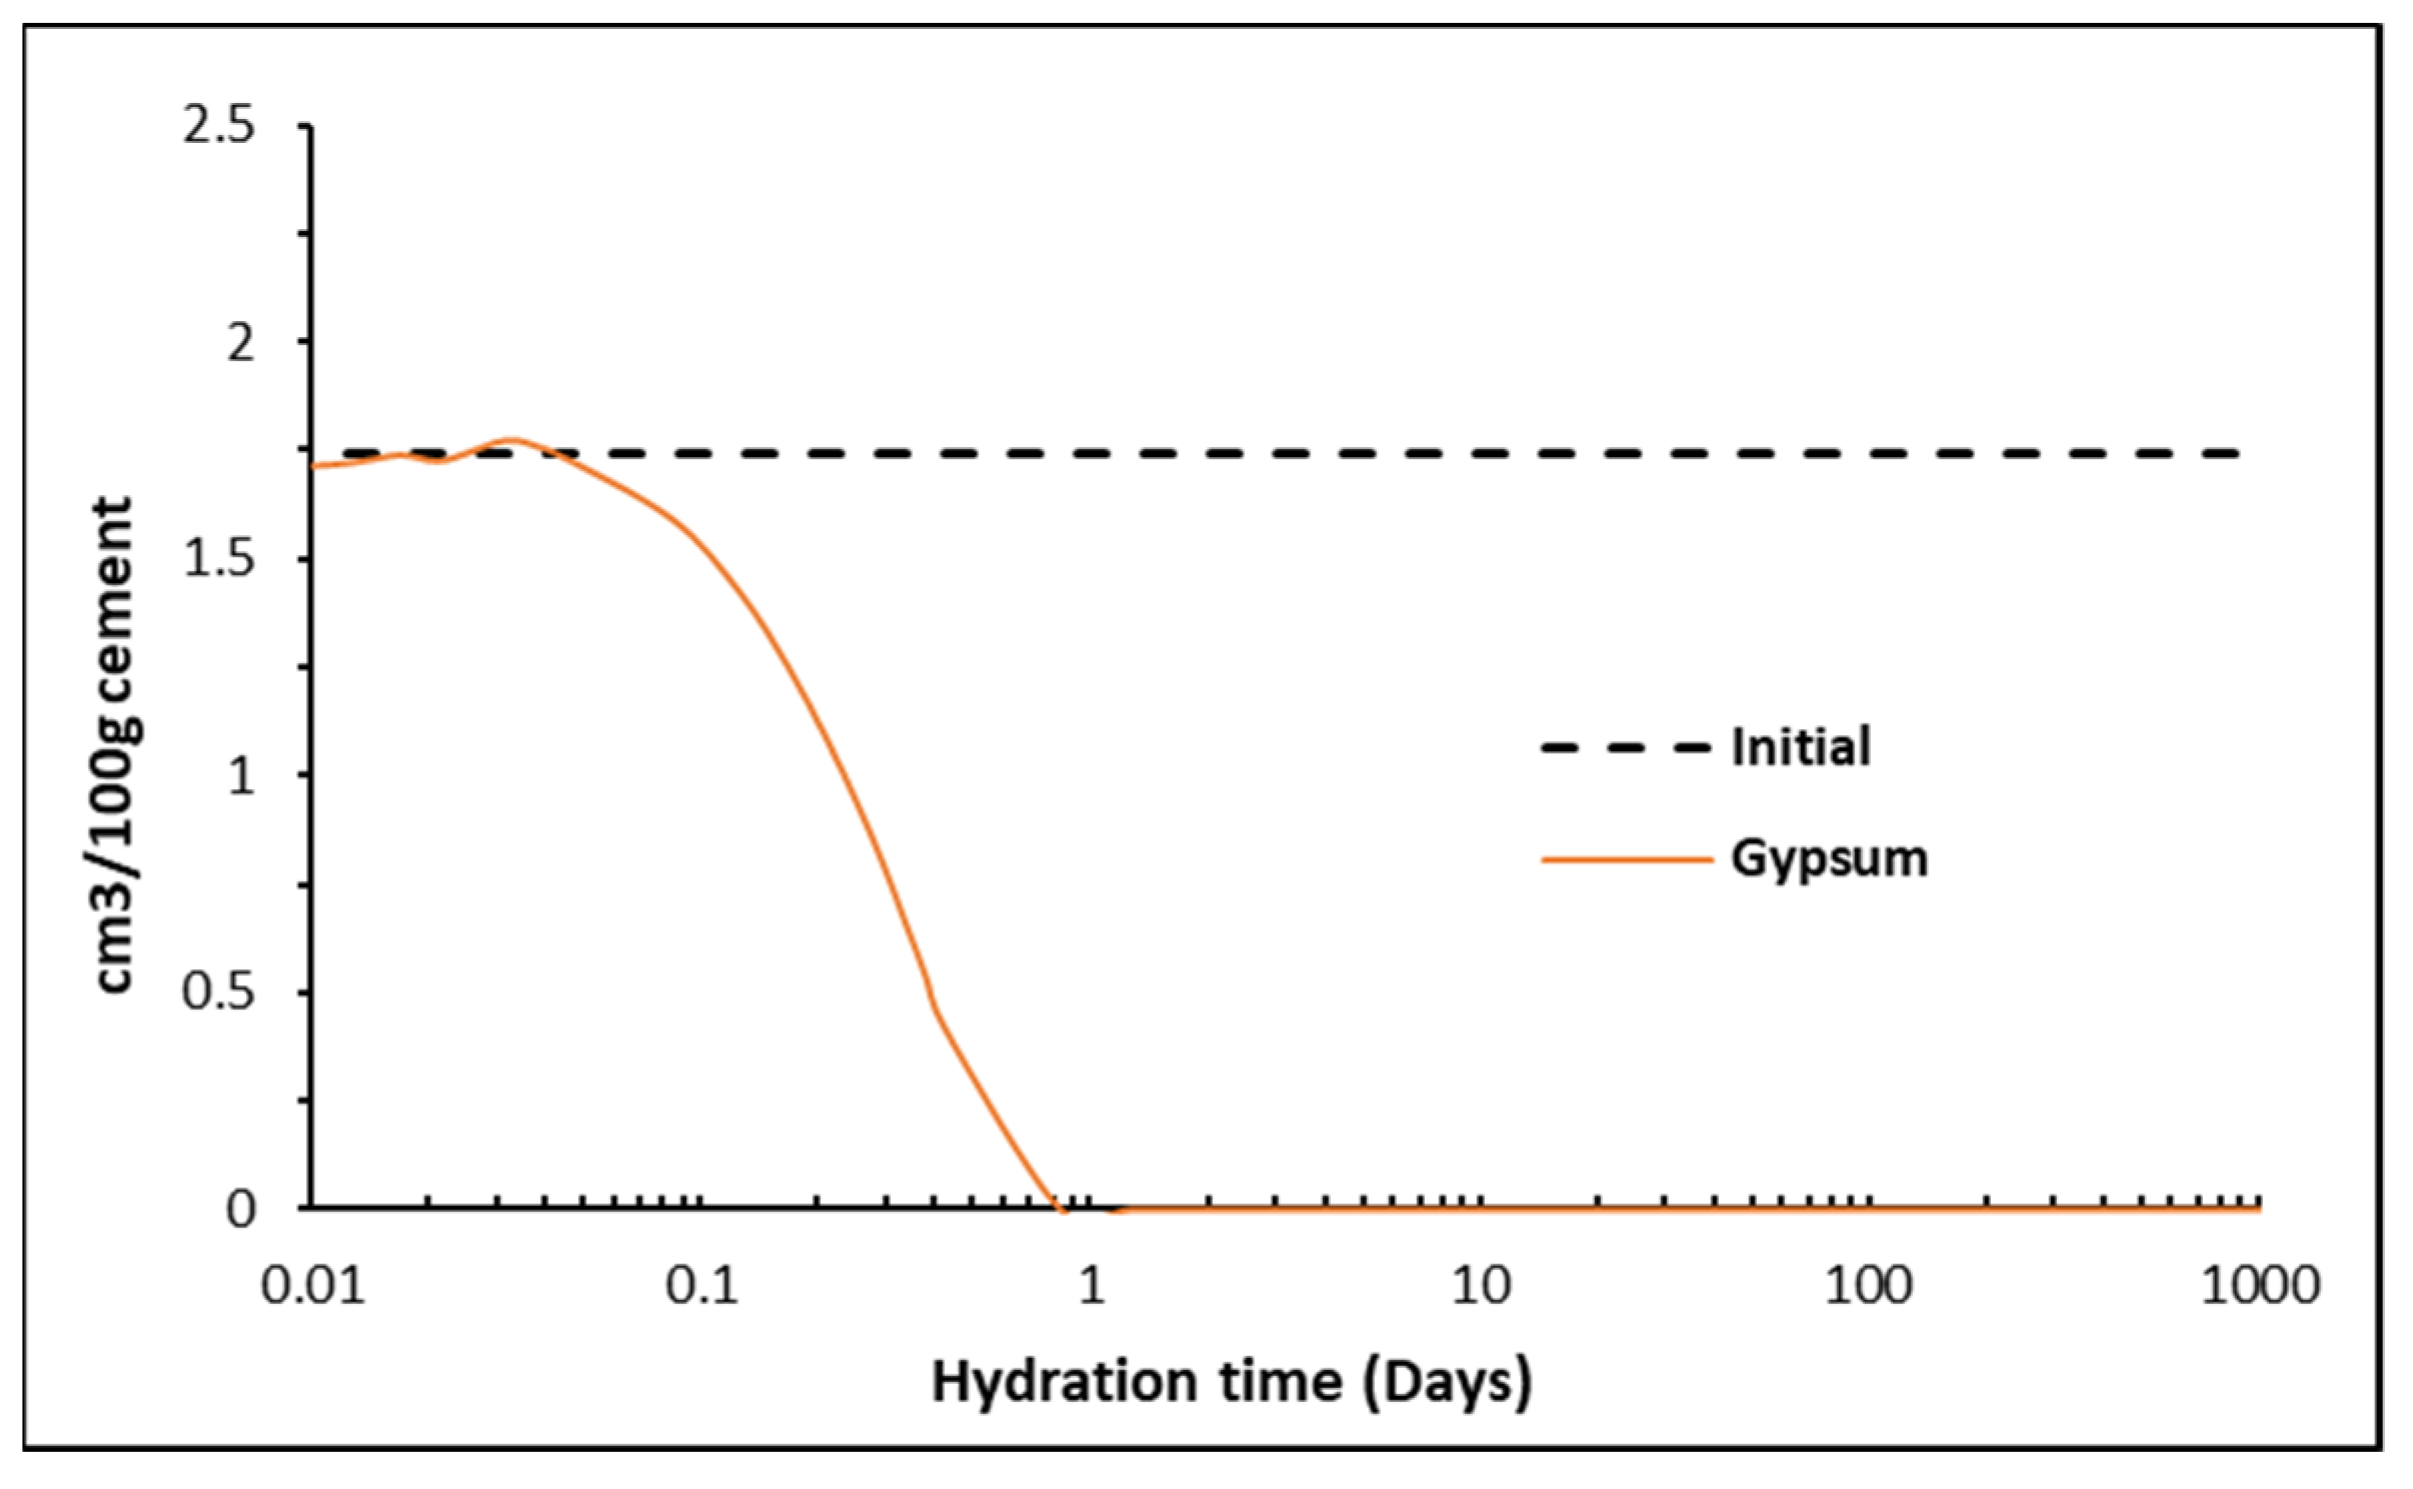
3.2. Thermogravimetric Analysis

The TGA traces of the unhydrated clinker are shown in Figure 3. Using the mass loss between 350–425 °C and 550–725 °C, the percentage of Portlandite and calcite can be determined pre-hydration using their molar mass as shown in Table 2. The TGA traces at 1, 7 and 28 days for the three w/c ratios are shown in Figure 4. As can be seen, Portlandite undergoes dehydroxylation over this temperature range with Ca(OH)2 converted to CaO. Table 2 shows that Portlandite increases over time, which has been observed in the XRD scans. Between 600−750 °C, the mass loss can be used to determine the calcite (CaCO3) content. As shown in Table 2, the CaCO3 content remains reasonably stable over time.

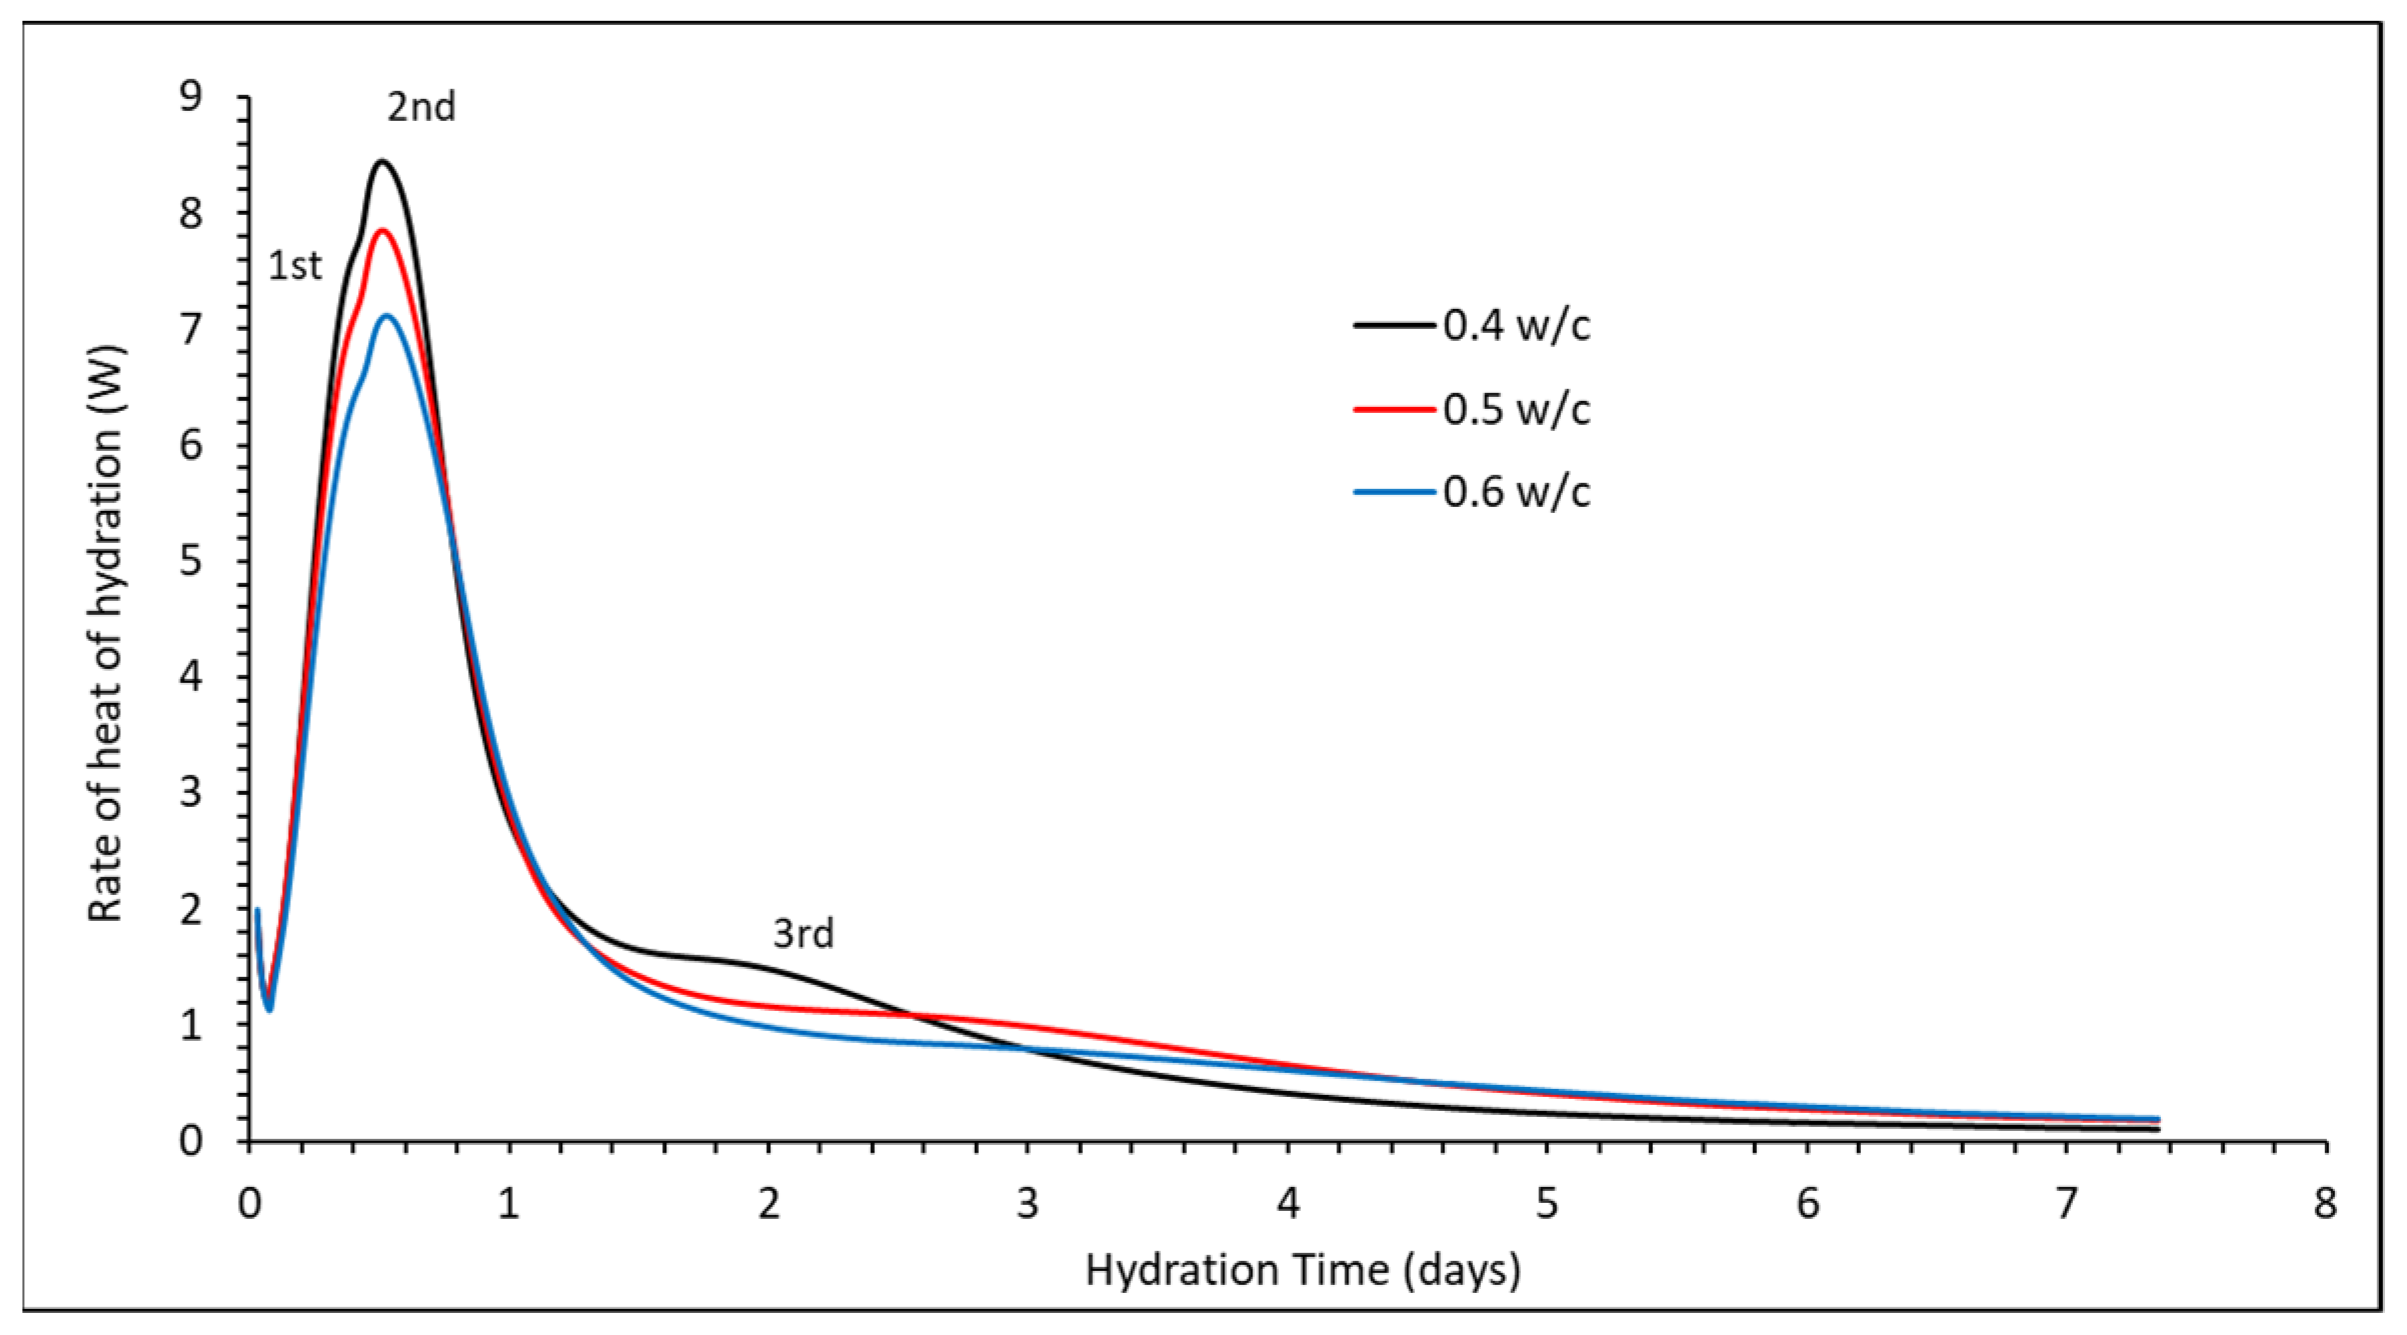
3.3. Heat of Hydration Analysis

The isothermal calorimetry heat of hydration results (Figure 5) from 45 min onwards show the start of the acceleration period at approximately 3 h. The measurements both show three separate peaks of heat evolution. The previous work [17,18] relates the second peak to sulphates previously bound to the C-S-H dissolving into solution and producing a further release of heat. The third peak at two days is thought to be due to the later precipitation of AFm phases.

4. Thermodynamic Modelling of Cement Hydration

The thermodynamic modelling was undertaken using the PHREEQC geochemistry software [7] which, using appropriate input for the normative cement content, calculating the clinker dissolution rate while accounting for accessory phases, oversaturation and alkalis binding to the C-S-H, determines the equilibrium phase assemblages over time, as described in detail in [5,6,19,20]. Anhydrite (CaSO4) is referred to here as gypsum. The cemdata18 thermodynamic database [21] was used for the solubility products of solids relevant for the cement system, including AFm and AFt phases like monosulfate, monocarbonate and hemicarbonate and ettringite, respectively, and hydrotalcite, hydrogarnet and C–S–H phases.

4.1. C-S-H Gel

Holmes et al. [20] showed how C-S-H gel solubility can be modelled as a series of discrete solid phases (DSPs) derived from the CSH3T and CSHQ end-members in the cemdata18 database. It was shown that for OPC hydration, solid solution models are not required, which only requires portlandite and a suitable C-S-H gel phase of fixed Ca:Si and H (water):Si molar ratio of between 1.6–1.8 and 2.0–2.1, respectively. Therefore, to model the C-S-H here, the CSH165 phase is used [22] that has Ca:Si and H:Si ratios of 1.65 and 2.1167, respectively.

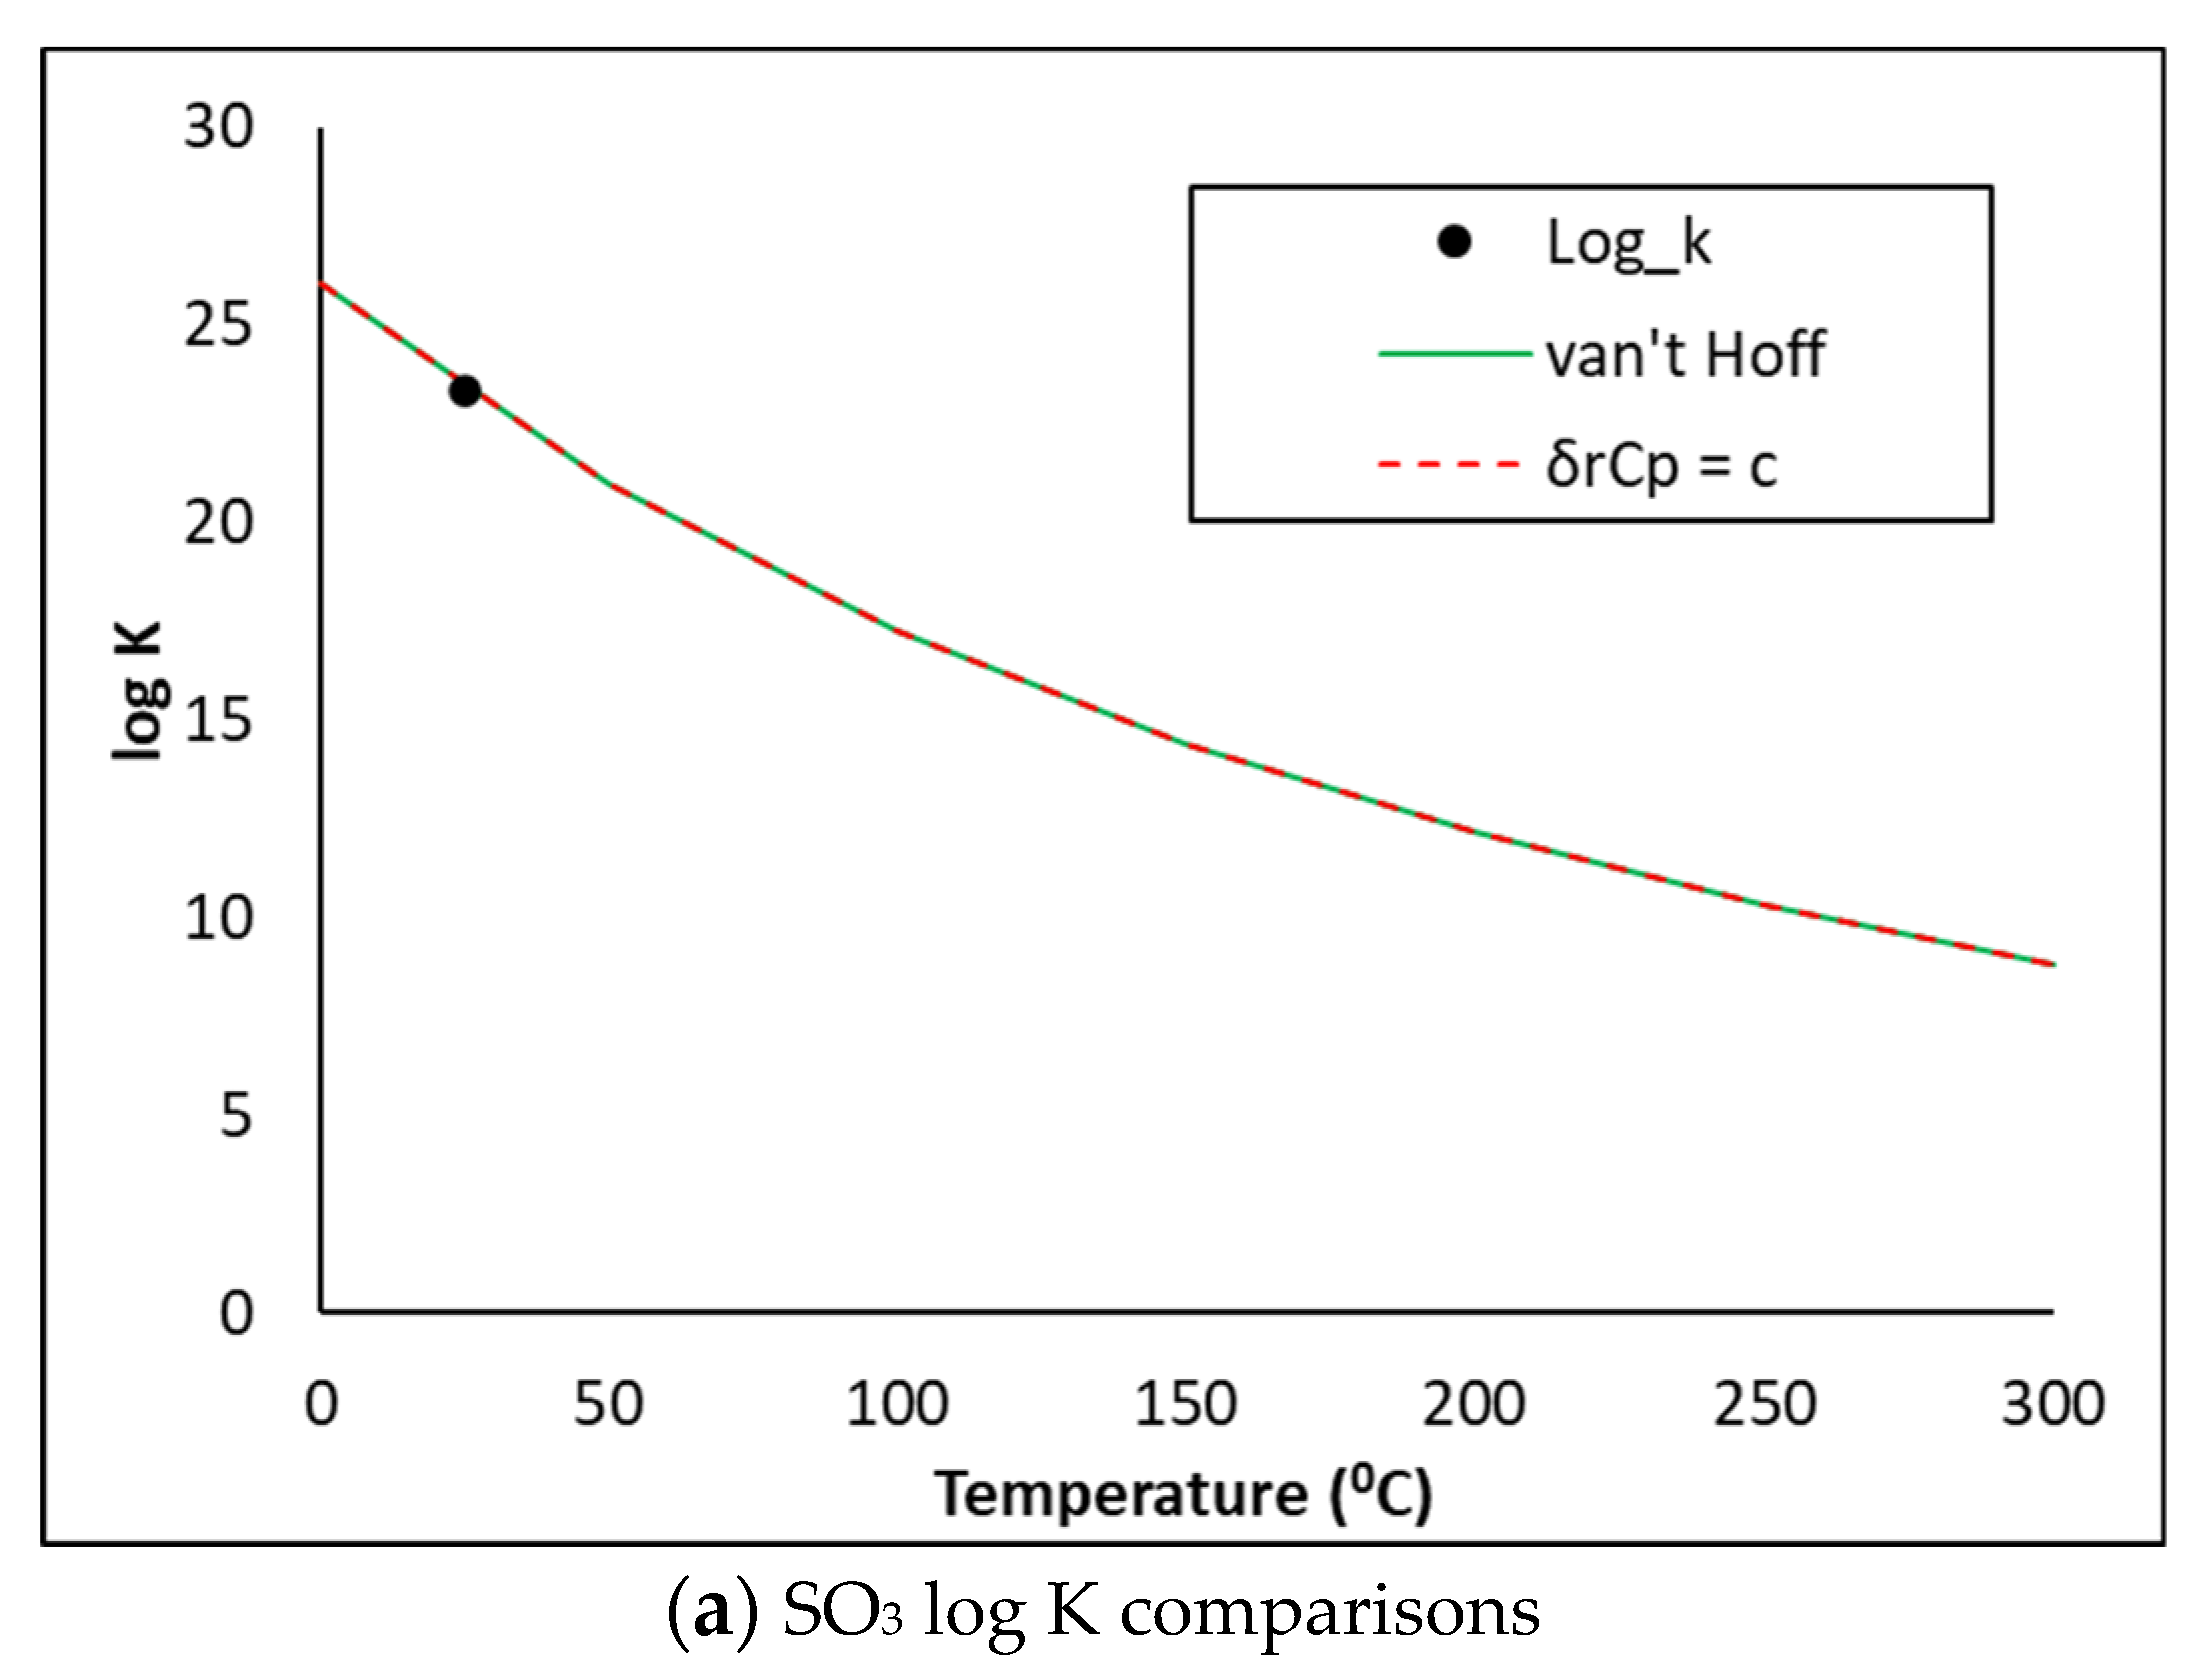
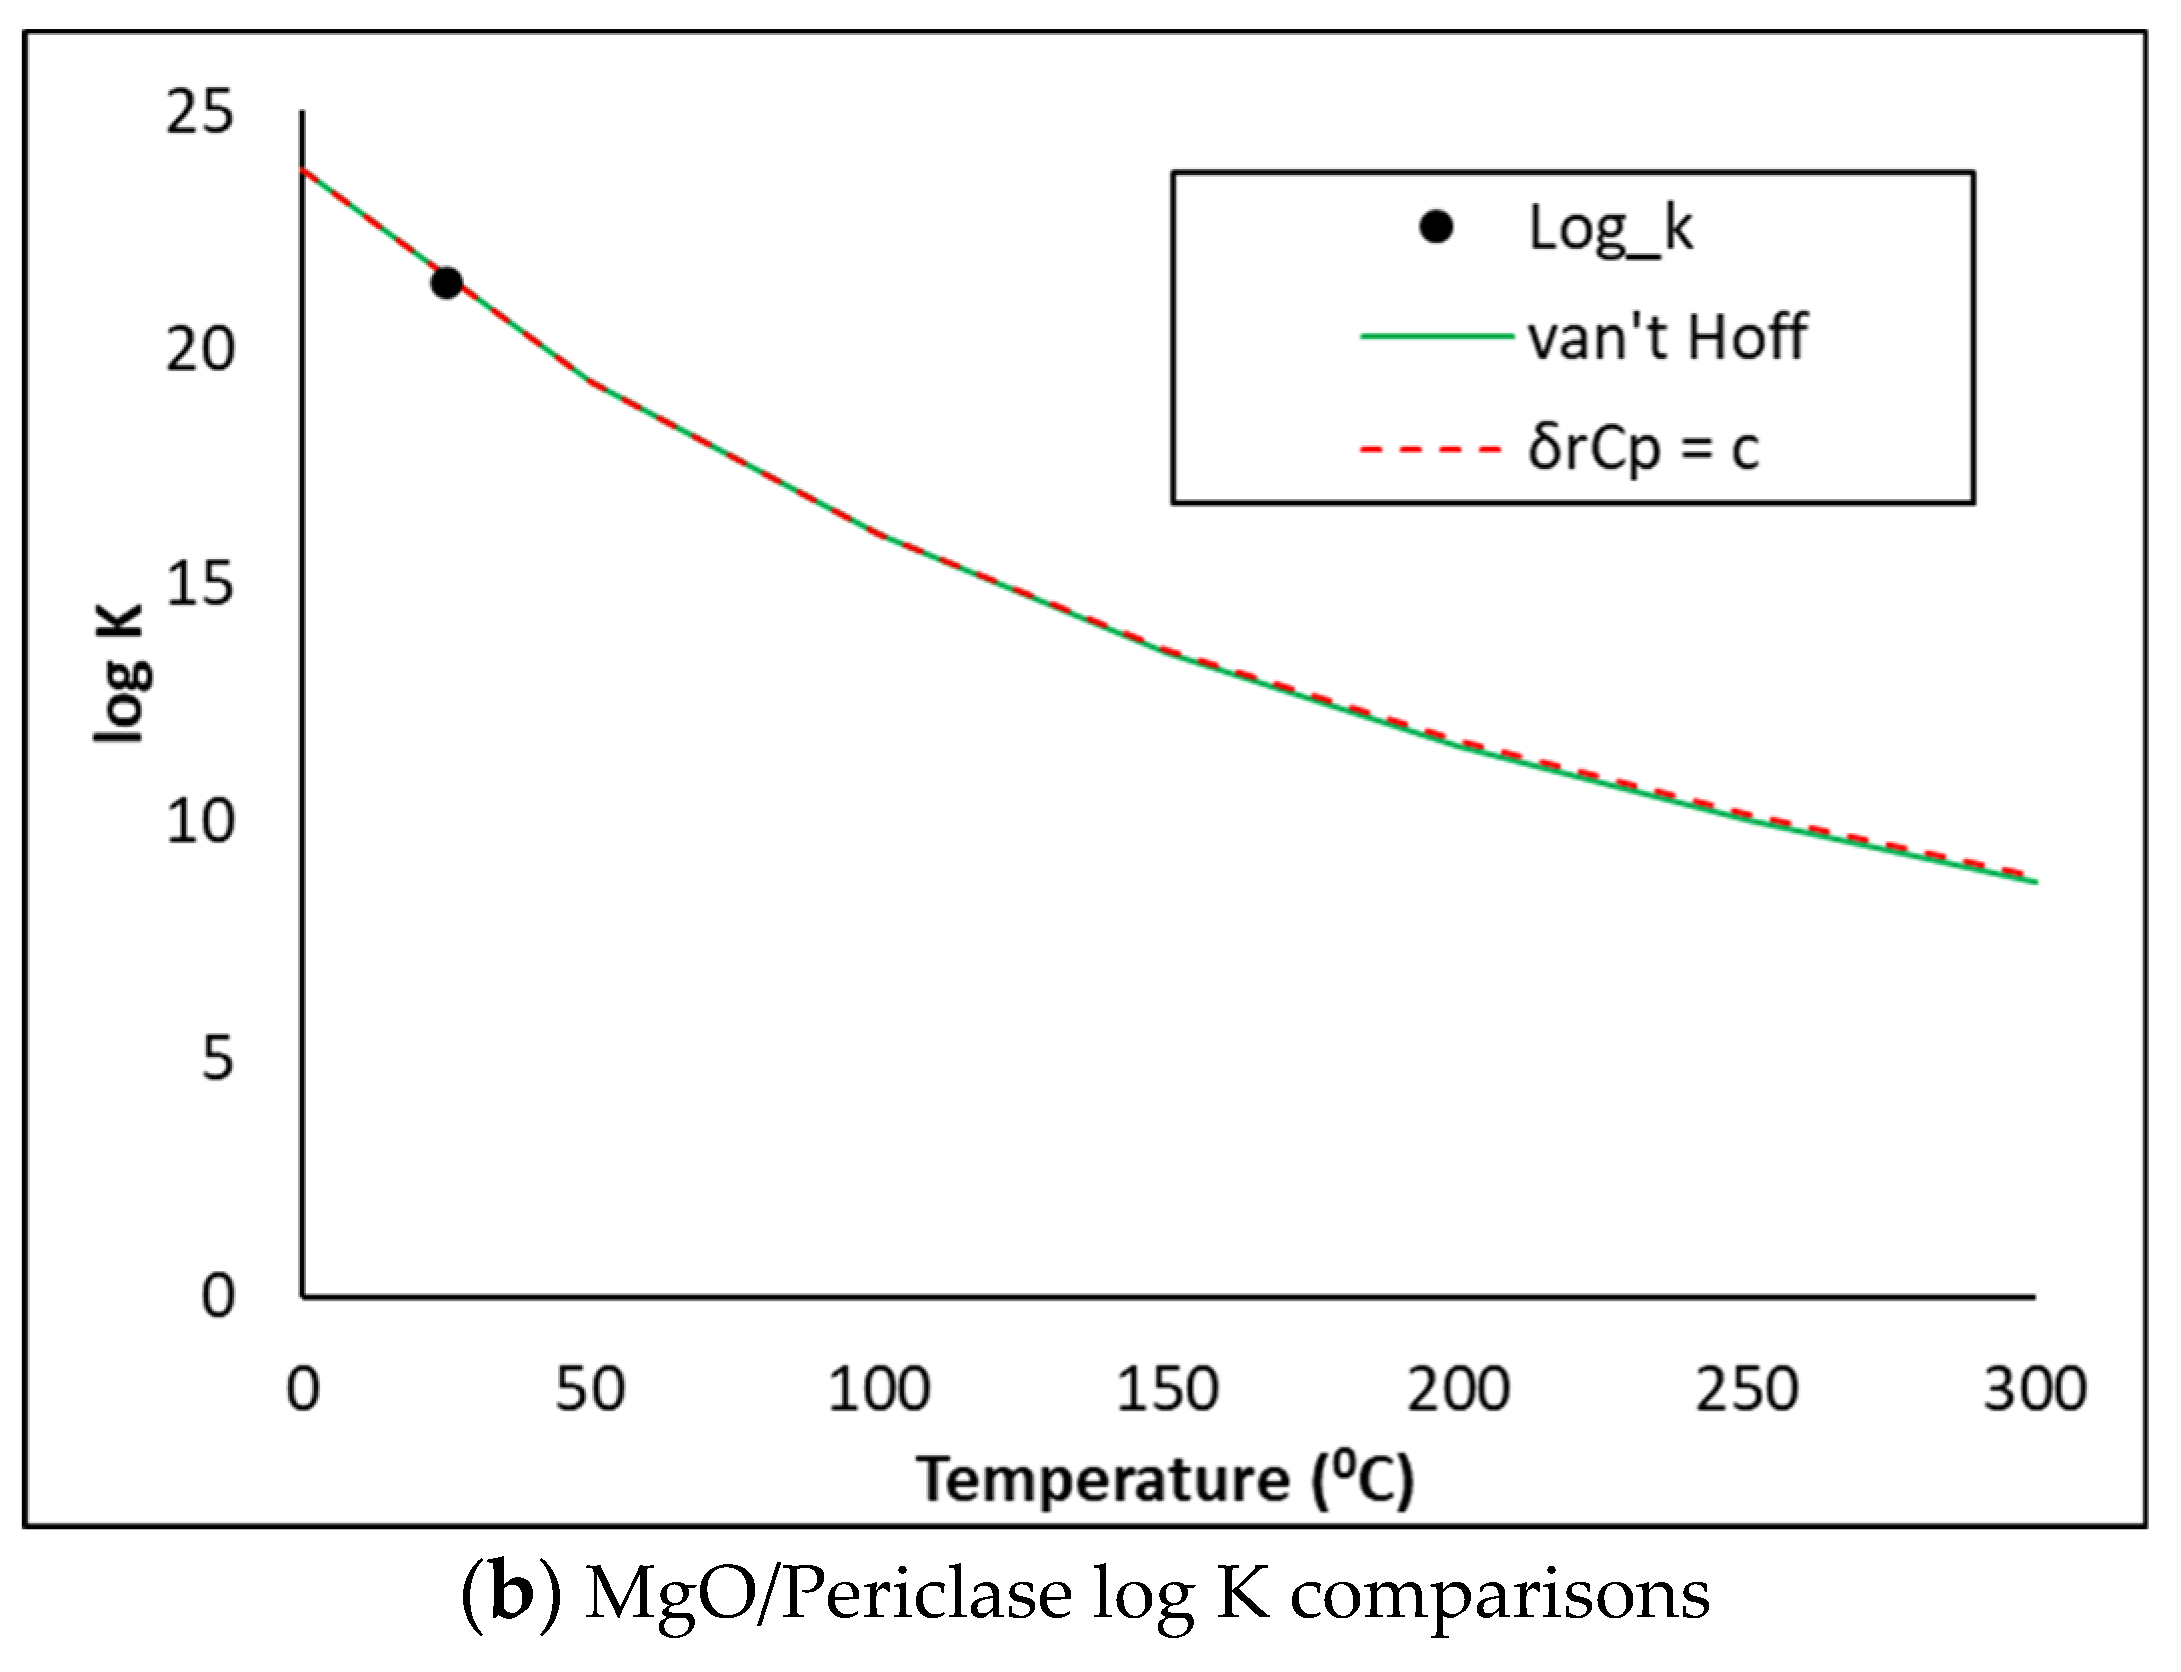
4.2. Thermodynamic Descriptions of SO3, MgO and Periclase

The cemdata18 database does not hold thermodynamic descriptions of the SO3, MgO or Periclase phases. Using the thermodynamic information in Table 3, the phase descriptions below were derived and copied into the PHASES data block in PHREEQC. The log K predictions were compared against the NEA methods [23] which assume the heat capacity of reaction is (i) equal to zero (van Hoff method) or (ii) constant (δrCp = c). As may be seen in Figure 6, the three methods show excellent comparisons. The PHREEQC input file also accounts for the kinetic dissolution of the clinker phases as a function of time, oversaturation of the precipitating hydrates from 0–12 hrs and the release and uptake of alkalis by the C-S-H gel, as described in previous publications [5,6,19,20].

5. Analysis Output

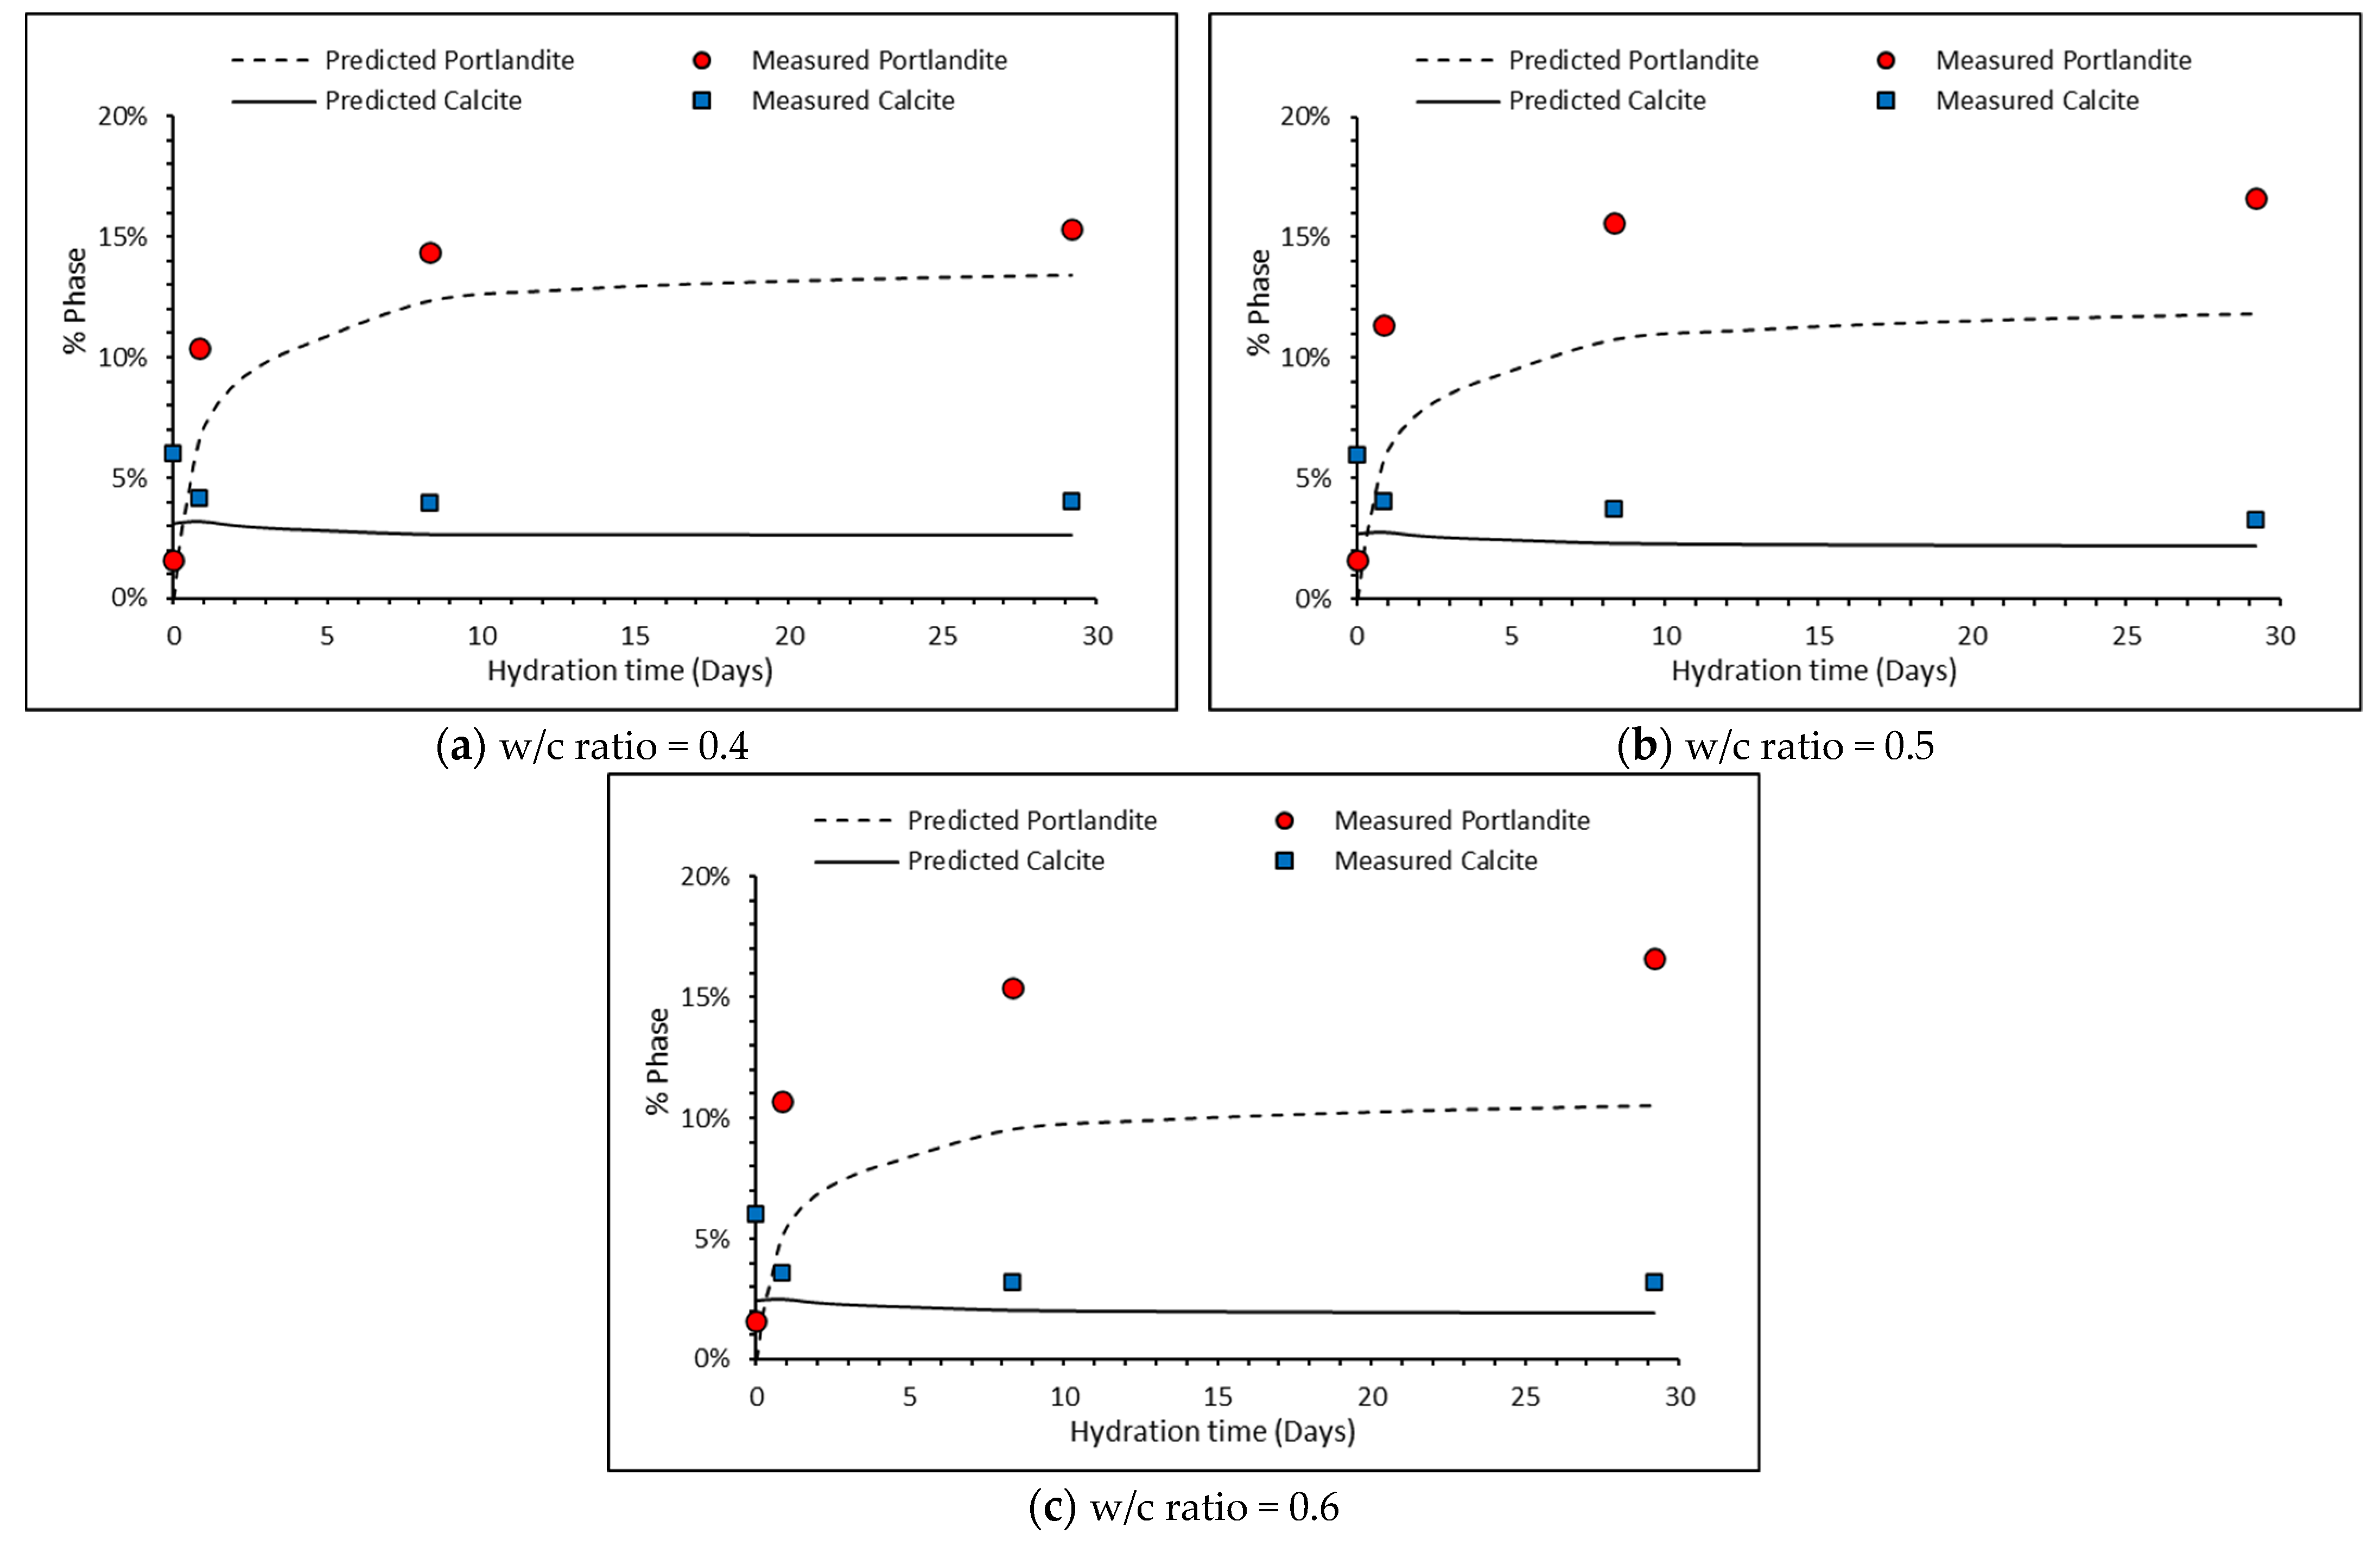
5.1. Comparison between Measured and Predicted Portlandite and Calcite Contents

As shown in Table 2, the percentages of portlandite and calcite were measured using TGA to be 1.44 and 4.75%, respectively, in the unhydrated clinker, although some pre-hydration is thought to have occurred. Figure 7a–c and Table 4 compare the measured and predicted Portlandite and calcite contents over the initial 28 days for the three w/c ratios. There is reasonably good agreement between both for these minerals. Calcite is predicted to dissolve quicker than measured. This may lead to higher amounts of Ca-rich hydrates being formed than maybe would be seen experimentally.
However, the thermodynamic model only predicts the formation of monocarbonate. This can be attributed to the drawbacks in modelling carbonate-AFm as its formation is strongly dependent on kinetics, whereas thermodynamic modelling is usually only carried out with a thermodynamic stable state.

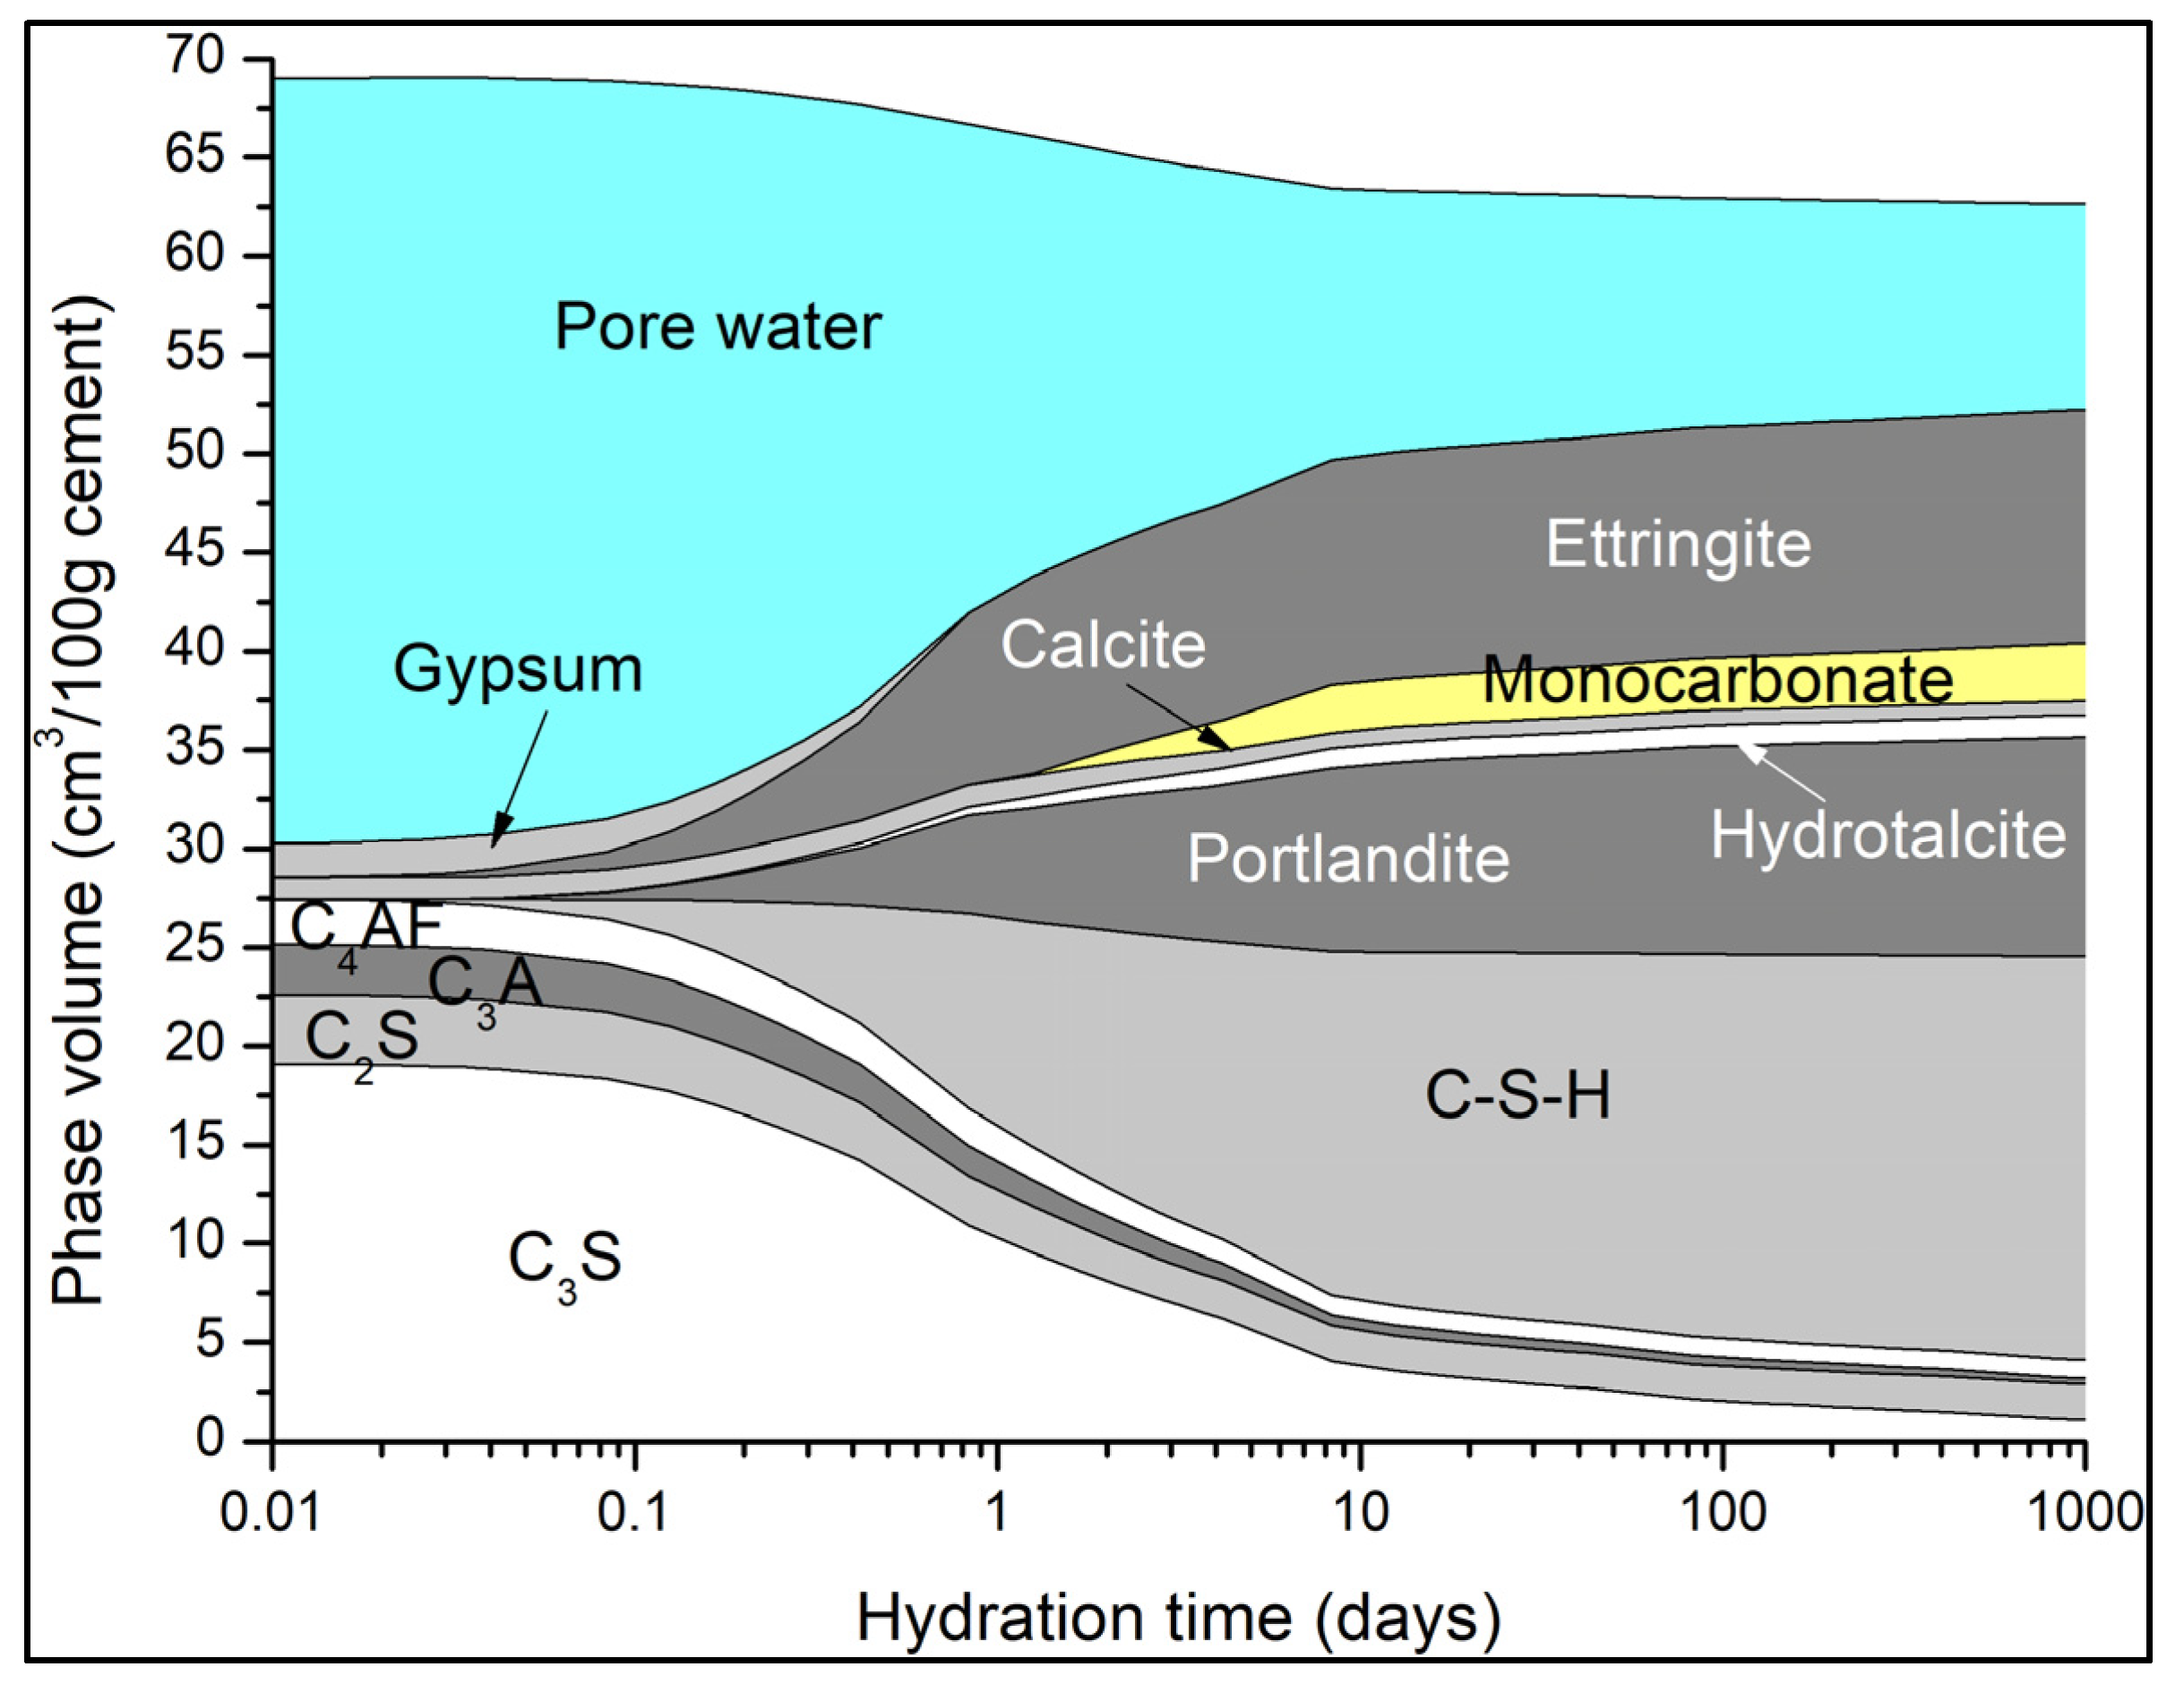
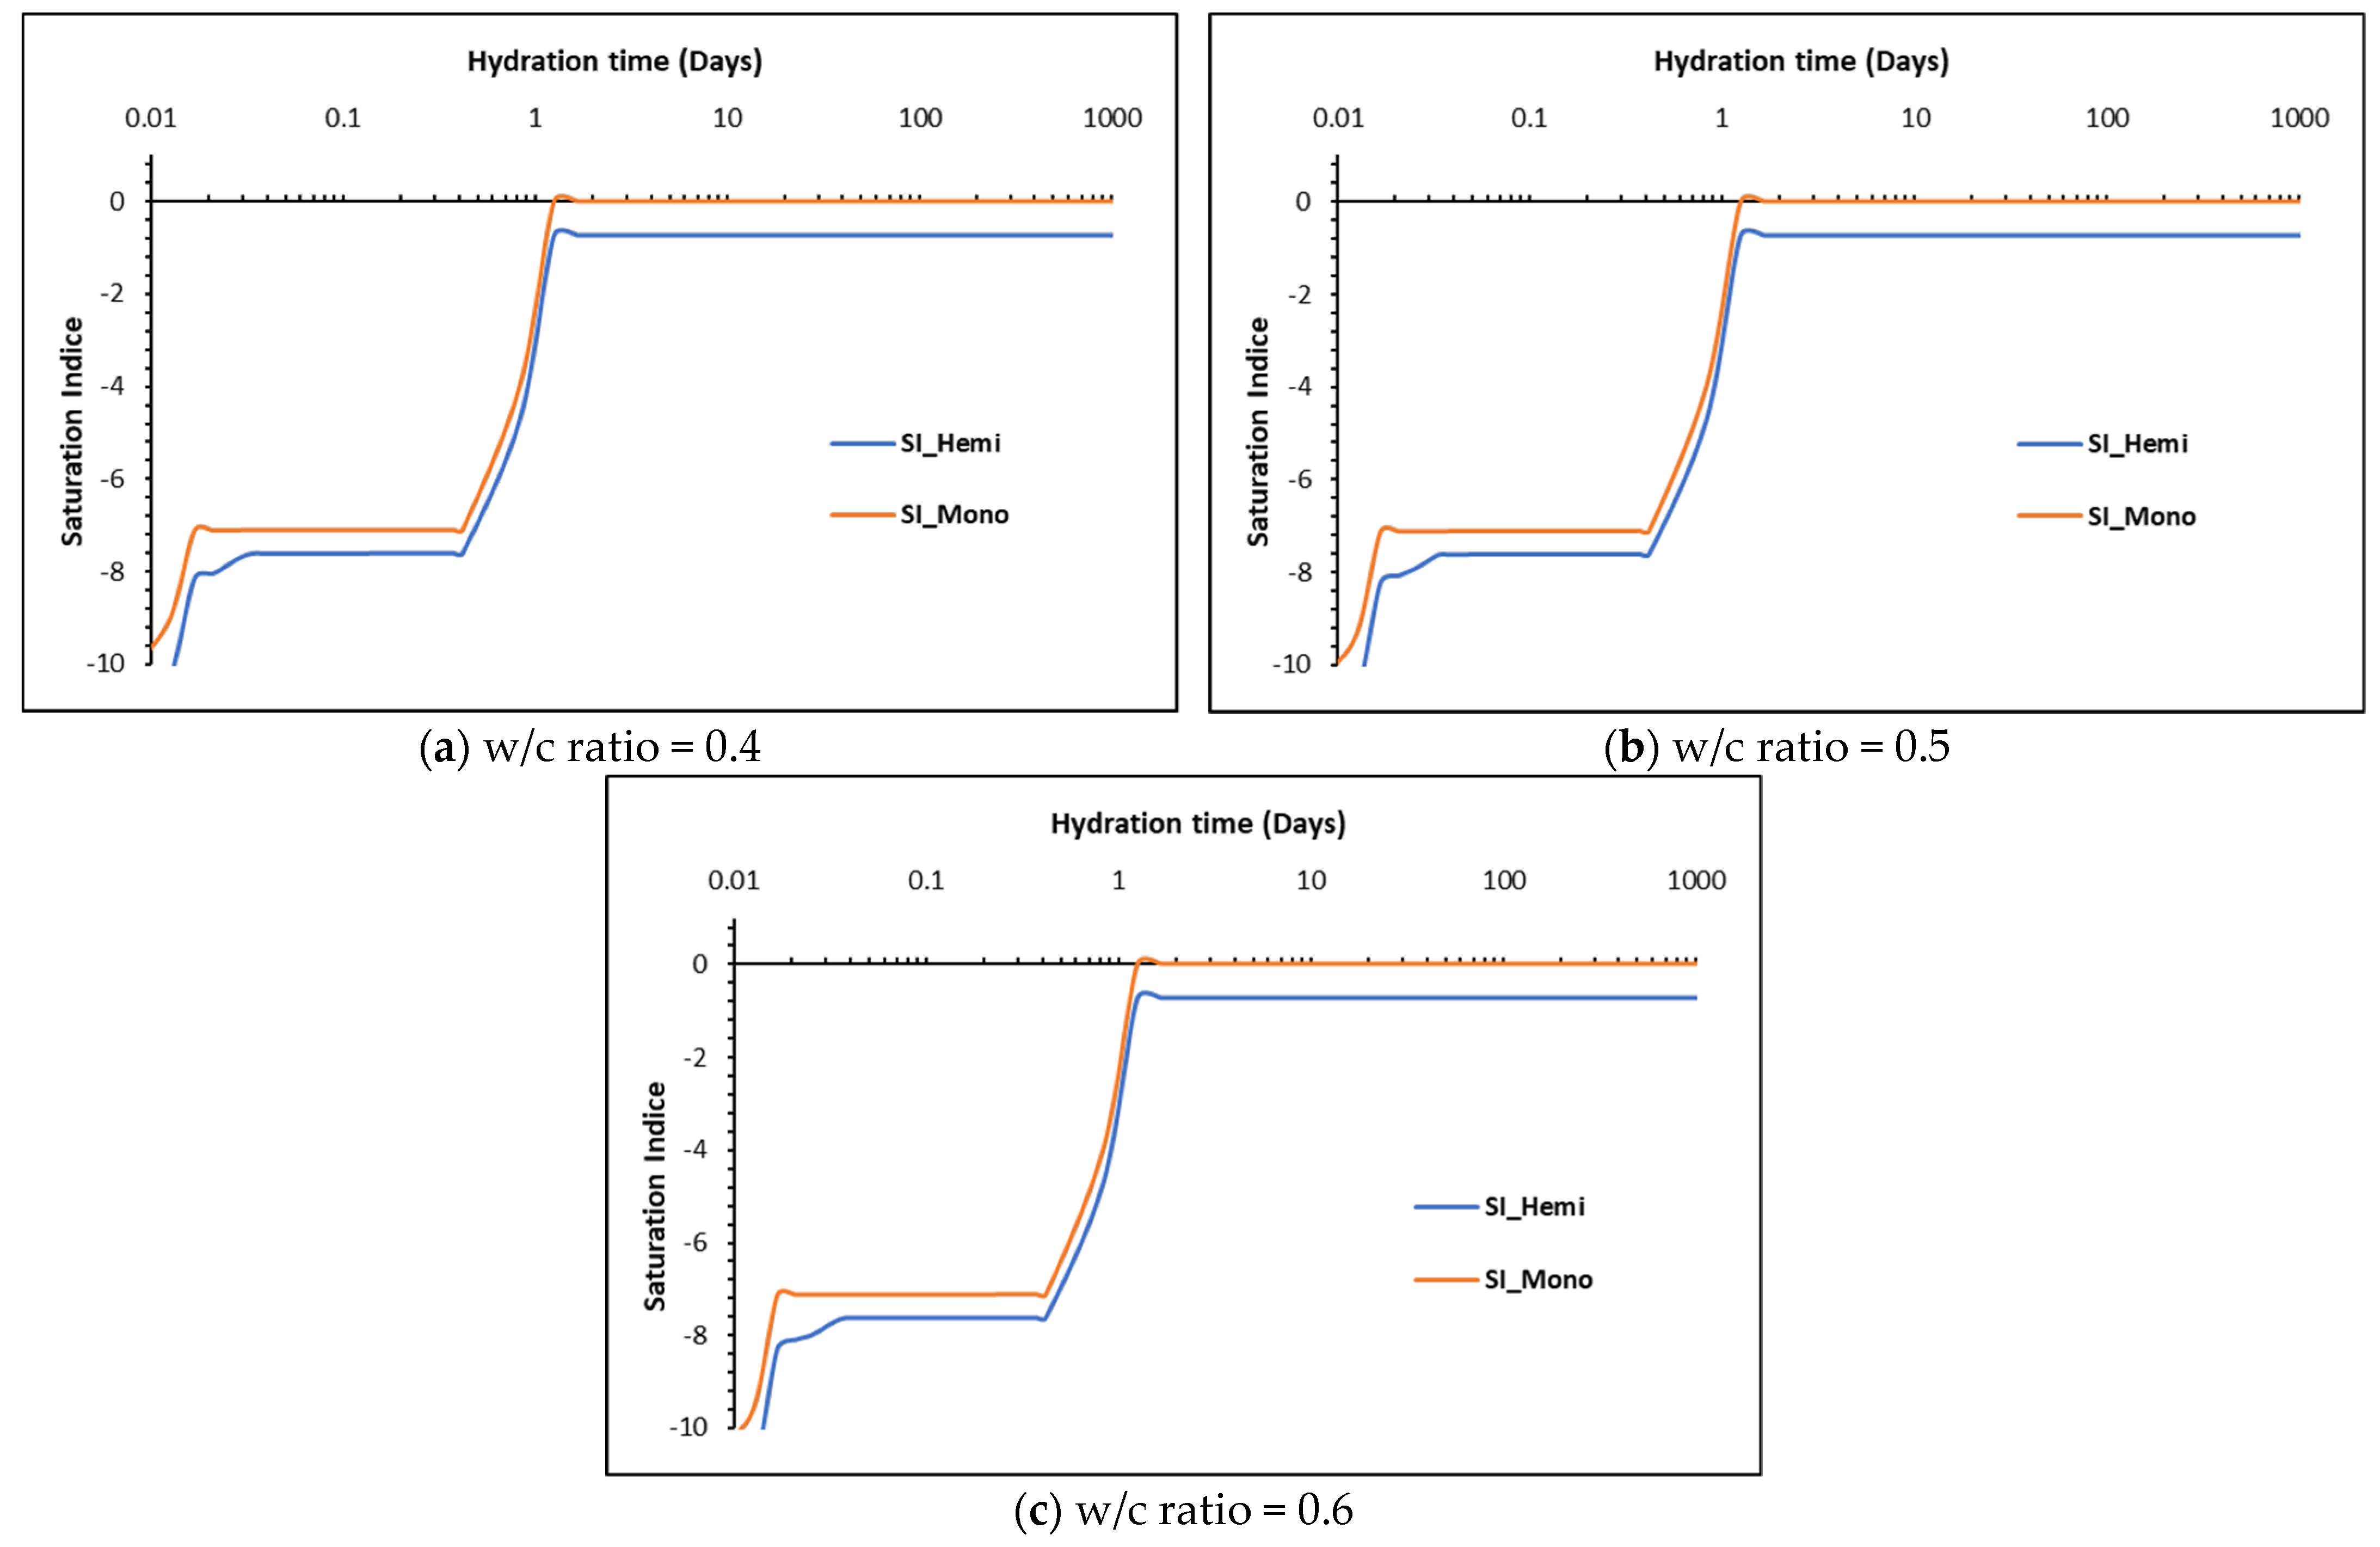
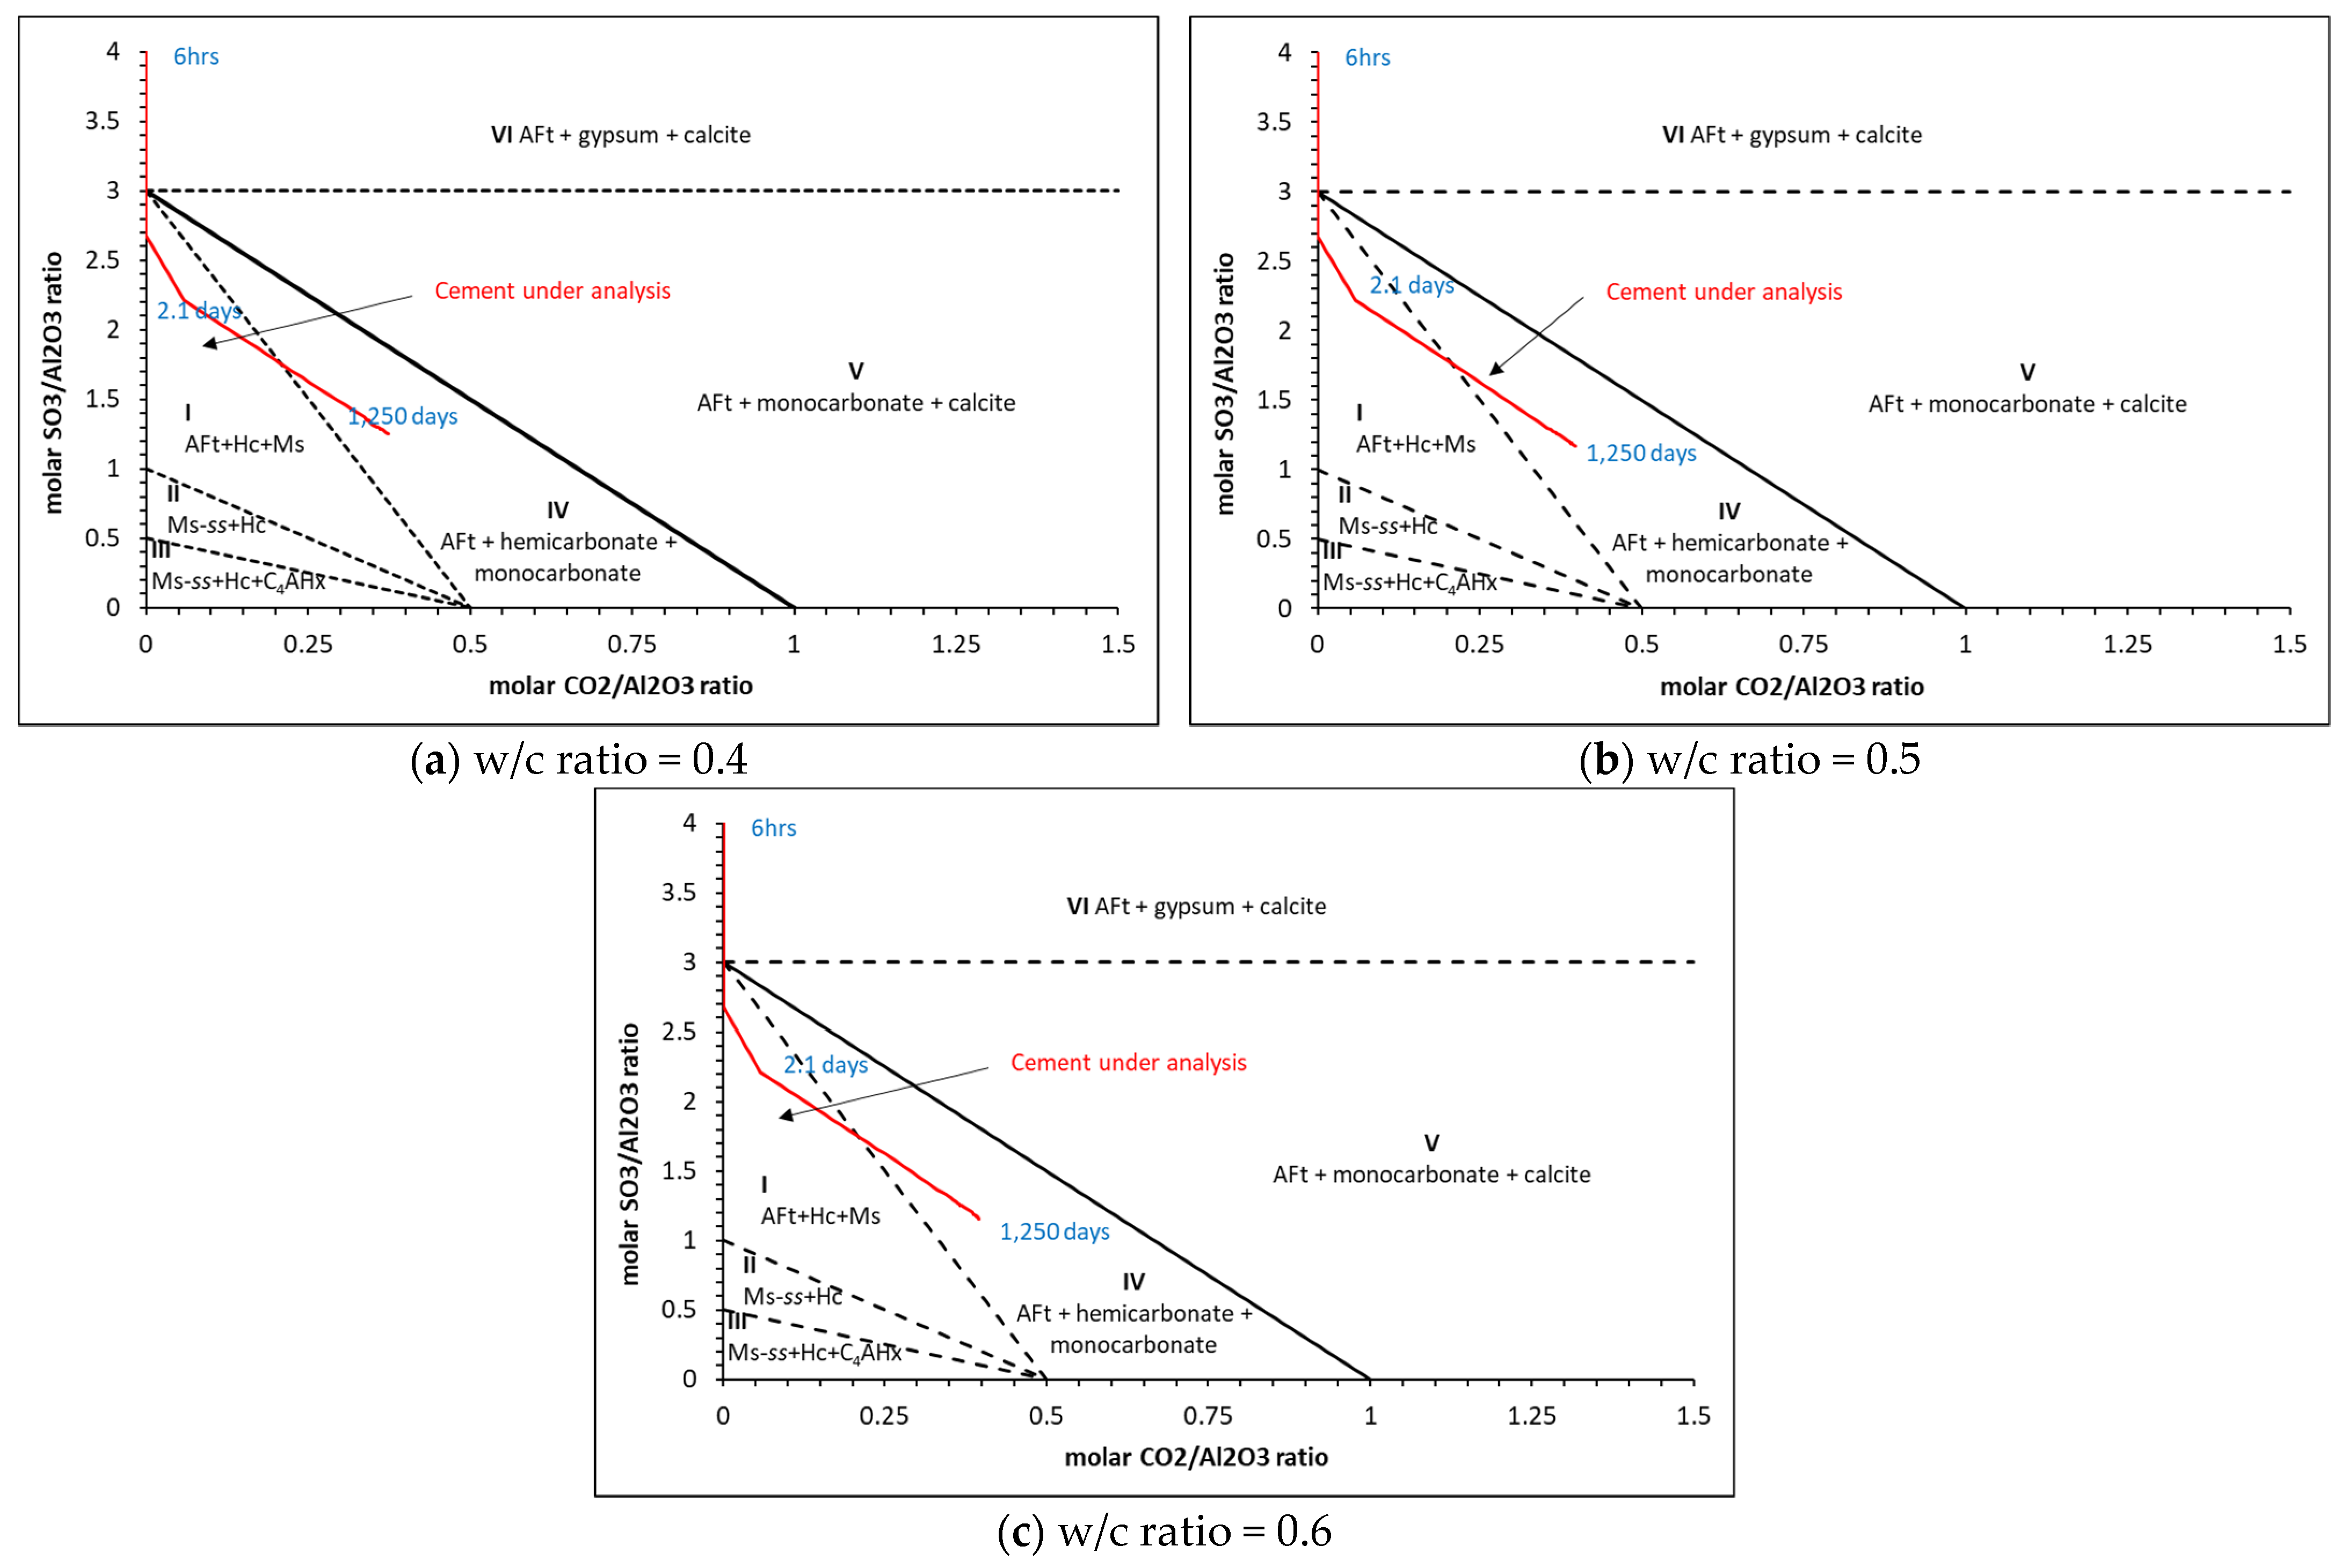
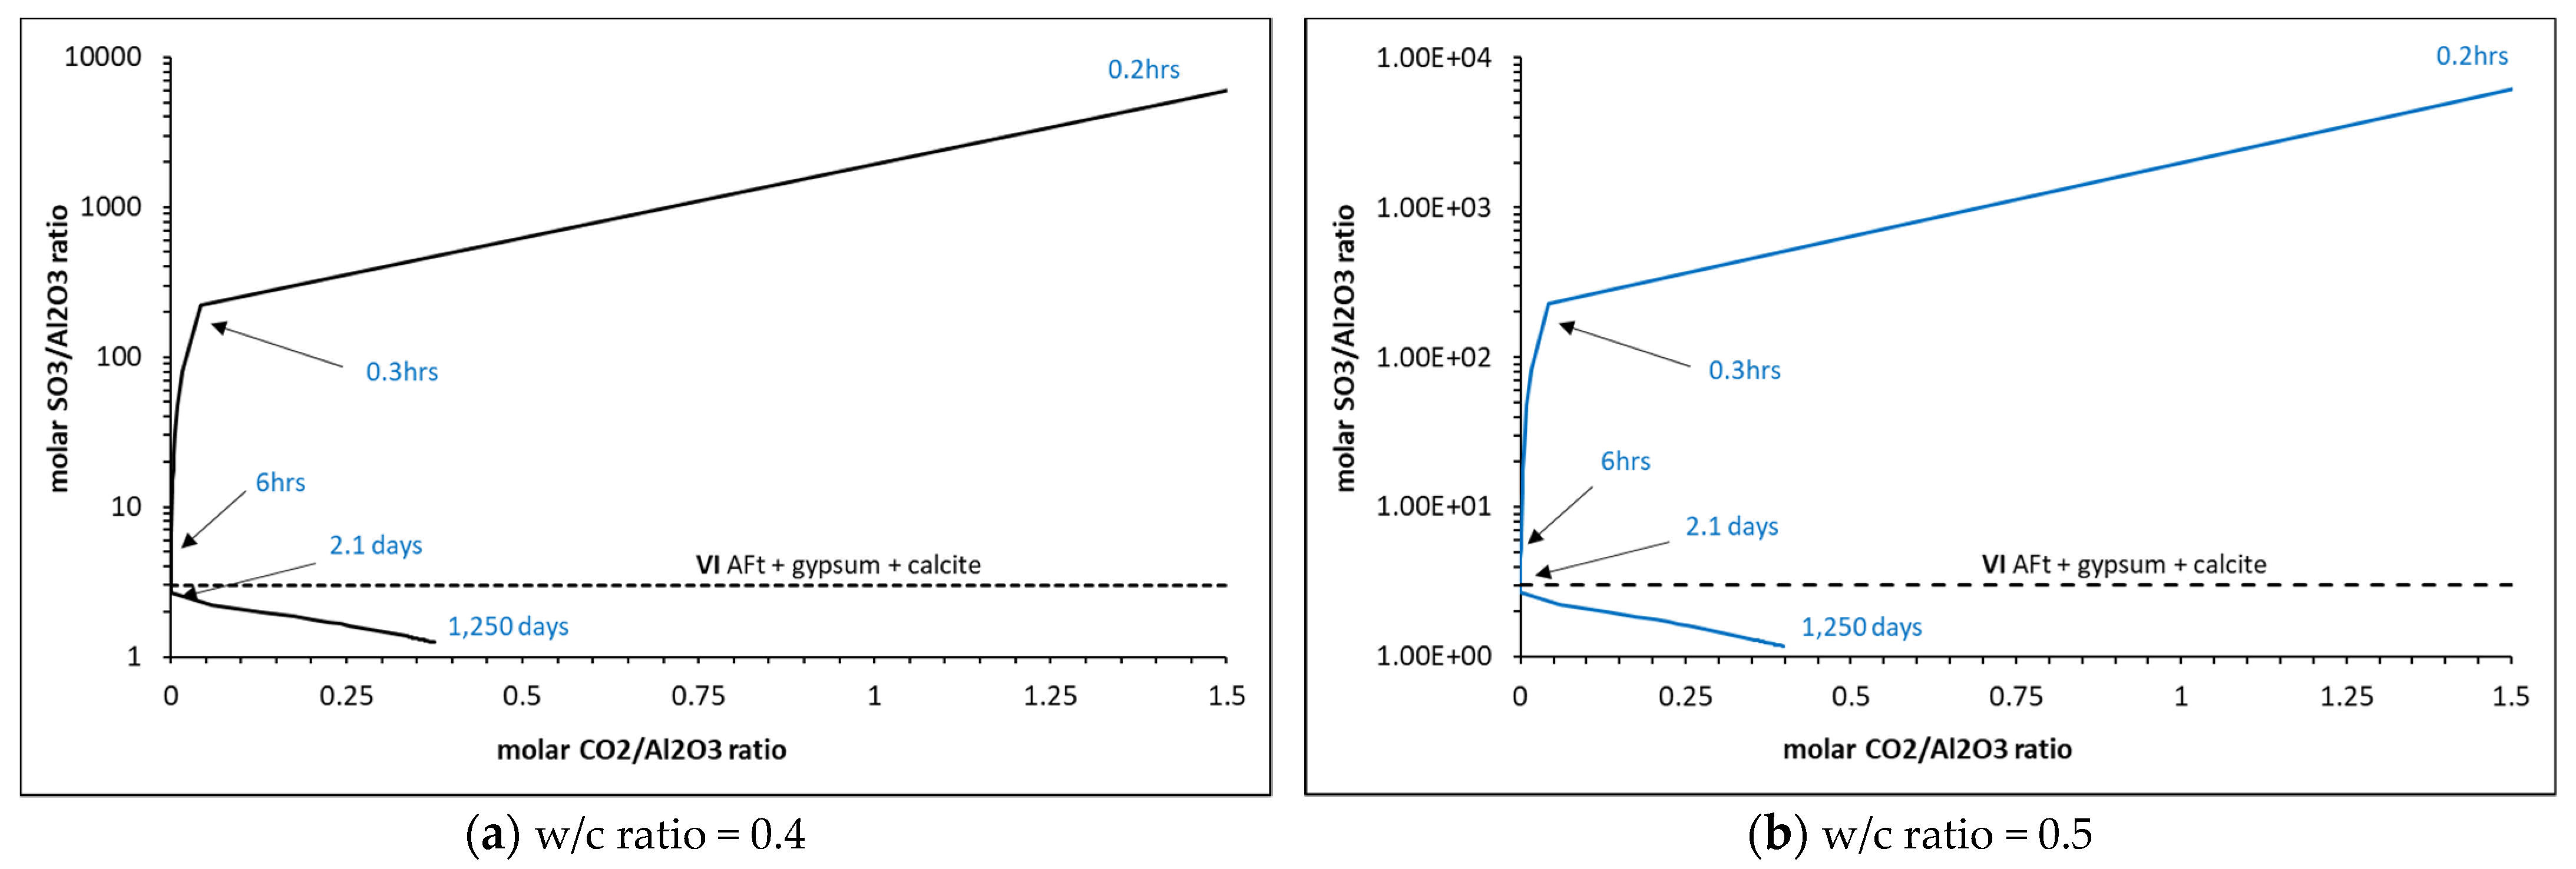
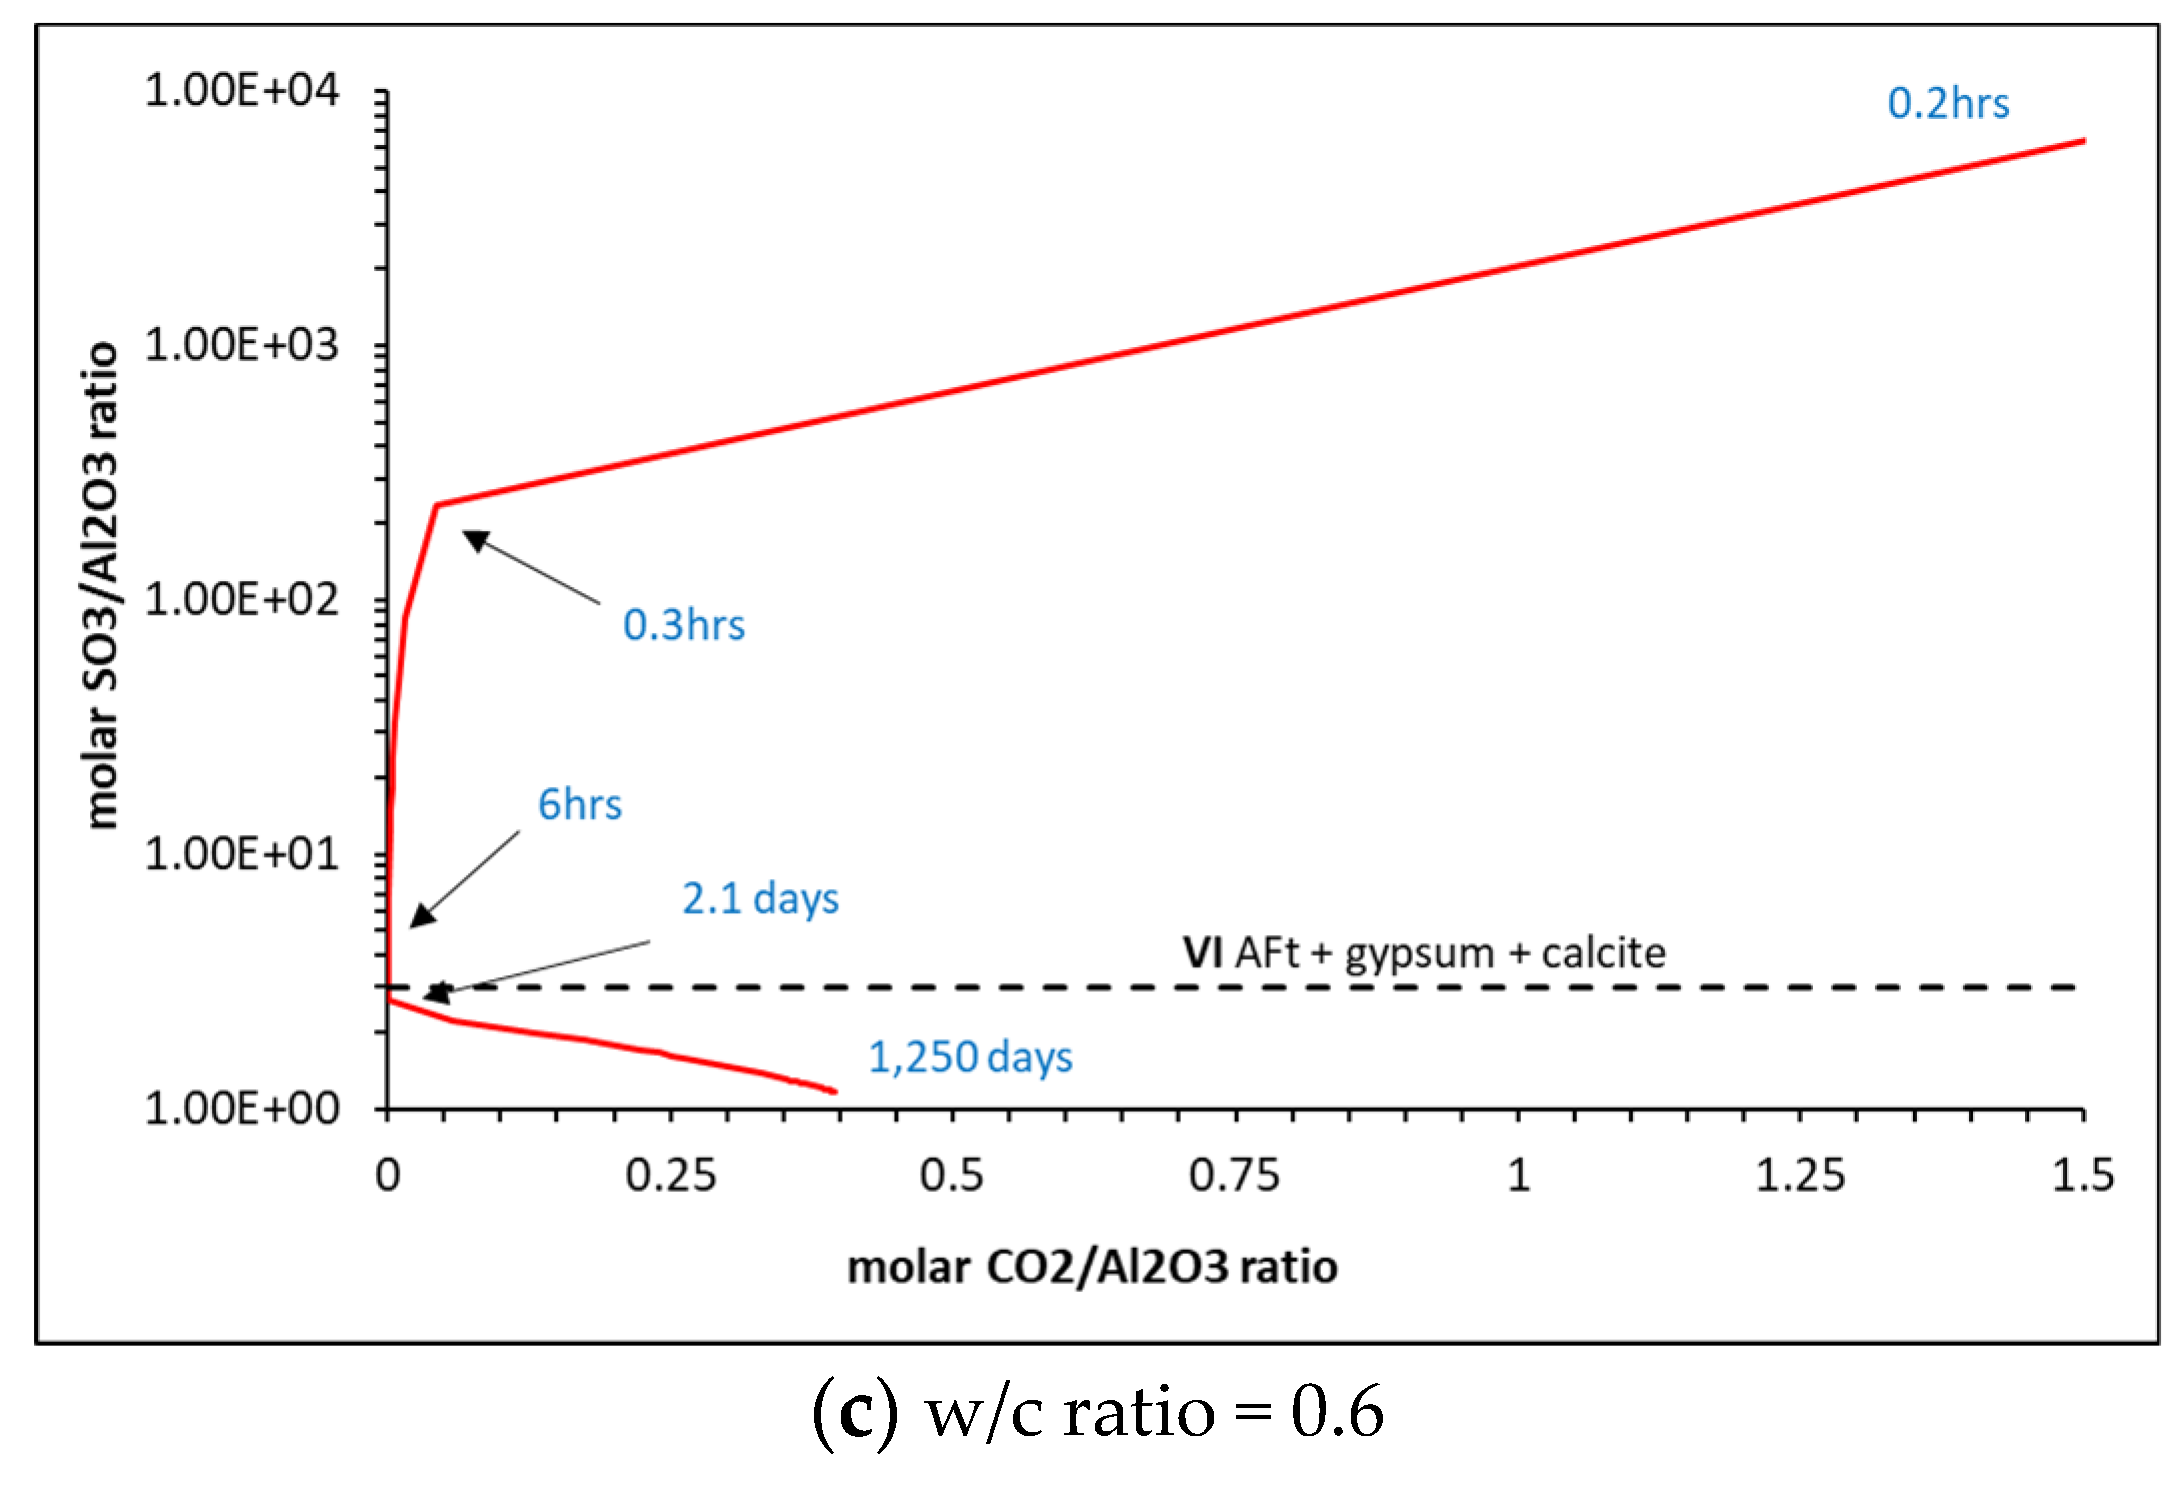
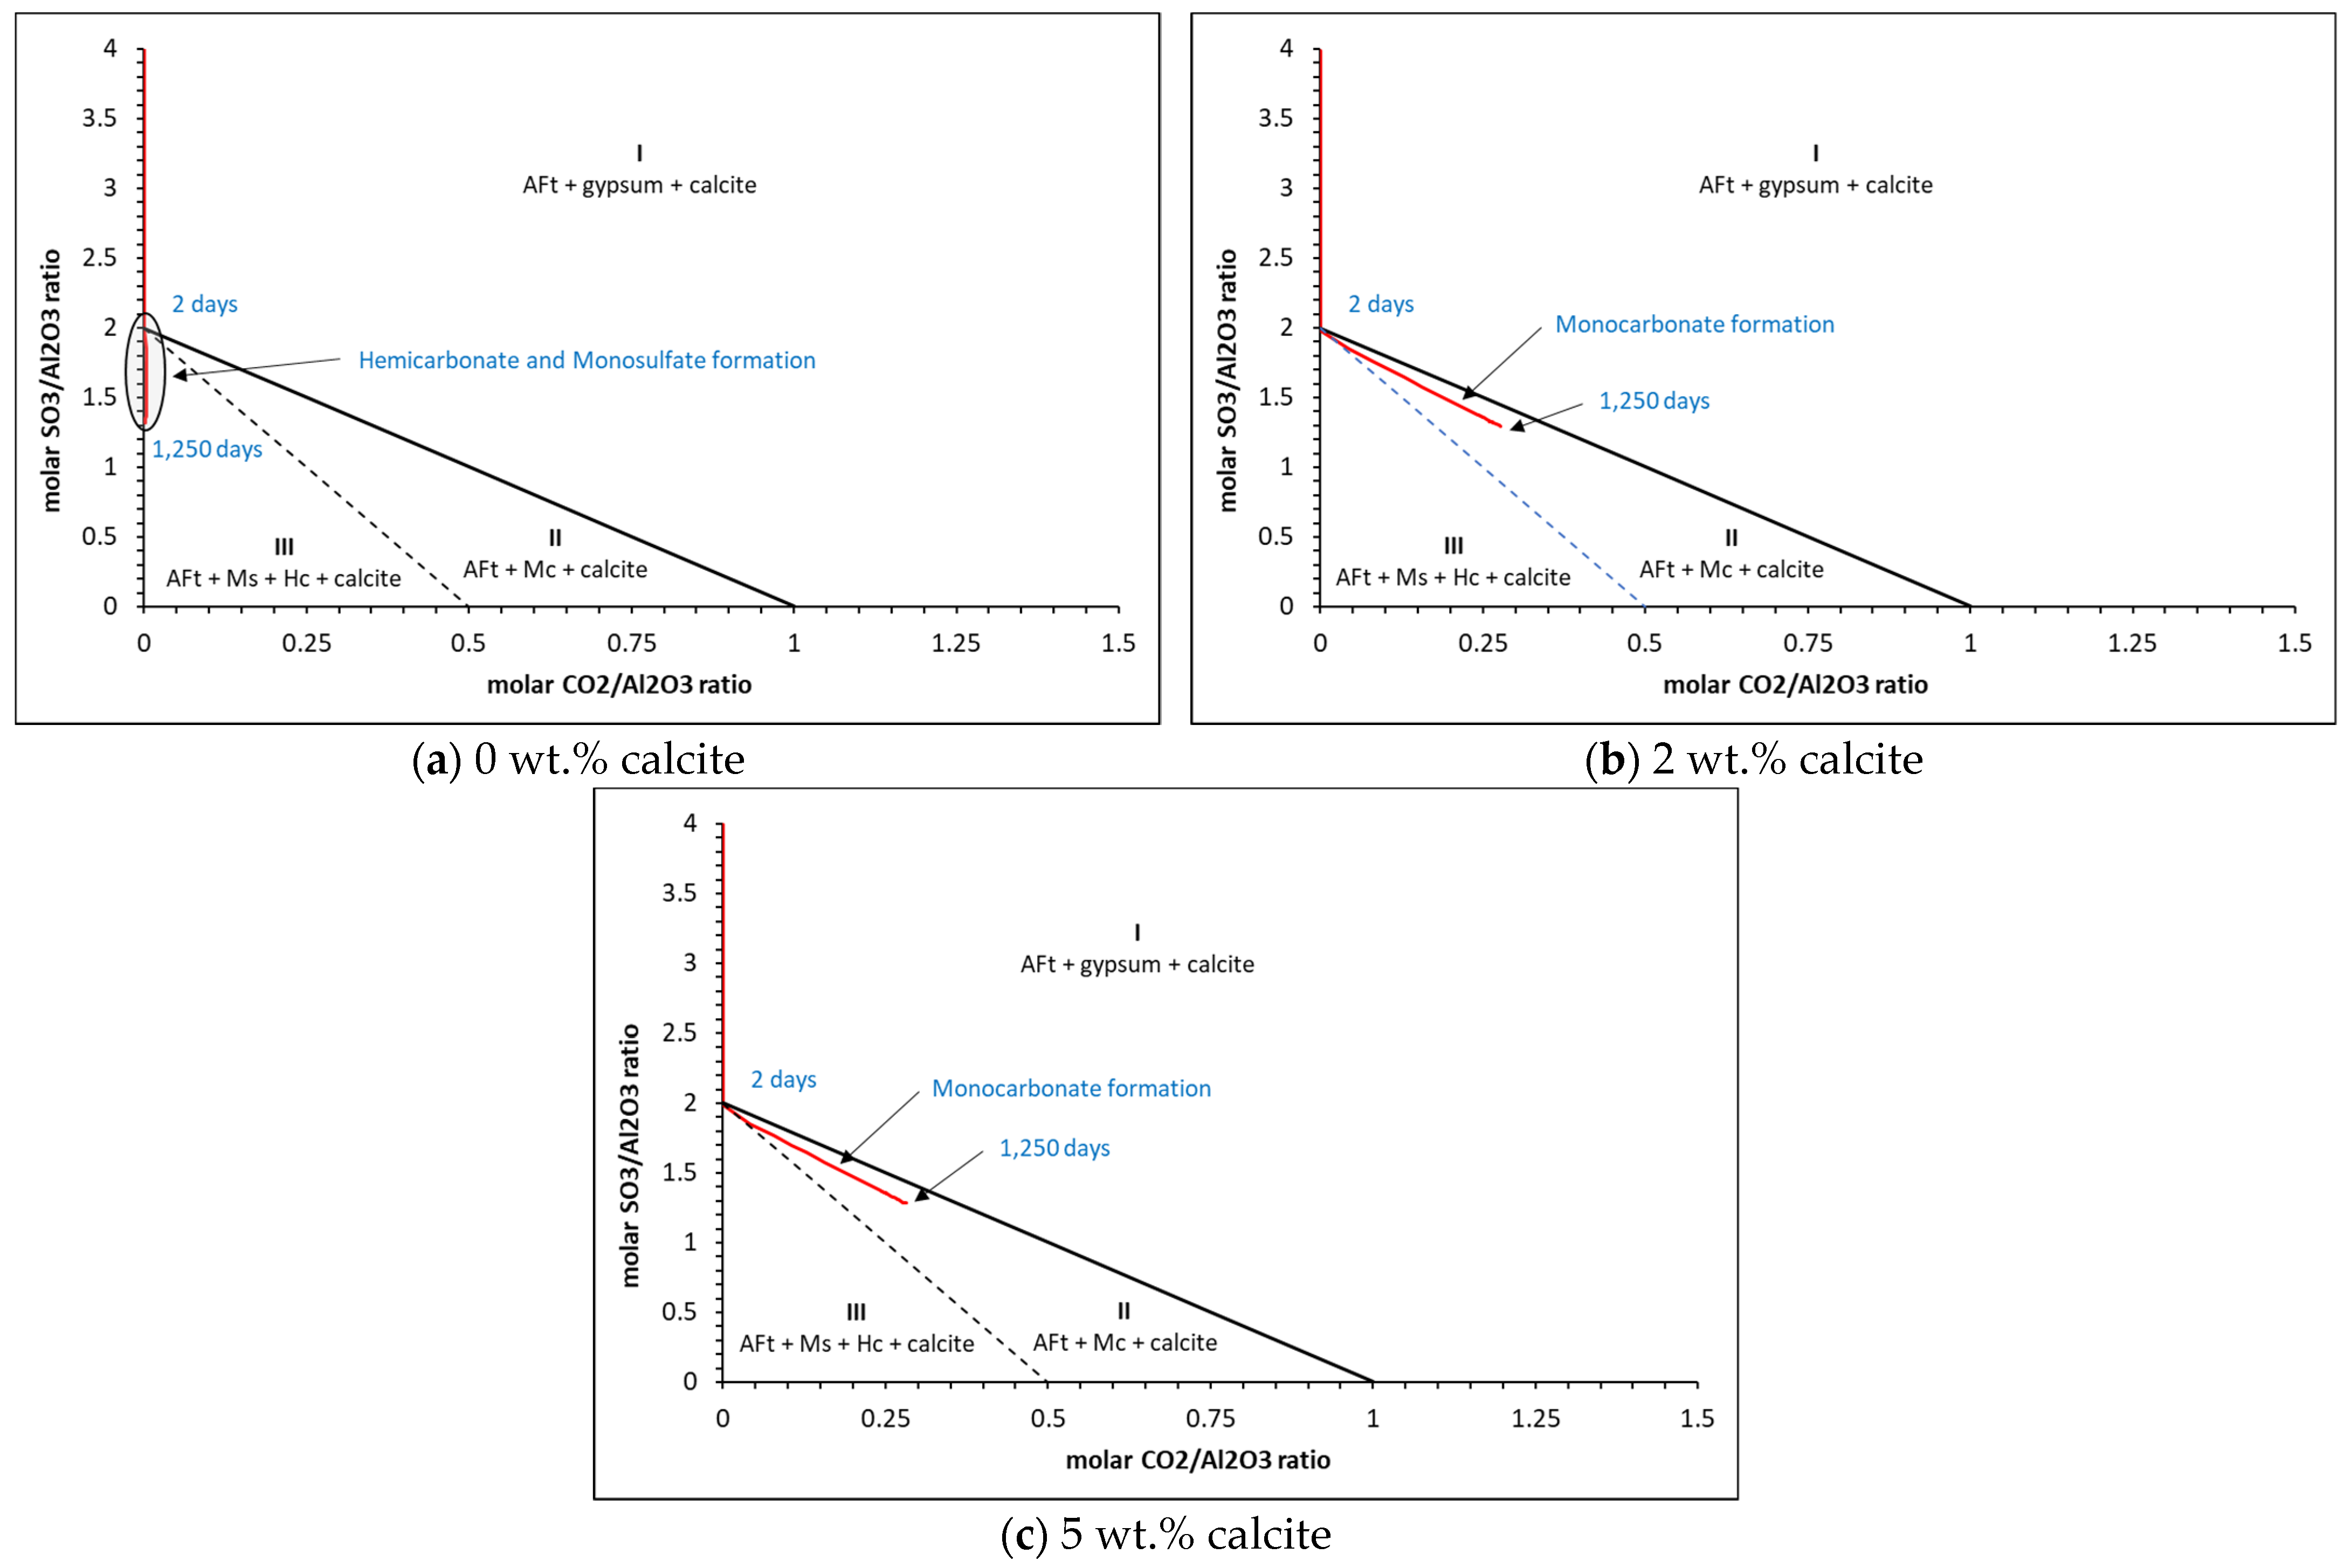
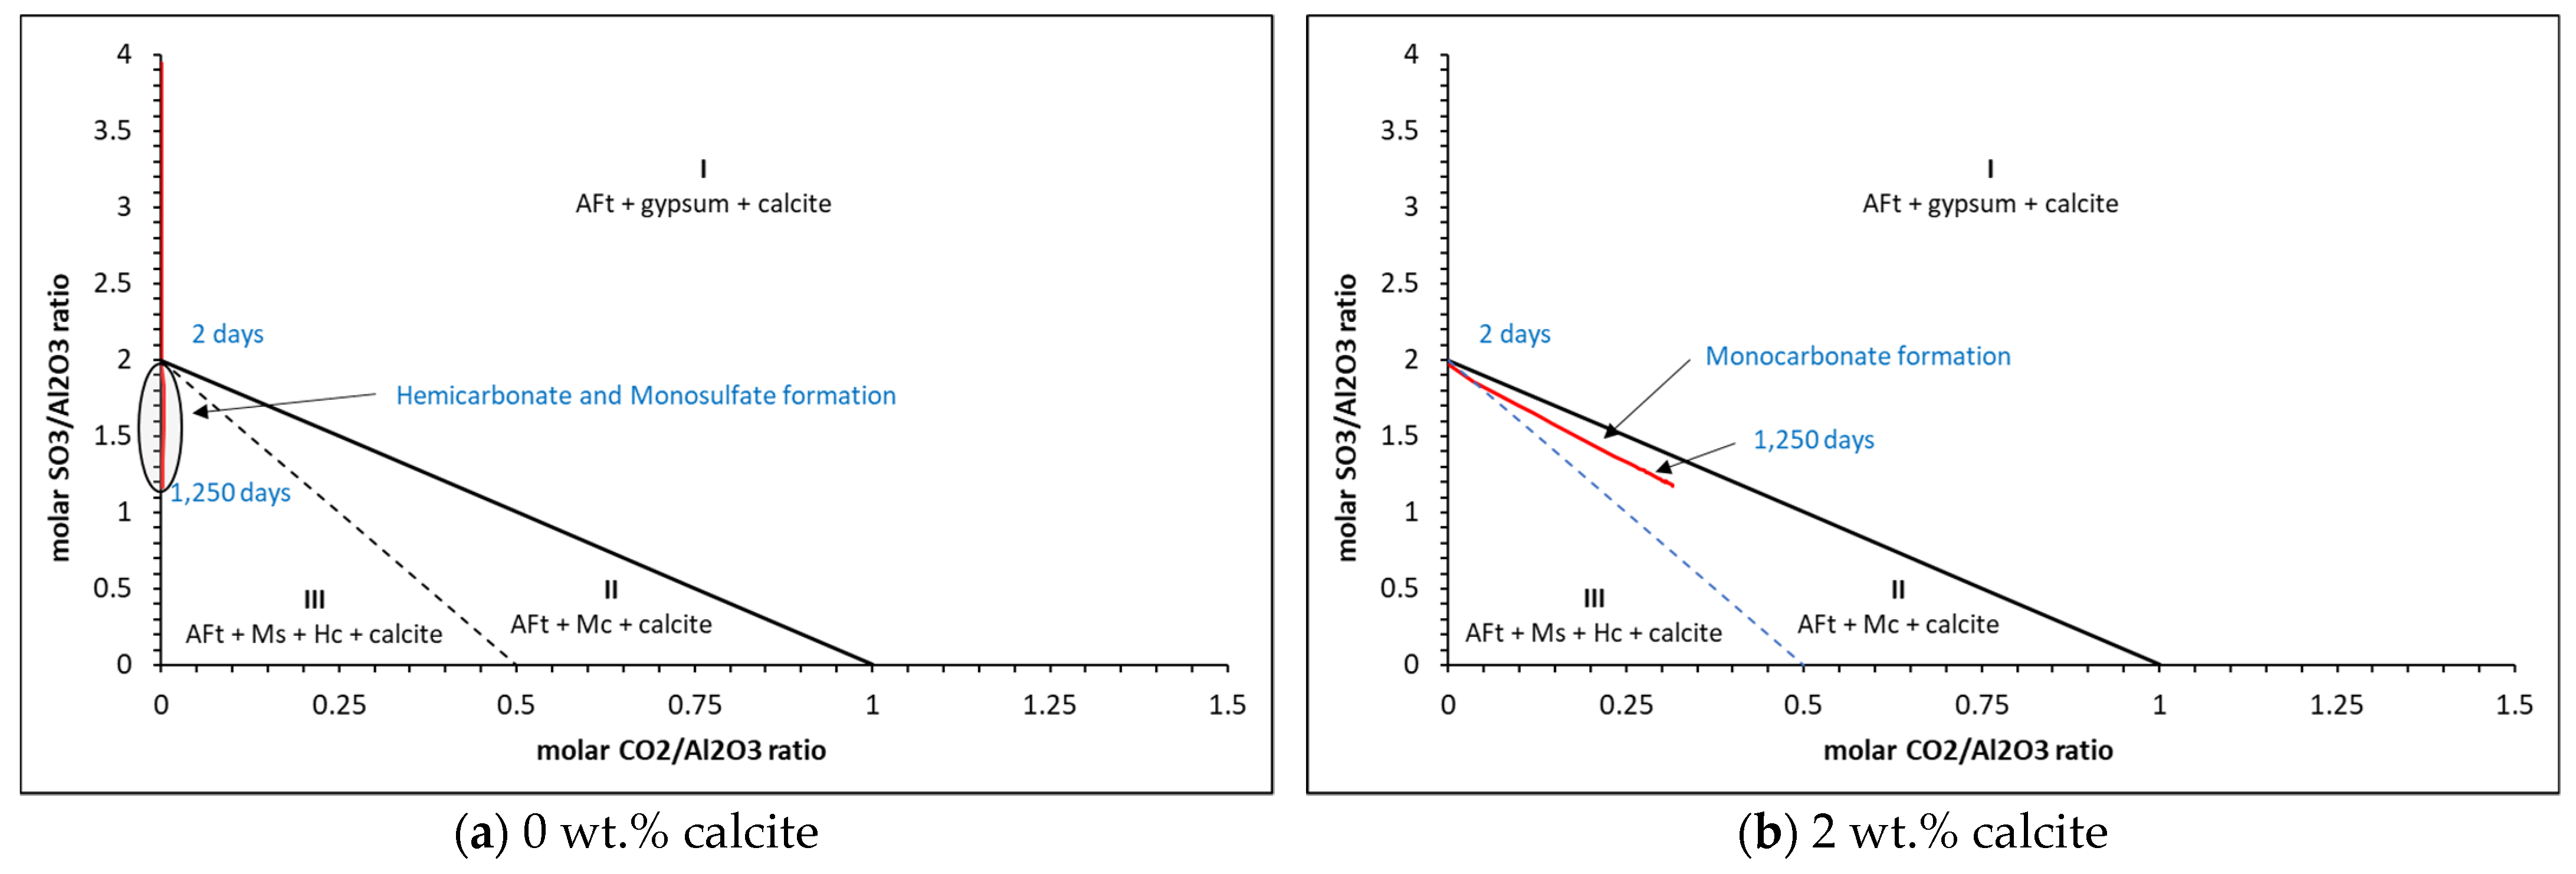
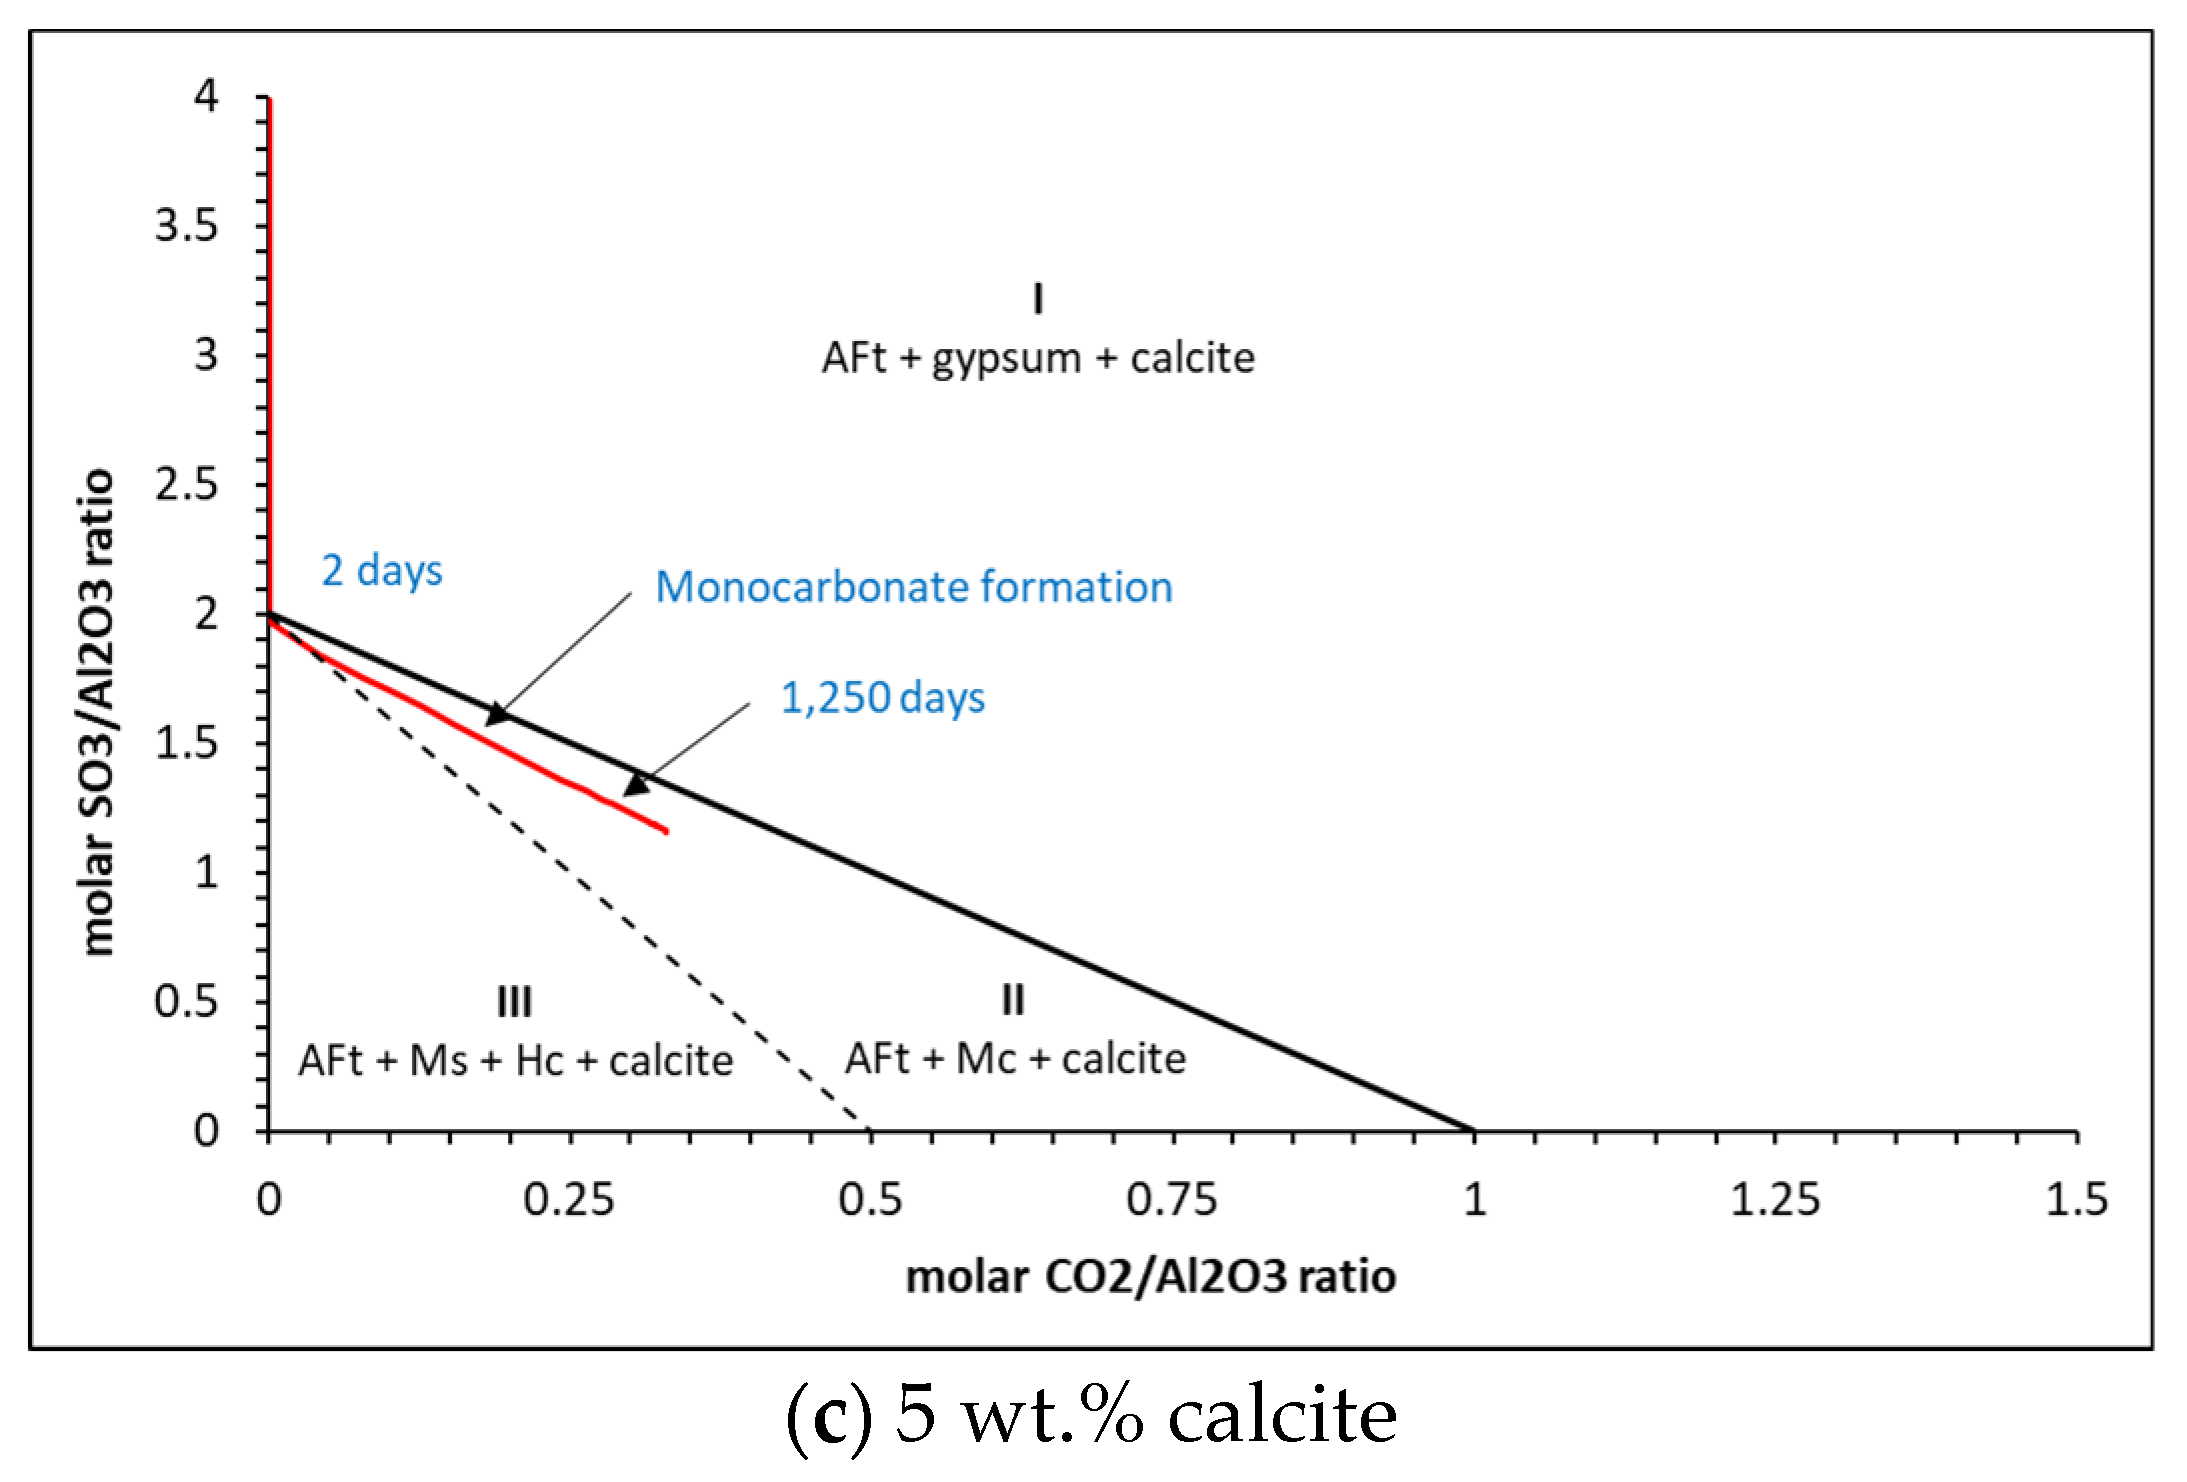
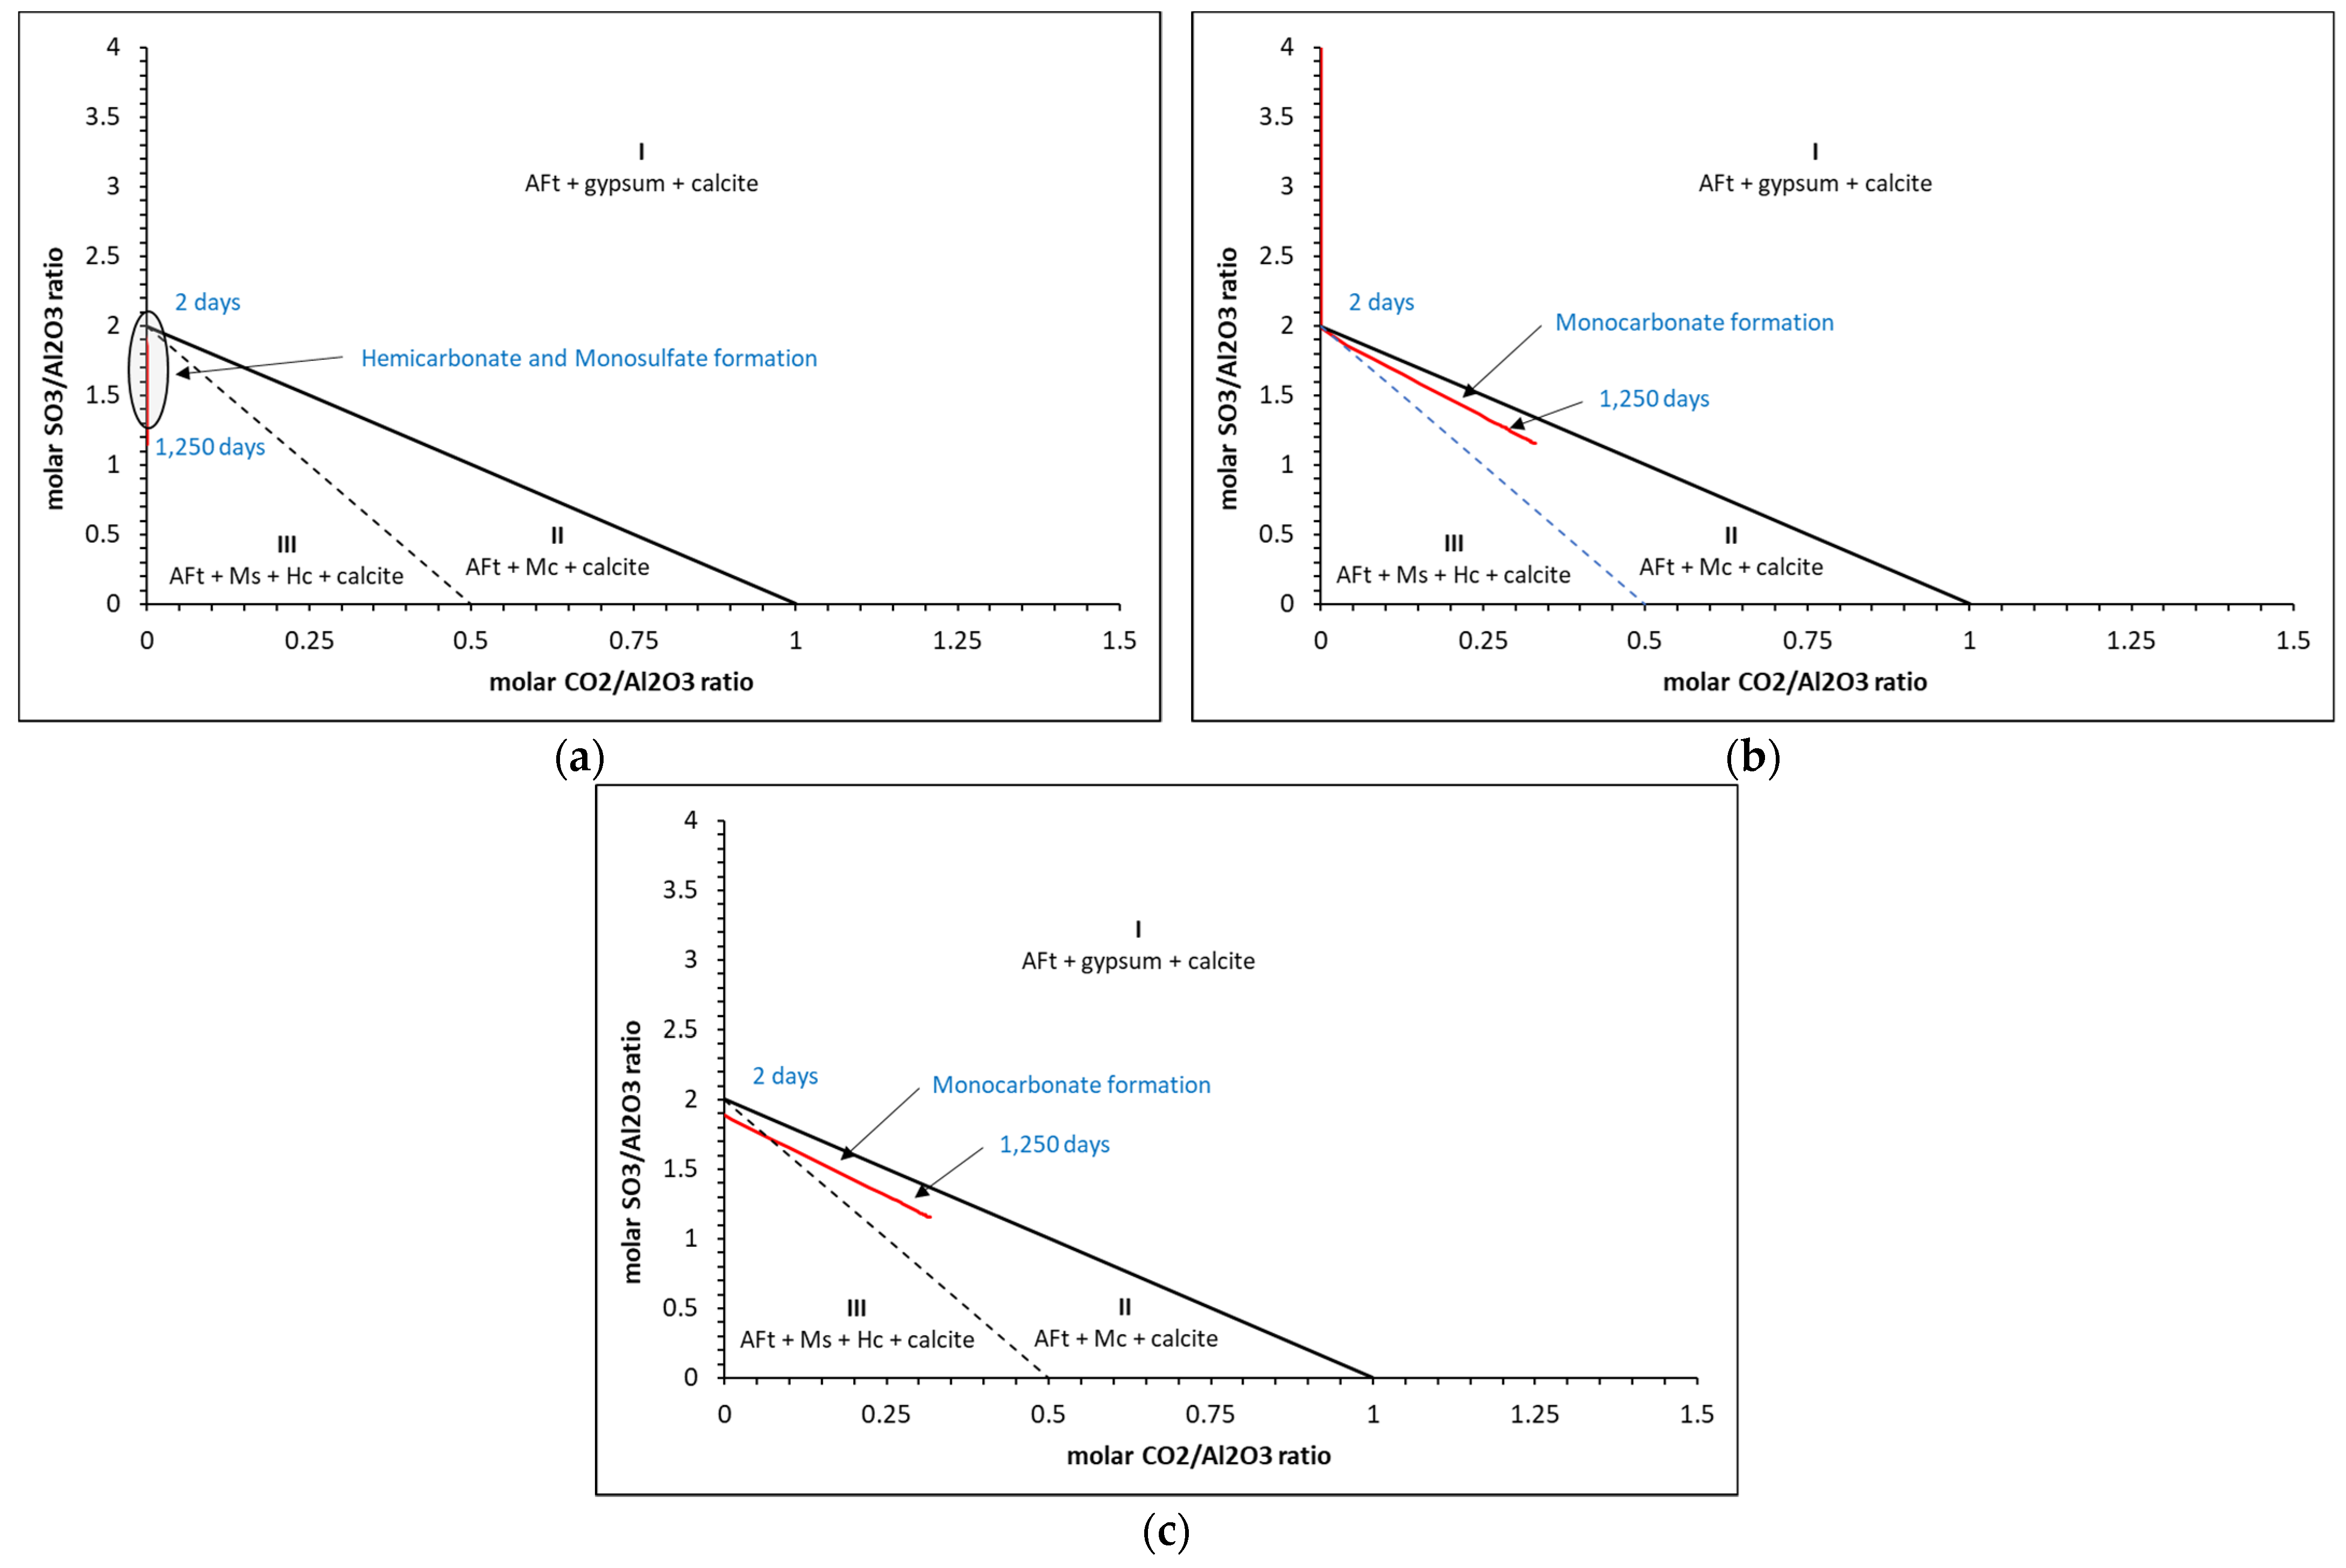
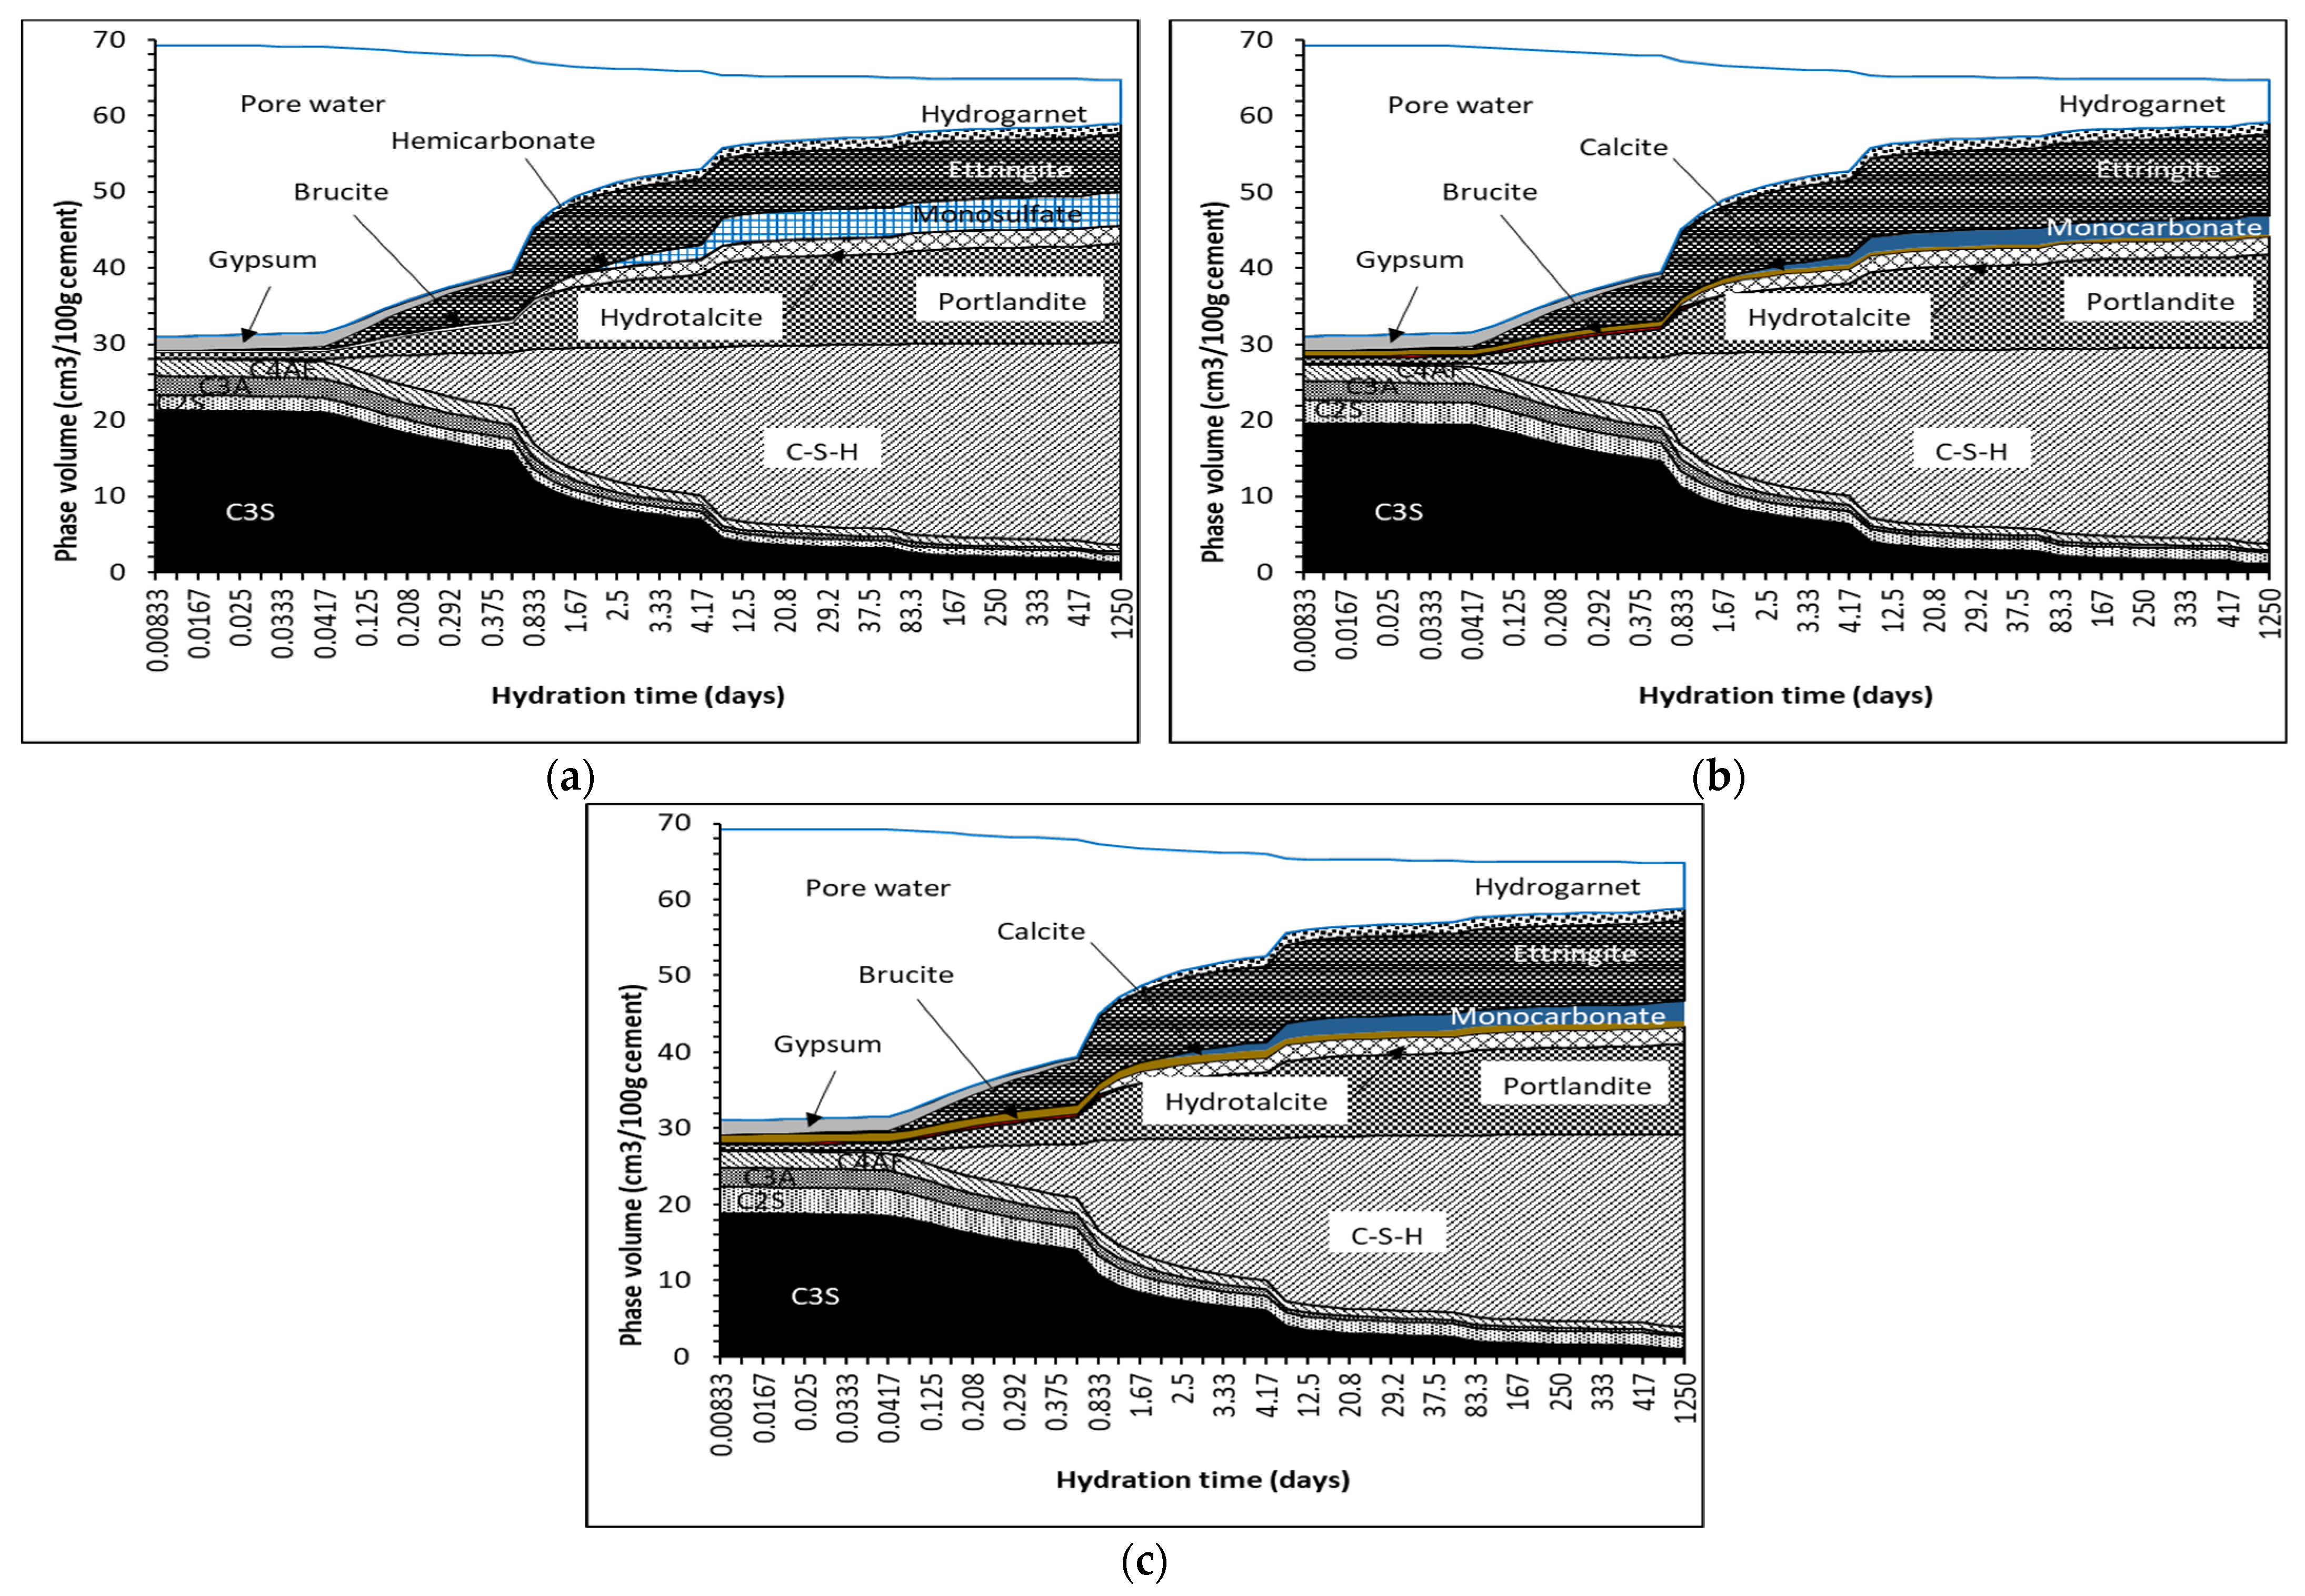
5.2. Phase Assemblages

A typical phase assemblage over time for the three w/c ratios is shown in Figure 8. The main AFm phase predicted to precipitate is monocarbonate. In Portland cements, sulfates will react with aluminates to form ettringite. The addition of calcite in the CEM I cement promotes the formation of carboaluminates. Along with sufficient SO4 available for reaction, ettringite is stabilised as seen in the XRD patterns. Thus, the formation of hemicarbonate is observed in measured data but not always predicted by thermodynamic modelling, reflecting its kinetic persistence experimentally. Additionally, it has been demonstrated above that the dissolution of calcite is much higher than that measured, which would further support the precipitation of monocarbonate over hemicarbonate due to the higher CaCO3 content. The calculated saturation indices of hemicarbonate and monocarbonate are shown in Figure 9a–c. As shown, monocarbonate is predicted to form after 2–3 days while hemicarbonate is undersaturated and would not precipitate as it is not thermodynamically stable.
Matschei et al. [8] developed predicted phase assemblages that will typically occur in hydrated OPC, as shown in Figure 10, and the dependence on initial sulfate (SO3/Al2O3) and carbonate CO2/Al2O3) contents to determine which AFm phase(s) will form. The total molar amount of Al2O3 reacted was taken as cumulative reacted gypsum, initial C3A, C4AF and SO3 contained in each of the 47 PHREEQC solutions. CO2 was taken as the cumulative amount of reacted calcite. As shown, the cement here falls within Zone I, with the AFm phase predicted to form as hemicarbonate (Hs) and monosulfate (Ms) along with AFt. As shown, the ‘turning point’ is at ~2 days, which is the same time as monocarbonate forms and calcite begins to dissolve into the solution, as shown in the phase assemblage in Figure 8. The full change in carbonate and sulfate over the 1250 days of hydration is shown in Figure 11, where significant changes in the latter during the initial hour of hydration, particularly as the accessory clinker phases (lime, calcite, gypsum, periclase, arcanite and thenardite) reach equilibrium with the pore solution in the first time-step and are immediately available to contribute to the formation of hydrate phases. Indeed, Figure 12 shows how the immediate release of sulfate from Na2SO4, K2SO4 and SO3 has partly precipitated as gypsum, as the volume of gypsum is higher than expected in the first hour of hydration.
Matschei et al. [8] found that OPC with very low carbonate contents will form hemicarbonate during hydration but it was not stable at 25 °C in the presence of excess calcite. While it is not explicitly stated what defines ‘excess calcite’, modern commercial CEM I cement can contain up to 5% calcite, in accordance with BS EN 197 [16].
Lothenbach et al. [21] demonstrated the difference in solid phase assemblage in thermodynamic models using the cemdata07 [24] and cemdata18 database. Using the cemdata07 database, their work predicted approximately 25% of the overall volume of hydrated paste was taken up by monosulfate and hemicarbonate. As calcite proportions in the cement increased to 4%, monosulfate and hemicarbonate were converted to monocarbonate. Using cemdata18, however, very minor (<5%) proportions of monosulfate and hemicarbonate were predicted for similar calcite levels. Additionally, the volume of monocarbonate was less, as it replaced the other AFm phases.
To provide some predictions of monosulfate, monocarbonate and hemicarbonate formation from the thermodynamic point of view, Figure 13, Figure 14 and Figure 15 presents the carbonate and sulfate ratios for (a) 0 wt.%, (b) 2 wt.% and (c) 5 wt.% calcite contents for the CEM I cement described in Table 1 with w/c ratios of 0.4, 0.5 and 0.6.
The results show that three distinct zones are created where only AFt (ettringite), gypsum and calcite (zone I), AFt, monocarbonate (Mc) and calcite (zone II) and AFt, monosulfate, hemicarbonate (Hc) and calcite (zone III) are present. As may be seen, hemicarbonate and monosulfate are thermodynamically predicted to form at c.2 days only in zone III for the 0 wt.% calcite in all cases, where beyond this, only monocarbonate is in equilibrium. There is little difference between the ratios for the 2 wt.% and 5 wt.% calcite contents. Typical corresponding phase assemblages for each calcite content is shown in Figure 16.

6. Conclusions

Results from 27 cement samples with three w/c ratios at 1, 3 and 28 days has shown that, due to a number of reasons, such as kinetics, thermodynamic equilibrium and the faster dissolution of calcite than measured, monocarbonate is often predicted to form over hemicarbonate, regardless of w/c ratio. Additionally, the overriding stability of monocarbonate in thermodynamic models also leads to its predicted formation, even though hemicarbonate is observed in experimental measurements. Furthermore, while hemicarbonate is predicted to form in OPC models, it only appears in systems with <2 wt.% of calcite, where it is replaced by monocarbonate. In the XRD readings above, hemicarbonate is shown to exist in a CEM cement with a calcite content of just under 5 wt.%.
During early hydration, AFt and AFm phases are predicted to precipitate. This is confirmed thermodynamically as the immediate dissolution of SO3, Na2SO4 and K2SO4 partly precipitates as gypsum in the first hours of hydration. After approximately two days, monosulfate and hemicarbonate phases are expected to form due to their sulfate (SO3/Al2O3) and carbonate CO2/Al2O3) ratios. However, the thermodynamic model only predicts monocarbonate is calculated to equilibrate.

Author Contributions

Conceptualization, N.H. and M.T.; methodology, M.R. and G.D.; software, N.H.; validation, M.T. and M.R.; formal analysis, N.H., M.T. and M.R.; investigation, N.H.; data curation, N.H. and G.D.; writing—original draft preparation, N.H.; writing—review and editing, M.T. and M.R. All authors have read and agreed to the published version of the manuscript.

Funding

Funding to publish this work was from a US-Ireland grant tri-funded by the National Science Foundation (NSF, 1805818), Science Foundation Ireland (SFI, 17/US/3424), and the Department for the Economy of Northern Ireland (DfE, USI 127).

Institutional Review Board Statement

Not applicable.

Informed Consent Statement

Not applicable.

Data Availability Statement

Not applicable.

Acknowledgments

The authors would like to acknowledge the valuable advice provided by Colin Walker during the production of this paper.

Conflicts of Interest

The authors declare no conflict of interest.

References

  1. Rothstein, D.; Thomas, J.J.; Christensen, B.J.; Jennings, H.M. Solubility behavior of Ca-, S-, Al-, and Si-bearing solid phases in Portland cement pore solutions as a function of hydration time. Cem. Concr. Res. 2002, 32, 1663–1671. [Google Scholar] [CrossRef]
  2. Lothenbach, B.; Saout, G.L.; Gallucci, E.; Scrivener, K. Influence of limestone on the hydration of Portland cements. Cem. Concr. Res. 2008, 38, 848–860. [Google Scholar] [CrossRef]
  3. Lothenbach, B.; Winnefeld, F.; Alder, C.; Wieland, E.; Lunk, P. Effect of temperature on the pore solution, microstructure and hydration products of Portland cement pastes. Cem. Concr. Res. 2007, 37, 483–491. [Google Scholar] [CrossRef]
  4. Lothenbach, B.; Winnefeld, F. Thermodynamic modelling of the hydration of Portland cement. Cem. Concr. Res. 2006, 36, 209–226. [Google Scholar] [CrossRef]
  5. Holmes, N.; Tyrer, M.; West, R.P.; Lowe, A.; Kelliher, D. Using PHREEQC to model cement hydration. Constr. Build. Mater. 2022, 319, 126–129. [Google Scholar] [CrossRef]
  6. Holmes, N.; Kelliher, D.; Tyrer, M. Thermodynamic cement hydration modelling using HYDCEM. In Proceedings of the Civil Engineering Research in Ireland 2020, Online Conference, 27 August 2020. [Google Scholar]
  7. Parkhurst, D.J.; Appelo, C.A.J. Description of Input and Examples for PHREEQC Version 3—A Computer Program for Speciation, Batch-reaction, One-dimensional Transport and Inverse Geochemical Calculations. US Geol. Surv. Tech. Methods 2013, 6, 497. [Google Scholar]
  8. Matschei, T.; Lothenbach, B.; Glasser, F.P. The AFm phase in Portland cement. Cem. Concr. Res. 2007, 37, 118–130. [Google Scholar] [CrossRef]
  9. Baquerizo, L.G.; Matschei, T.; Scrivener, K.; Saeidpour, M.; Wadsö, L. Hydration states of AFm cement phases. Cem. Concr. Res. 2015, 73, 143–157. [Google Scholar] [CrossRef]
  10. Matschei, T.; Lothenbach, B.; Glasser, F.P. The role of calcium carbonate in cement hydration. Cem. Concr. Res. 2007, 37, 551–558. [Google Scholar] [CrossRef]
  11. Georget, F.; Lothenbach, B.; Wilson, W.; Zunino, F.; Scrivener, K.L. Stability of hemicarbonate under cement paste-like conditions. Cem. Concr. Res. 2022, 153, 106692. [Google Scholar] [CrossRef]
  12. Kuzel, H.-J.; Pöllmann, H. Hydration of C3A in the presence of Ca(OH)2, CaSO4·2H2O and CaCO3. Cem. Concr. Res. 1991, 21, 885–895. [Google Scholar] [CrossRef]
  13. Damidot, D.; Stronach, S.; Kindness, A.; Atkins, M.; Glasser, F.P. Thermodynamic investigation of the CaO-Al2O3-CaCO3-H2O closed system at 25 °C and the influence of Na2O. Cem. Concr. Res. 1994, 24, 563–572. [Google Scholar] [CrossRef]
  14. Hobbs, M.Y. Solubilities and Ion Exchange Properties of Solid Solutions between the OH, Cl and CO3 end Members of the Monocalcium Aluminate Hydrates. Ph.D. Thesis, University of Waterloo, Waterloo, ON, Canada, 2001. [Google Scholar]
  15. Chou, L.; Garrels, R.M.; Wollast, R. Comparative study of the kinetics and mechanisms of dissolution of carbonate minerals. Chem. Geol. 1989, 78, 269–282. [Google Scholar] [CrossRef]
  16. British Standards Institute. BS EN 197-1 Cement: Composition, Specification and Conformity Criteria for Common Cements; British Standards Institute: London, UK, 2000. [Google Scholar]
  17. Hesse, C.; Goetz-Neunhoeffer, F.; Neubauer, J. A new approach in quantitative in-situ XRD of cement pastes: Correlation of heat flow curves with early hydration reactions. Cem. Concr. Res. 2011, 41, 123–128. [Google Scholar] [CrossRef]
  18. Jensen, D.; Neubauer, J.; Goetz-Neunhoeffer, F.; Haerzschel, R.; Hergeth, W.D. Change in reaction kinetics of a Portland cement caused by a superplasticizer—Calculation of heat flow curves from XRD data. Cem. Concr. Res. 2012, 42, 327–332. [Google Scholar] [CrossRef]
  19. Holmes, N.; Walker, C.; Tyrer, M.; Kelliher, D. Predicting Chemical Shrinkage in hydrating cements. Polym. Spec. Issue Entitled Cem. Based Compos. Des. Synth. Prop. Rev. 2022. under review. [Google Scholar]
  20. Holmes, N.; Walker, C.; Tyrer, M.; Kelliher, D. Deriving discrete solid phases from CSH-3T and CSHQ end-members to model cement hydration in PHREEQC. In Proceedings of the Civil Engineering Research in Ireland (CERI) Conference, Dublin, Ireland, 25–26 August 2022; Holmes, N., de Paor, C., West, R., Eds.; CERI/ITRN: Dublin, Ireland, 2022; pp. 28–33. [Google Scholar]
  21. Lothenbach, B.; Kulik, D.A.; Matschei, T.; Balonis, M.; Baquerizo, L.; Dilnesa, B.; Miron, G.D.; Myers, R.J. Cemdata18: A chemical thermodynamic database for hydrated Portland cements and alkali-activated materials. Cem. Concr. Res. 2019, 115, 472–506. [Google Scholar] [CrossRef] [Green Version]
  22. Walker, C.; Sutou, S.; Oda, C.; Mihara, M.; Honda, A. Calcium silicate hydrate (C-S-H) gel solubility data and a discrete solid phase model at 25 °C based on two binary non-ideal solid solutions. Cem. Concr. Res. 2016, 79, 1–30. [Google Scholar] [CrossRef]
  23. Grenthe, I.; Puigdomenech, I. Modelling in Aquatic Chemistry; OECD Publishing: Paris, France, 1997. [Google Scholar]
  24. Lothenbach, B.; Matschei, T.; Glasser, G.; Möschner, F. Thermodynamic modelling of the effect of temperature on the hydration and porosity of Portland cement. Cem. Concr. Res. 2008, 38, 1–18. [Google Scholar] [CrossRef]
Figure 1. XRD patterns at 1, 7 and 28 days.
Applsci 12 10147 g001
Figure 2. XRD patterns from 8−13 angle 2θ.
Applsci 12 10147 g002
Figure 3. TGA and DTG of the unhydrated clinker.
Applsci 12 10147 g003
Figure 4. Mass change by TGA at 1, 7 and 28 days.
Applsci 12 10147 g004
Figure 5. Heat of hydration measurements of the three w/c ratio cements.
Applsci 12 10147 g005
Figure 6. SO3, MgO and Periclase log K comparisons.
Applsci 12 10147 g006aApplsci 12 10147 g006b
Figure 7. Comparison between measured and predicted portlandite and calcite contents over time.
Applsci 12 10147 g007
Figure 8. Typical phase assemblages from three hydrating CEM I cements.
Applsci 12 10147 g008
Figure 9. Calculated saturation indices for hemicarbonate and monocarbonate for the three w/c ratios.
Applsci 12 10147 g009
Figure 10. Calculated phase assemblages of a hydrated mixture for varying carbonate (CO2/Al2O4) and sulfate (SO3/Al2O4) ratios after Matschei et al. [8], showing the cement under analysis here (in red).
Applsci 12 10147 g010
Figure 11. Change in sulfate and carbonate ratios during 1250 days of hydration.
Applsci 12 10147 g011aApplsci 12 10147 g011b
Figure 12. Dissolution of gypsum over time showing some precipitation from Na2SO4, K2SO4 and SO3.
Applsci 12 10147 g012
Figure 13. Thermodynamic predictions of carbonate and sulfate ratios for (a) 0%, (b) 2% and (c) 5% calcite for the w/c = 0.4 cement.
Applsci 12 10147 g013
Figure 14. Thermodynamic predictions of carbonate and sulfate ratios for (a) 0%, (b) 2% and (c) 5% calcite for the w/c = 0.5 cement.
Applsci 12 10147 g014aApplsci 12 10147 g014b
Figure 15. Thermodynamic predictions of carbonate and sulfate ratios for (a) 0%, (b) 2% and (c) 5% calcite for the w/c = 0.6 cement.
Applsci 12 10147 g015
Figure 16. Typical thermodynamic phase assemblages for (a) 0%, (b) 2% and (c) 5% calcite.
Applsci 12 10147 g016
Table 1. CEM I (42.5N) oxide proportions (g/100 g) and normalised clinker proportions.
Oxideg/100 gPhaseg/100 gMoles
SiO220.19C3S56.620.2305
Al2O34.79C2S16.590.0963
Fe2O32.86C3A7.640.0283
CaO64.59C4AF8.460.0174
MgO1.68Calcite5.840.0583
Na2O0.16Gypsum4.000.0233
K2O0.63K2SO41.020.0059
CO2 *2.64Na2SO40.160.0011
SO32.49K2O0.060.0007
Blaine fineness (m2/kg)419Na2O0.090.0014
Loss on Ignition (LOI)2.72MgO1.630.0405
SO31.860.0233
* Based on TGA.
Table 2. Proportion of Portlandite and Calcite over time from TGA (Molar mass of Portlandite, Water and CO2 taken as 74.093, 18.015 and 44.01 g/mol, respectively).
w/c RatioAgePortlandite (%) c.450 °CCalcite (%) c.700 °C
Unhydrated Clinker1.60%6.00%
0.41-day10.404.16
7 days14.393.95
28 days15.344.02
0.51-day11.354.07
7 days15.623.75
28 days16.653.27
0.61-day10.683.59
7 days15.423.23
28 days16.613.21
Table 3. Thermodynamic data to derive SO3, MgO and Periclase phases taken from [21].
Mineral Name [Composition]Dissolution Reaction
SO3
[SO3]
viComponentfGom
(J/mol)
fHom
(J/mol)
Som (J/K/mol)Cpom (J/K/mol)RMM (g/mol)Z (-)
−1SO3−374,141−451,66379.496No data80.06420
−1H2O−237,181.38−285,837.369.9241875.360,52618.015280
2H+00001.007941
1SO4−2−744,459−909,69718.82801−266.0907296.0636−2
rΞom−133,136.62−172,196.7−130.59217NAN---0
Phase description for PHREEQC PHASE data block
SO3 + 1 H2O = + 2 H+ + 1 SO4−2
log_k 23.3244
delta_h −172.197 kJ/mol
analytical_expression−6.82126308994.40600
MgO
[MgO]
viComponentfGom
(J/mol)
fHom
(J/mol)
Som (J/K/mol)Cpom (J/K/mol)RMM (g/mol)Z (-)
−1MgO−569,314−601,60026.9537.23740.30440
−2H+00001.007941
1Mg+2−453,985−465,929−138.072−21.66209124.3052
1H2O−237,181.38−285,837.369.9241875.36052618.015280
rΞom−121,852.7454−150,166.3−95.0978216.461435---0
Phase description for PHREEQC PHASE data block
MgO + 2 H+ = + 1 Mg+2 + 1 H2O
log_k 21.3476
delta_h−150.166 kJ/mol
analytical_expression−10.7261108100.0451.9798440
Periclase
[MgO]
viComponentfGom
(J/mol)
fHom
(J/mol)
Som (J/K/mol)Cpom (J/K/mol)RMM (g/mol)Z (-)
−1MgO−569,314−601,60026.9537.23740.30440
−2H+00001.007941
1Mg+2−453,985−465,929−138.072−21.66209124.3052
1H2O−237,181.38−285,837.369.9241875.36052618.015280
rΞom−121,852.7454−150,166.3−95.0978216.461435---0
Phase description for PHREEQC PHASE data block
MgO + 2H+ = + 1Mg+2 + 1H2O
log_k 21.3476
delta_h −150.166 kJ/mol
analytical_expression−10.7261108100.0451.9798440
Table 4. Comparison between measured and predicted portlandite and calcite contents over time.
w/c
Ratio
Time (Days)PortlanditeCalcite
Measured (%)Predicted (%)Measured (%)Predicted (%)
0.41 day10.416.444.163.19
7 days14.3912.343.952.67
28 days15.3413.414.022.65
0.51 day11.355.594.072.78
7 days15.6210.773.752.32
28 days16.6511.853.273.27
0.61 day10.684.943.592.46
7 days15.429.523.232.05
28 days16.6110.503.211.95
Publisher’s Note: MDPI stays neutral with regard to jurisdictional claims in published maps and institutional affiliations.

