
Measurement System for the Experimental Study and Testing of Electric Motors at the Faculty of Engineering, University of Debrecen


Abstract
1. Introduction
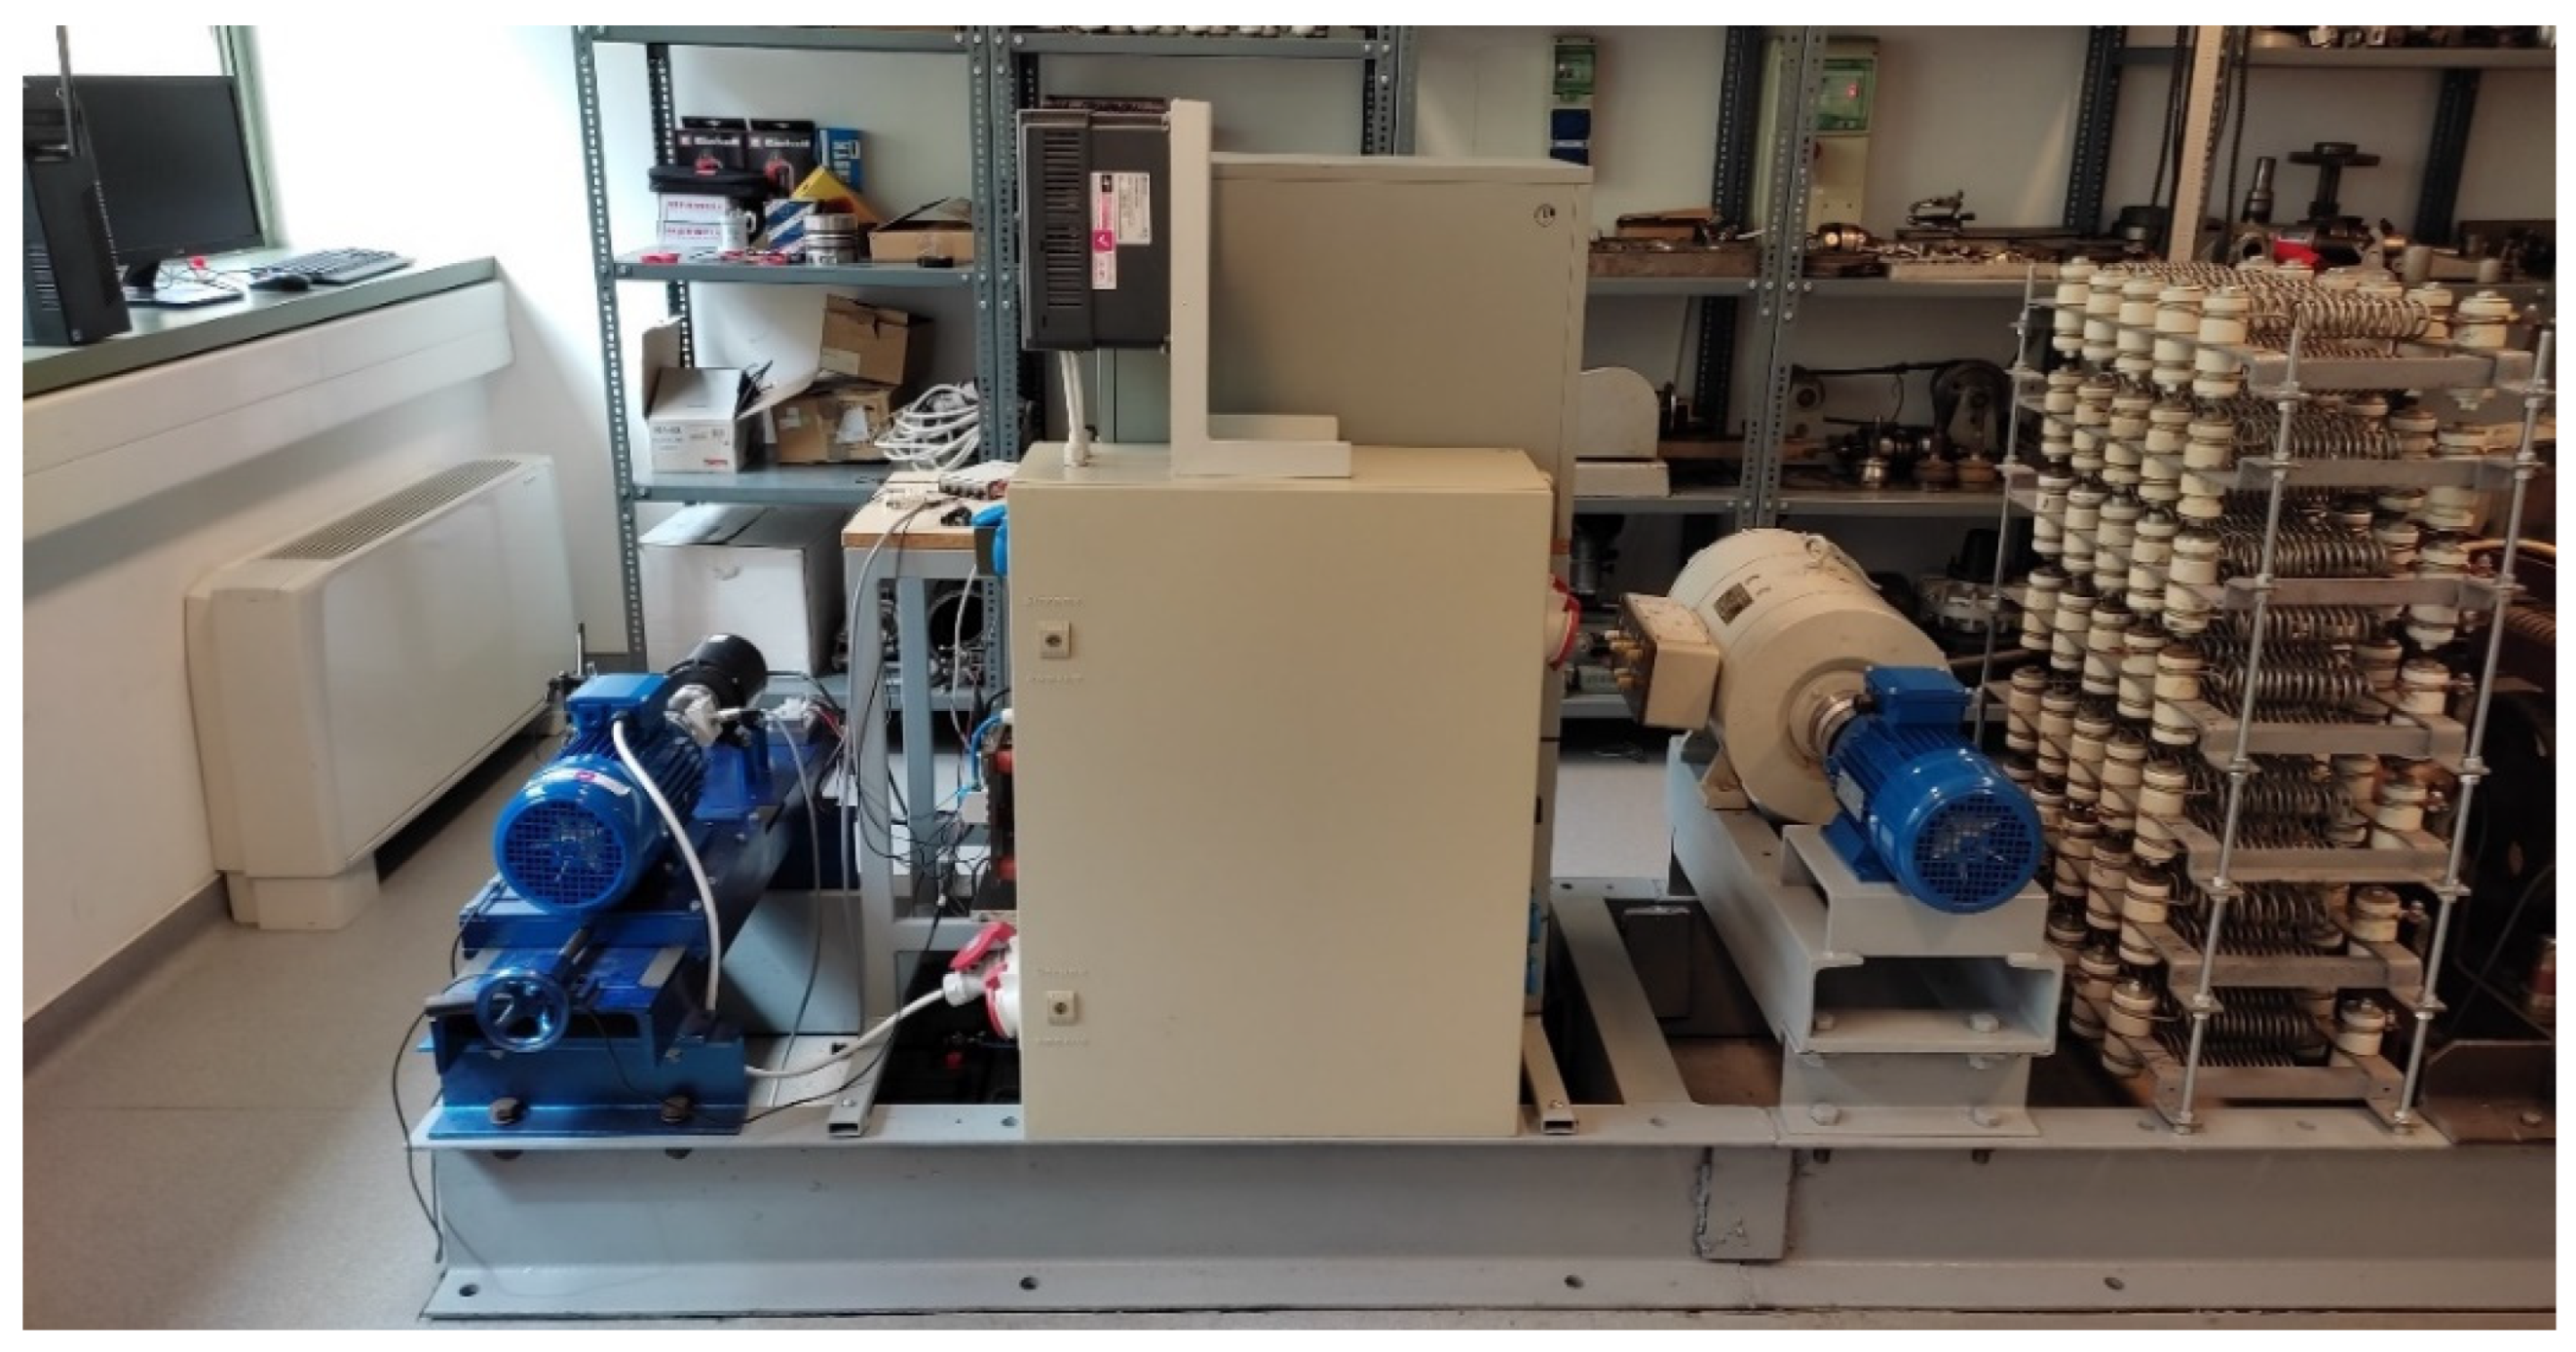
2. Description of the Measurement System
- (1)
- Motor test bench including the analyzed and load/drive motor together with the connected data acquisition system;
- (2)
- Control desk and switch cabinet, including a special load resistor;
- (3)
- AC power source with variable voltage and frequency.
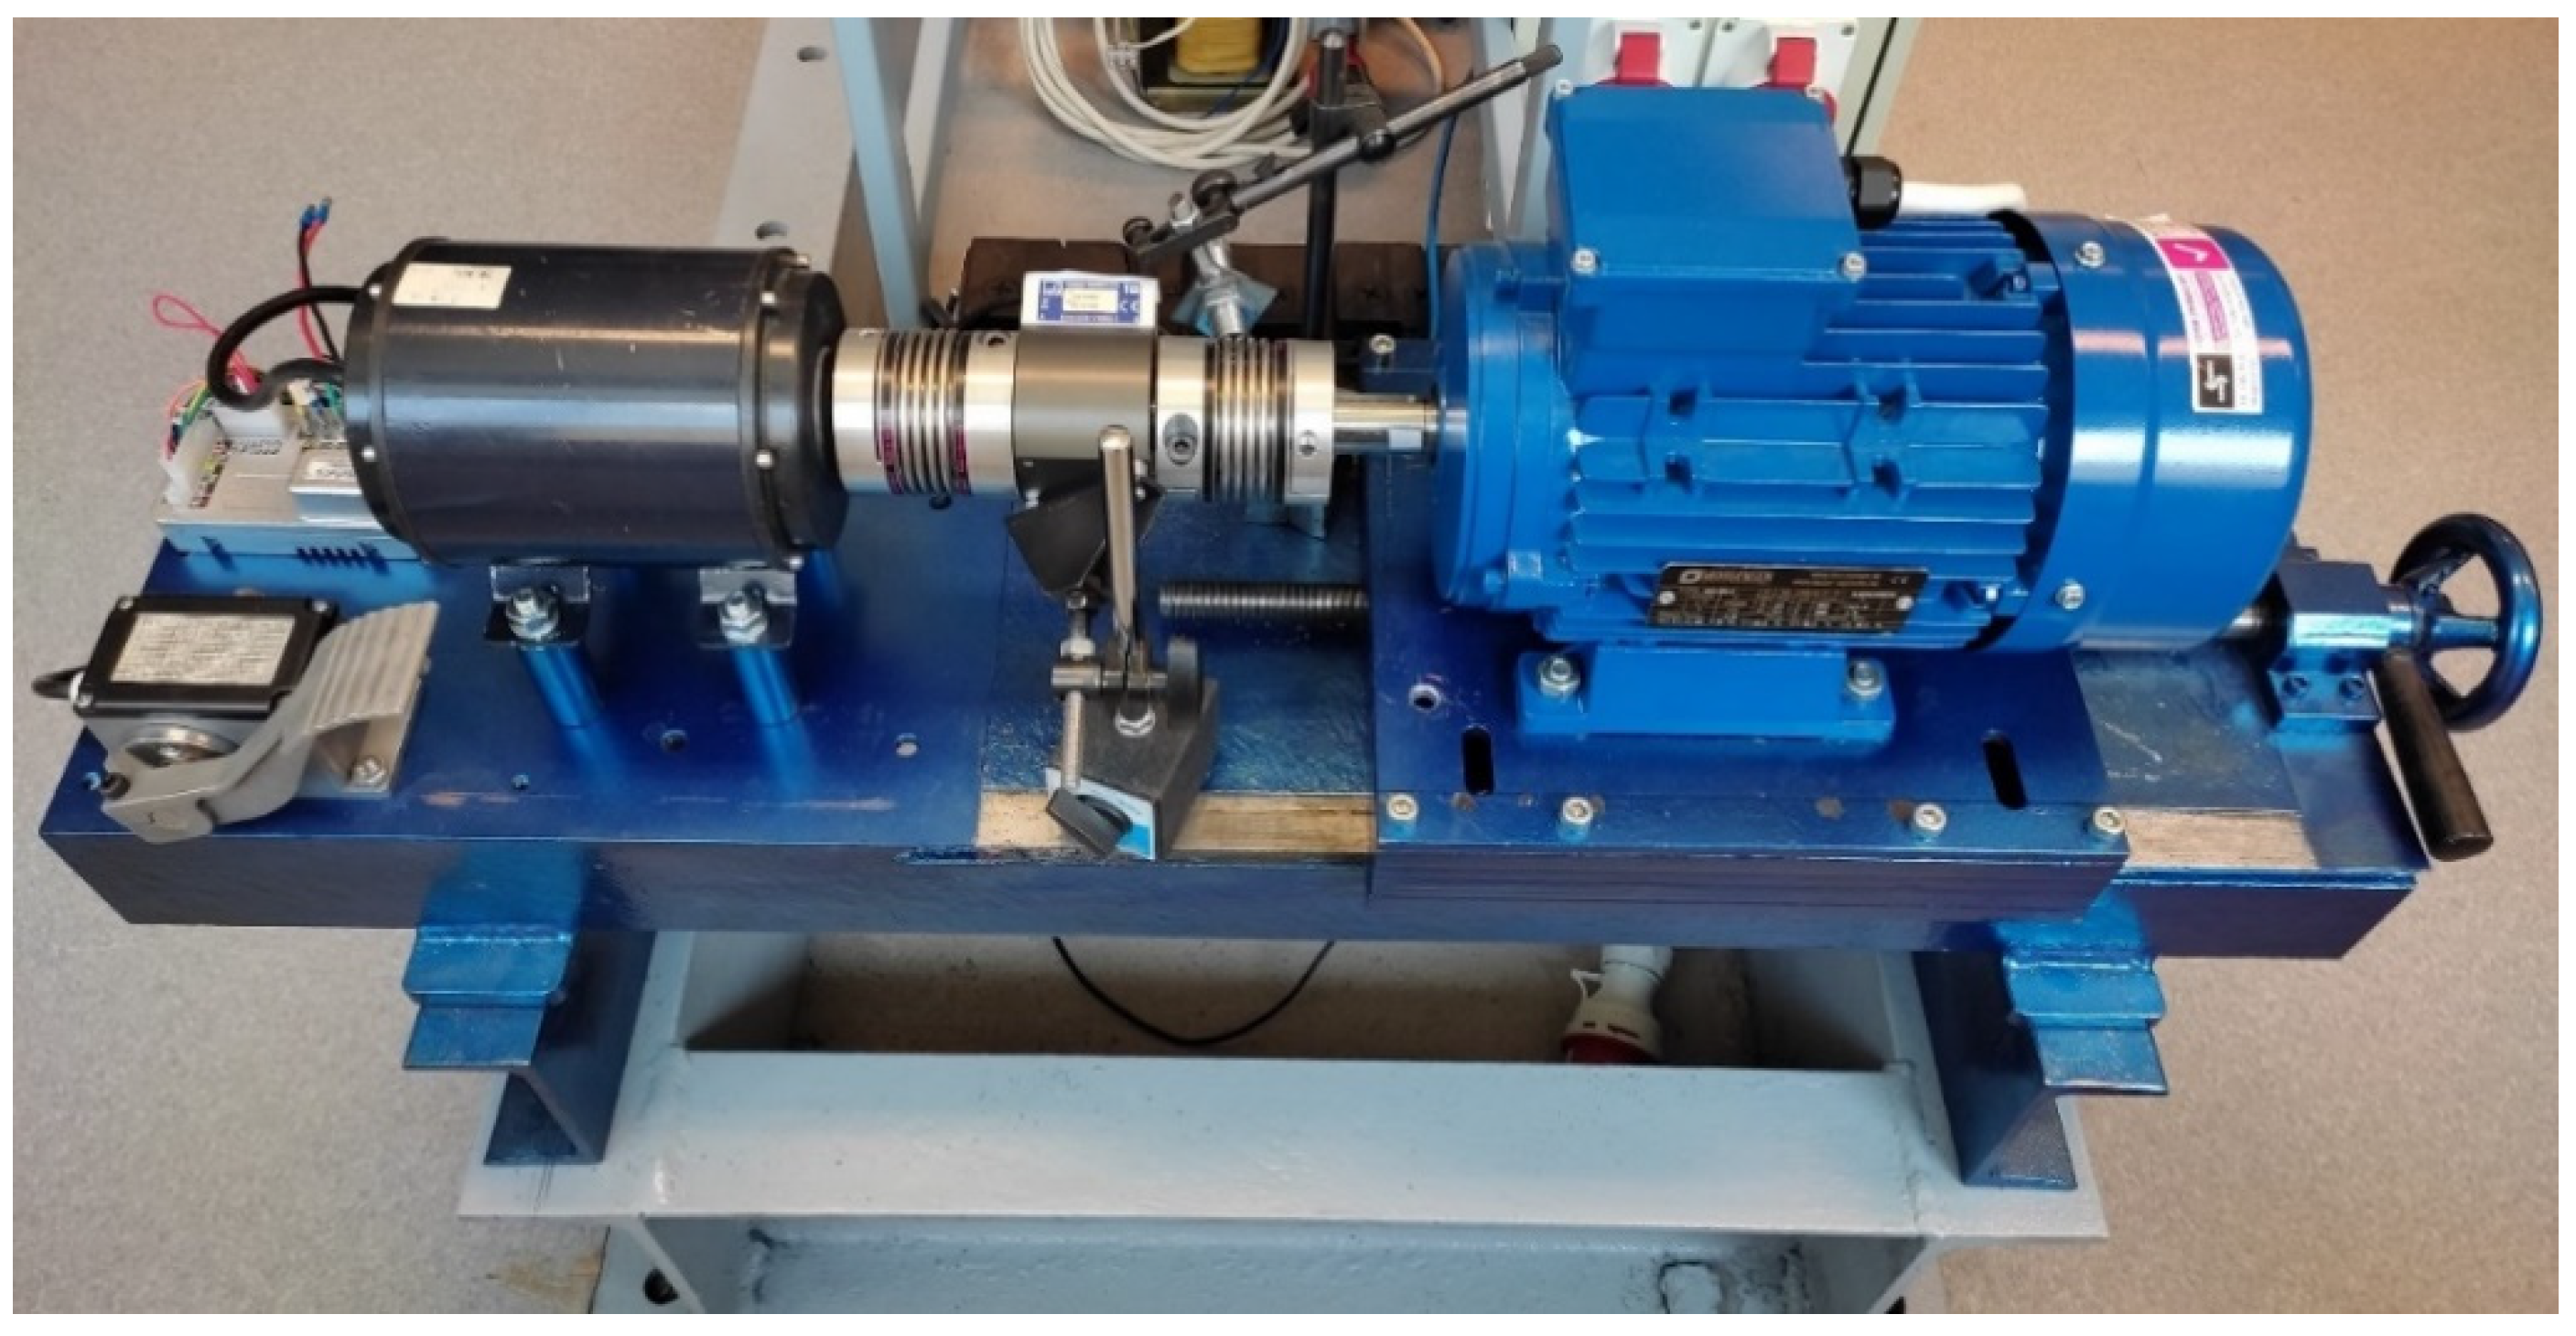
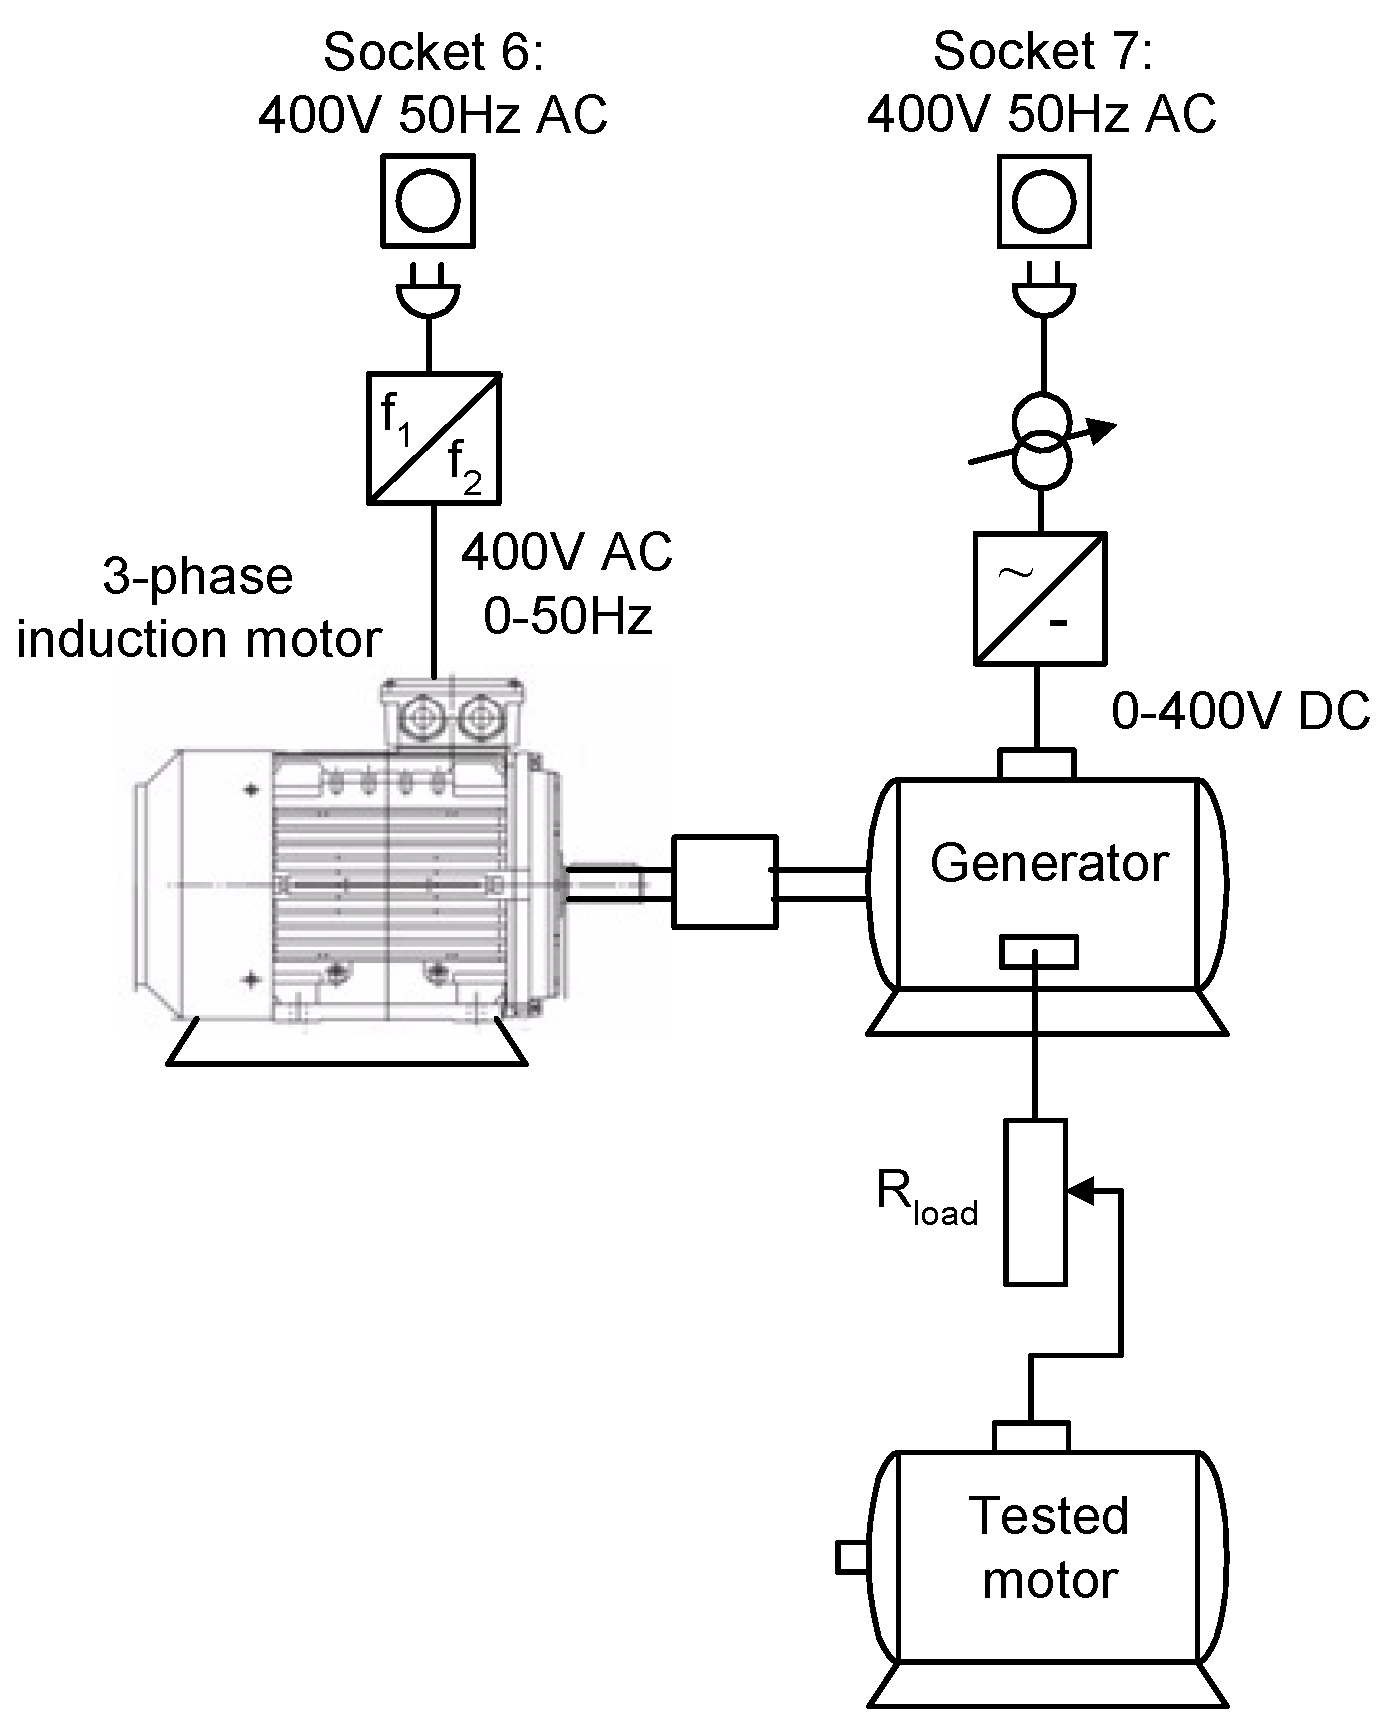
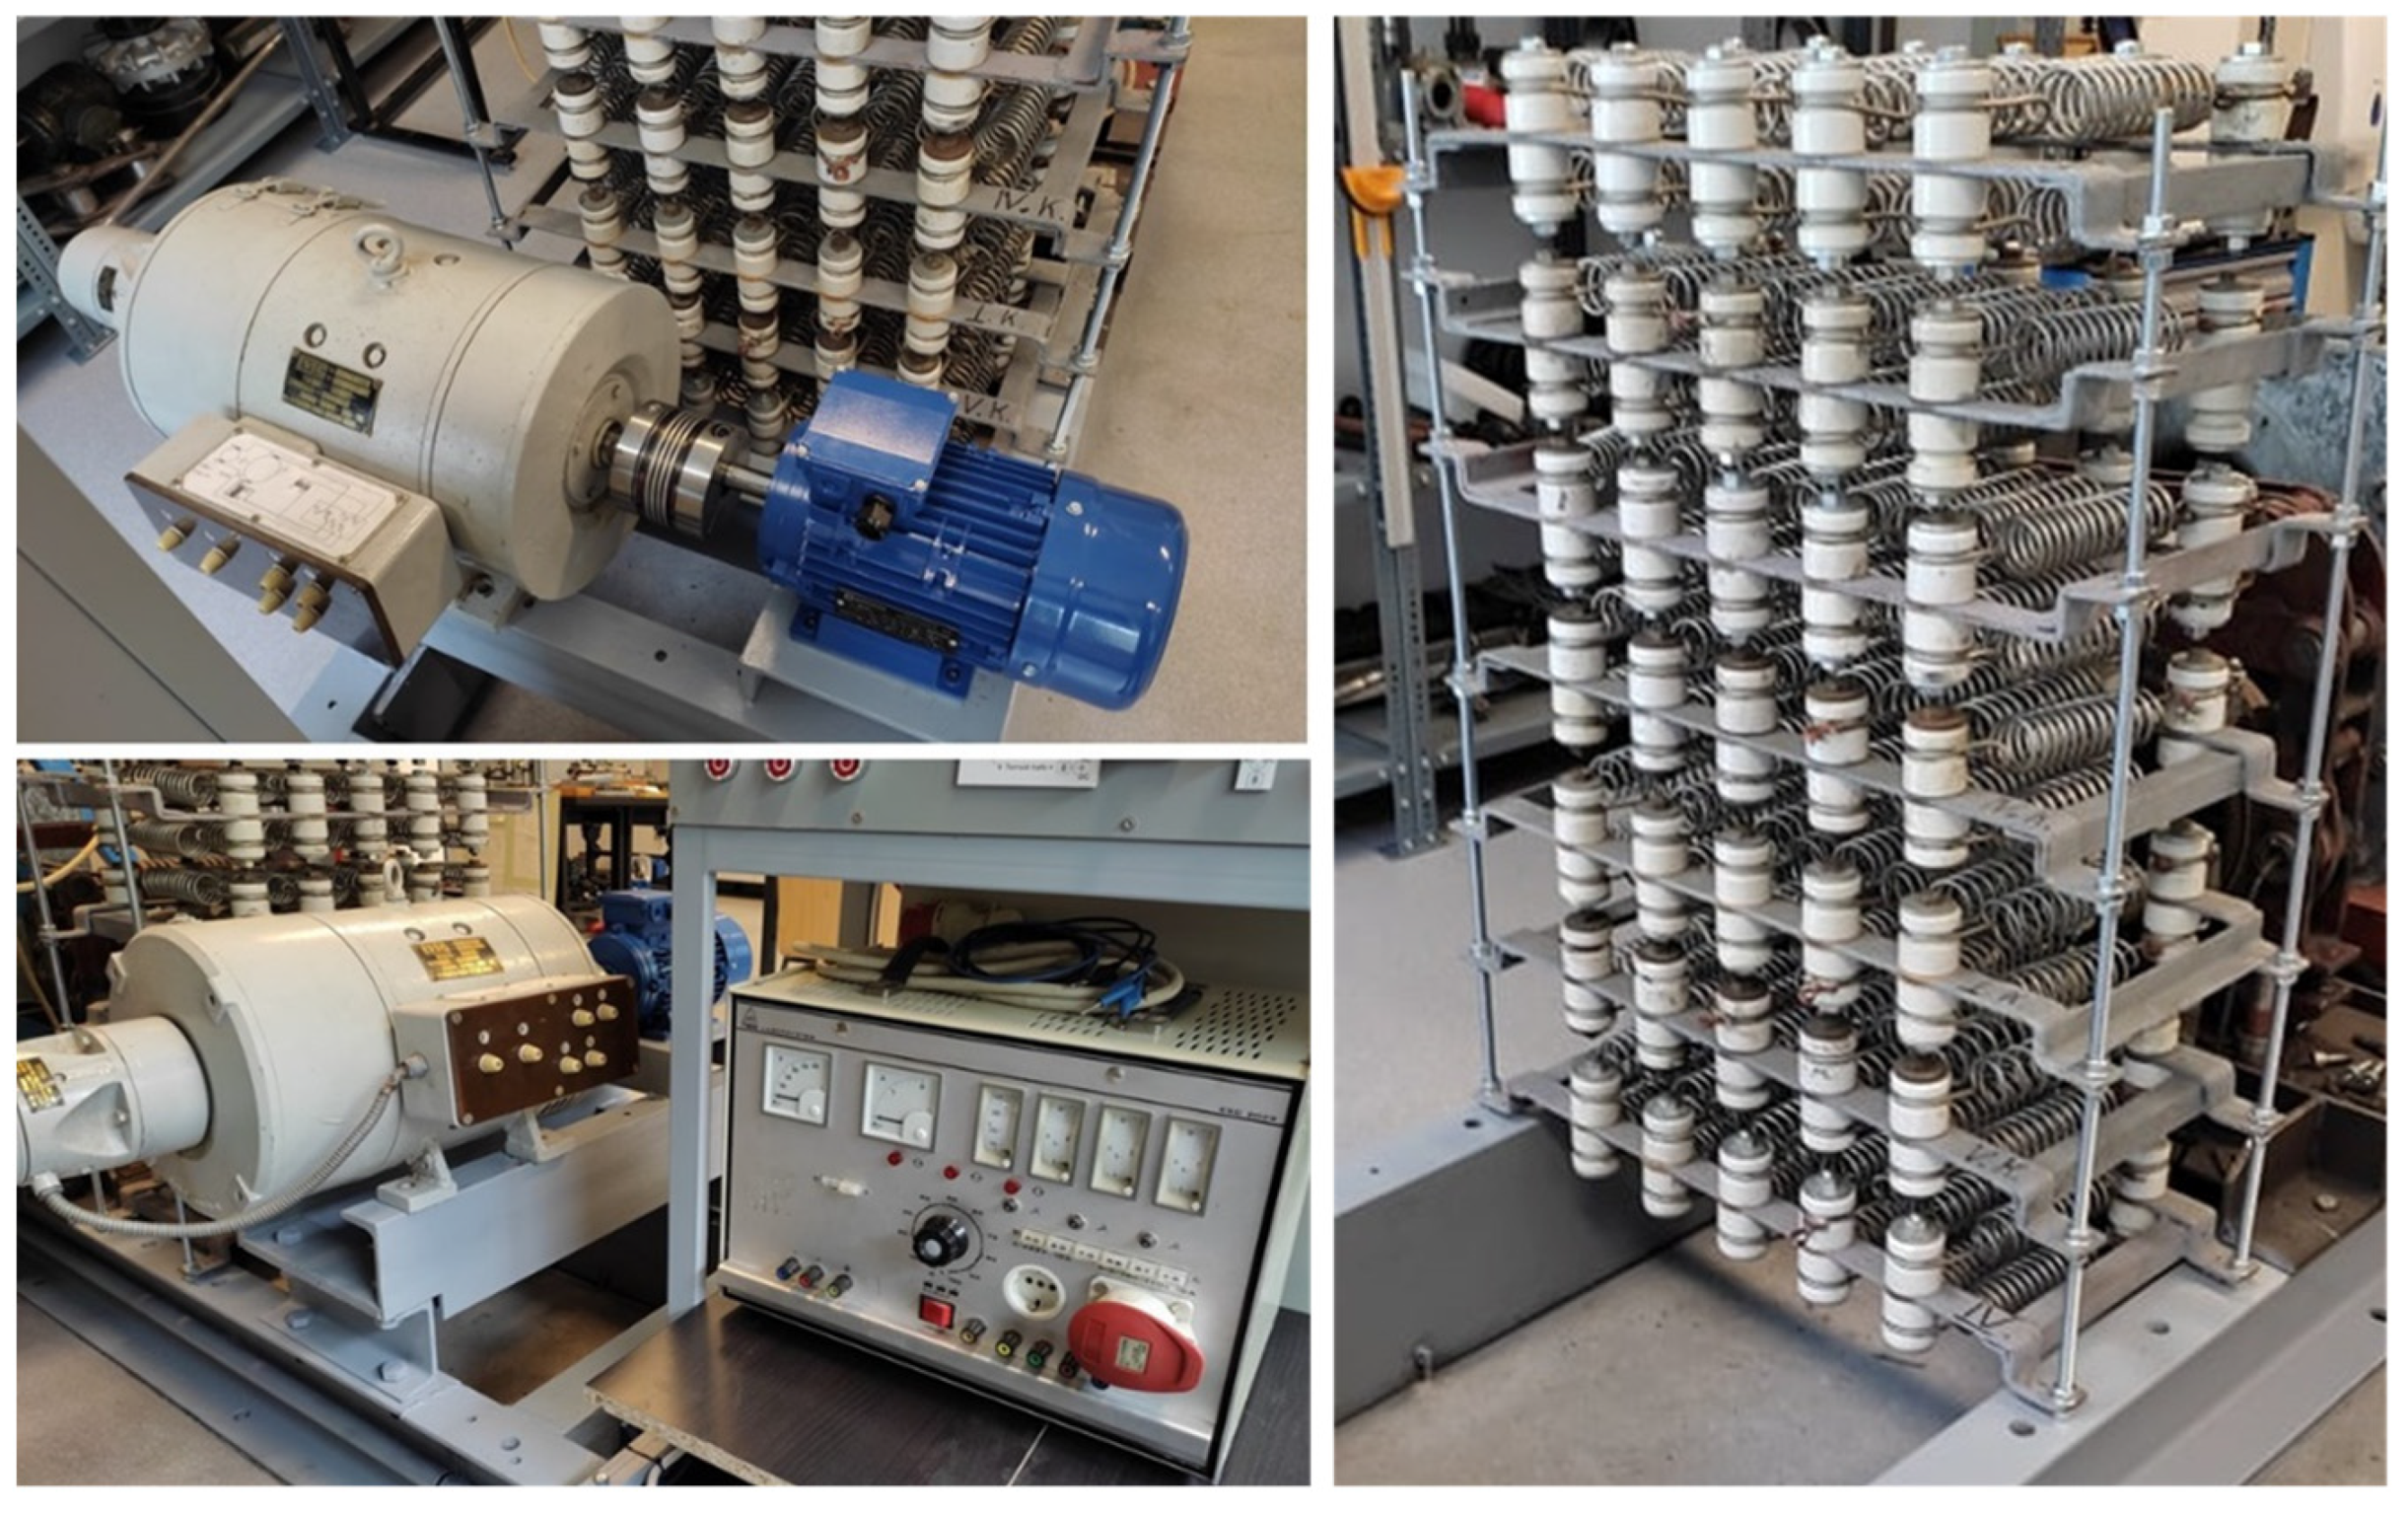
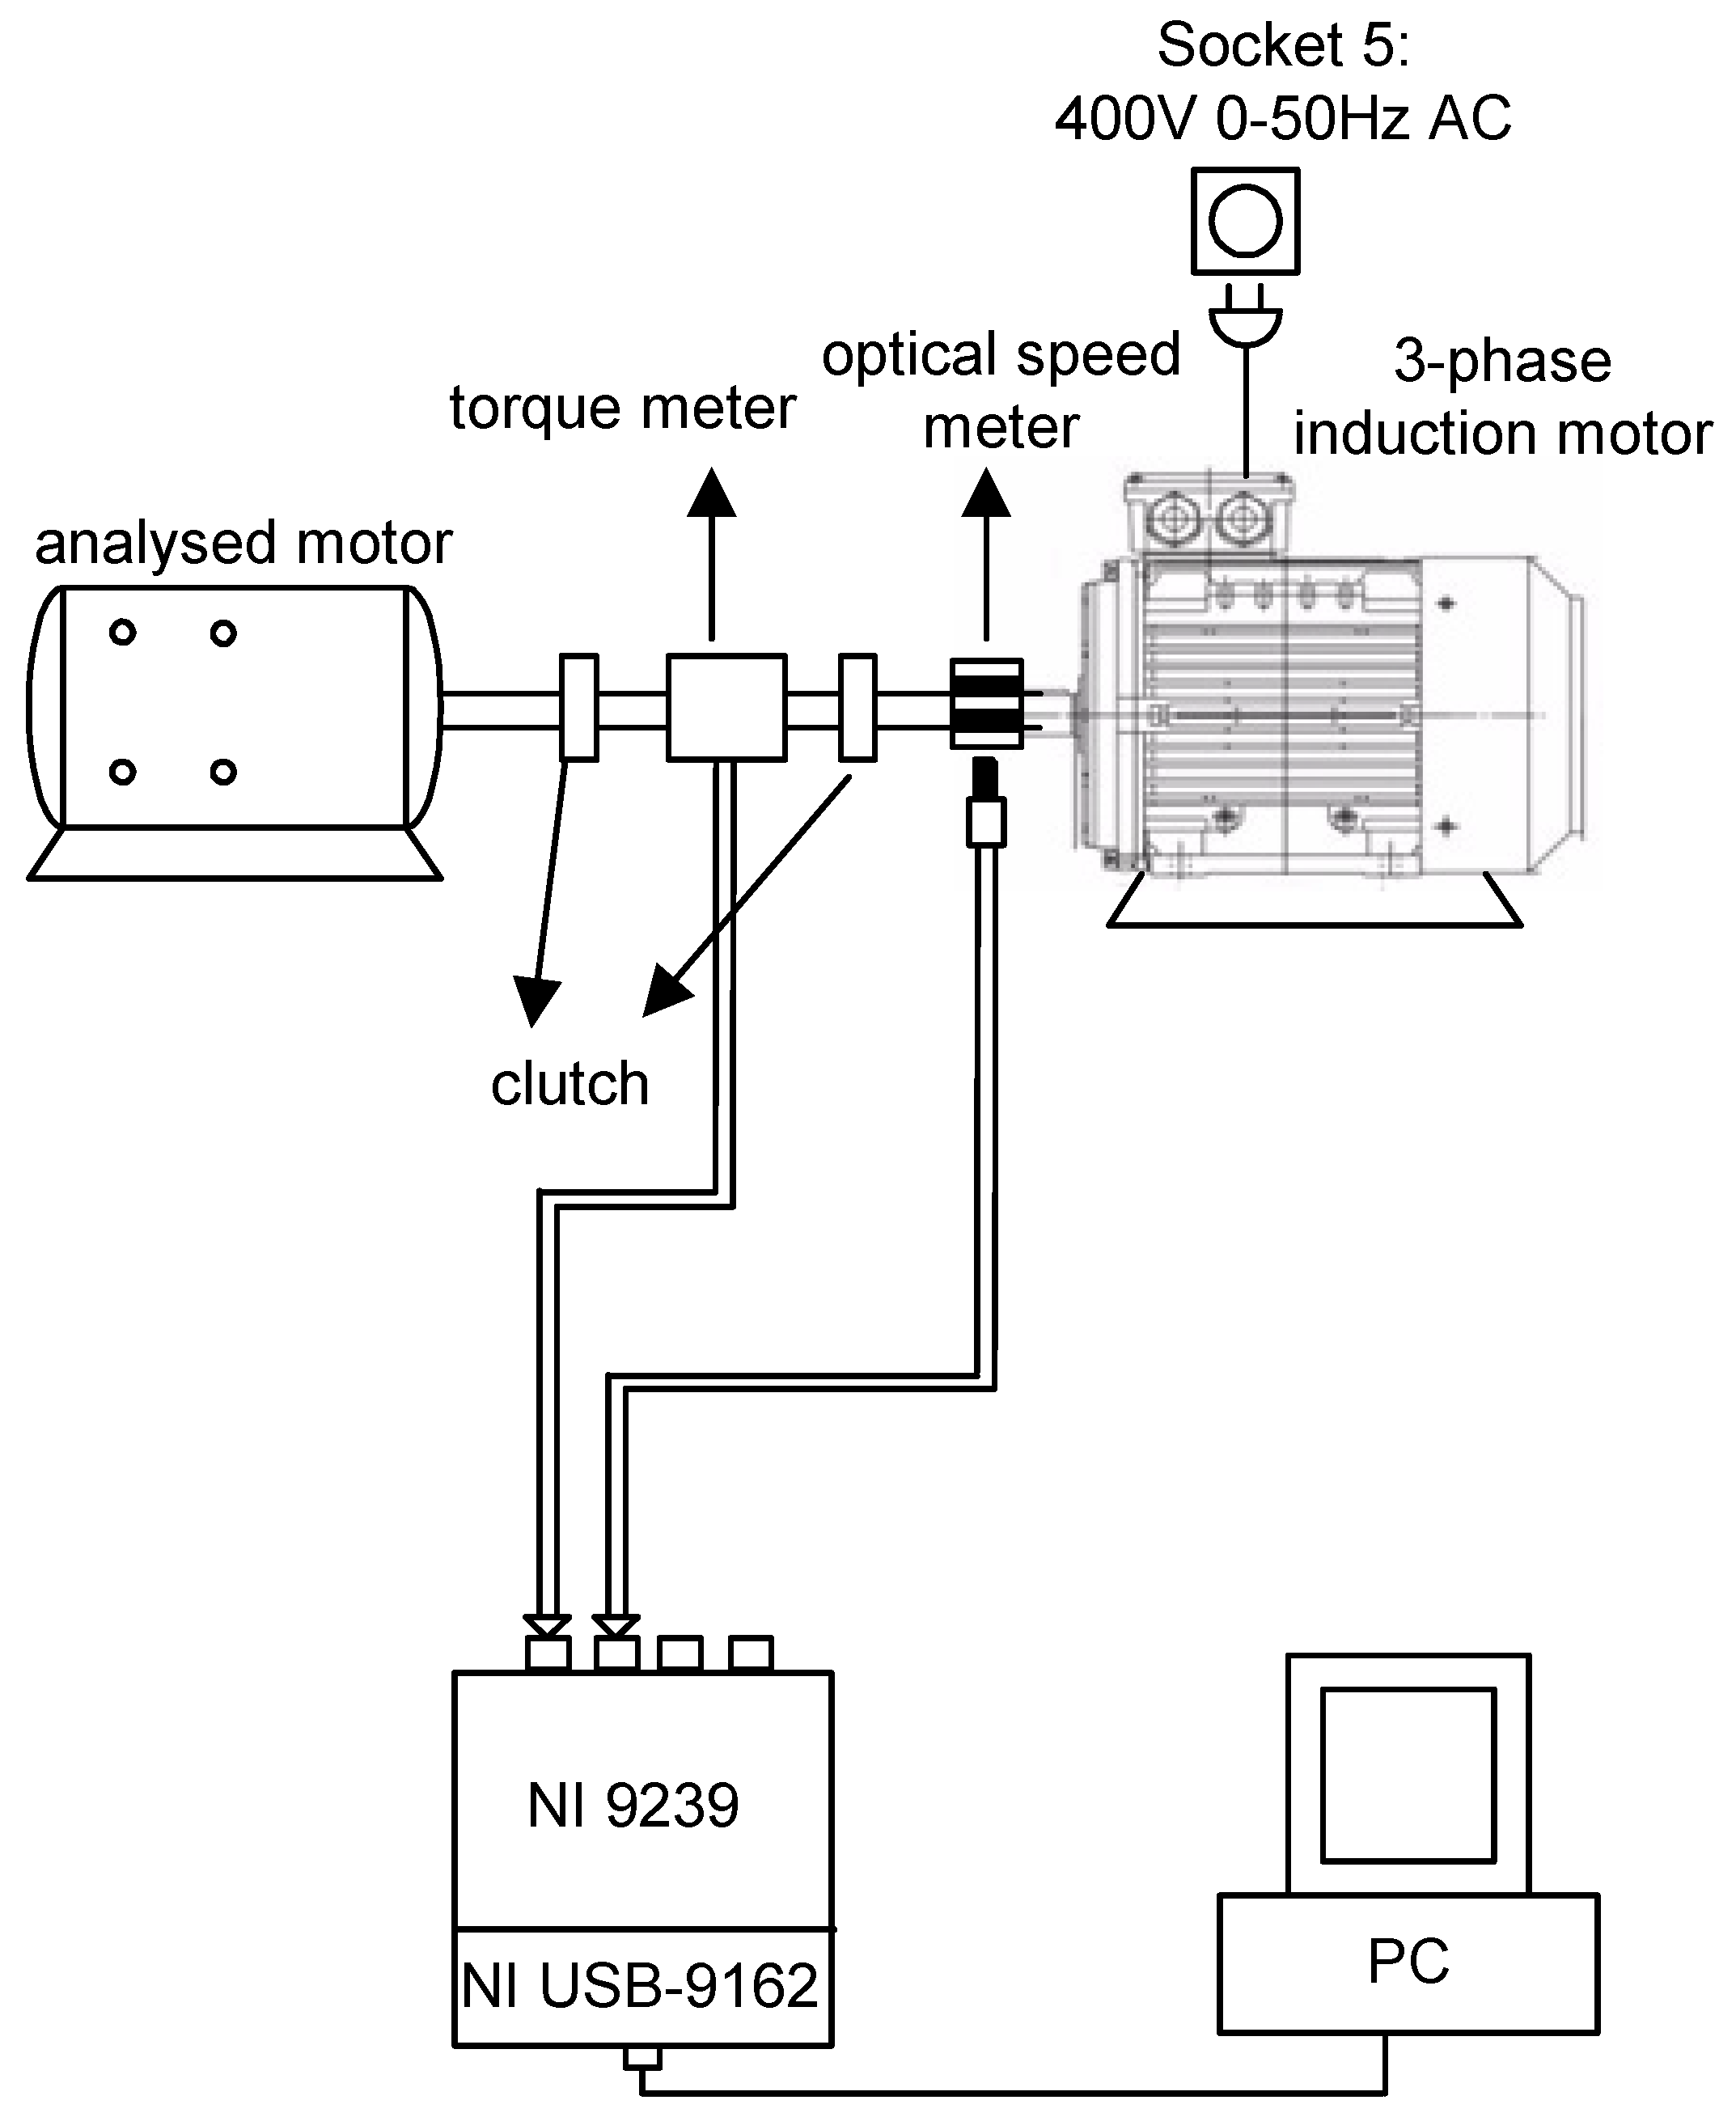
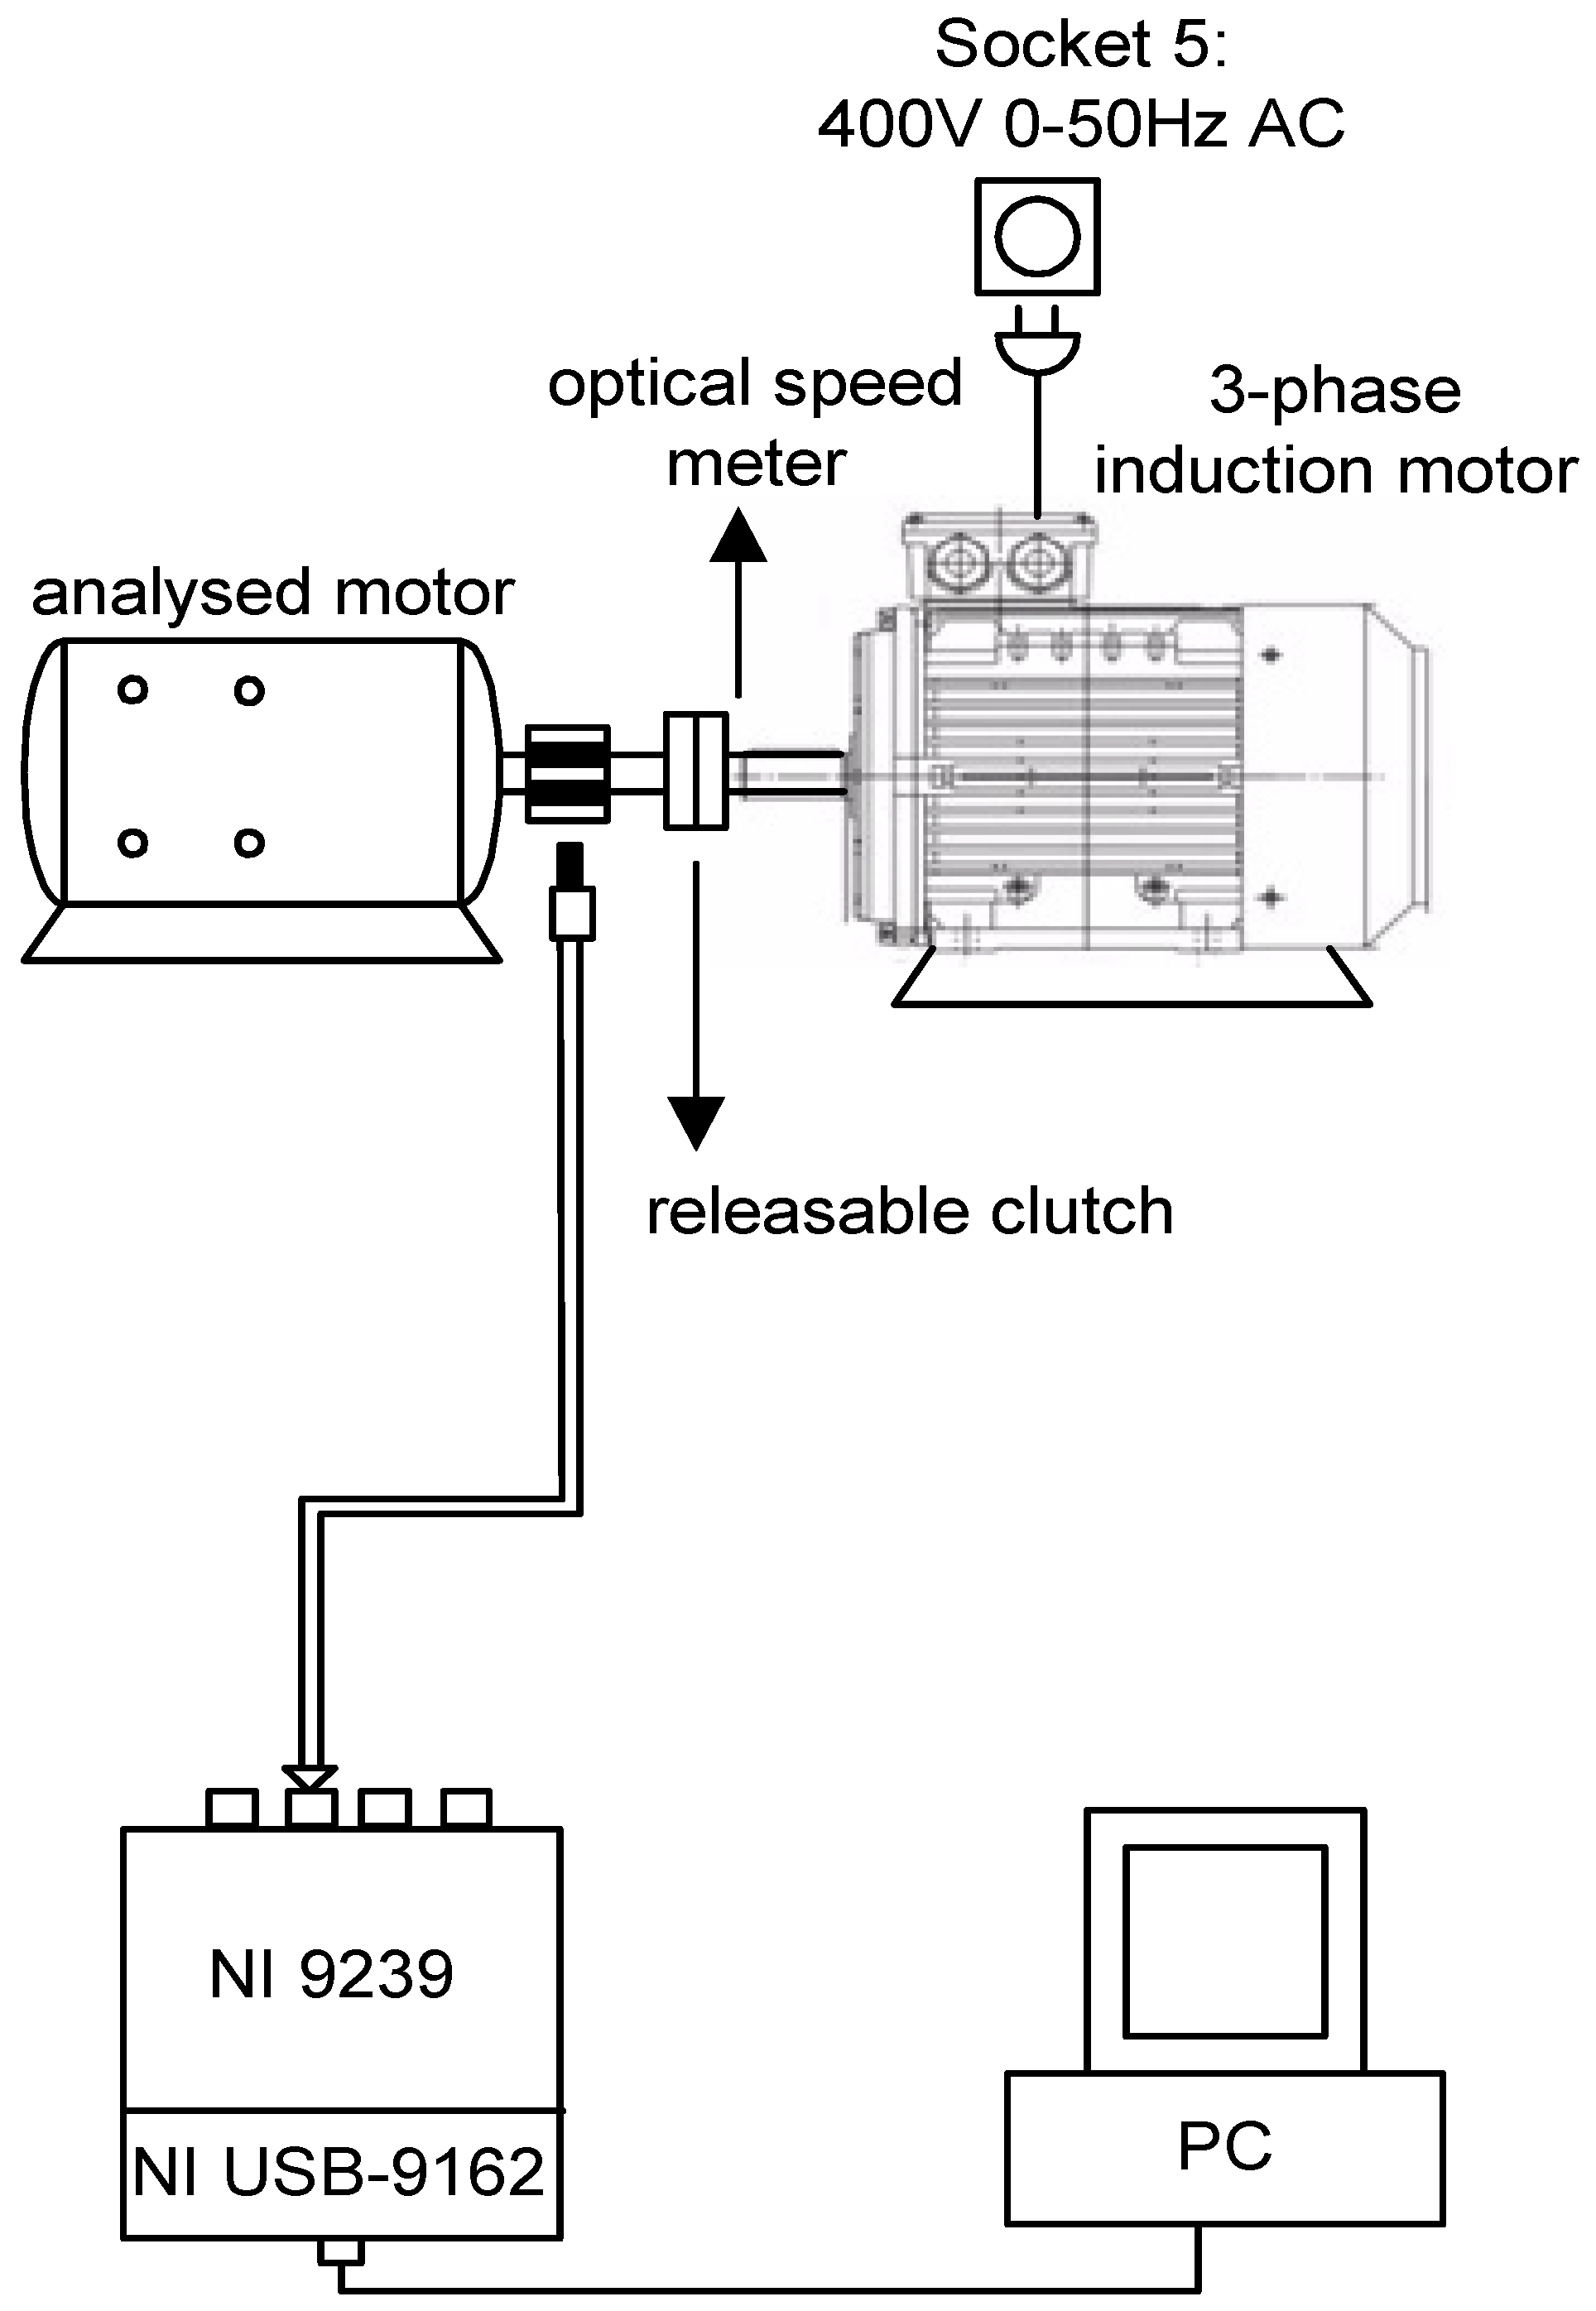
2.1. Motor Test Bench
2.1.1. The Bench, the Analyzed and Load/Drive Motor
- (1)
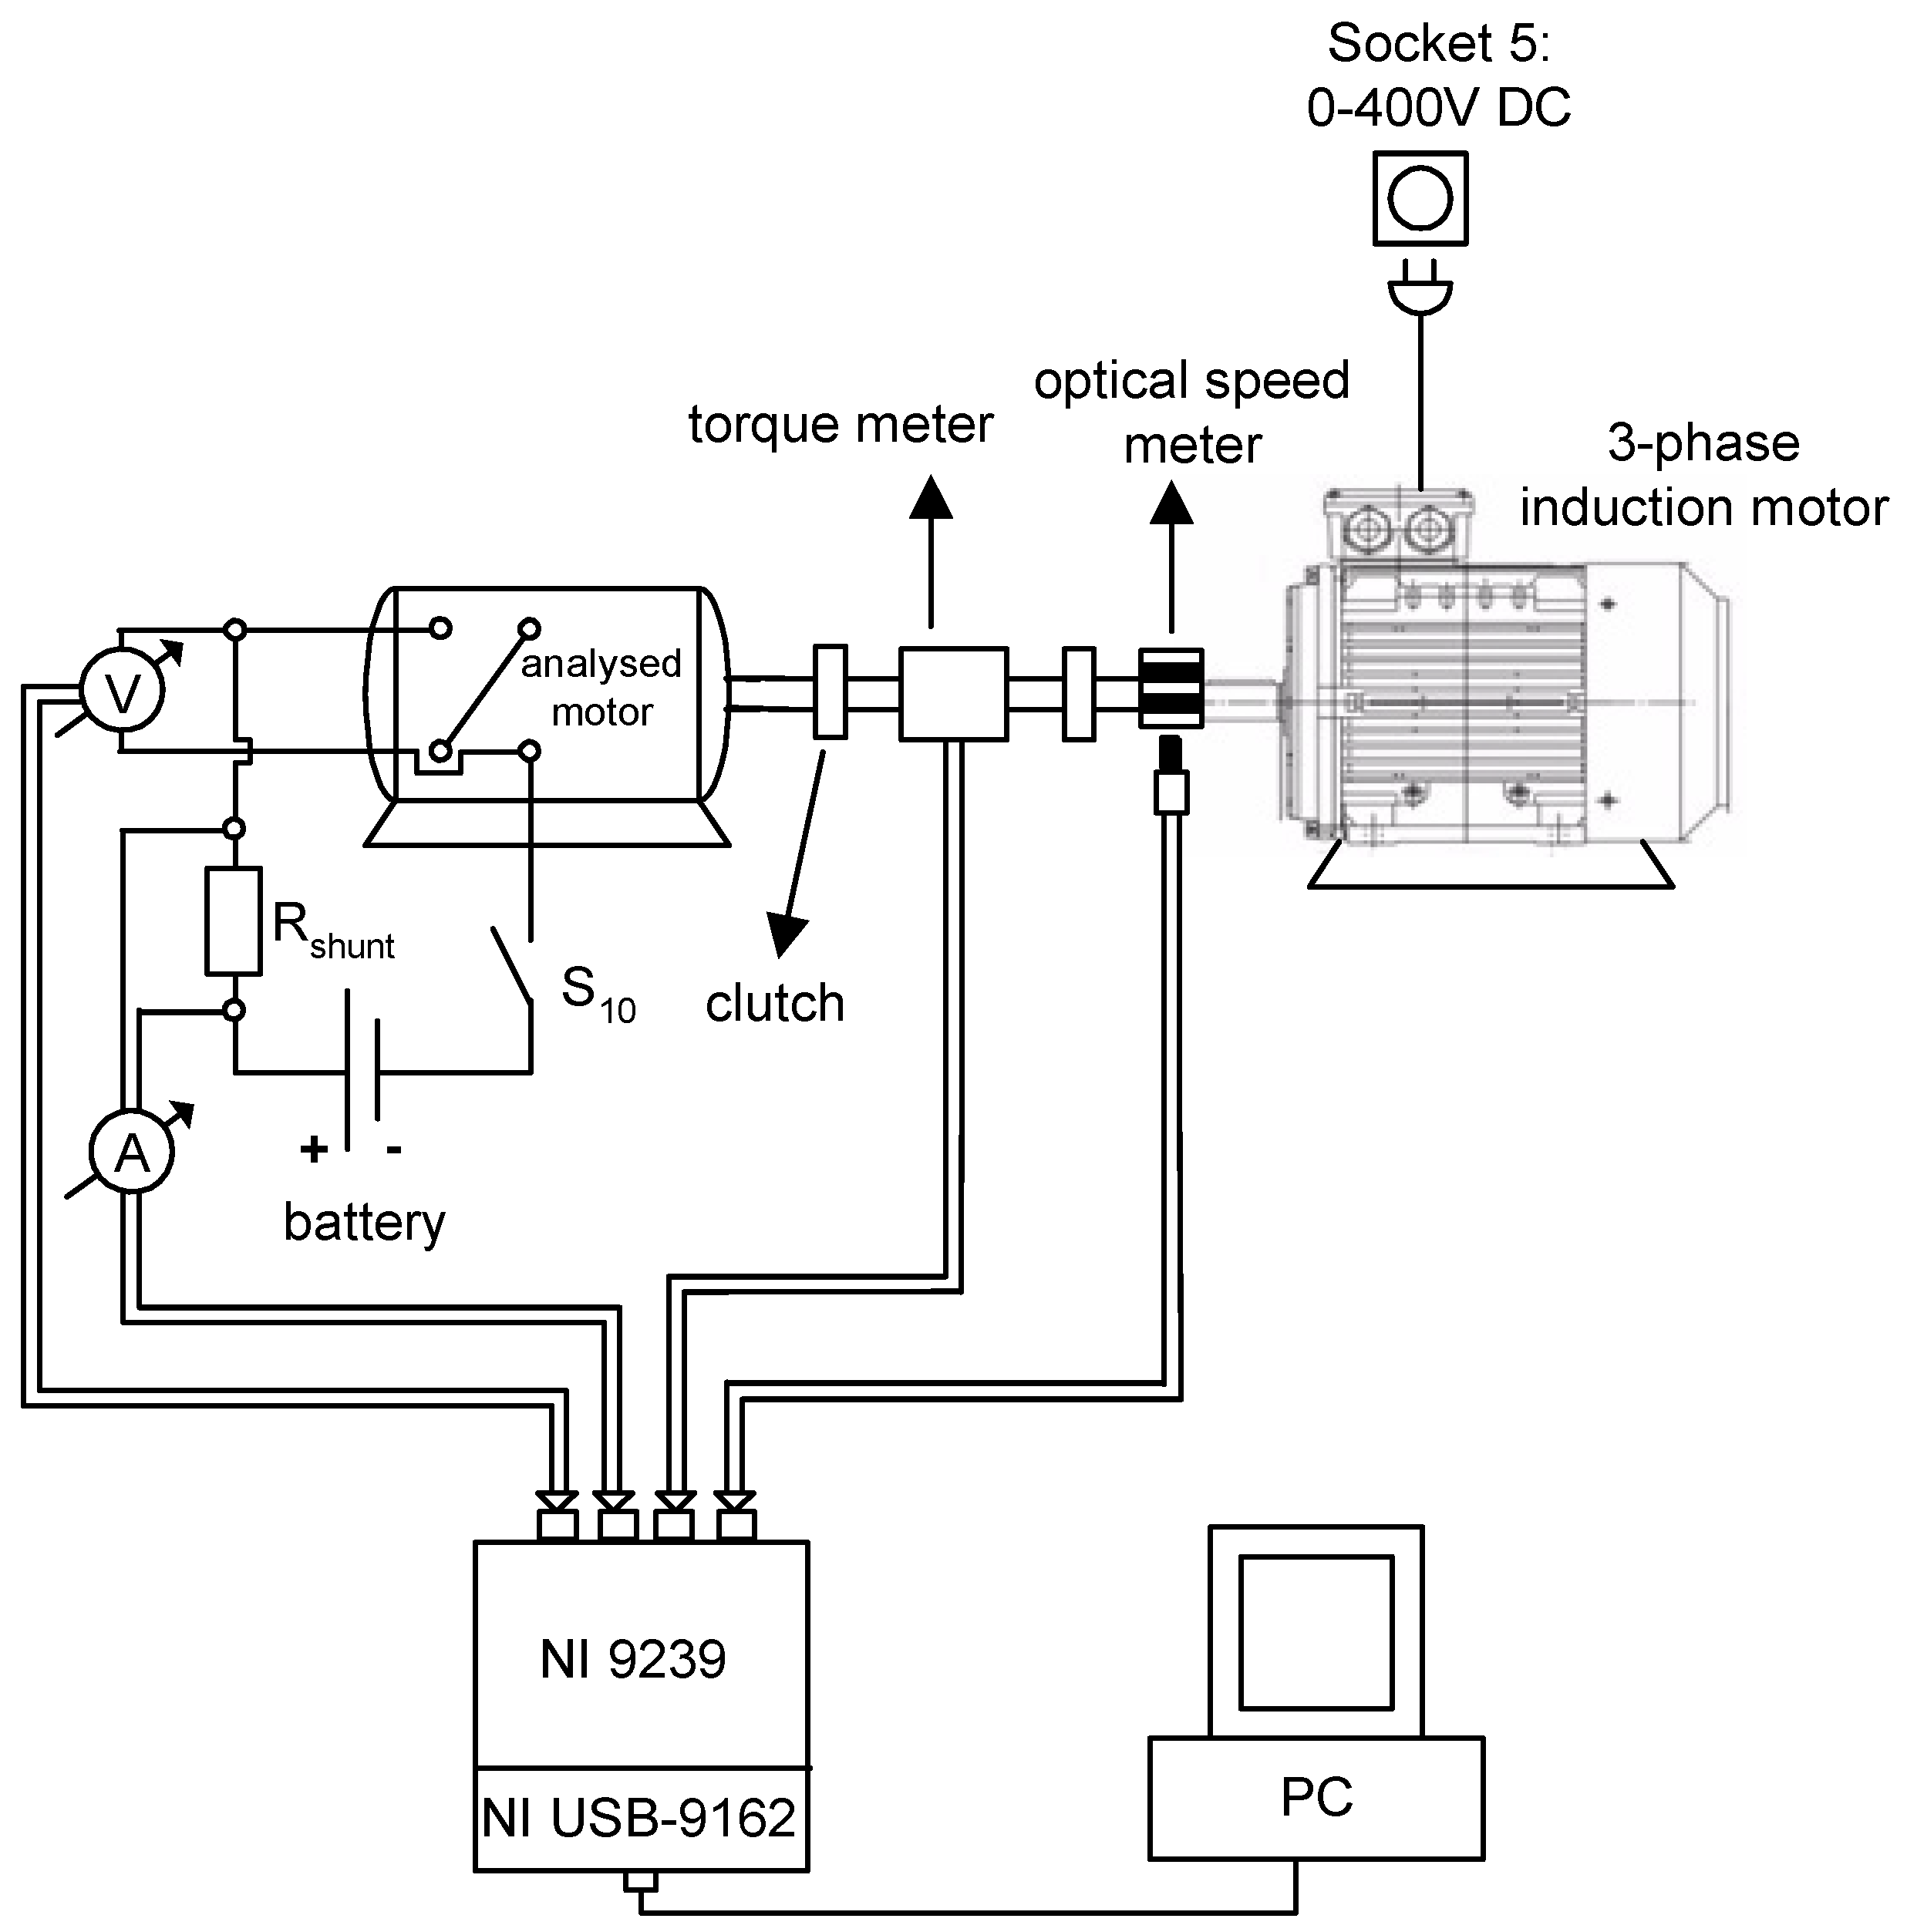
- It can be supplied by a variable DC voltage (0–400 V) and used as a “load motor” for braking the analyzed motor.
- (2)
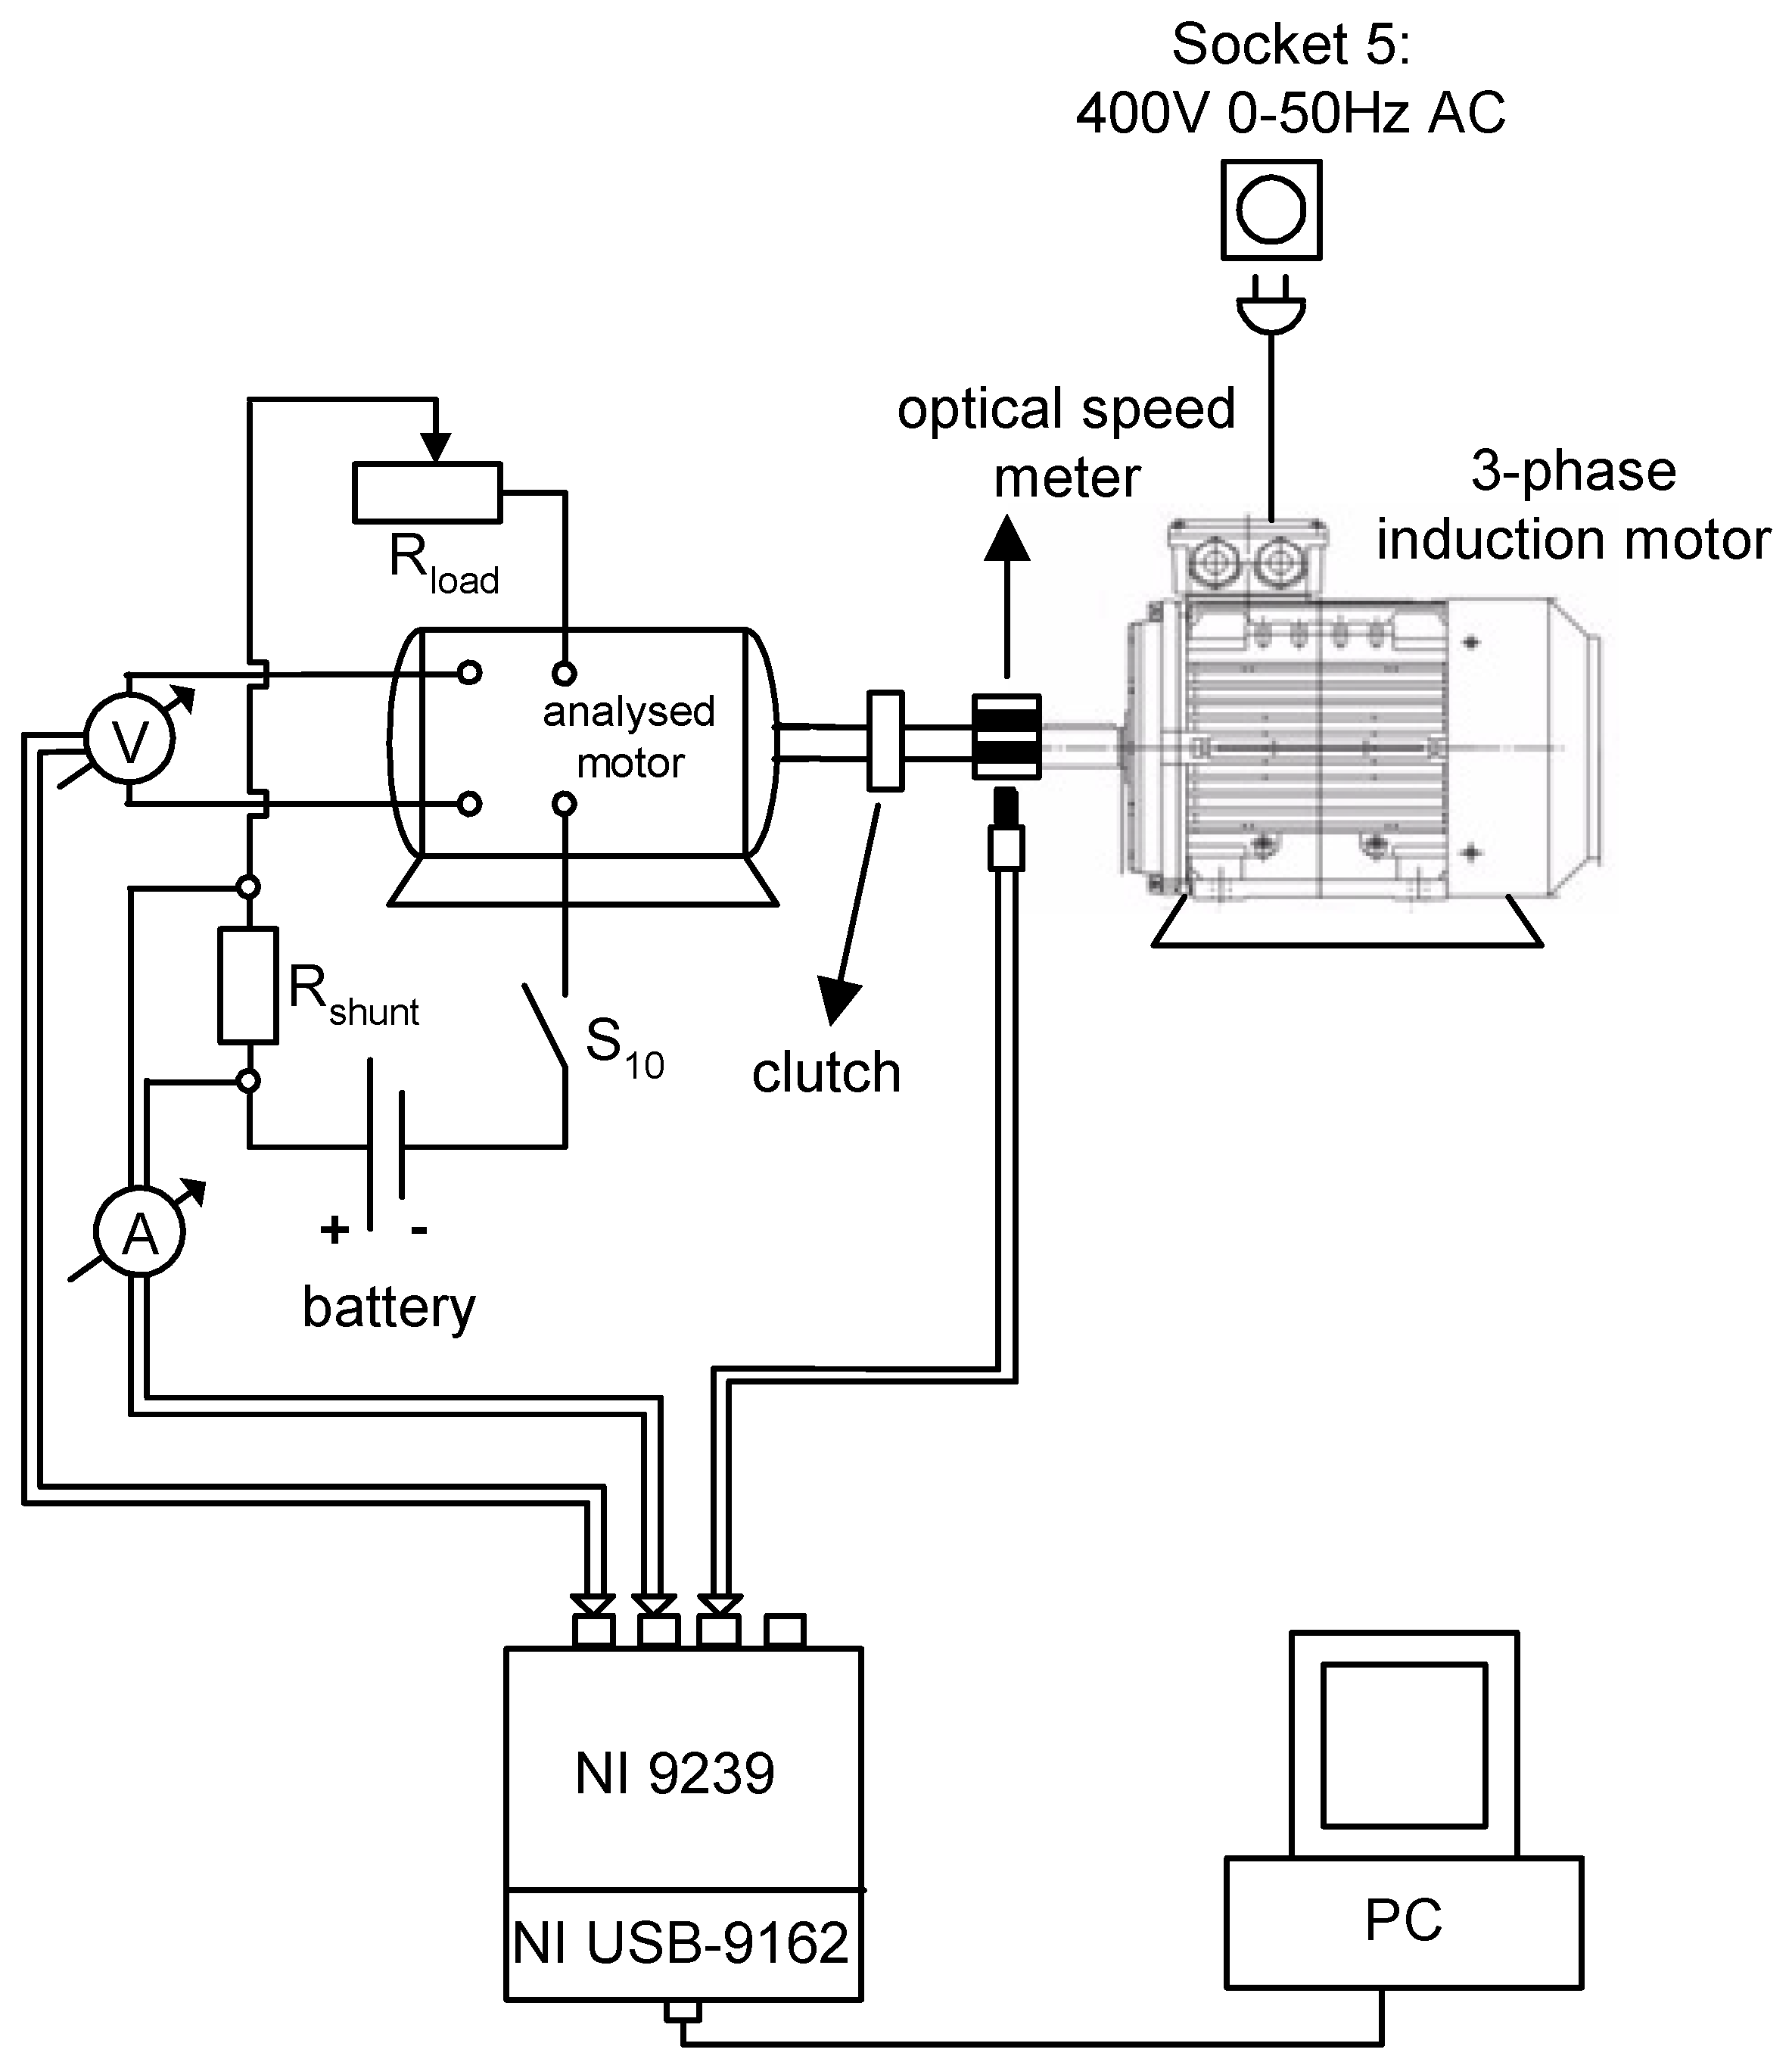
- It can be supplied by a three-phase AC voltage with a variable voltage (0–400V) or frequency (0–50 Hz) and can be used as a “drive motor” for driving the analyzed motor.
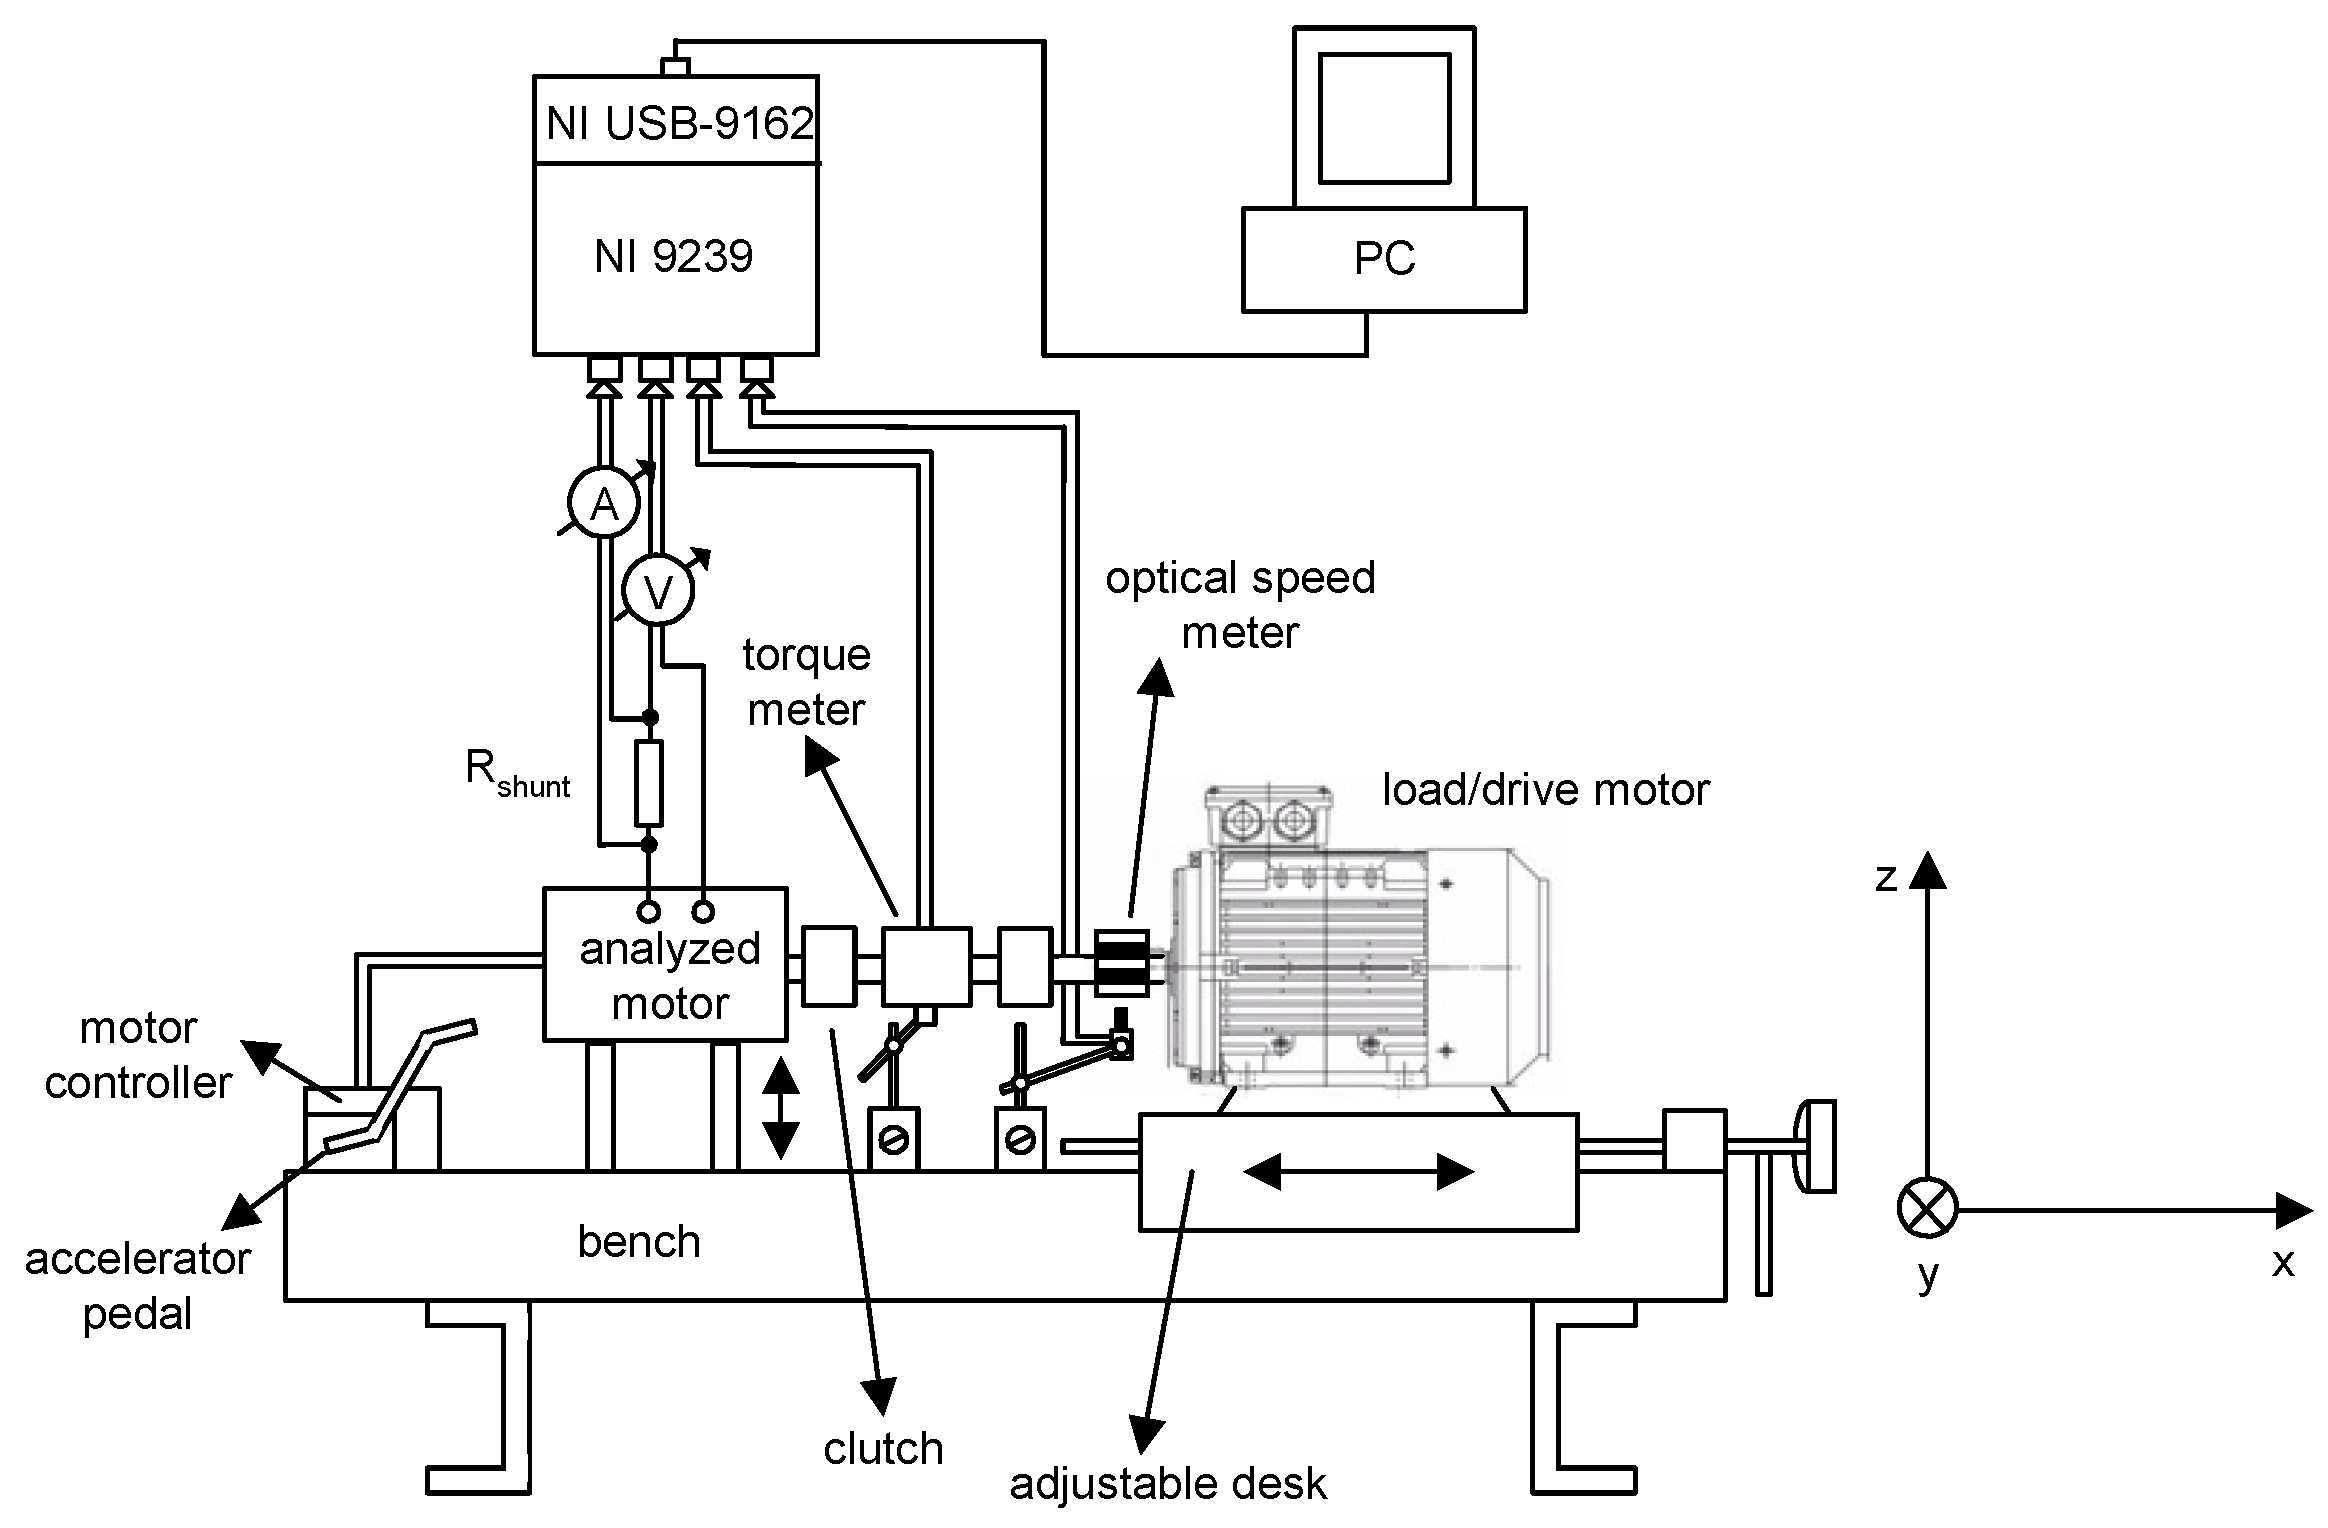
2.1.2. Data Acquisition System
- (1)
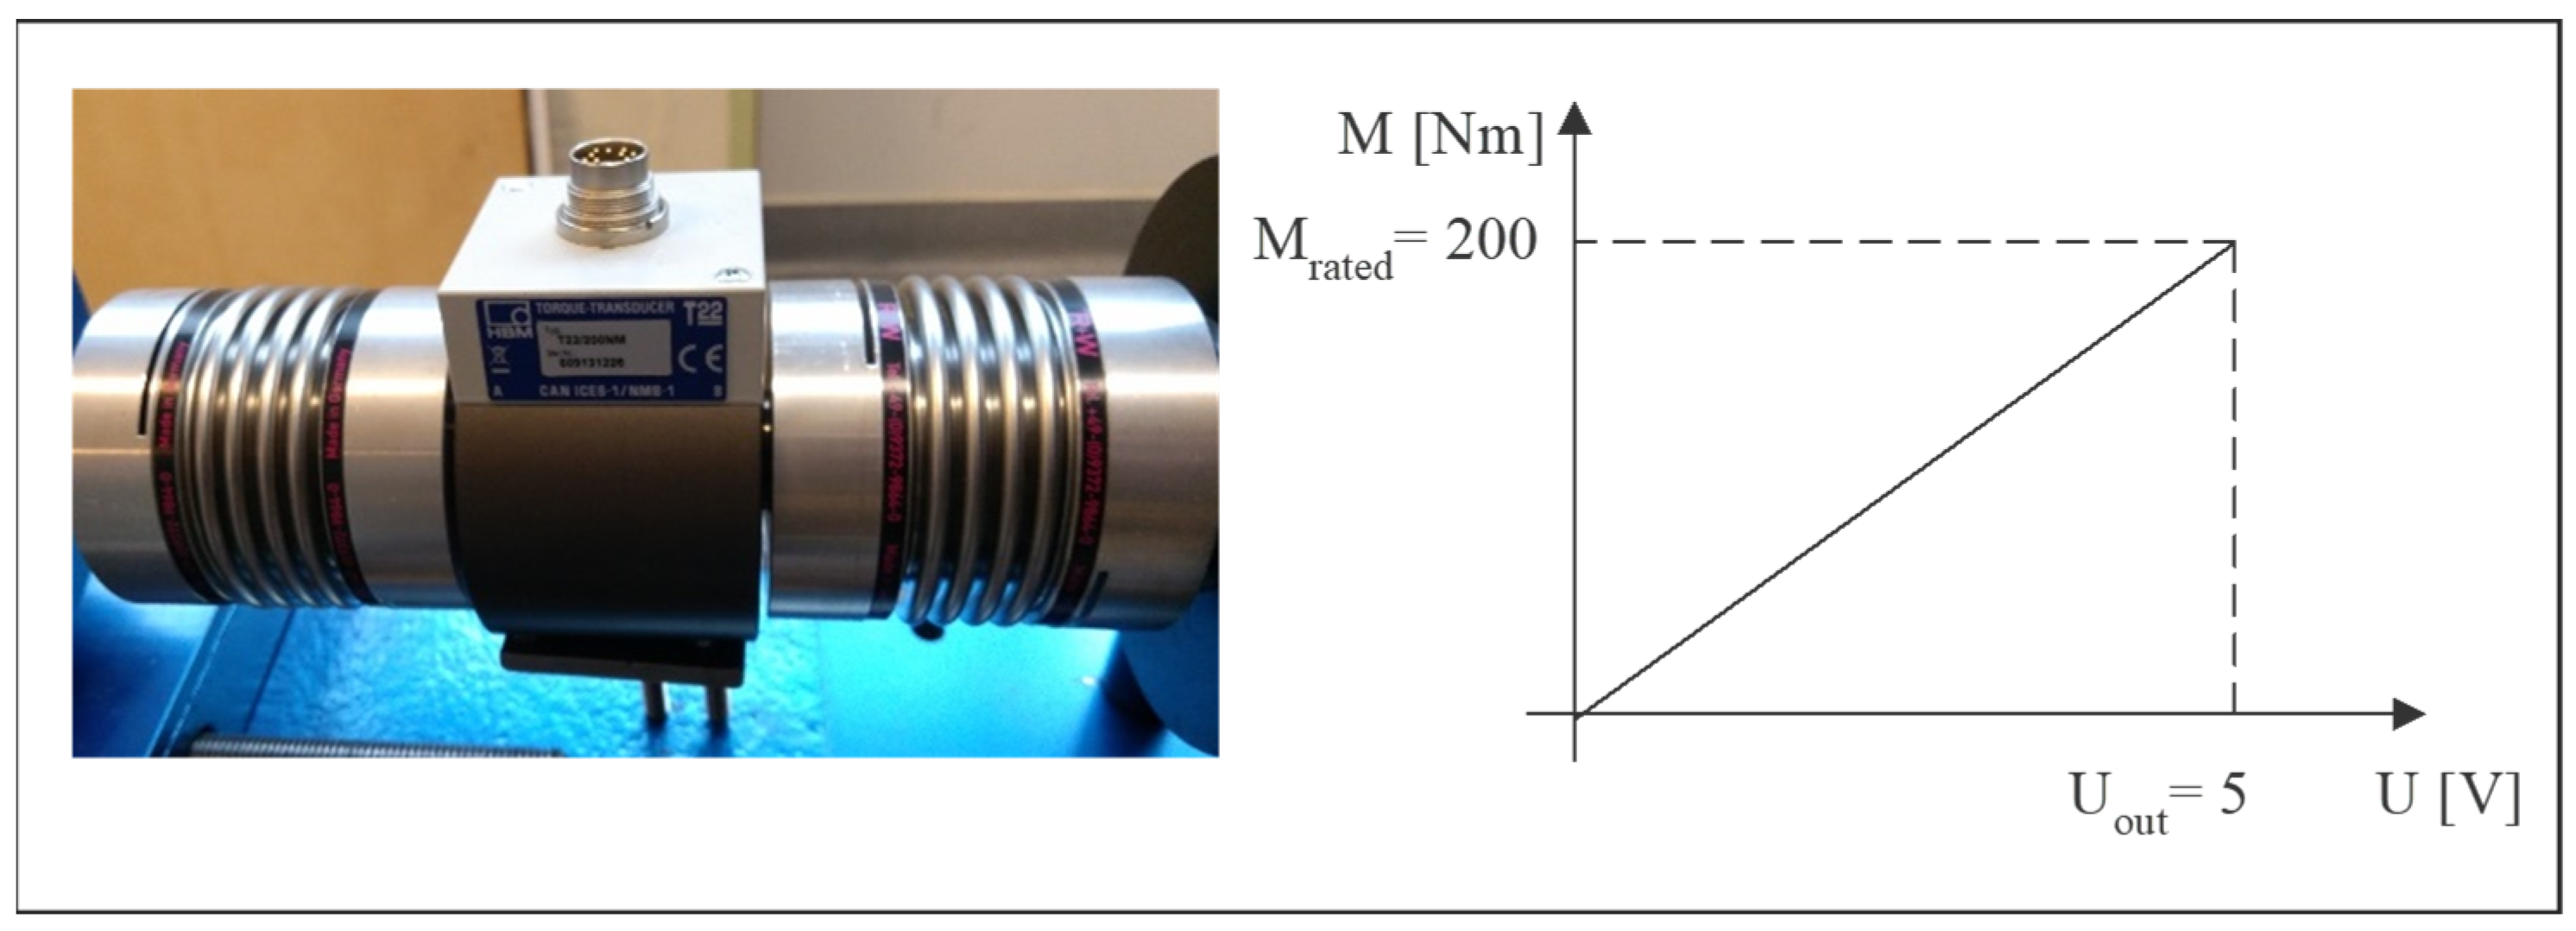
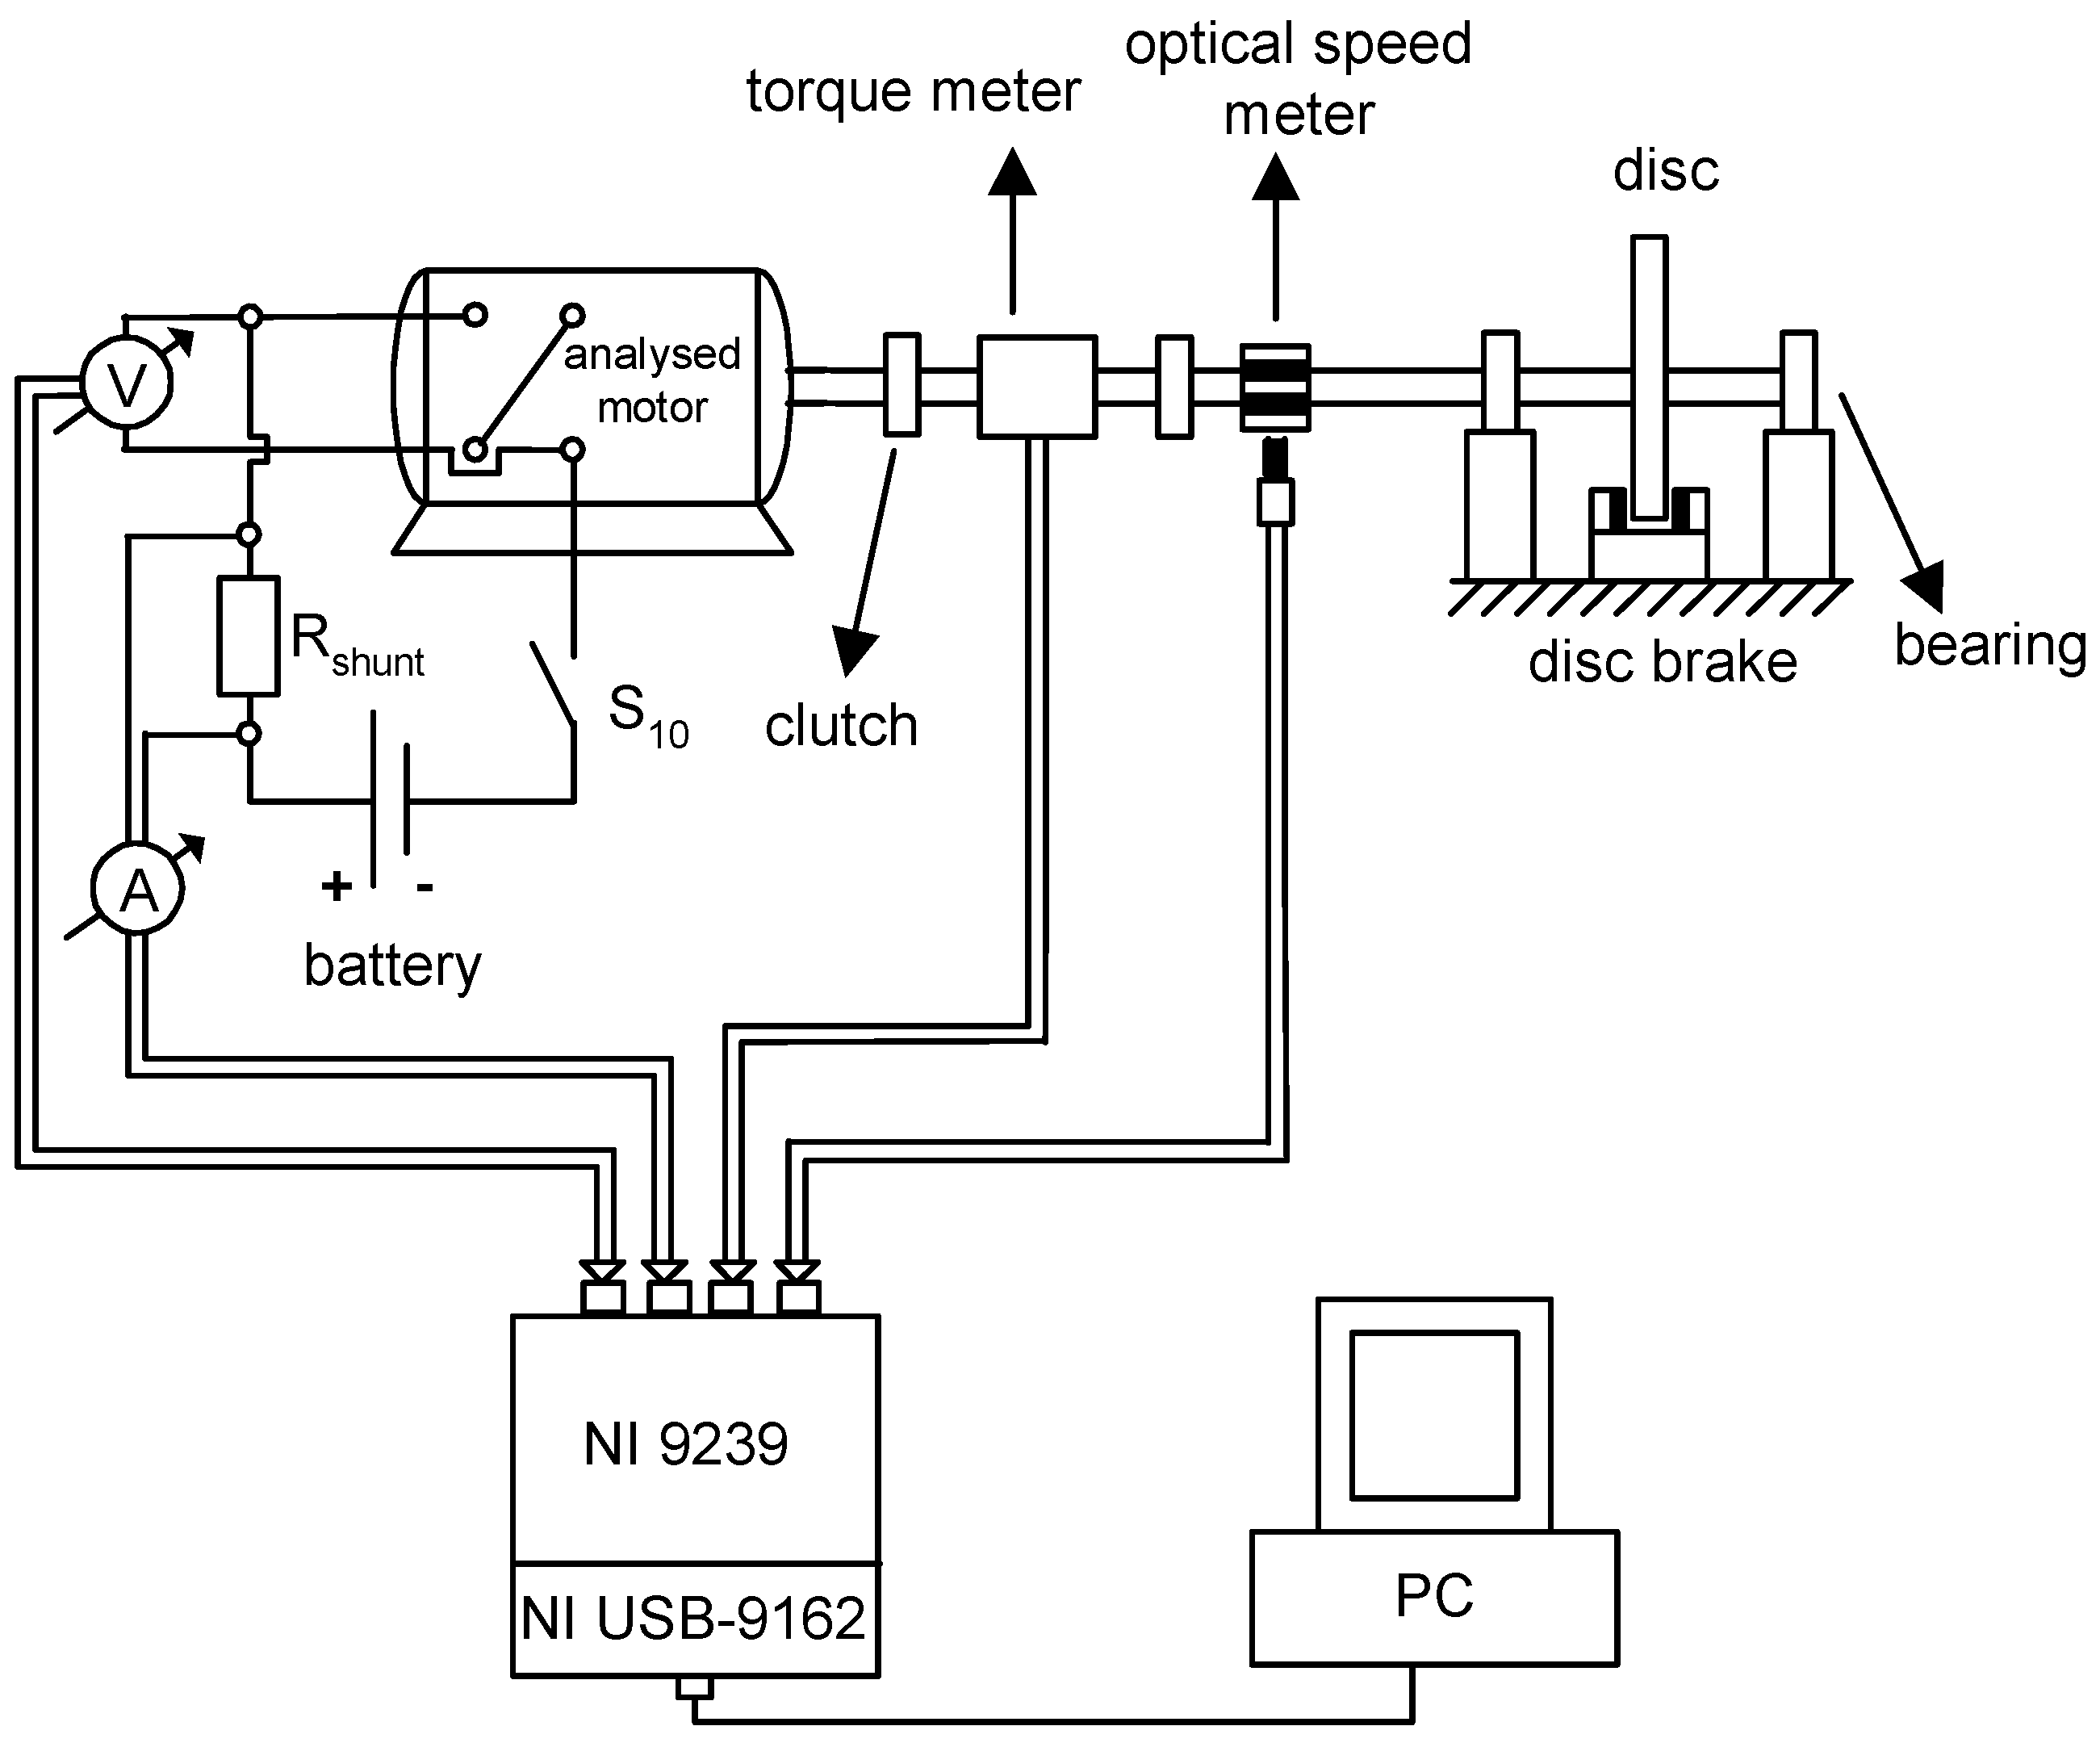
- Optical LED (ROS-P, Monarch Instrument) and rotary torque (HBM T22/200) sensors for angular speed and torque measurement.
- (2)
- Shunt resistor for the measurement of the intensity of the electric current flowing through the windings of the motor.
- (3)
- The voltage input module (NI 9239) and compact DAQ chassis (NI USB 9162) together with a PC.
- (4)
- Self-developed software component for data collection, processing and storing.
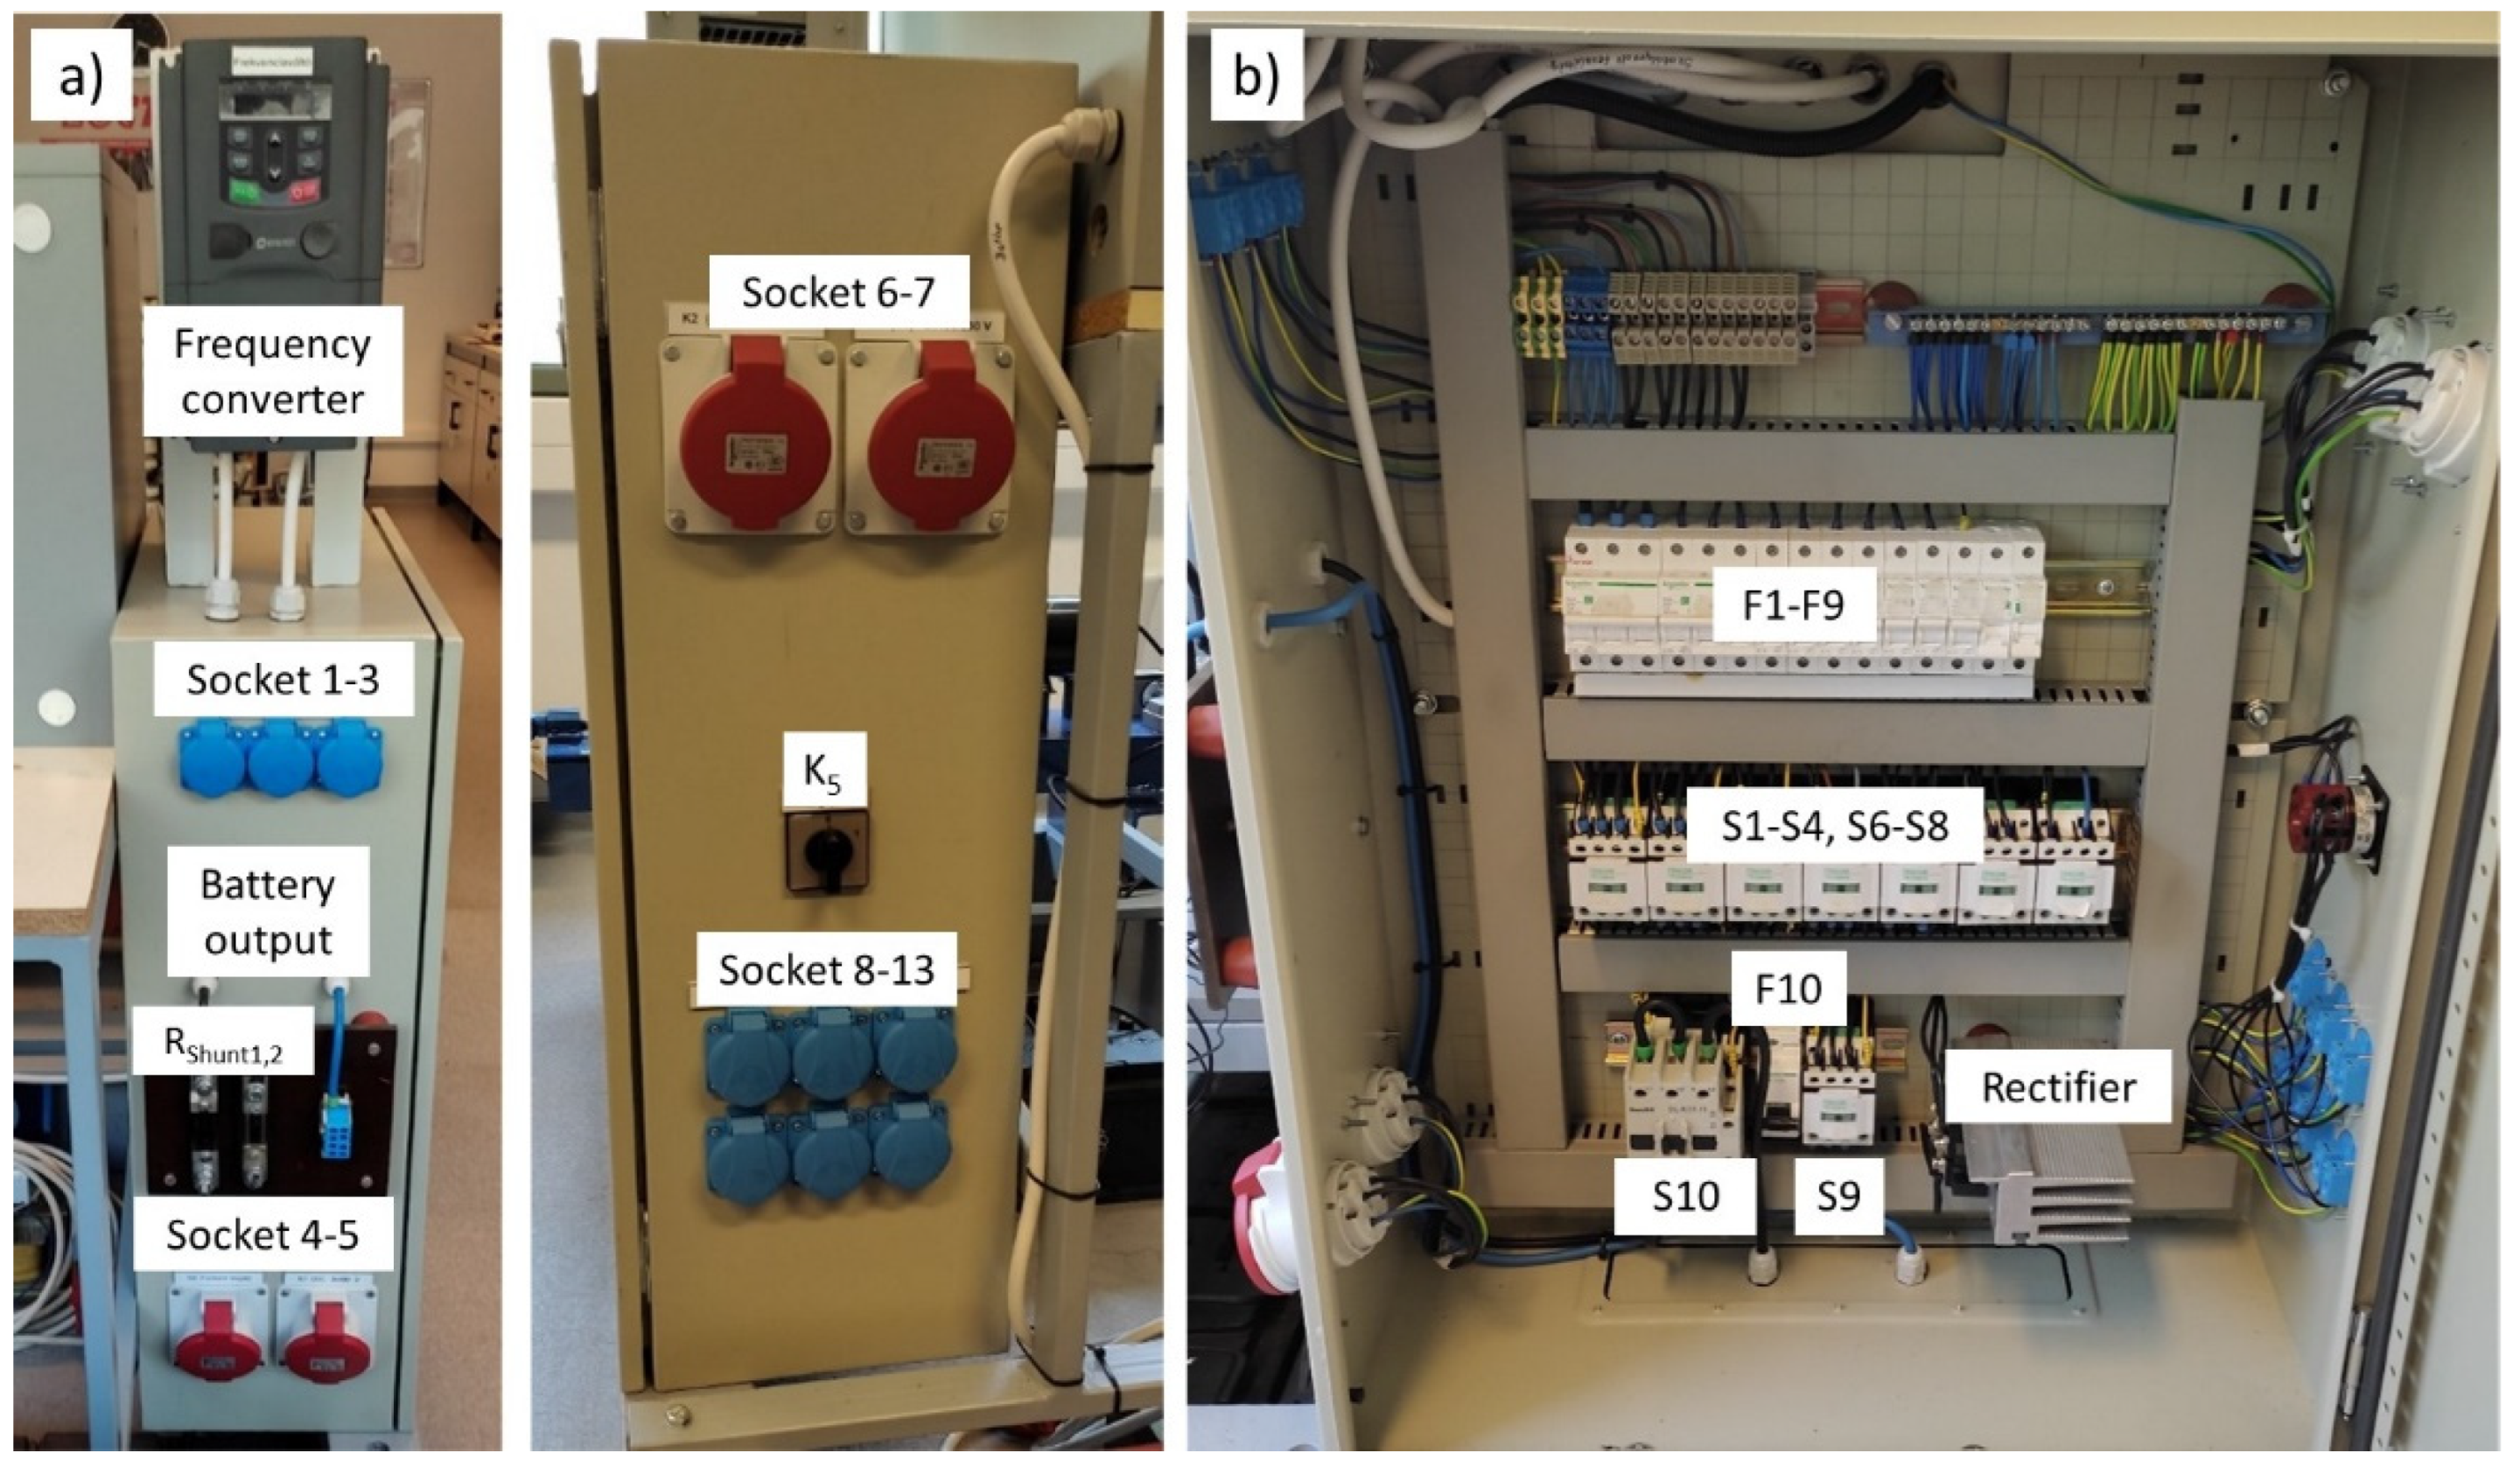
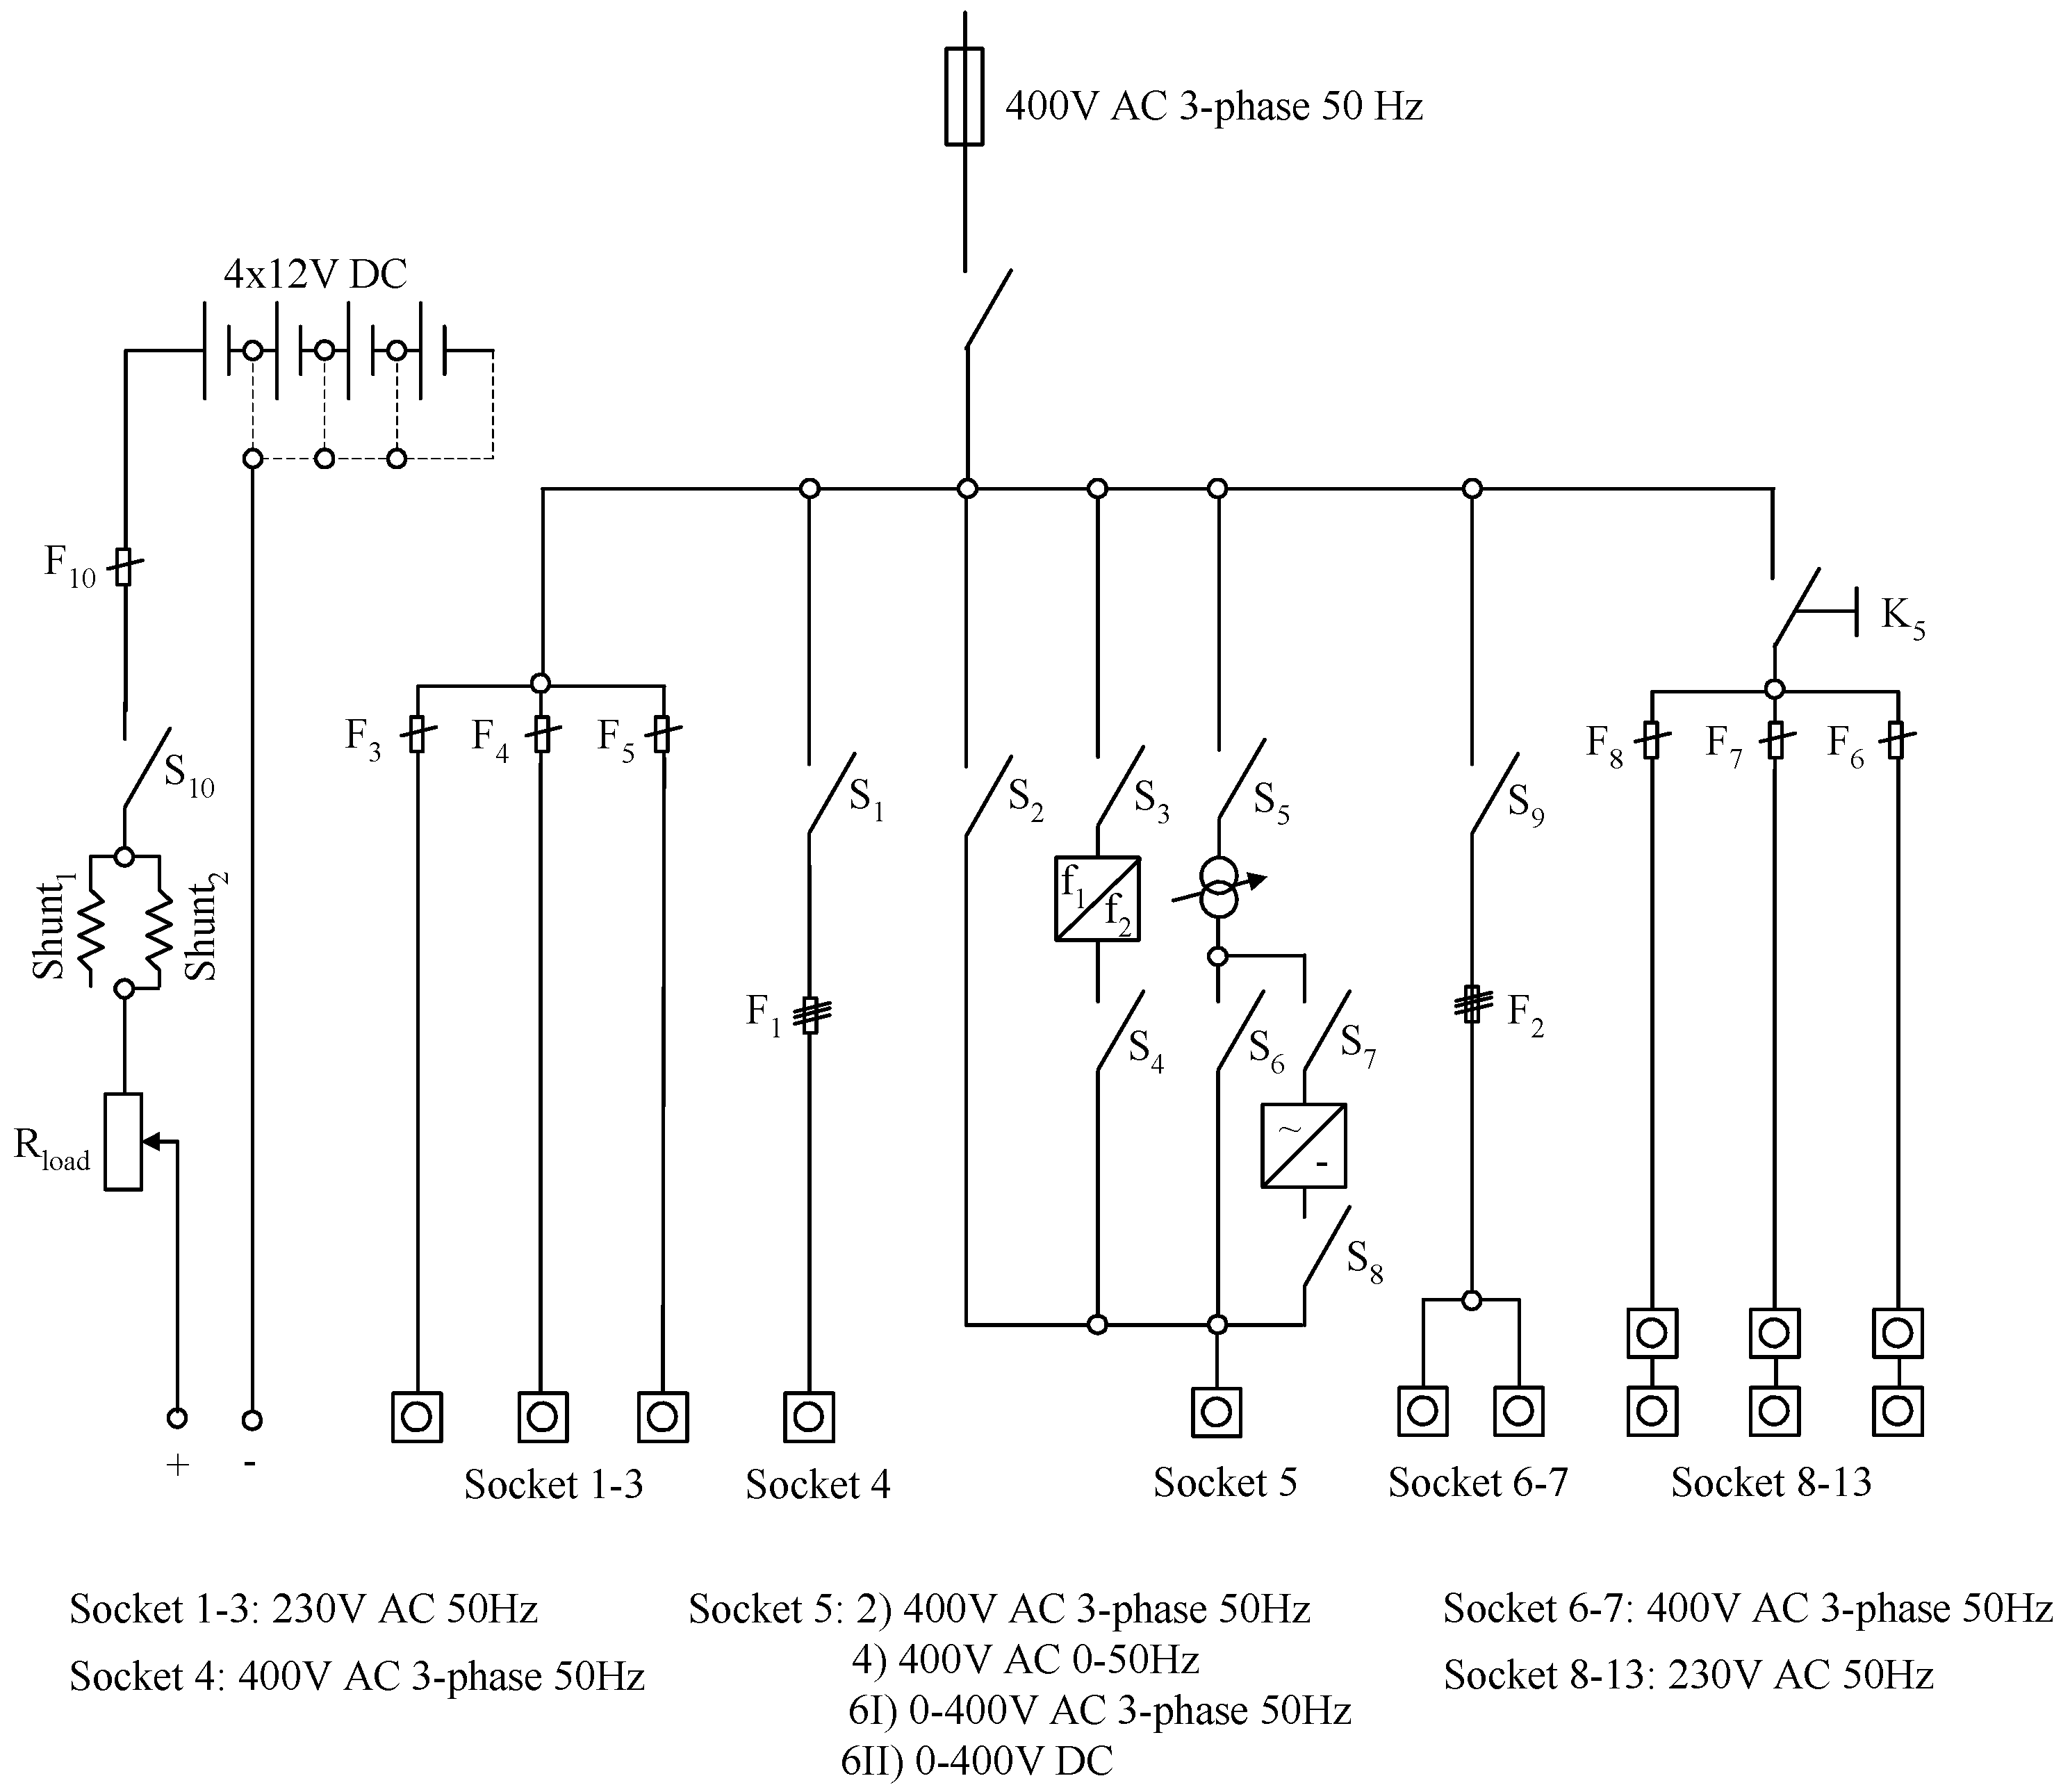
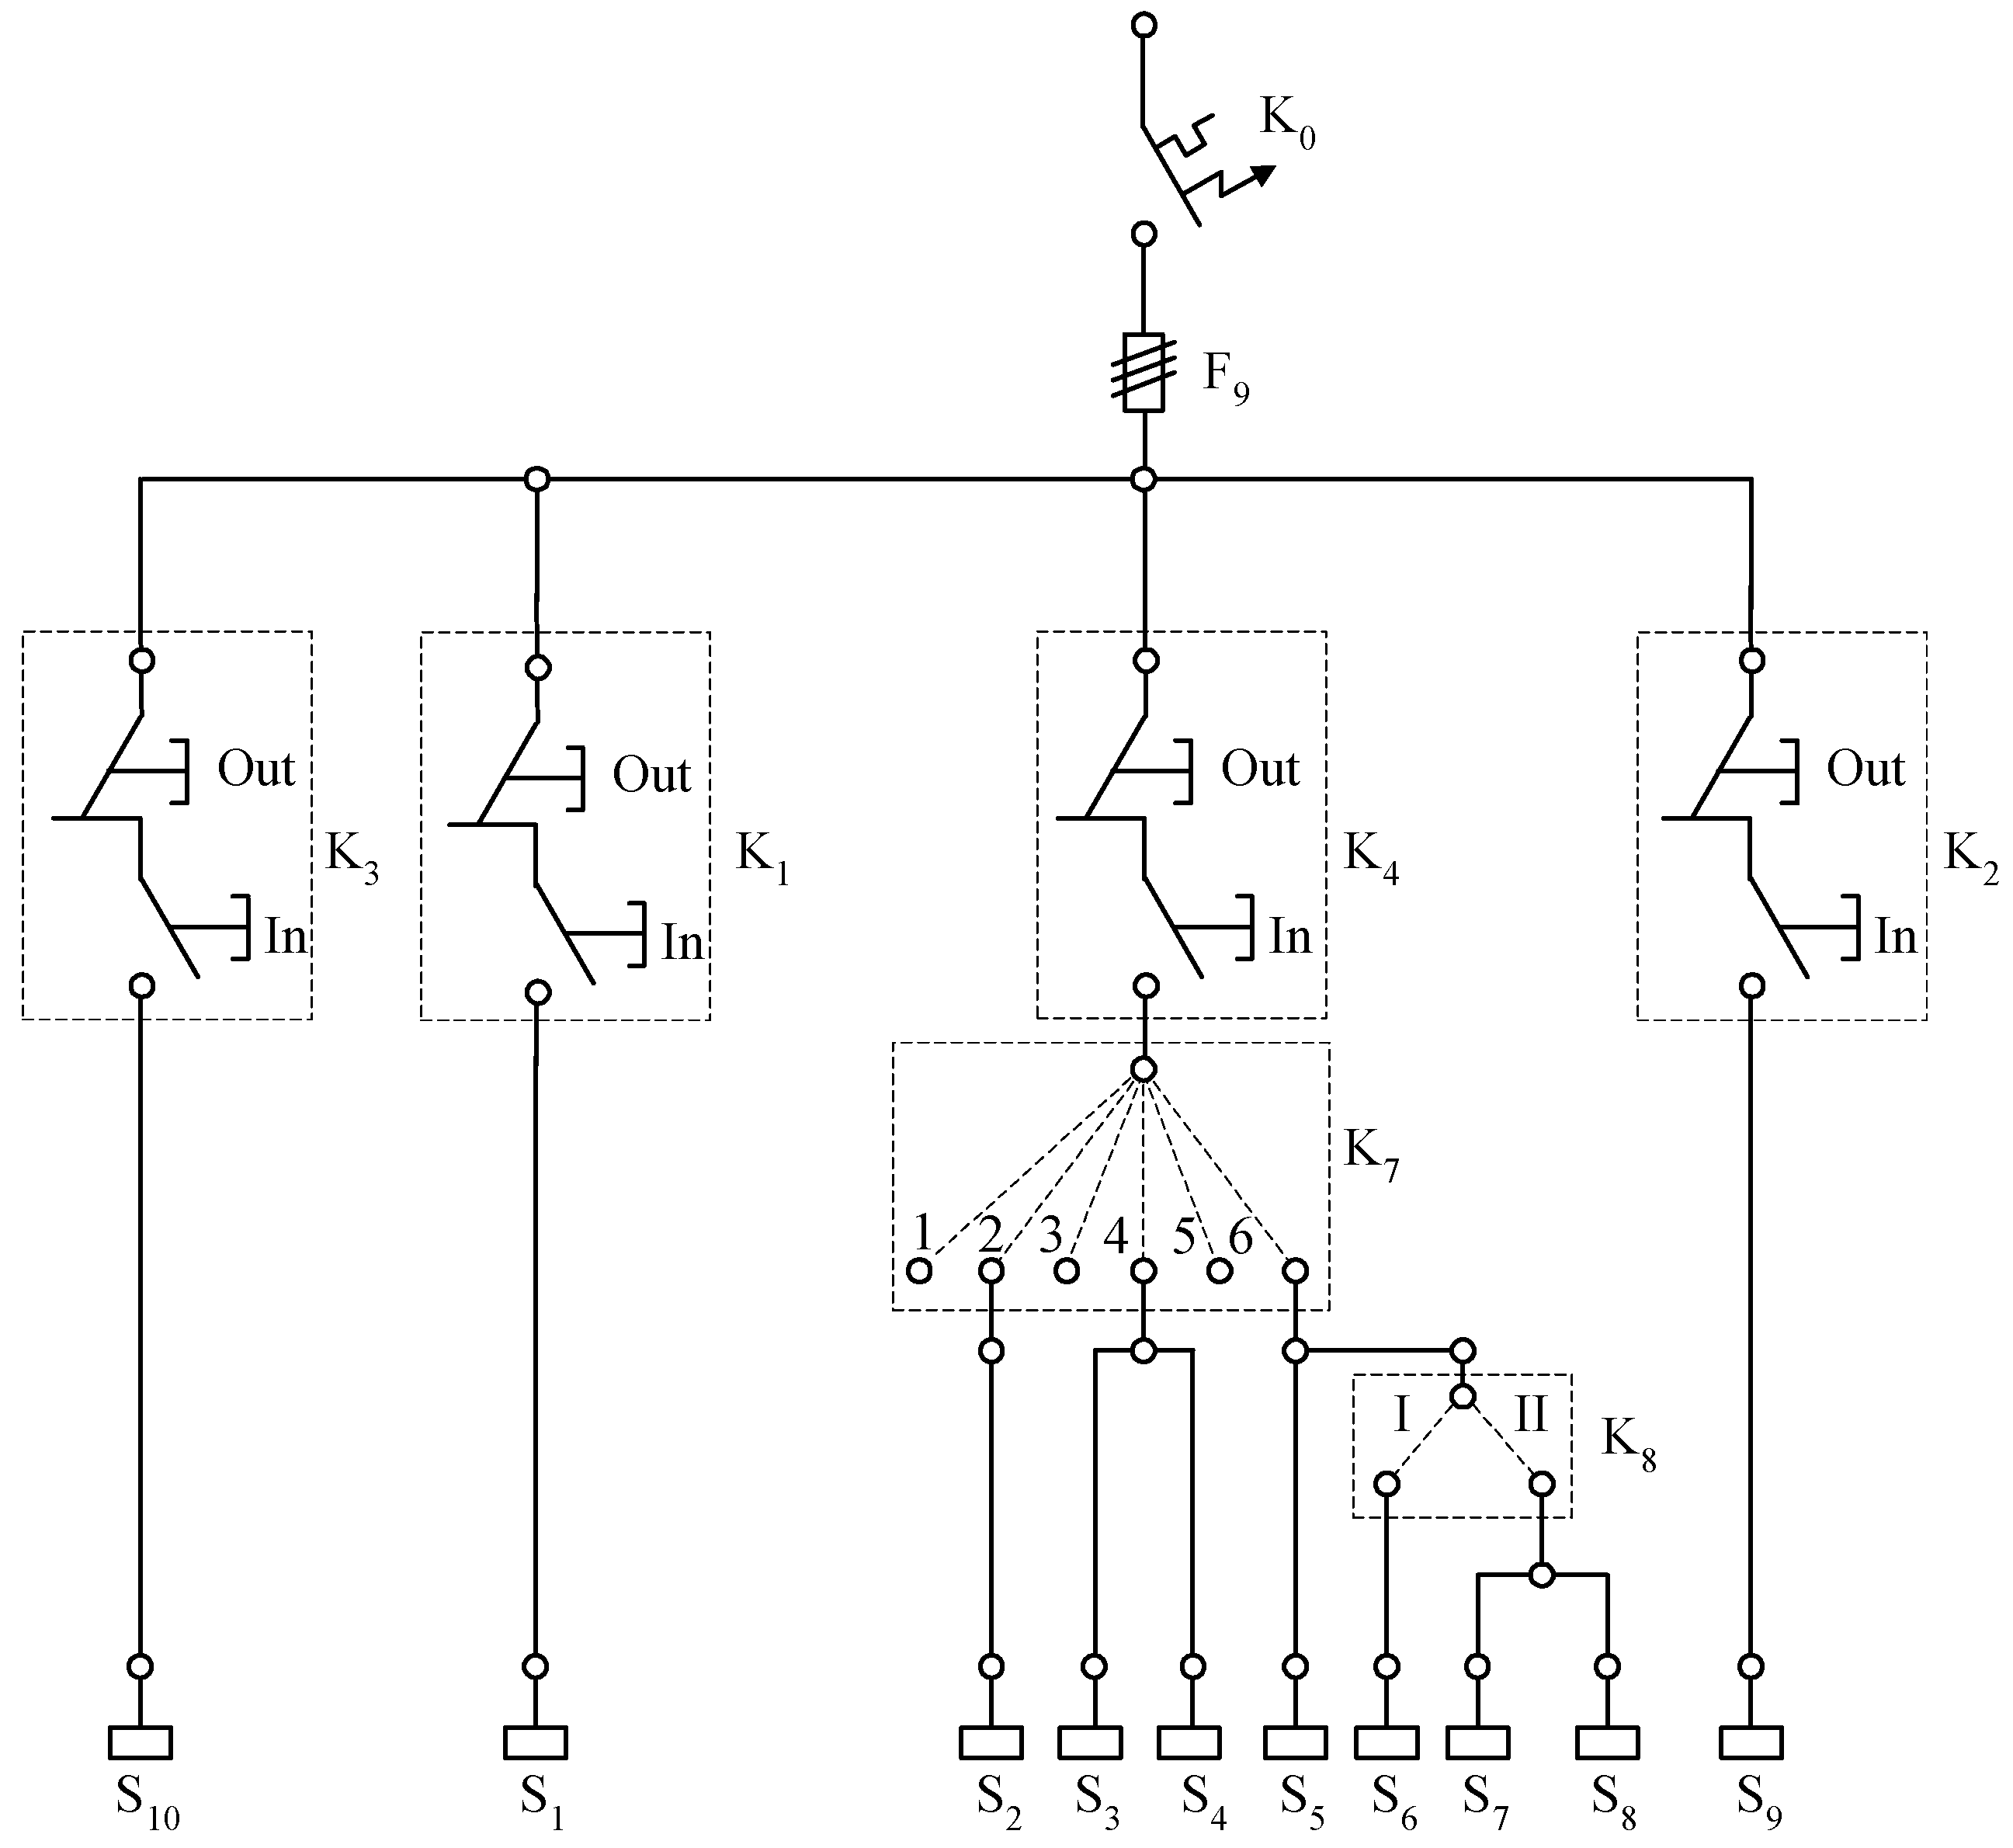
2.2. Switch Cabinet, Control Desk and Load Resistor
- (C1)
- If switch is closed, sockets 1–3 are supplied with 230 V 50 Hz AC.
- (C2)
- If switches and are closed, sockets 8–13 are supplied with 220 V one-phase 50 Hz AC.
- (C3)
- If switches and are closed, socket 4 is supplied with 400 V three-phase 50 Hz AC.
- (C4)
- If switches and are closed, sockets 6–7 are supplied with 400 V three-phase 50 Hz AC.
- (C5)
- If switches and are closed, socket 5 is supplied with 400 V three-phase 50 Hz AC.
- (C6)
- If switches , and are closed, socket 5 is supplied with 400 V three-phase AC with a variable frequency between 0 and 50 Hz. Changing the frequency is solved by the frequency converter in Figure 8a.
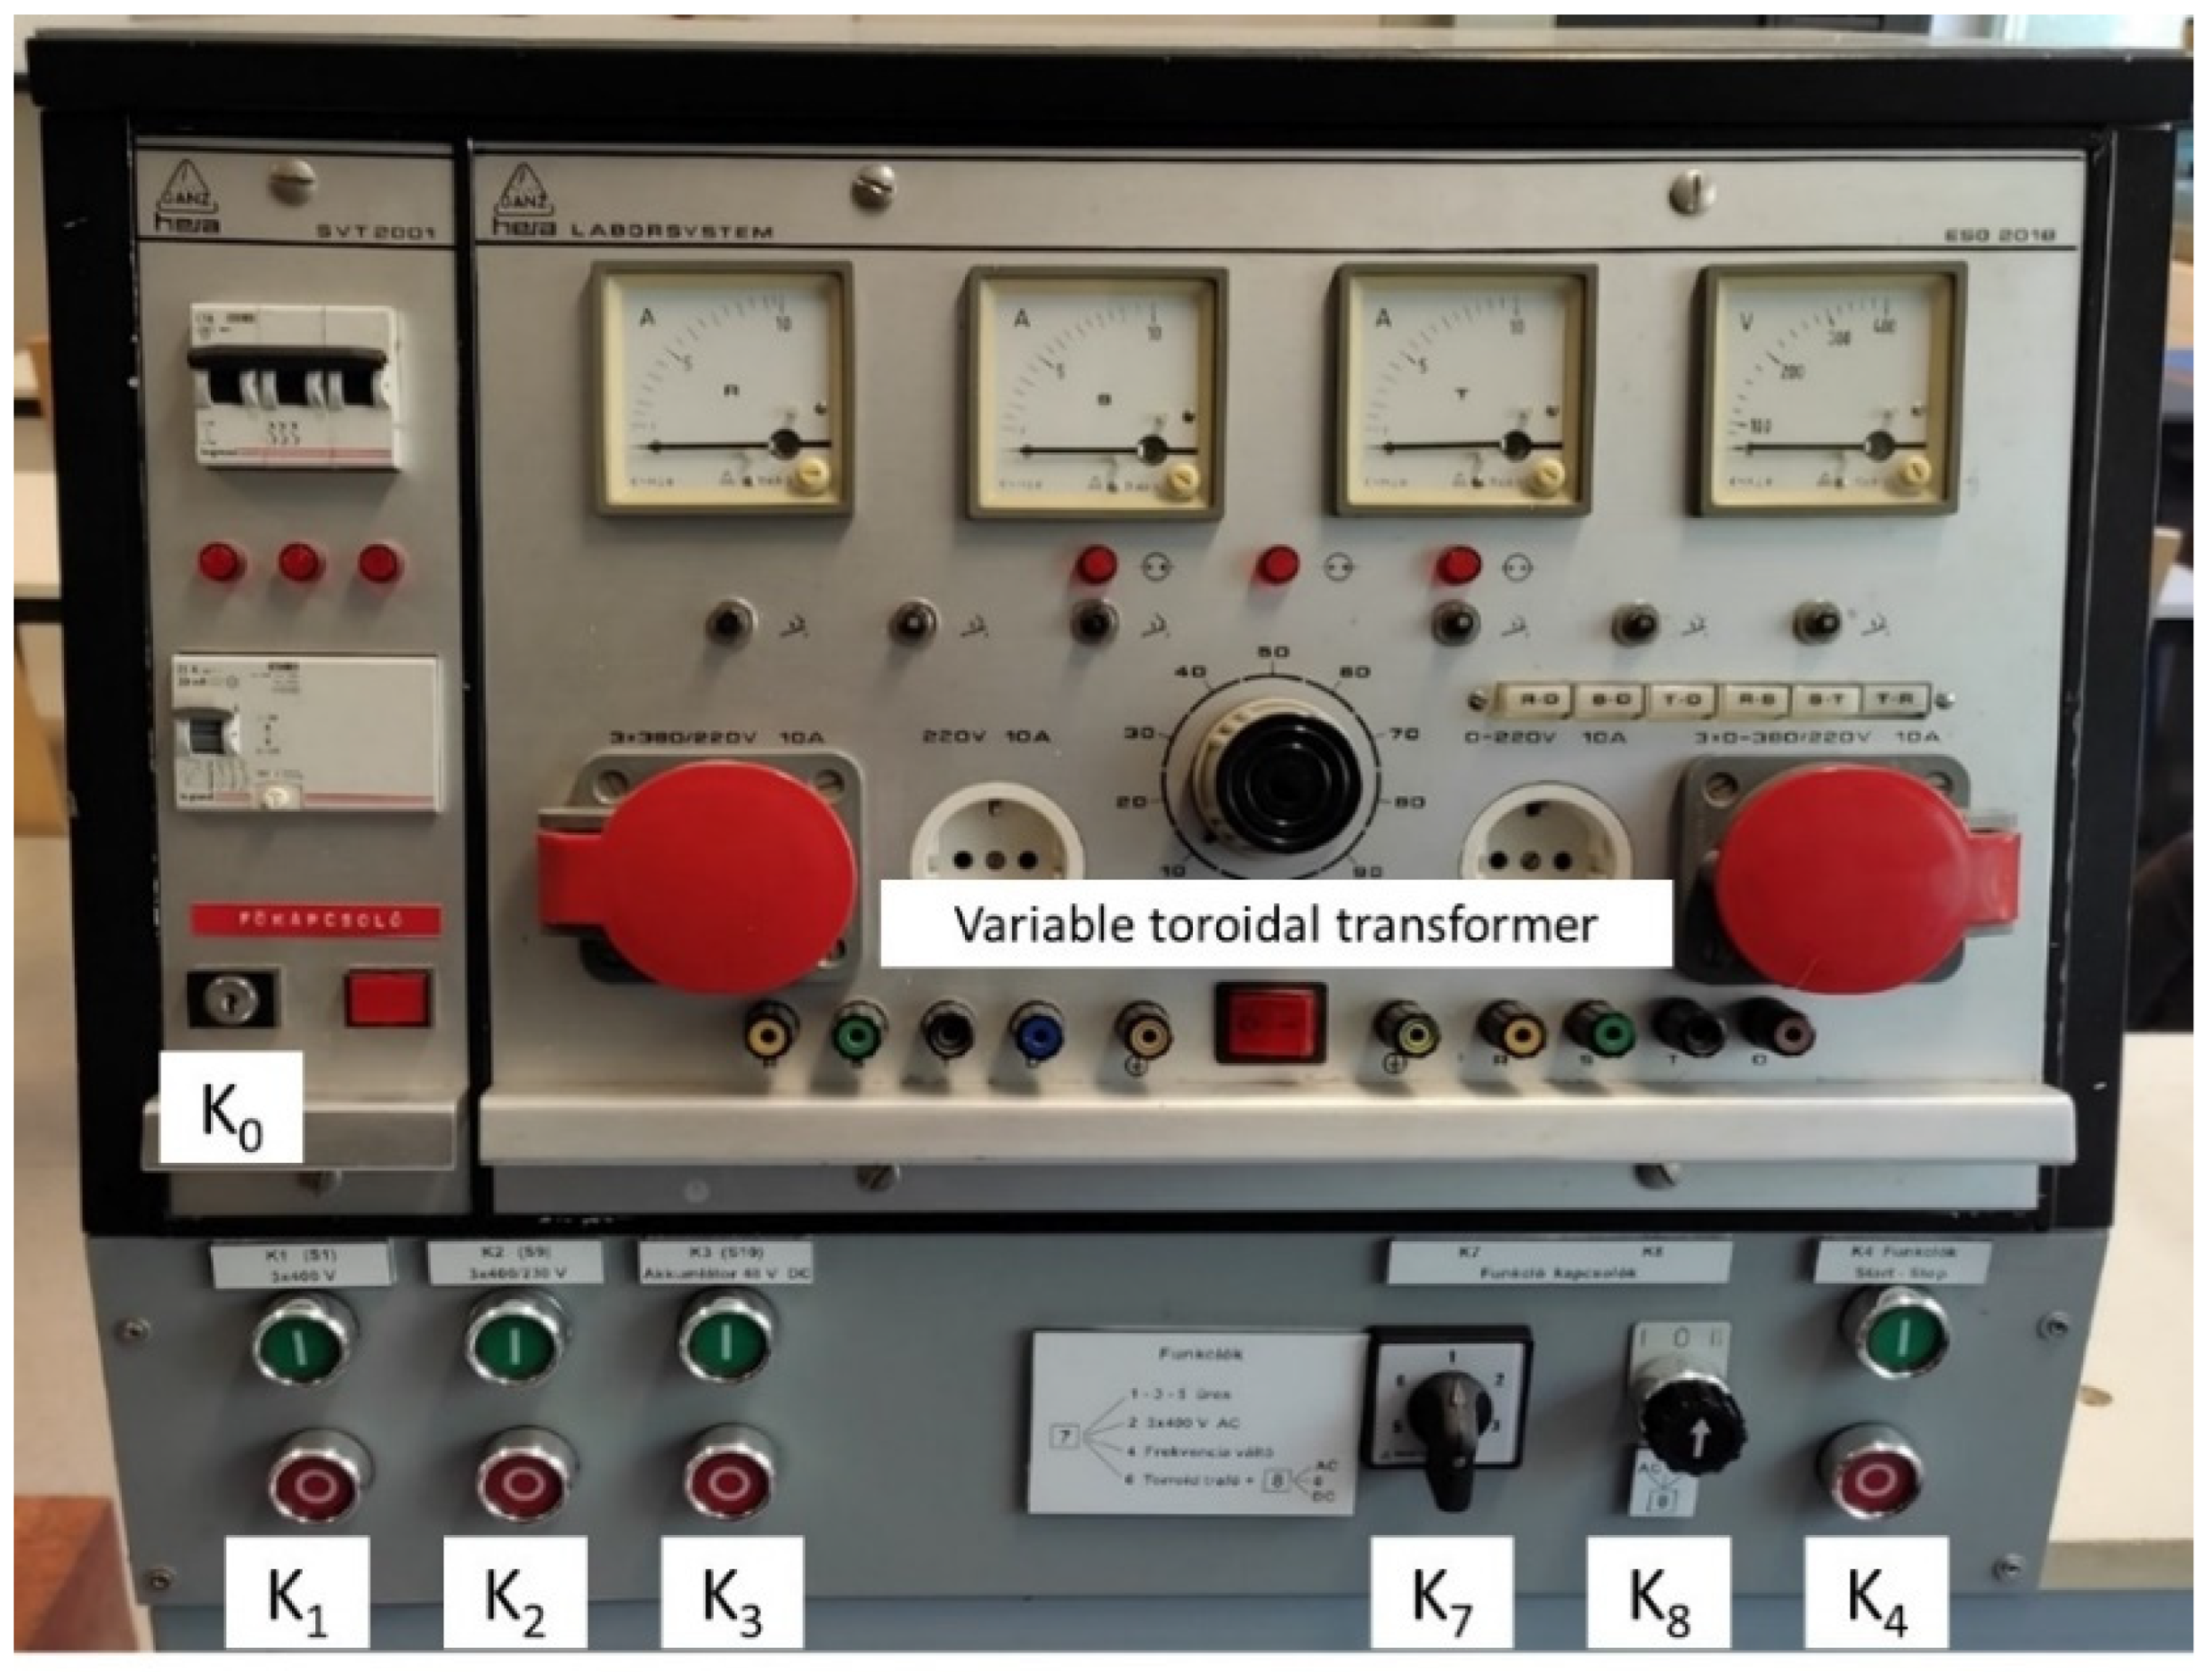
- (C7)
- If switches , and are closed, socket 5 is supplied with three-phase AC with a variable voltage between 0 and 400 V. Changing the voltage is solved by the variable toroidal transformer in Figure 9.
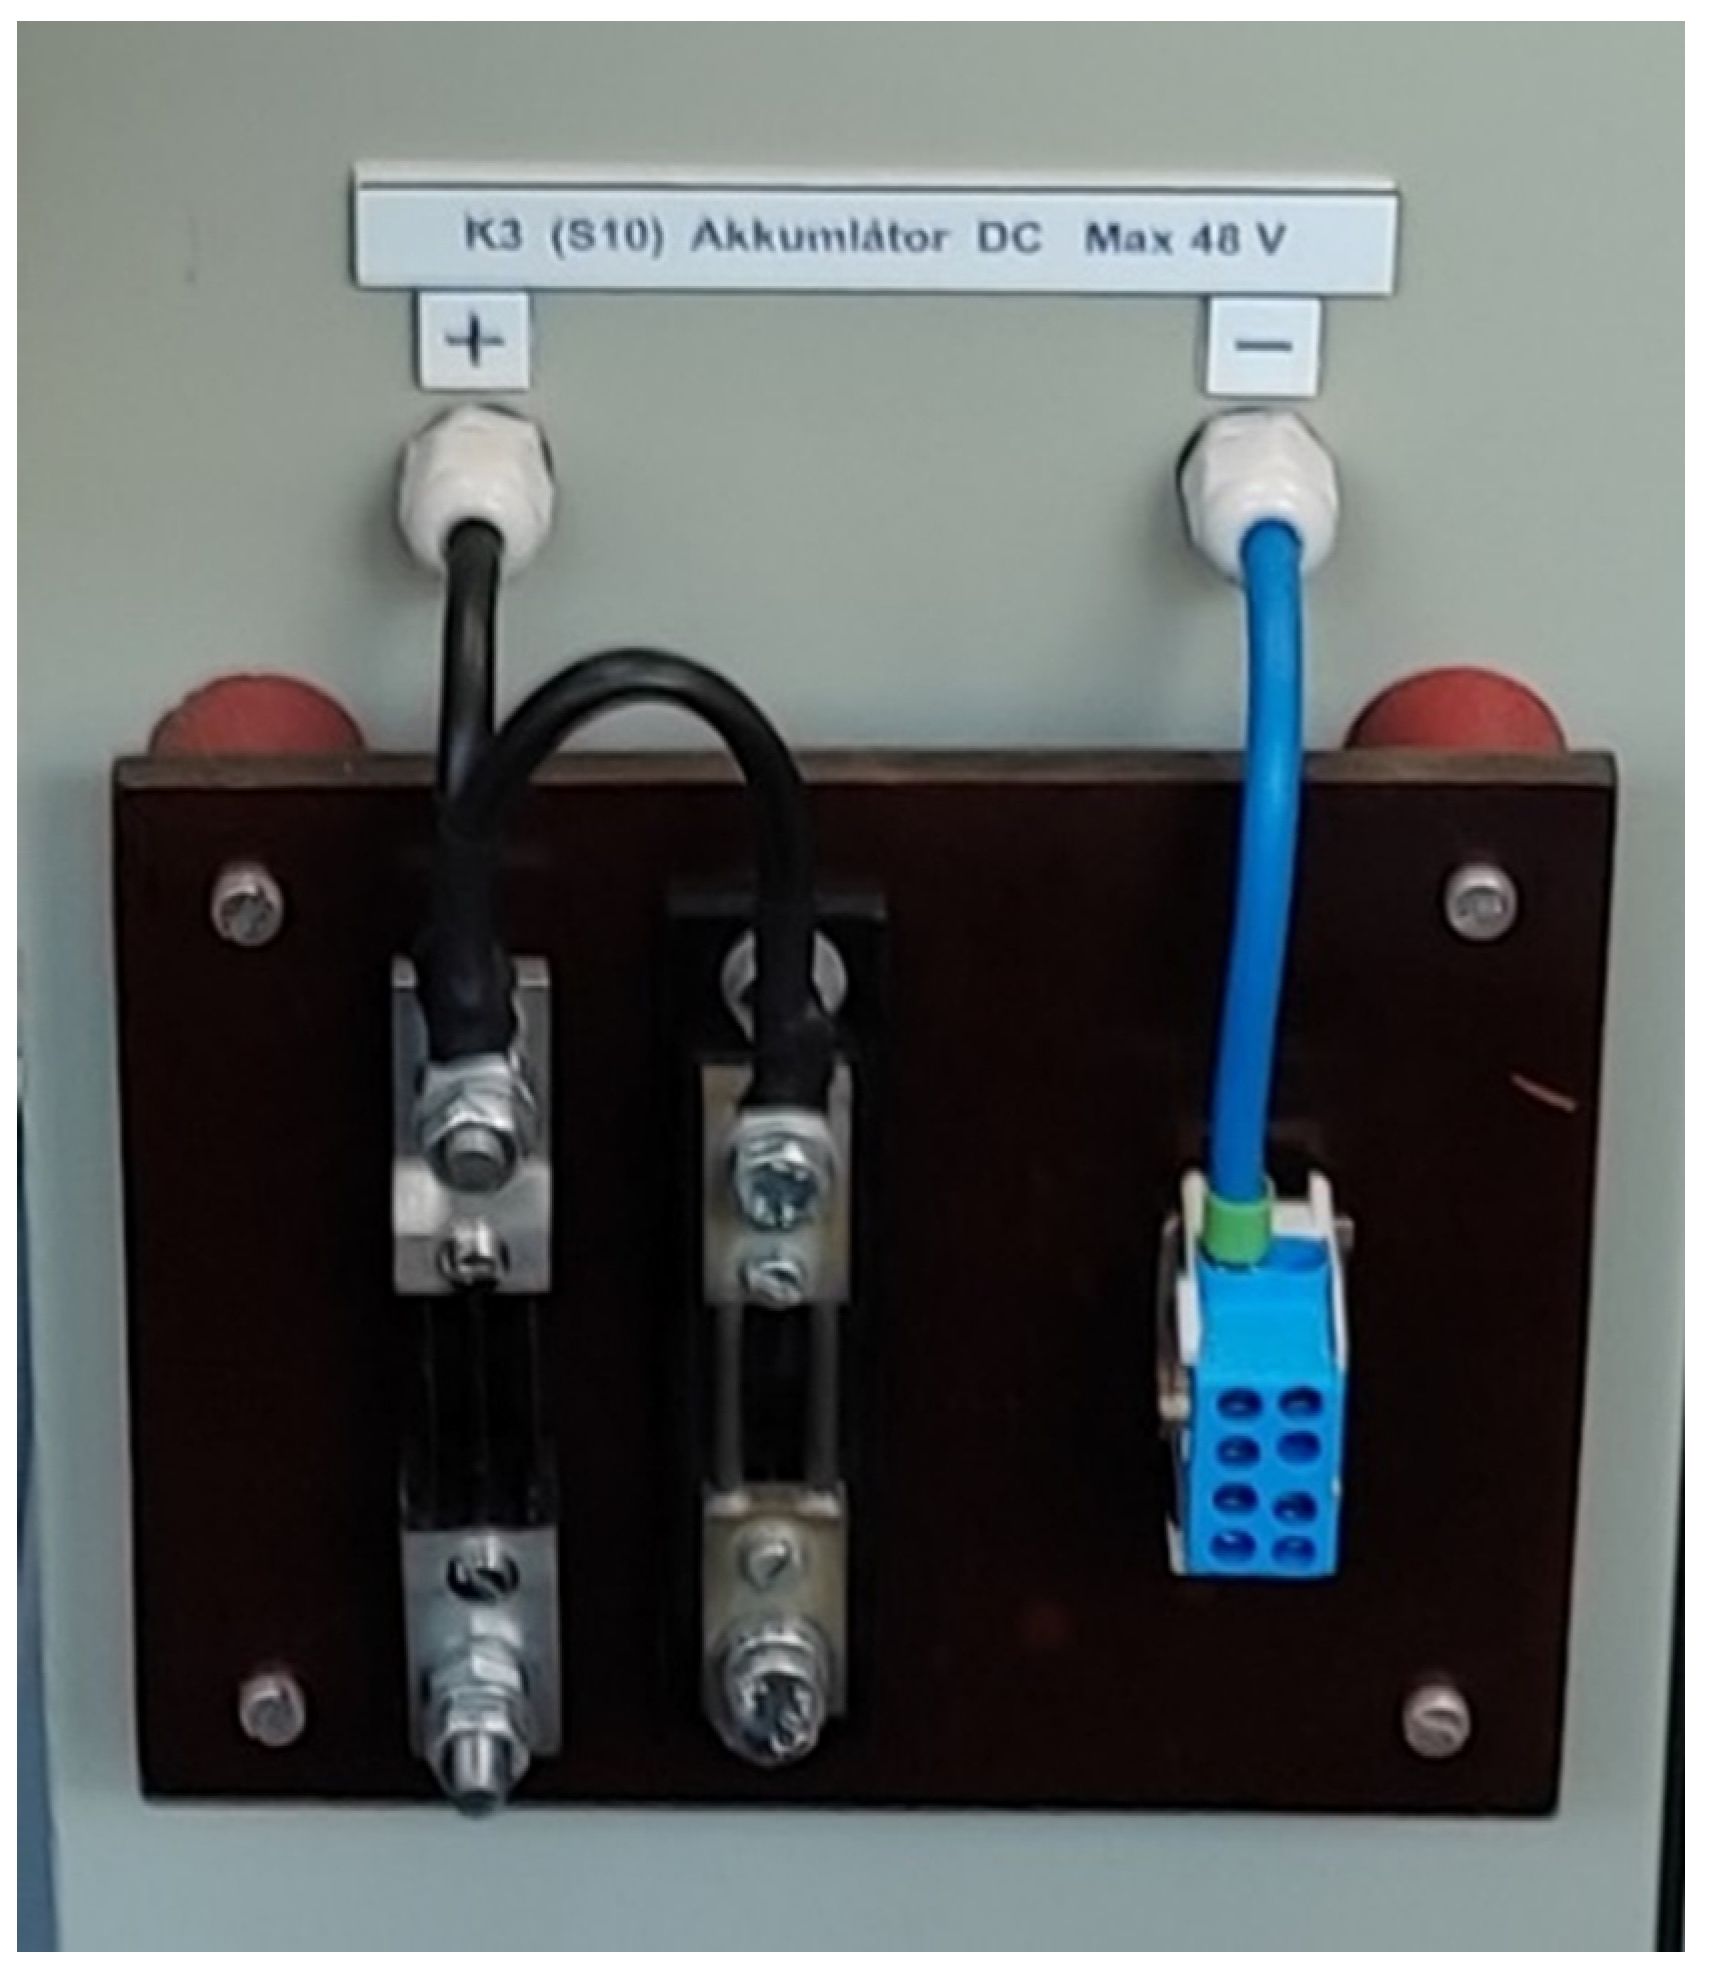
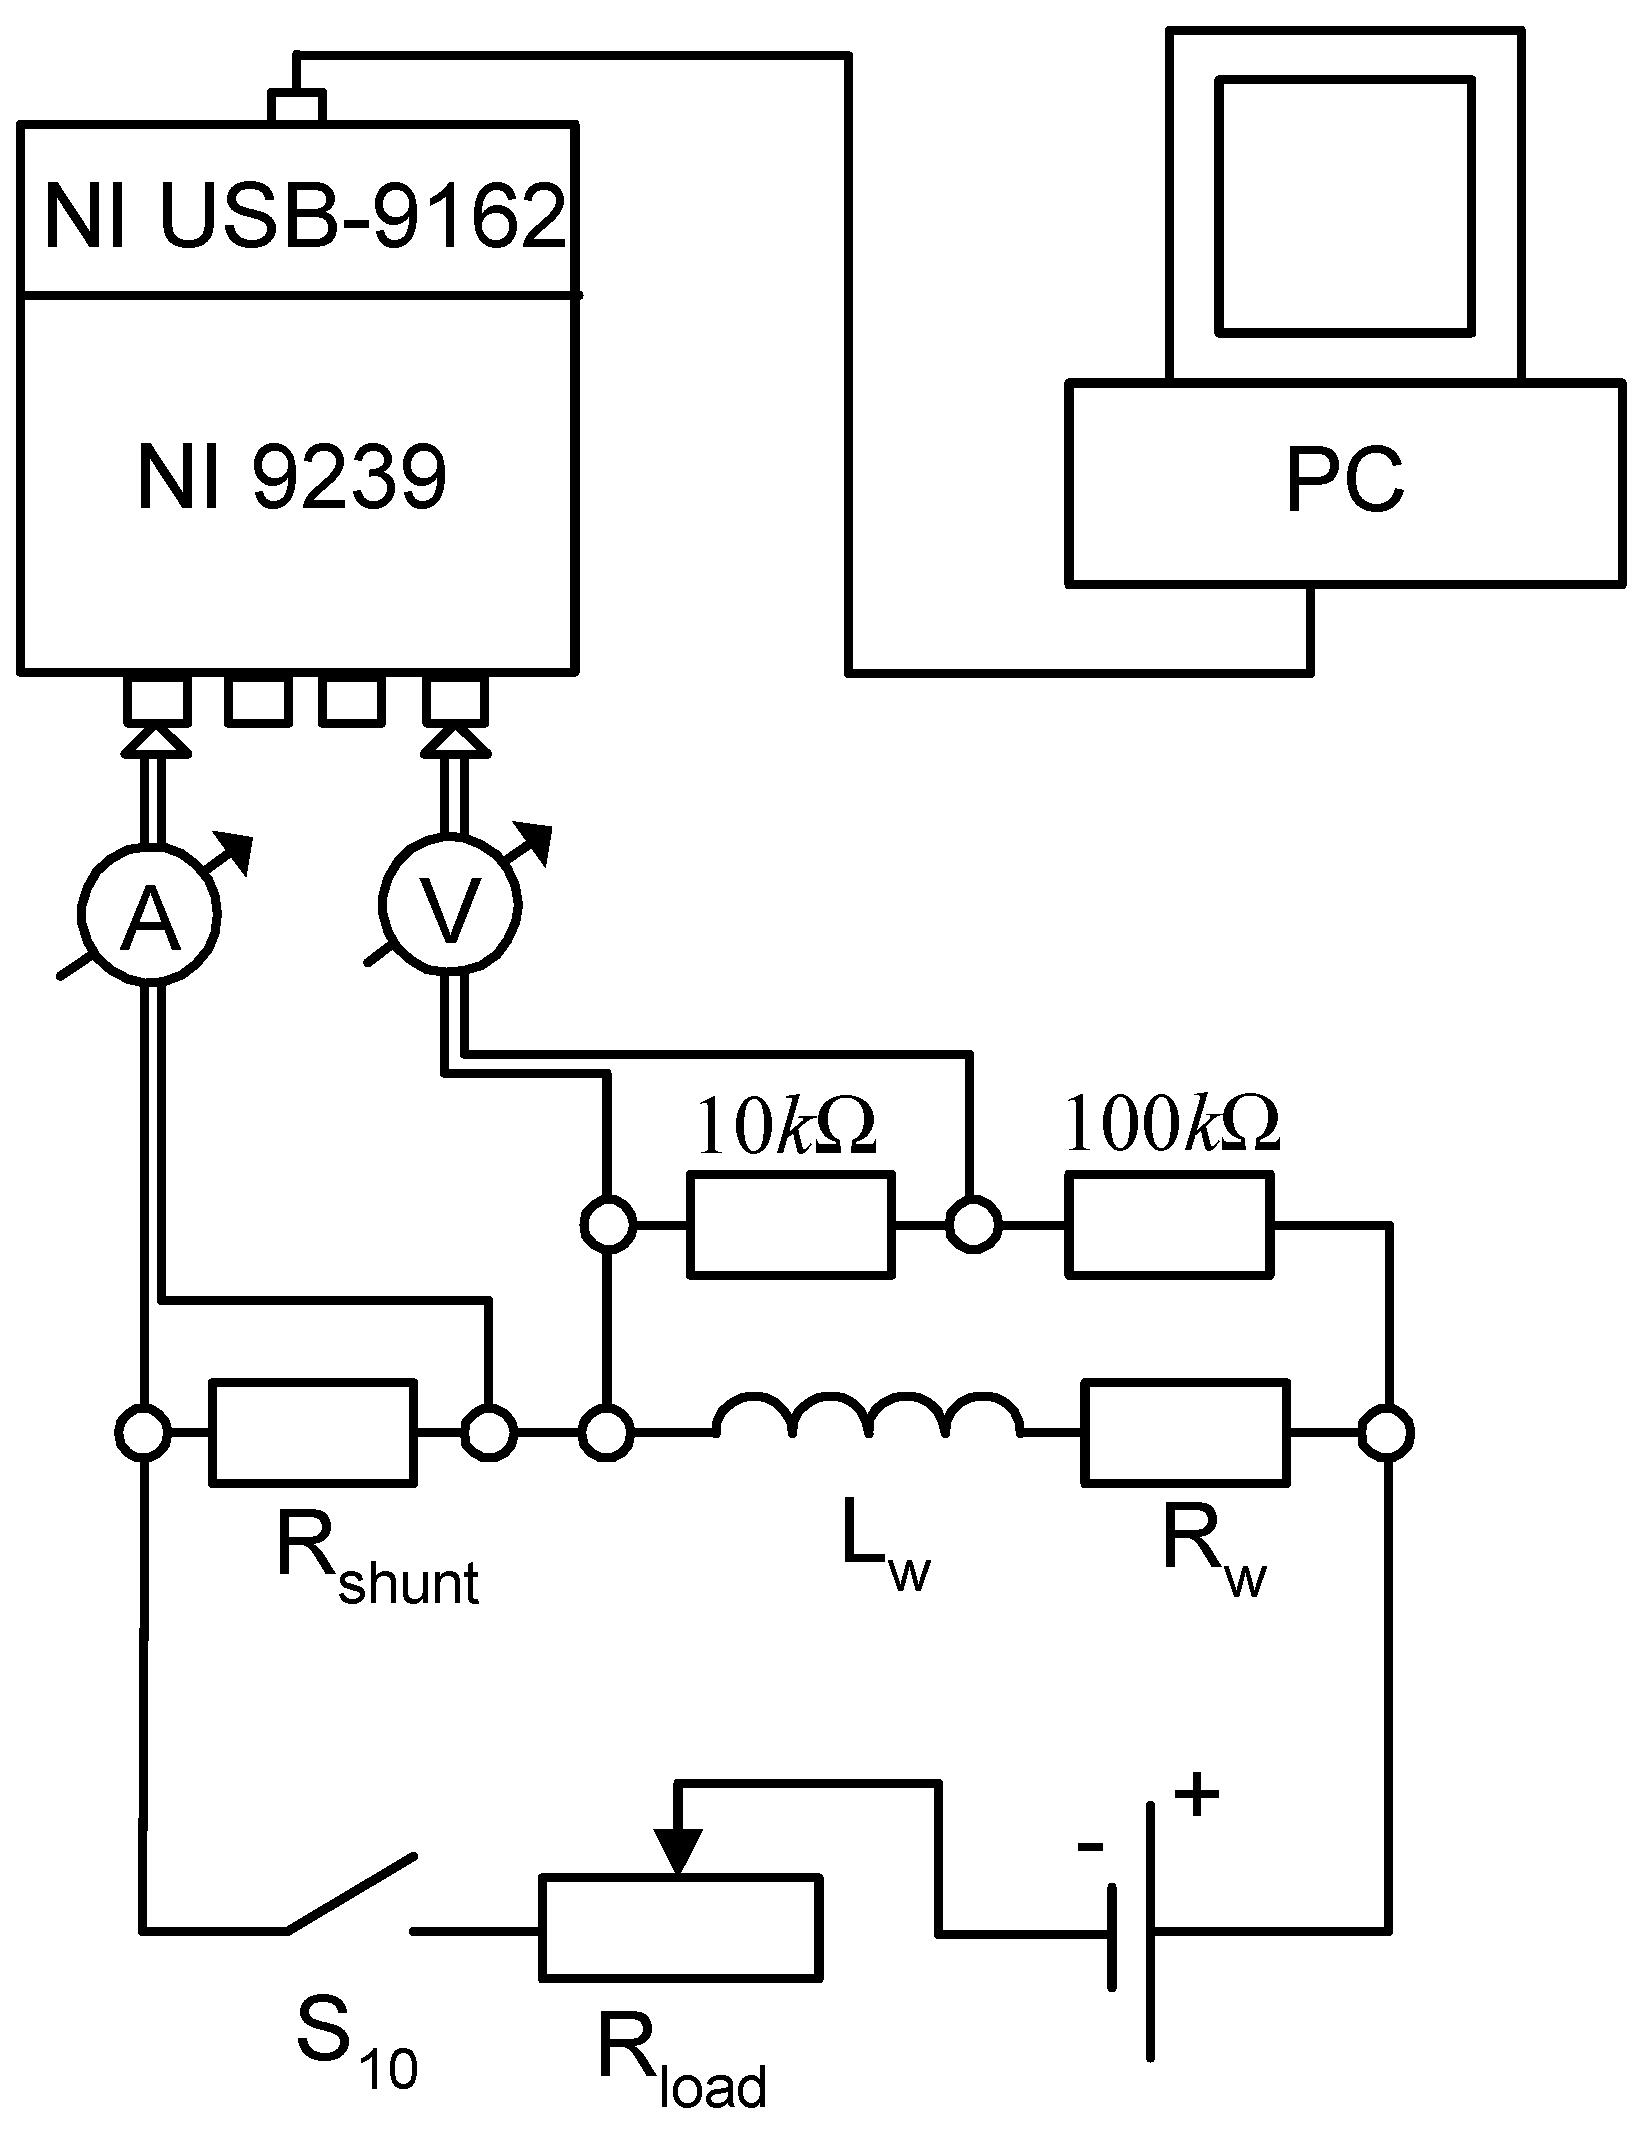
- (C8)
- (C9)
- If switches and are closed, we can use DC, which is obtained from four car batteries. Changing the resistance of the load resistor (0–7 Ω), the intensity of the electric current in the circuit can be varied.
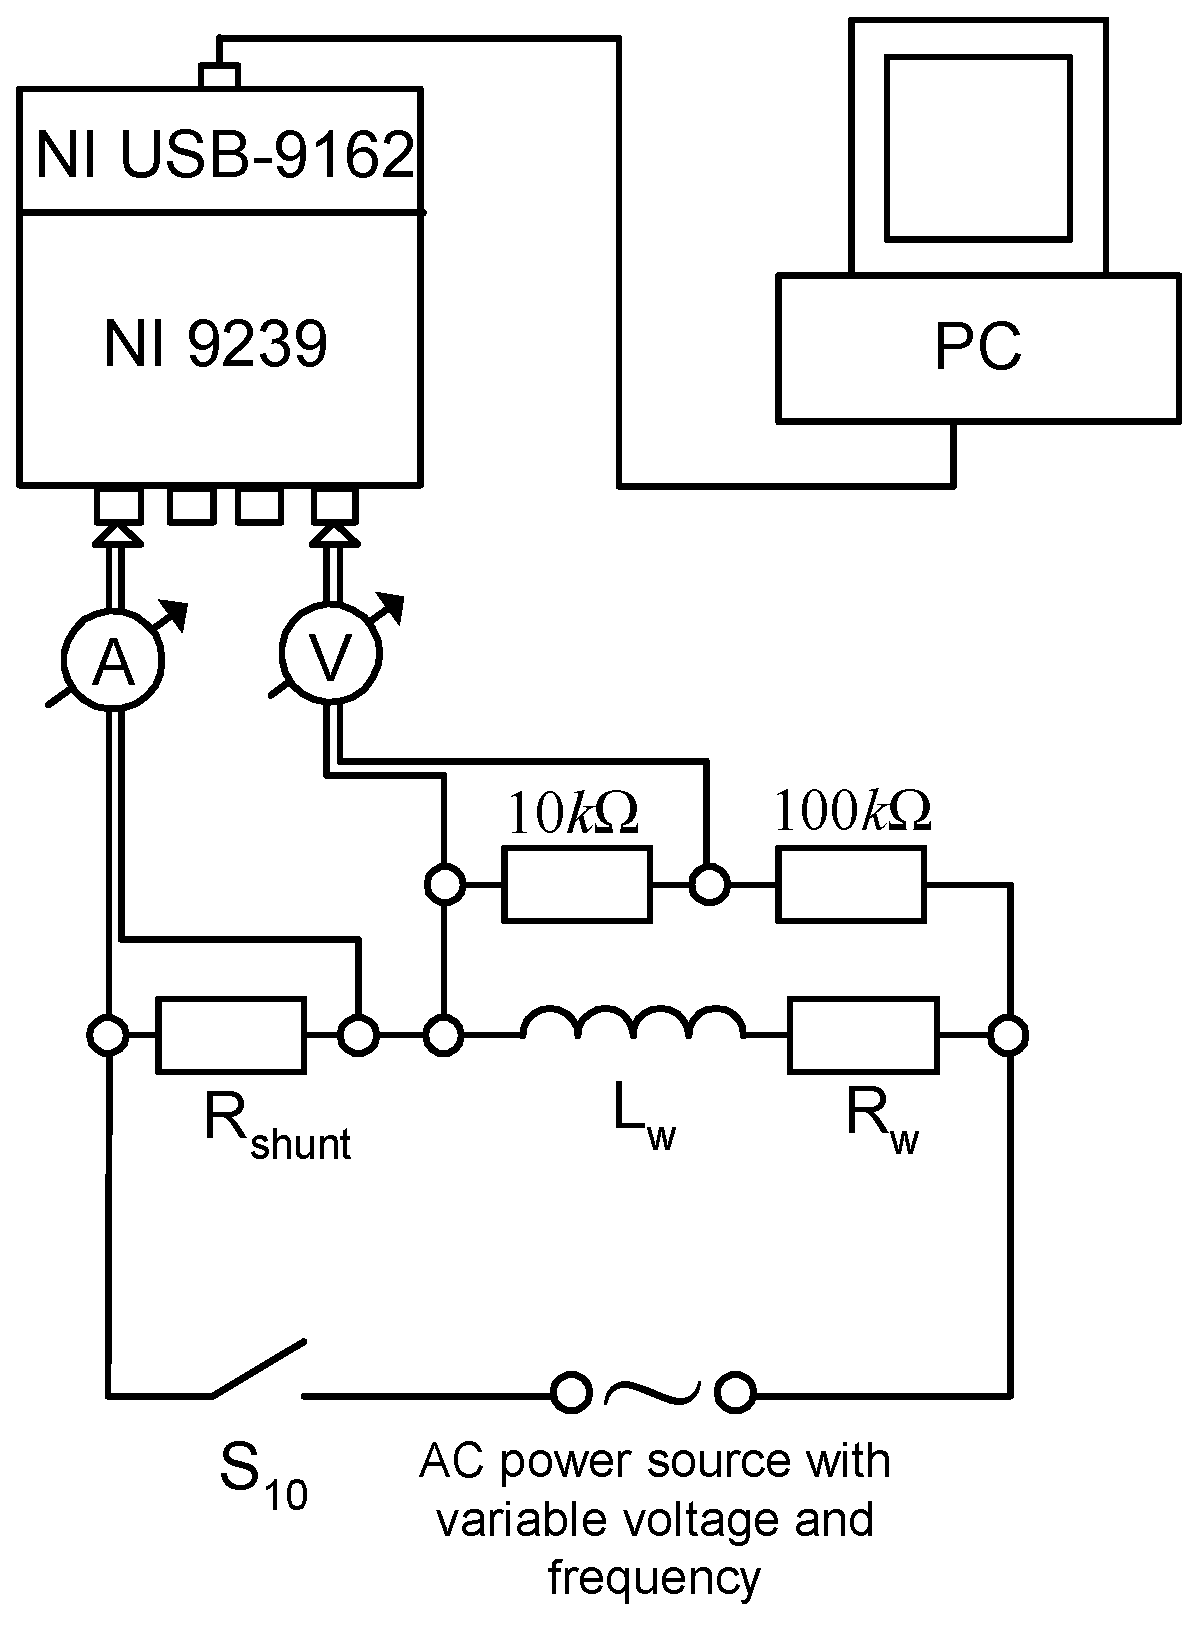
2.3. AC Power Source with Variable Voltage and Frequency
3. Applications of the Measurement System
- (1)
- The measurement of the dynamics and electromagnetic characteristics of an electric motor.
- (2)
- Test measurements on an electric motor.
3.1. Measurement of Dynamics and Electromagnetic Characteristics
3.1.1. Measurement of Braking Torque and Moment of Inertia
Experimental Procedure
Experimental Procedure
3.1.2. Measurement of the Electric Resistance, Dynamic Self and Mutual Inductance of Motor Windings
Experimental Procedure
Experimental Procedure
Experimental Procedure
3.2. Test Measurements on an Electric Motor
4. Conclusions
Author Contributions
Funding
Acknowledgments

 . The research was supported by the Thematic Excellence Programme (TKP2020-NKA-04) of the Ministry for Innovation and Technology in Hungary.
Conflicts of Interest
References
- Li, S. A review of electric motor drives for applications in electric and hybrid vehicles. Researchgate 2017. [Google Scholar]
- De Santiago, J.; Bernhoff, H.; Ekergård, B.; Eriksson, S.; Ferhatovic, S.; Waters, R.; Leijon, M. Electrical motor drivelines in commercial all-electric vehicles: A review. IEEE Trans. Veh. Technol. 2011, 61, 475–484. [Google Scholar] [CrossRef]
- Dorji, C. Review Of Electric Motor Drives. Researchgate 2015. [Google Scholar]
- Xu, Y.; Zhang, H.; Yang, F.; Tong, L.; Yan, D.; Yang, Y.; Wang, Y.; Wu, Y. Experimental investigation of pneumatic motor for transport application. Renew. Energy 2021, 179, 517–527. [Google Scholar] [CrossRef]
- Flis, K.; Pobędza, J. Simulation of pneumatic motor used in pneumobile. J. KONES 2014, 21, 89–96. [Google Scholar] [CrossRef]
- Gábora, A.; Szíki, G.Á.; Szántó, A.; Varga, T.A.; Magyari, A.; Balázs, D. Prototípus elektromos tanulmányautó fejlesztése a Shell Eco-Marathon® versenyre. In Proceedings of the XXII-th Scientific Conference of Young Engineers, Cluj-Napoca, Romania, 23 March 2017; Transylvanian Museum Society, Department of Technical Sciences: Cluj-Napoca, Romania, 2017. [Google Scholar]
- Szántó, A.; Szíki, G.Á.; Hajdu, S.; Gábora, A.; Sipos, K.B. Járműdinamikai szimuláció és optimalizáció. Műszaki Tudományos Közlemények 2018, 9, 219–222. [Google Scholar] [CrossRef]
- Gábora, A.; Sipos, K.B.; Lovadi, G.D.; Szántó, A.; Szíki, G.Á.; Borzan, M. Pneumatikus meghajtású tanulmányautó vesztességeinek elemzése. In Proceedings of the XXIII-rd Scientific Conference of Young Engineers, Cluj-Napoca, Romania, 17 March 2018; Transylvanian Museum Society, Department of Technical Sciences: Cluj-Napoca, Romania, 2018. [Google Scholar]
- György, J. A Pneumobil Versenyek És Az Oktatás A Felkészülés Tanári Szemmel. Debr. Műszaki Közlemények 2011, 10, 35–40. [Google Scholar]
- Szántó, A.; Hajdu, S.; Sziki, G.Á. Dynamic simulation of a prototype race car driven by series wound DC motor in Matlab-Simulink. Acta Polytech. Hung. 2020, 17, 103–122. [Google Scholar] [CrossRef]
- Szántó, A.; Szíki, G.Á.; Hajdu, S.; Gábora, A. Soros gerjesztésű egyenáramú motor szimulációja MATLAB környezetben. In Proceedings of the XXII-th Scientific Conference of Young Engineers, Cluj-Napoca, Romania, 23 March 2017; Transylvanian Museum Society, Department of Technical Sciences: Cluj-Napoca, Romania, 2017. [Google Scholar]
- Szíki, G.Á.; Szántó, A.; Mankovits, T. Dynamic modelling and simulation of a prototype race car in MATLAB/Simulink applying different types of electric motors. Int. Rev. Appl. Sci. Eng. 2021, 12, 57–63. [Google Scholar] [CrossRef]
- Szántó, A.; Szántó, A.; Sziki, G.Á. Review of the modelling methods of series wound DC motors. Műszaki Tudományos Közlemények 2020, 13, 166–169. [Google Scholar] [CrossRef]
- Hadžiselimović, M.; Blaznik, M.; Štumberger, B.; Zagradišnik, I. Magnetically nonlinear dynamic model of a series wound DC motor. Przegląd Elektrotechniczny 2011, 87, 60–64. [Google Scholar]
- El Shewy, H.M.; Abd Al Kader, F.E.; El Kholy, M.M.; El Shahat, A. Dynamic modeling of permanent magnet synchronous motor using MATLAB-simulink. In Proceedings of the International Conference on Electrical Engineering ICEENG 2008, Cairo, Egypt, 27–29 May 2008; Military Technical College: Cairo, Egypt; Volume 6, pp. 1–16. [Google Scholar]
- Zhou, Y.; Jiang, H.K.; Zhou, Q.X.; Zhang, Q.J. A Novel method for modeling and simulation of brushless DC motor with Kalman filter. In Advanced Technology in Teaching; Wei, Z., Ed.; Springer: Berlin/Heidelberg, Germany, 2012; pp. 305–314. [Google Scholar]
- Shi, K.L.; Chan, T.F.; Wong, Y.K.; Ho, S.L. Modelling and simulation of the three-phase induction motor using Simulink. Int. J. Electr. Eng. Educ. 1999, 36, 163–172. [Google Scholar] [CrossRef]
- Aktaibi, A.; Rahman, M.A. Dynamic simulation of a three-phase induction motor using matlab simulink. In Proceedings of the 20th Annual Newfoundland Electrical and Computer Engineering Conference (NECEC 2011), St. Johns, NL, Canada, 1 November 2011. [Google Scholar] [CrossRef]
- Brinovar, I.; Srpčič, G.; Hadžiselimović, M.; Goričan, V.; Štumberger, B. Measurement systems for determining the characteristics of electrical machines. In Proceedings of the IEEE 2017 International Conference on Modern Electrical and Energy Systems (MEES), Kremenchuk, Ukraine, 15–17 November 2017; pp. 40–43. [Google Scholar]
- Izhar, T.; Ali, M.; Sohaib, M.; Nazir, A. Development of a motor test bench to measure electrical/mechanical parameters. In Proceedings of the IEEE 2017 International Conference on Energy Conservation and Efficiency (ICECE), Lahore, Pakistan, 22–23 November 2017; pp. 64–67. [Google Scholar]
- Fuengwarodsakul, N.H.; Bauer, S.E.; De Doncker, R.W. Characteristic measurement system for automotive class switched reluctance machines. EPE J. 2006, 16, 44–52. [Google Scholar] [CrossRef]
- Braier, Z.; Klouček, P. System of measurement and evaluation of AC servo motor’s mechanic, electric and control quantities. In Proceedings of the 2015 IEEE International Workshop of Electronics, Control, Measurement, Signals and their Application to Mechatronics (ECMSM), Liberec, Czech Republic, 22–24 June 2015; pp. 1–5. [Google Scholar]
- Schupbach, R.M.; Balda, J.C. A versatile laboratory test bench for developing powertrains of electric vehicles. In Proceedings of the IEEE 56th Vehicular Technology Conference, Vancouver, BC, Canada, 24–28 September 2002; Volume 3, pp. 1666–1670. [Google Scholar]
- Rassõlkin, A.; Vodovozov, V. A test bench to study propulsion drives of electric vehicles. In Proceedings of the IEEE 2013 International Conference-Workshop Compatibility And Power Electronics, Ljubljana, Slovenia, 5–7 June 2013; pp. 275–279. [Google Scholar]
- Ádámkó, É.; Szántó, A.; Sziki, G.Á. Software developments for an electric motor test bench developed at the Faculty of Engineering of the University of Debrecen. In Proceedings of the 6th Agria Conference on Innovative Vehicle Technologies and Automation Solutions (InnoVeTAS 2022), Eger, Hungary, 13 May 2022; IOP Conference Series: Materials Science and Engineering. IOP Publishing: Bristol, UK; Volume 1237, p. 012012. [Google Scholar]
- Sziki, G.Á.; Sarvajcz, K.; Kiss, J.; Gál, T.; Szántó, A.; Gábora, A.; Husi, G. Experimental investigation of a series wound dc motor for modeling purpose in electric vehicles and mechatronics systems. Measurement 2017, 109, 111–118. [Google Scholar] [CrossRef]
- Szántó, A.; Kiss, J.; Mankovits, T.; Szíki, G.Á. Dynamic Test Measurements and Simulation on a Series Wound DC Motor. Appl. Sci. 2021, 11, 4542. [Google Scholar] [CrossRef]
- Podzharenko, V.A.; Kucheruk, V.Y. New method of measurement of a moment of inertia of an electrical machines. In Proceedings of the XIV IMEKO World Congress, Tampere, Finland, 2–6 June 1997; Volume 3. [Google Scholar]
- Egorov, A.V.; Kozlov, K.E.; Belogusev, B.N. Experimental identification of the electric motor moment of inertia and its efficiency using the additional inertia. ARPN J. Eng. Appl. Sci. 2016, 11, 10582–10588. [Google Scholar]
- Rao, M.V.K. Brush Contact Drop in D.C. Machines; Bangalore Press: Bengaluru, India, 1934. [Google Scholar]


Publisher’s Note: MDPI stays neutral with regard to jurisdictional claims in published maps and institutional affiliations. |
© 2022 by the authors. Licensee MDPI, Basel, Switzerland. This article is an open access article distributed under the terms and conditions of the Creative Commons Attribution (CC BY) license (https://creativecommons.org/licenses/by/4.0/).
Share and Cite
Sziki, G.Á.; Szántó, A.; Kiss, J.; Juhász, G.; Ádámkó, É. Measurement System for the Experimental Study and Testing of Electric Motors at the Faculty of Engineering, University of Debrecen. Appl. Sci. 2022, 12, 10095. https://doi.org/10.3390/app121910095
Sziki GÁ, Szántó A, Kiss J, Juhász G, Ádámkó É. Measurement System for the Experimental Study and Testing of Electric Motors at the Faculty of Engineering, University of Debrecen. Applied Sciences. 2022; 12(19):10095. https://doi.org/10.3390/app121910095
Chicago/Turabian StyleSziki, Gusztáv Áron, Attila Szántó, János Kiss, György Juhász, and Éva Ádámkó. 2022. "Measurement System for the Experimental Study and Testing of Electric Motors at the Faculty of Engineering, University of Debrecen" Applied Sciences 12, no. 19: 10095. https://doi.org/10.3390/app121910095
APA StyleSziki, G. Á., Szántó, A., Kiss, J., Juhász, G., & Ádámkó, É. (2022). Measurement System for the Experimental Study and Testing of Electric Motors at the Faculty of Engineering, University of Debrecen. Applied Sciences, 12(19), 10095. https://doi.org/10.3390/app121910095