Article

Distinction of Human and Mechanical Vibrations within Similar Frequency Bands Based on Wavelet Entropy Using Ultrawideband Radar

1
Department of Medical Electronics, School of Biomedical Engineering, Air Force Medical University, Xi’an 710032, China
2
Air Force Hospital of Southern Theater Command of PLA, Guangzhou 510062, China
3
Medical Service Department, The 942 Hospital, Yinchuan 750004, China
*
Authors to whom correspondence should be addressed.
The two authors contributed equally to this paper.
Appl. Sci. 2022, 12(19), 10046; https://doi.org/10.3390/app121910046
Submission received: 9 September 2022 / Revised: 27 September 2022 / Accepted: 30 September 2022 / Published: 6 October 2022
(This article belongs to the Section Electrical, Electronics and Communications Engineering)

Abstract

:
Construction machinery is necessary in postdisaster emergency rescue missions involving the destruction of ruins. However, their mechanical vibrations can interfere with the detection of human survivors using ultrawideband (UWB) radar. Traditional methods detect and identify humans by determining maximum energy and checking respiratory frequency. However, they lose effectiveness because mechanical vibration is associated with a frequency band which is similar to the human respiration band, but it has higher energy. This study proposes a novel method to distinguish human vibrations from mechanical vibrations. After preprocessing, wavelet entropy decomposition was implemented on the radar data. An improved, censored mean-level detector, constant false-alarm rate algorithm was utilized to automatically identify the position of human and mechanical vibrations. A novel feature is then extracted by calculating the half-height width of the target’s wavelet entropy. Finally, the results of two independent sample t-tests prove that there is a significant statistical difference between the feature values of humans and the mechanical vibrations (p < 1.9 × 10⁻⁶), thus proving the effectiveness of the method. We envisage that the proposed method can be used in postdisaster rescue missions to improve the accuracy and speed of identifying human targets. Therefore, more survivors may be rescued.

1. Introduction

In recent years, the application of ultrawideband (UWB) radar for remote sensing has emerged as a promising technique for the detection of human targets [1,2,3]. Unlike thermal imaging, X-rays, magnetic induction, and other technologies, UWB radar probes use nonionizing electromagnetic pulse waves, which are proven to be stable and immune to the influence of temperature, nonmetallic wall materials, and target clothes. The signals of the radiated pulse waves occupy an extremely broad bandwidth relative to the center frequency. Thus, UWB radars are beneficial for penetrating obstacles such as walls and separating multiple human targets in complex environment detection settings [4]. Moreover, UWB radars can locate human targets with higher accuracy compared with continuous-wave (CW) radar systems. Accordingly, the UWB radar has gradually become one of the most reliable technical means for detection and localization purposes during human postdisaster rescue missions, such as earthquakes and collapses [5,6].
Radar signals reflected from human targets carry biometric information related to periodic fluctuations of the body during respiration [7]. For example, the periodic frequency of respiration of a healthy adult is in the range of 0.2–0.4 Hz. However, human target detection through ruins using UWB radars has several challenges, including the low reflectivity of human beings, strong interference from stationary objects, and high attenuation of electromagnetic waves, which could lead to an extremely low signal-to-clutter ratio (SCR) [8,9]. In particular, several construction machineries are used to aid rescue efforts in modern postdisaster emergency rescues. Obviously, the vibration amplitude of mechanical operations is considerably larger than that of periodic motions caused by human respiration. Therefore, the signal-to-interference ratio (SIR) of the echo data would decrease considerably, and strong vibration interference would be sufficiently large to trigger false alarms.
In recent years, several human detection techniques have been developed in the presence of interference, including time- and frequency-domain methods. Regarding the time-domain methods, Zhang et al. [10] proposed an adaptive filtering algorithm to suppress the vibration interference caused by a machinery operator’s respiration using dual-frequency radar at 5.75 GHz/35 GHz for human detection. Accordingly, ground experiments showed that the proposed method can identify two types of respiratory signals with a frequency difference > 0.04 Hz. In the frequency domain, Schires et al. [11] used a phase detection technology based on frequency differences to eliminate the inertial vibration interference of a driver’s body caused by vehicle-induced vibration during driving. Therefore, it can accurately detect human breathing and heartbeat signals. Moreover, Castro et al. [12] used acceleration sensors to acquire vehicular seat vibration signals, which were assumed to be in the same direction as the human body vibration. For cases of known direction of motion and acceleration, a method was proposed to separate human body vibration signals and physiological signals based on independent component analysis (ICA). Seong et al. [13] segmented signals that contained vital signals and various human motions into subsignals and then constructed the desired vital signal using the correlation method.
However, there is a relatively large frequency difference between the induced vibration interference and human respiration in the aforementioned methods. There is no guarantee that they are effective when the vibration interference and human respiration are in a similar frequency band. In our pre-experiments, it was found that parts of the mechanical vibration signals of wheel loaders were approximately quasiperiodic in the time domain, and their frequencies were in the range of human respiratory signal frequencies (0.2–0.4 Hz) with apparently larger amplitudes. A wheel loader is one of the most commonly used construction machineries for promoting rescue efforts during postdisaster emergency rescue missions. Specifically, the digging motion of the shovel of wheel loaders was found to be regular, and its major spectral components were at 0.2–0.4 Hz, which overlapped with that of human respiratory frequency. Thus, traditional detection methods cannot guarantee the effectiveness of human target detection in the presence of interference from strong vibrations.
In this study, a novel feature was proposed from the perspective of wavelet entropy rather than energy or frequency. It can reveal the system’s differences of order/disorder microstates. Thus, the defects of traditional methods can be avoided. After signal preprocessing, wavelet entropy decomposition was implemented to quantitatively measure the functional dynamics of order/disorder signals. Then, an improved, censored mean-level detector, constant false-alarm rate (ICMLD-CFAR) algorithm was employed to detect the location of the human targets and the source of the mechanical vibration of digging. This algorithm could increase the difference between the human and mechanical vibration of digging. Thus, it would be easier and more accurate for locating a targets’ positions. Next, the novel feature of the half-height width (HHW) of the target’s wavelet entropy was extracted to distinguish humans from strong vibration interference. Finally, experiments and statistical analyses proved the effectiveness of the proposed method. It is shown that there is a large statistical difference between the HHW values of a human target and the mechanical vibration of digging. The calculation of HHW values is independent of the system’s vibration amplitude and frequency. It significantly satisfies the distinction environment in postdisaster rescues, where the frequency of human and mechanical vibrations are within similar frequency bands and strong interference exists. This study can help enhance the actual application of UWB radar in postdisaster emergency rescues.

2. UWB Radar System

Figure 1 shows the diagram of the utilized UWB radar system. First, the pulse generator produces narrow pulses with a pulse repetition frequency of 128 kHz. The pulses are sent to the transmitter and shaped into bipolar pulses to excite the transmitting antenna (TA). The TA transmits bipolar pulses at the center frequency of 500 MHz with a bandwidth of 500 MHz Subsequently, owing to the high reflectivity of the body-to-radiofrequency signals, the transmitted pulses from the TA impinges on the human body, and some of them are subsequently reflected and received by the receiving antenna (RA). Therefore, the human target’s position can be determined according to the time-of-flight (ToF) of the pulses from TA to RA. Simultaneously, parts of the narrow pulses from the pulse generator are sent to the delay unit to generate a range gate, which triggers the receiver to receive echoes at selective ranges. The received pulses are then sampled by a sampler at selective ranges according to the range gate and are accumulated by the integrator. Finally, the output from the integrator is amplified and filtered by a signal processor, and it is then sent to a computer for further processing through a high-speed analog-to-digital converter (ADC).
The echo signals after ADC are stored in the form of a two-dimensional matrix R M , N , where M indicates the sampling point during the propagation time period, namely, “fast time.” Each fast-time instance corresponds to a specific detection range. Herein, M = 2048 range points, and the corresponding detection range is 0–9 m. N denotes the number of recorded sampling points in the measurement time, or “slow time”; the sequence number of the data sampled in conjunction with the slow time t = n T i   n = 1 , 2 , , N   at a specific distance. T i = 0.0156 s is the time interval between each successively received echo signal. Thus, the sampling frequency at the slow time was Fs = 1/ T i = 64 Hz, which satisfies the Nyquist sampling rate for measuring human respiration (0.2–0.4 Hz). The key parameters of the UWB radar used in this study are summarized in Table 1.

3. Methods

3.1. Signal Preprocessing

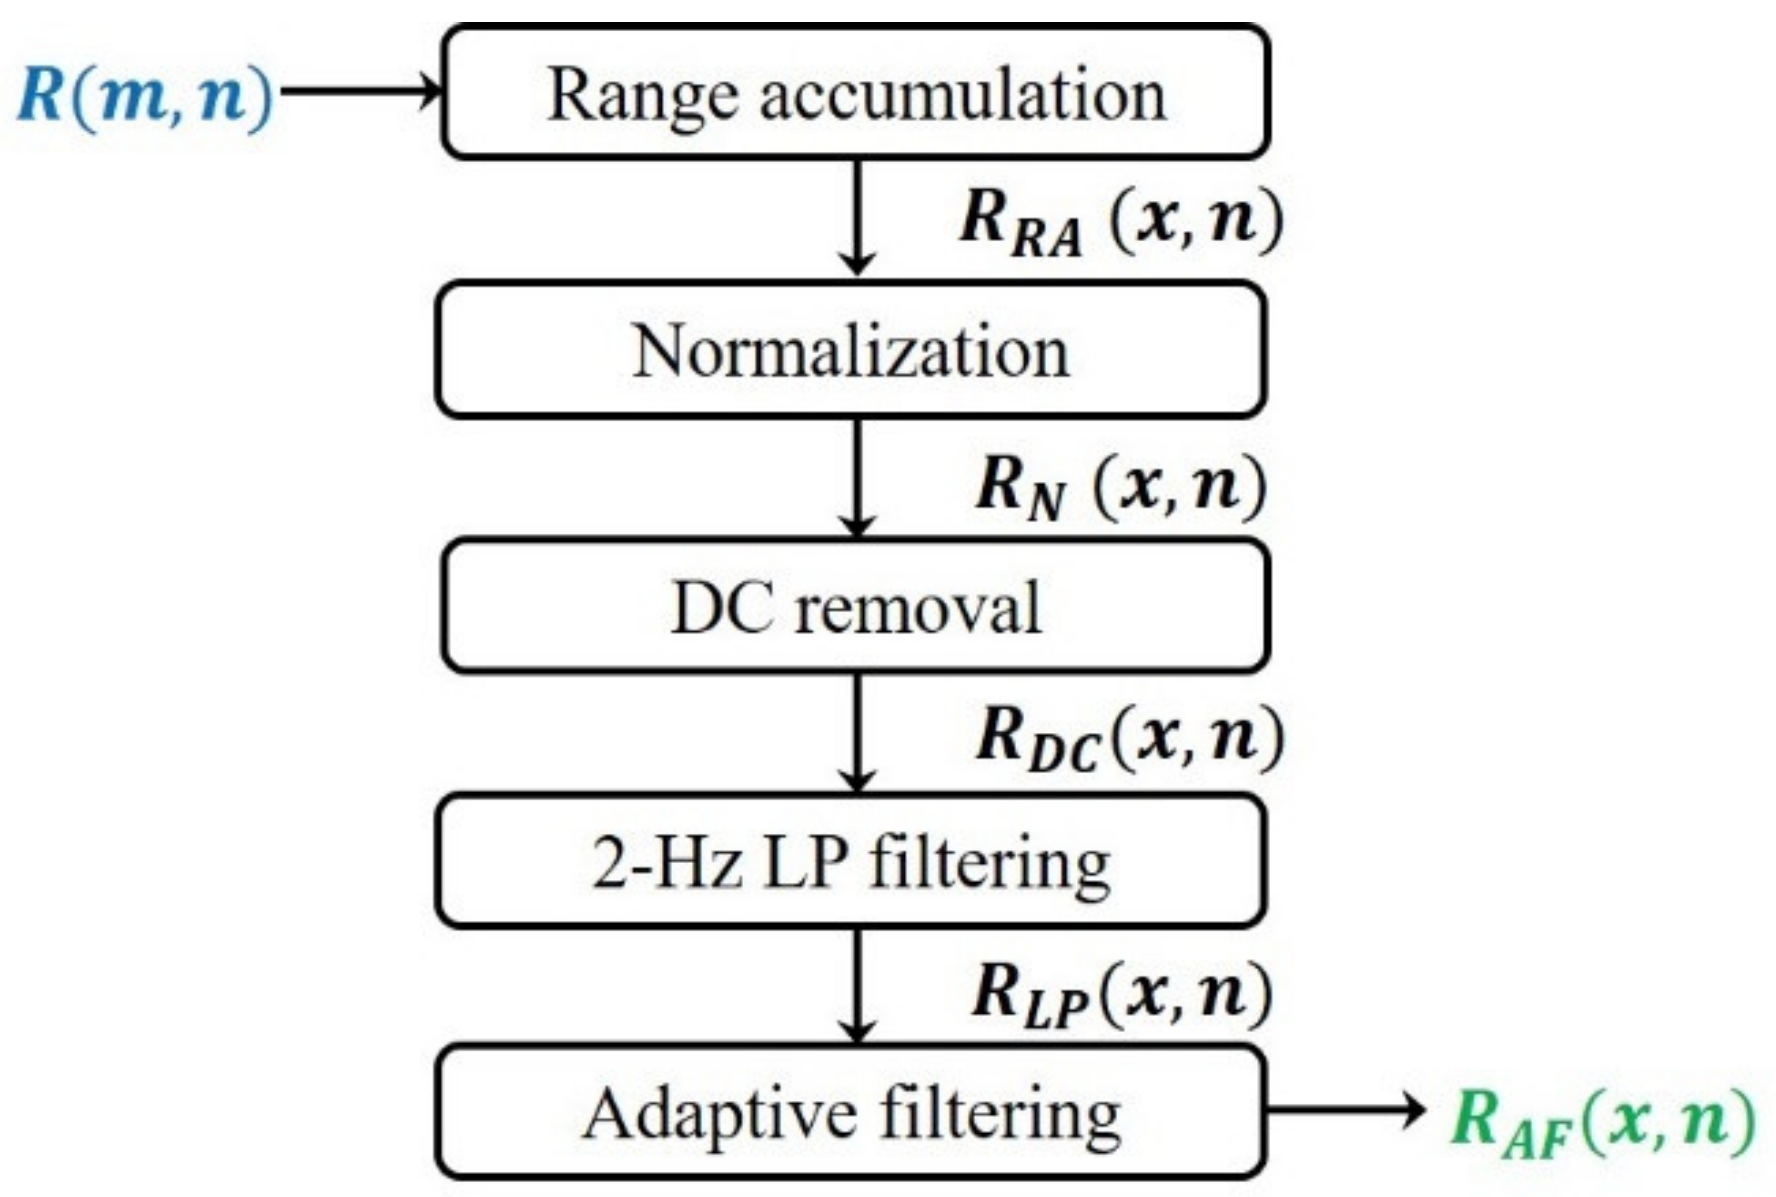
Prior to the application of the algorithm to distinguish humans from mechanical vibrations, five signal preprocessing steps were implemented to reduce the computational complexity and filter clutter. These included range accumulation, normalization along the slow time dimension, direct current (DC) removal, low-pass (LP) filtering at a cutoff frequency of 2 Hz, and least-mean square (LMS)-based adaptive filtering. A flow chart of the signal preprocessing steps is presented in Figure 2.
Range accumulation was implemented to considerably reduce the computational complexity by compressing the number of range points. It is illustrated by
R R A x ,   n = 1 10 m = 10 x 1 + 1 10 x R m , n .
After range accumulation, the range points were compressed from 2048 to 200, namely, x = 1 , 2 , 3 , , X , and   X = 200 . Normalization along the slow-time dimension was then designed to make the energies of the signals from humans and mechanical vibrations comparable, as described by
R N x ,   n = 2 R R A x ,   n min n R R A x ,   n max n R R A x ,   n min n R R A x ,   n 1 .
Subsequently, the DC components and baseline drift were eliminated by DC removal, as implemented by
R D C x ,   n = R N x ,   n 1 100 n n + 99 R N x ,   n .
The high-frequency clutters were then removed using LP filtering with a cut-off frequency of 2 Hz, according to
R L P x ,   n = R D C x ,   n h t ,
where h t denotes the impulse function of the finite impulse response filter [14], and “ ” denotes the convolution operation.
Finally, the human-respiration-like clutter was suppressed by adaptive filtering based on the least-mean square algorithm. This process was described in detail in [15,16]. All the subsequent methods were based on the preprocessed radar data, which are denoted by R A F   x , n . The matrix size is 200 × N , and N depends on the length of the slow time.

3.2. Wavelet Entropy Decompositions

Wavelet transform can provide the time–frequency interpretation of radar data, and entropy is a parameter that quantitatively describes the order/disorder microstates. Wavelet entropy combines the advantages of the wavelet transform and entropy simultaneously [17,18,19]. As the regularity of the signal increases, the value of the wavelet entropy decreases. Thus, after wavelet entropy decomposition of the preprocessed radar data, the corresponding values at the range points of humans and mechanical vibrations are apparently lower because of their periodicity.
To calculate the wavelet entropy, a discrete wavelet transform was performed first to generate a set of elementary functions ψ a , b   t by translations and dilations of the mother wavelet ψ t [20].
ψ a , b t = a 0.5 ψ t b a , s . t .     a , b R ,   a 0 ,
where a denotes the scale for the description of the degree of compression, and b denotes the translation for determining the time location. As the value of a increases, the wavelet becomes narrower. By choosing a = 2 k , b = 2 k n and k = 1 , 2 , , l o g 2 N , the preprocessed radar data R A F t   can be reconstructed as follows:
R A F x , t = k n C k n ψ k , n t ,
where n = 64 t denotes the slow time points, and C k n   denotes the local residual errors between the two adjacent scales of k 1 and k .
The radar data were then divided into nonoverlapping temporal windows with lengths J = 128 . Accordingly, the wavelet energy at each scale degree k of temporal window i = 1 , 2 , , I = N / J can be calculated using
E k i = 1 J n = i 1 × J + 1 i × J C k n 2 .
Subsequently, the relative wavelet entropy E ˇ k at scale k of each temporal window   i is given by
E ˇ k i = E k i k E k i .
Finally, the wavelet entropy at range point x is determined by
W E x = 1 I i E ˇ k i · ln E ˇ k i .
The wavelet entropy of the target is much lower than that of the noise signal, whereas the subsequent CFAR algorithm can only detect targets whose values are much higher than noise. Thus, the wavelet entropy curve is flipped up and down by
W E 1 x = max m W E x min m W E x 2 W E x
W E ^ x = W E 1 x min m W E 1 x ,
where W E 1 x   is an intermediate variable, and W E ^ x is the flipped value of W E x .

3.3. ICMLD-CFAR

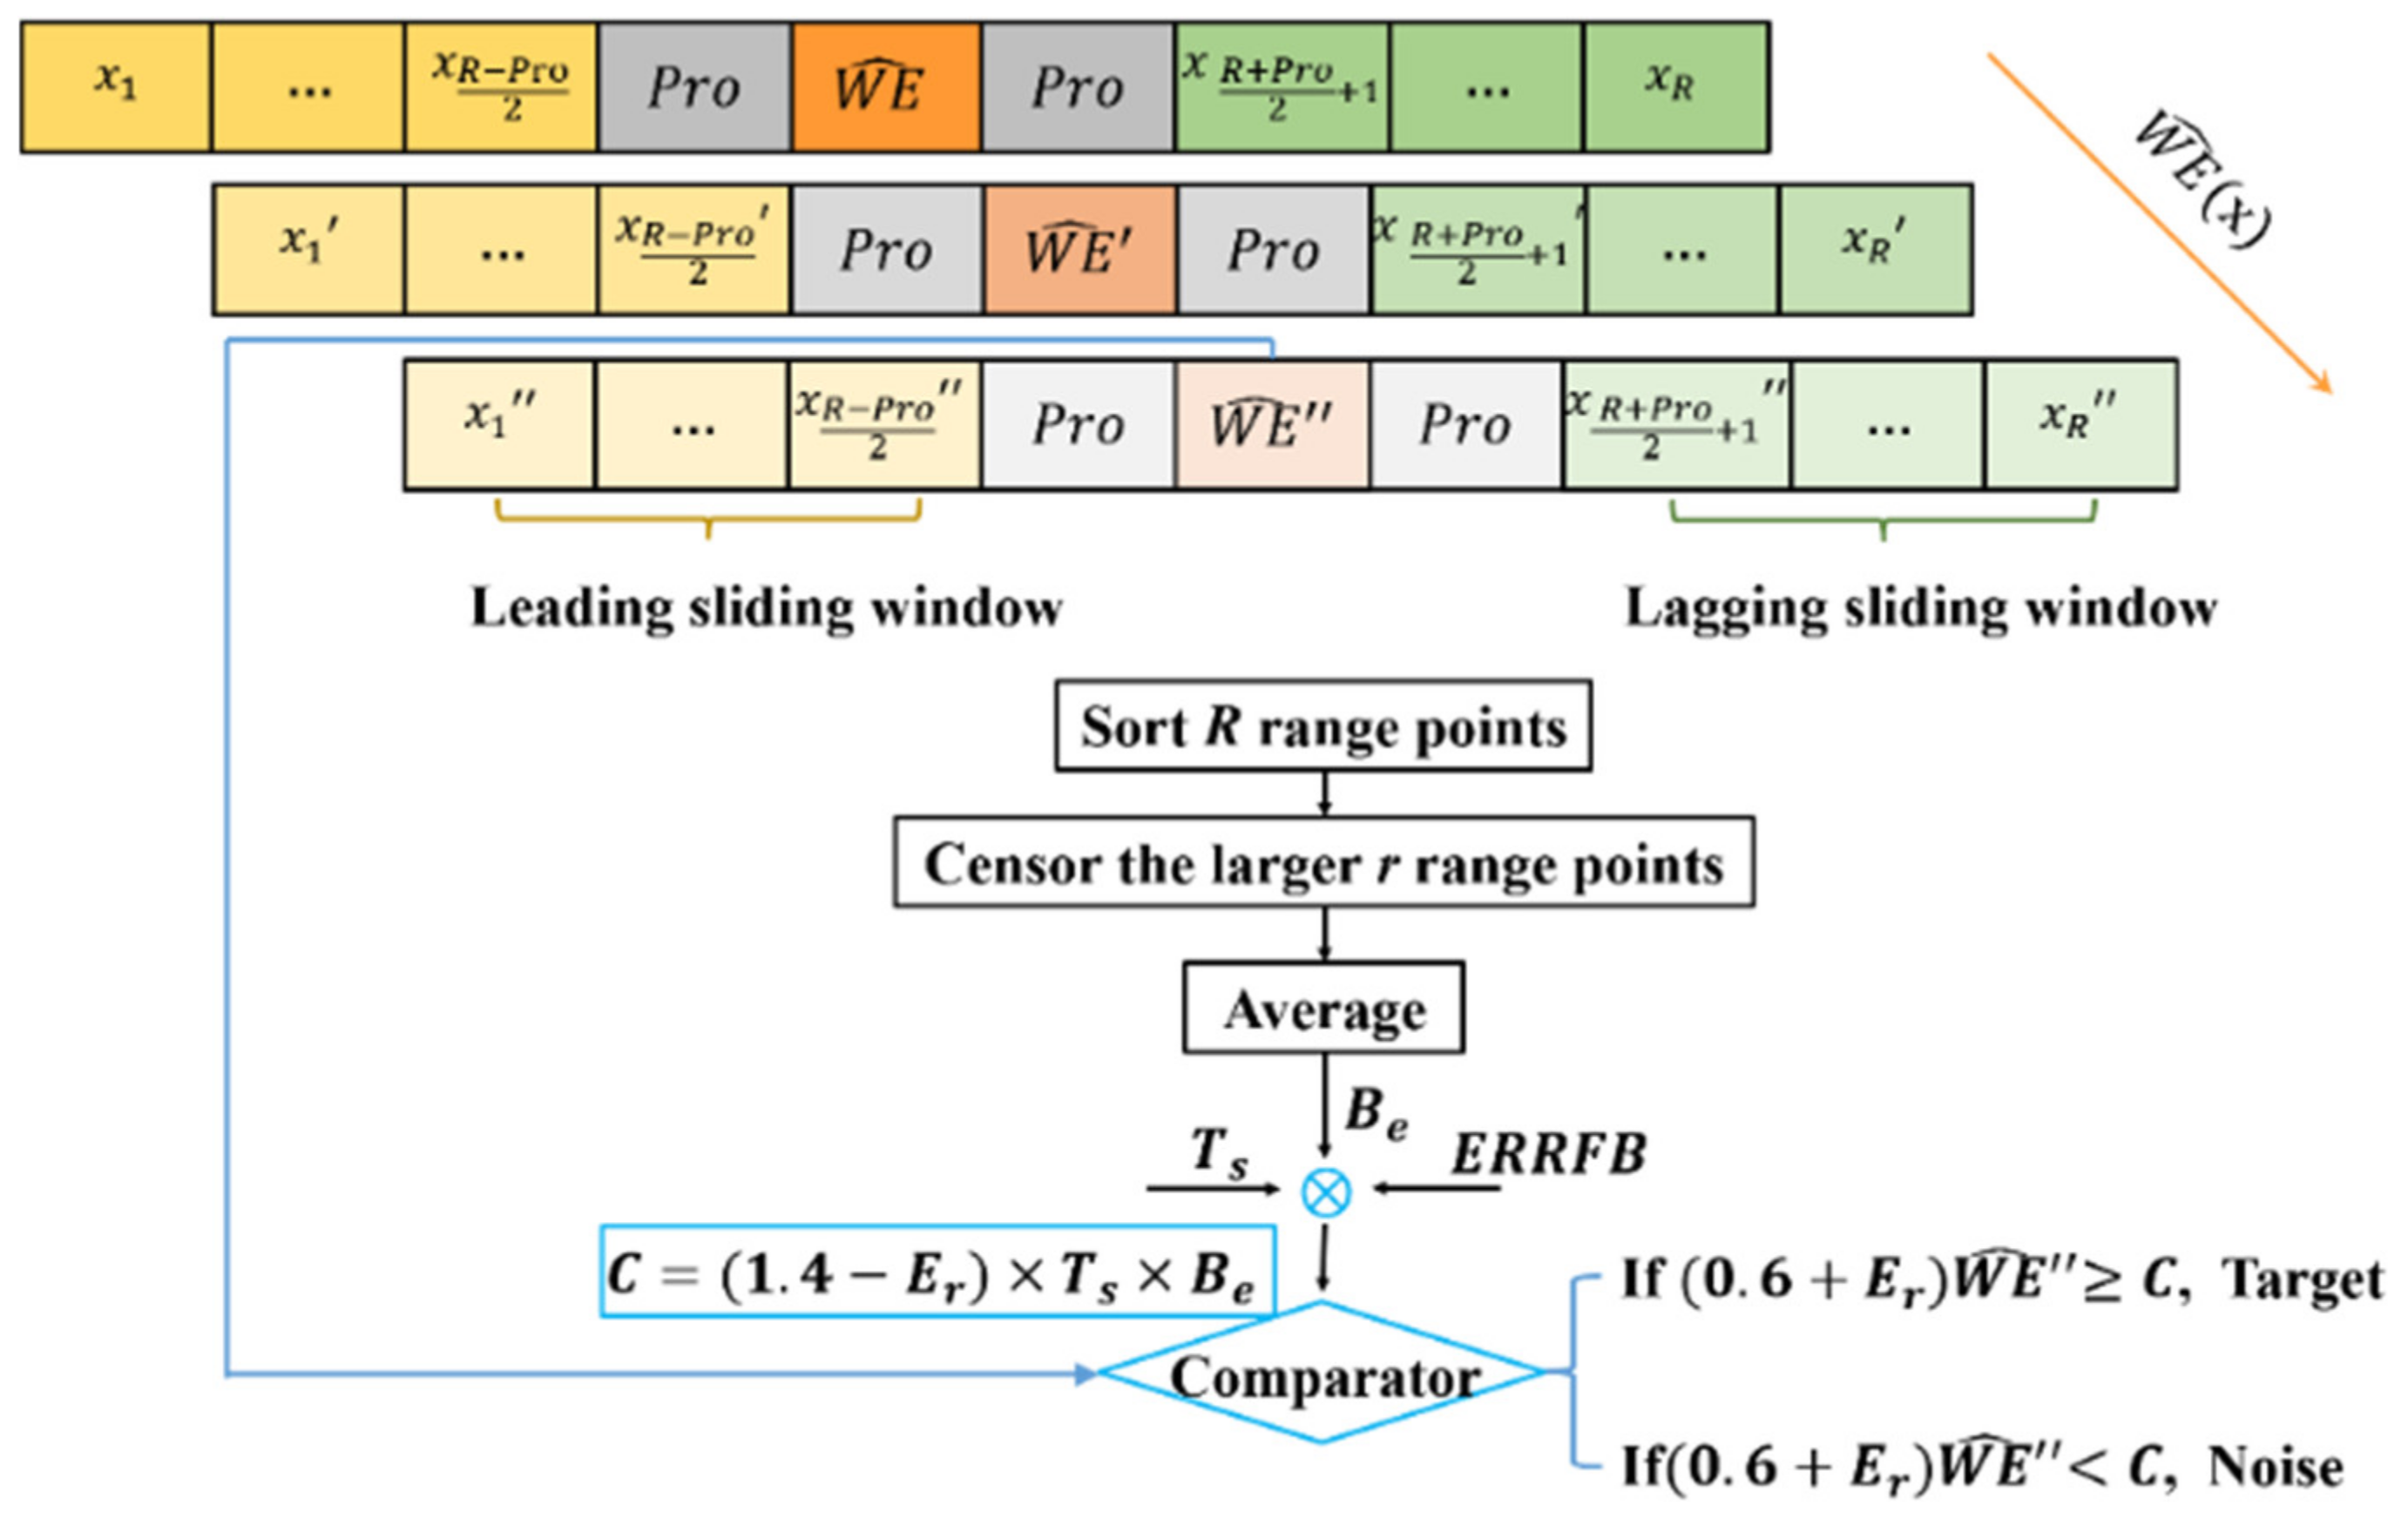
The CFAR algorithm is designed to automatically detect targets and simultaneously control the false alarm rate [21,22,23]. CMLD is a CFAR algorithm and is especially suitable for multitarget detection environments [24,25]. Unlike the mean-level detector, CMLD-CFAR censors several of the largest samples of the maximum likelihood estimate of the background noise level [26]. If the value of the range point subjected to testing is higher than the estimated background level, the range point is preliminarily determined as the target position. Otherwise, it is considered to be a nontarget signal, namely, noise. Herein, a novel feature is added to enlarge the difference in values between the range points at the target positions and noise positions. Therefore, the targets can be distinguished in an easier and more accurate manner. Figure 3 illustrates the block diagram of the improved CMLD-CFAR algorithm.
First, to test whether a range point of W E ^ is a target, a sliding window of length R is determined. It is symmetrically distributed on both sides of the range point W E ^ x . Because of the thickness of the human chest, the trailing effect [27] can lead to signal range points adjacent to W E ^ x within a certain window, which are similar to the target signal. Therefore, a protective window of length P r o is designed to avoid the use of these range points to estimate the noise level, and thus decrease the misjudgment rate. The remaining R P r o range points are then sorted, and larger r points are censored. The remaining R P r o r range points are then averaged as the estimate of the background noise level as follows:
B e x = 1 R P r o r x = 1 R P r o r W E ^ x ,
where B e x represents the estimate of background noise level. Subsequently, the threshold factor T s of ICMLD-CFAR is calculated using the R ,   r ,   and   P r o , and the false alarm rate P f a can be estimated as follows:
P f a = u = 1 R P r o r v 1 u T s + v 2 u ,
where v 1 u and v 2 u are two intermediate variables defined by
v 1 u = 1 u 1 R P r o r R P r o r u 1 R P r o r u + 1 r R P r o r 1 .
v 2 u = R P r o u + 1 R P r o r u + 1 .
The value of P f a was set as a fixed constant value. Thus, T s can be calculated iteratively using Equations (13)–(15). Herein, we set P f a = 10 5 , R = 48 , r = 3 5 R , and P r o = 8 . To further improve the detection performance of the ICMLD-CFAR, the energy ratio in the reference frequency band ( E r ) was designed to enlarge the difference between the target signals and noise. First, ensemble empirical mode decomposition (EEMD) was implemented on the preprocessed radar signal R A F x ,   n . A set of intrinsic mode functions (IMFs) can be decomposed from the preprocessed signal at different characteristic scales [28,29,30]. By eliminating the unwanted noise IMFs and reconstructing them, the radar signal can become much clearer. This was accomplished according to the following steps:
While ( p 50 ) {
  • Add a series of random white noise signals N w j to R A F x ,   n using
    R ˜ A F x ,   n = R A F x ,   n + N w p ,
    where   p = 1 , 2 , , P   represents the number of the added white noise signals.
  • Decompose the R ˜ A F x ,   n into a set of I M F s as
    R ˜ A F x ,   n = q = 1 Q p I M F q , p + N w p ,
    where Q p denotes the decomposed order numbers of   I M F s at trail p . }
  • Regard the Q m i n = min p Q p as the final order number of I M F s and then calculate the EEMD results by averaging the IMPs of all P trails as
    I M F q = 1 P p = 1 P I M F q , p ,
    where q = 1 , 2 ,   ,   Q m i n .
  • Eliminate the noise I M F s based on the discrimination criteria listed below
    β q =               0 ,                   q = 1 f = 1 q 1 τ f q 1 τ q 1 ,     q = 2 , 3 , ,   Q m i n ,
    τ q = g l g r D a s q , g 2 g D a s q , g 2 ,
    where β q denotes the energy concentration of the q -order IMF, D a s q , g denotes the discrete autocorrelation sequence of the q -order I M F , g = 1 , 2 , , g l , g r , , G denotes the time sequence, and g l , g r denotes the two middle points, namely, g l = G / 2 . Moreover, τ q represents the energy ratio of D a s q , g in the interval g l , g r . If β q 2 , the I M F q is used to denote unwanted noise I M F s.
  • Reconstruct the radar signal using
    R ^ A F x ,   n = q Q m i n I M F q ,     s . t .   β q > 2 ,
    where “s.t.” means subject to.
  • Calculate the energy ratio on the reference frequency band of human respiration and digging motion of the shovel of the wheel loader using
    E r x = E r f e x E t o t a l x ,  
    where E t o t a l x represents the total energy of R ^ A F x and is calculated by E t o t a l x = n R ^ A F x ,   n 2 , and E r f e x represents the energy in the reference frequency band. Herein, the reference frequency band is set to 0.2–0.4 Hz. The E r x value for human targets is usually higher than 40%, whereas that of the noise is less than 12% [31]. Our experimental results show that the E r x value for mechanical vibrations is mostly larger than 40%. Thus, the value of ( 1.4 E r x ) of the human targets and mechanical vibrations are smaller than one, and that of noise is larger than one. Therefore, the difference between targets and noise can be enlarged by the multiplication operation. As shown in Figure 3, whether a range point is a target can be determined by
    C x = ( 1.4 E r x ) × T s × B e x ,  
    i f         0.6 + E r x × W E ^ x C ,   i t   i s   d e t e r m i n e d   a s   t a r g e t   p r e l i m i n a r l y .   i f         0.6 + E r x × W E ^ x < C ,   i t   i s   d e t e r m i n e d   a s   n o i s e   p r e l i m i n a r l y .  
    where C x denotes a threshold as the criterion for detecting targets preliminarily.
As it was mentioned, the trailing effect can cause the value of range points adjacent to the real target position to be similar. Thus, some adjacent range points, which are actually from the same target, are usually determined preliminarily as targets at the same time. To prevent interferences in this situation, only the range point of the maximum value of W E ^ within the adjacent range points is regarded as the target position. Simultaneously, the interval between two adjacent real targets should not be smaller than two range points (approximately equal to the anterior–posterior dimension of an average human adult body).

3.4. Feature Extraction

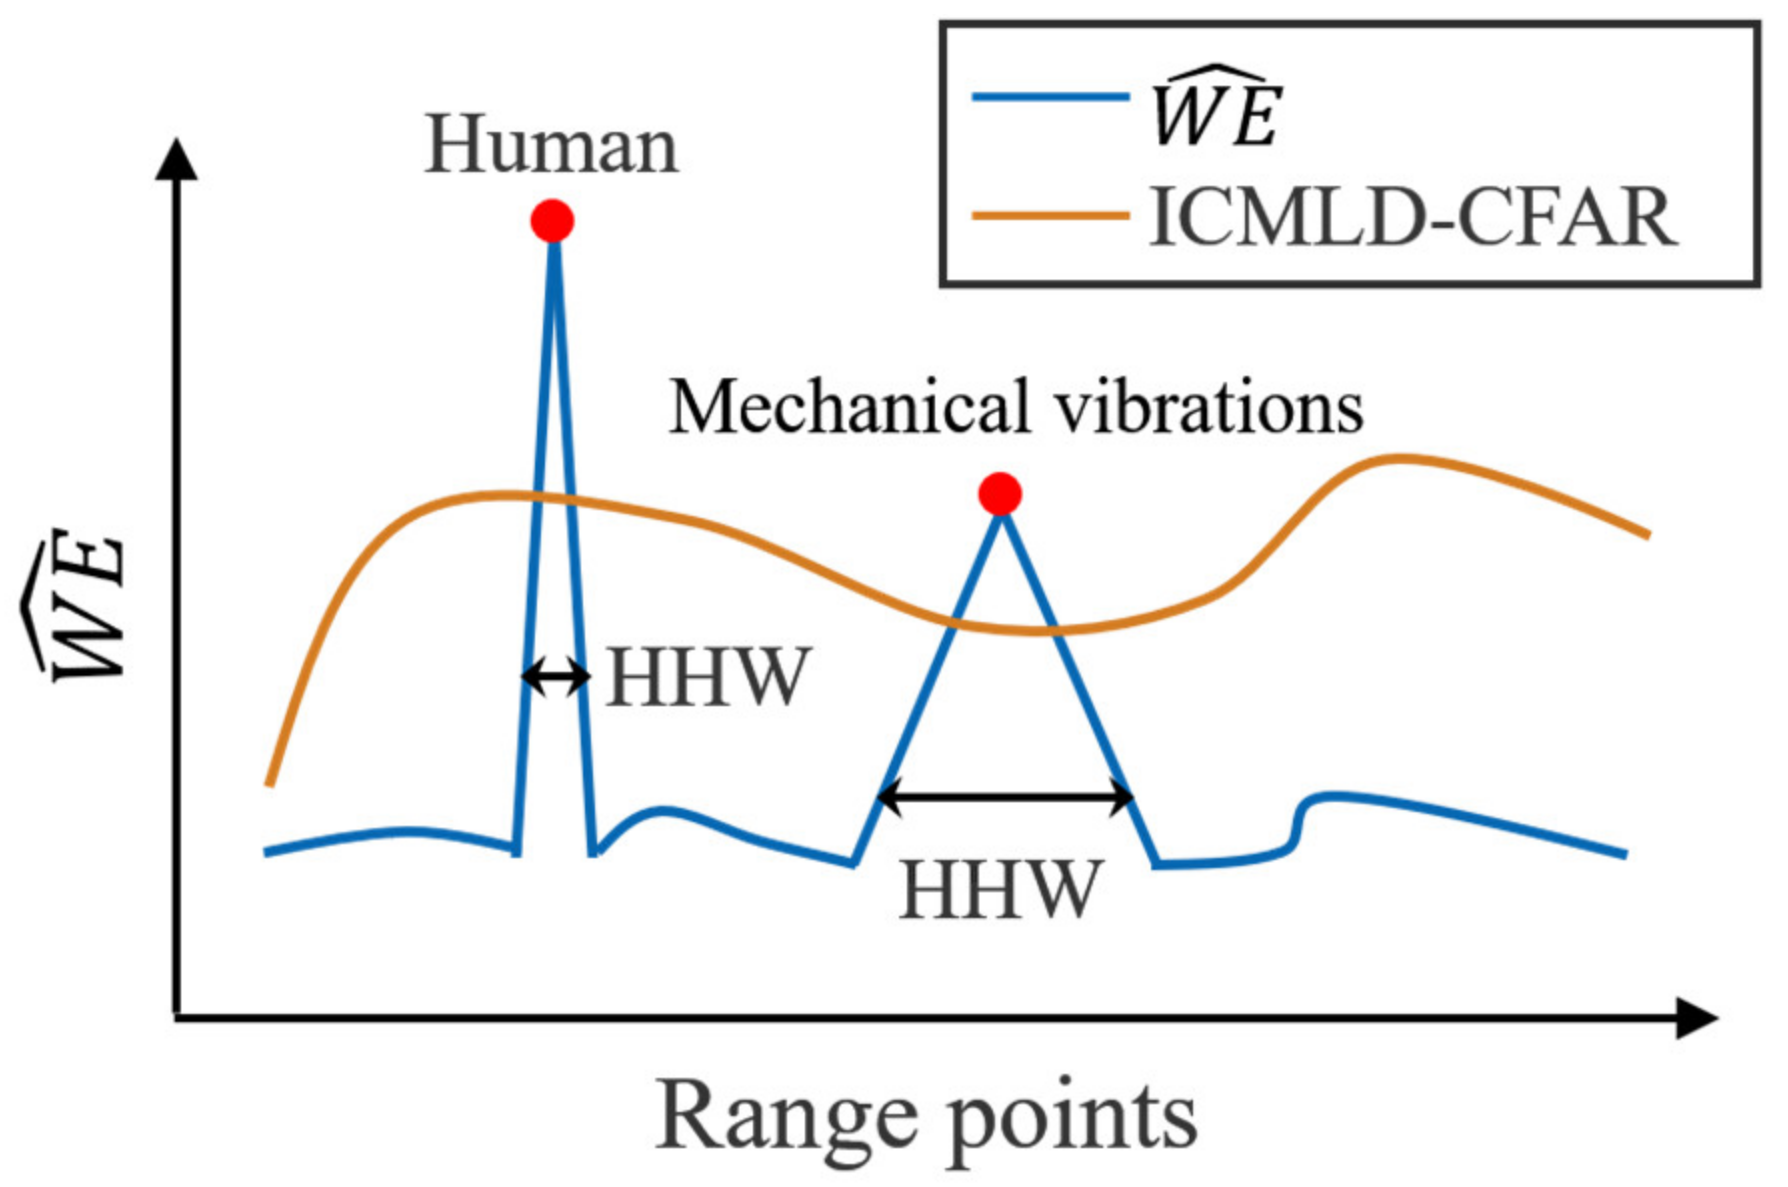
To accurately distinguish human targets from mechanical vibrations, a novel feature, HHW, is proposed, as illustrated in Figure 4.
After the calculation of W E ^ and ICMLD-CFAR, the positions of the human targets and mechanical vibrations were determined. Usually, they are located at the local maximum range points. In other words, there are curve crests on W E ^ near the range points of human targets and mechanical vibrations. It was found that the width of the crests of human targets is usually much wider than that of mechanical vibrations. Thus, the H H W is designed to reflect this type of difference based on the following expression,
H H W = R p L p ,   s . t .   W E ^ R p = W E ^ L p = W E ^ x t a r g e t s 2 ,     R p > L p
where x t a r g e t s denotes the range points determined preliminarily as targets by the ICMLD-CFAR, and R p and L p denote the range points, where the W E ^ value is half of the value of the corresponding target position.

4. Experimental Scenarios

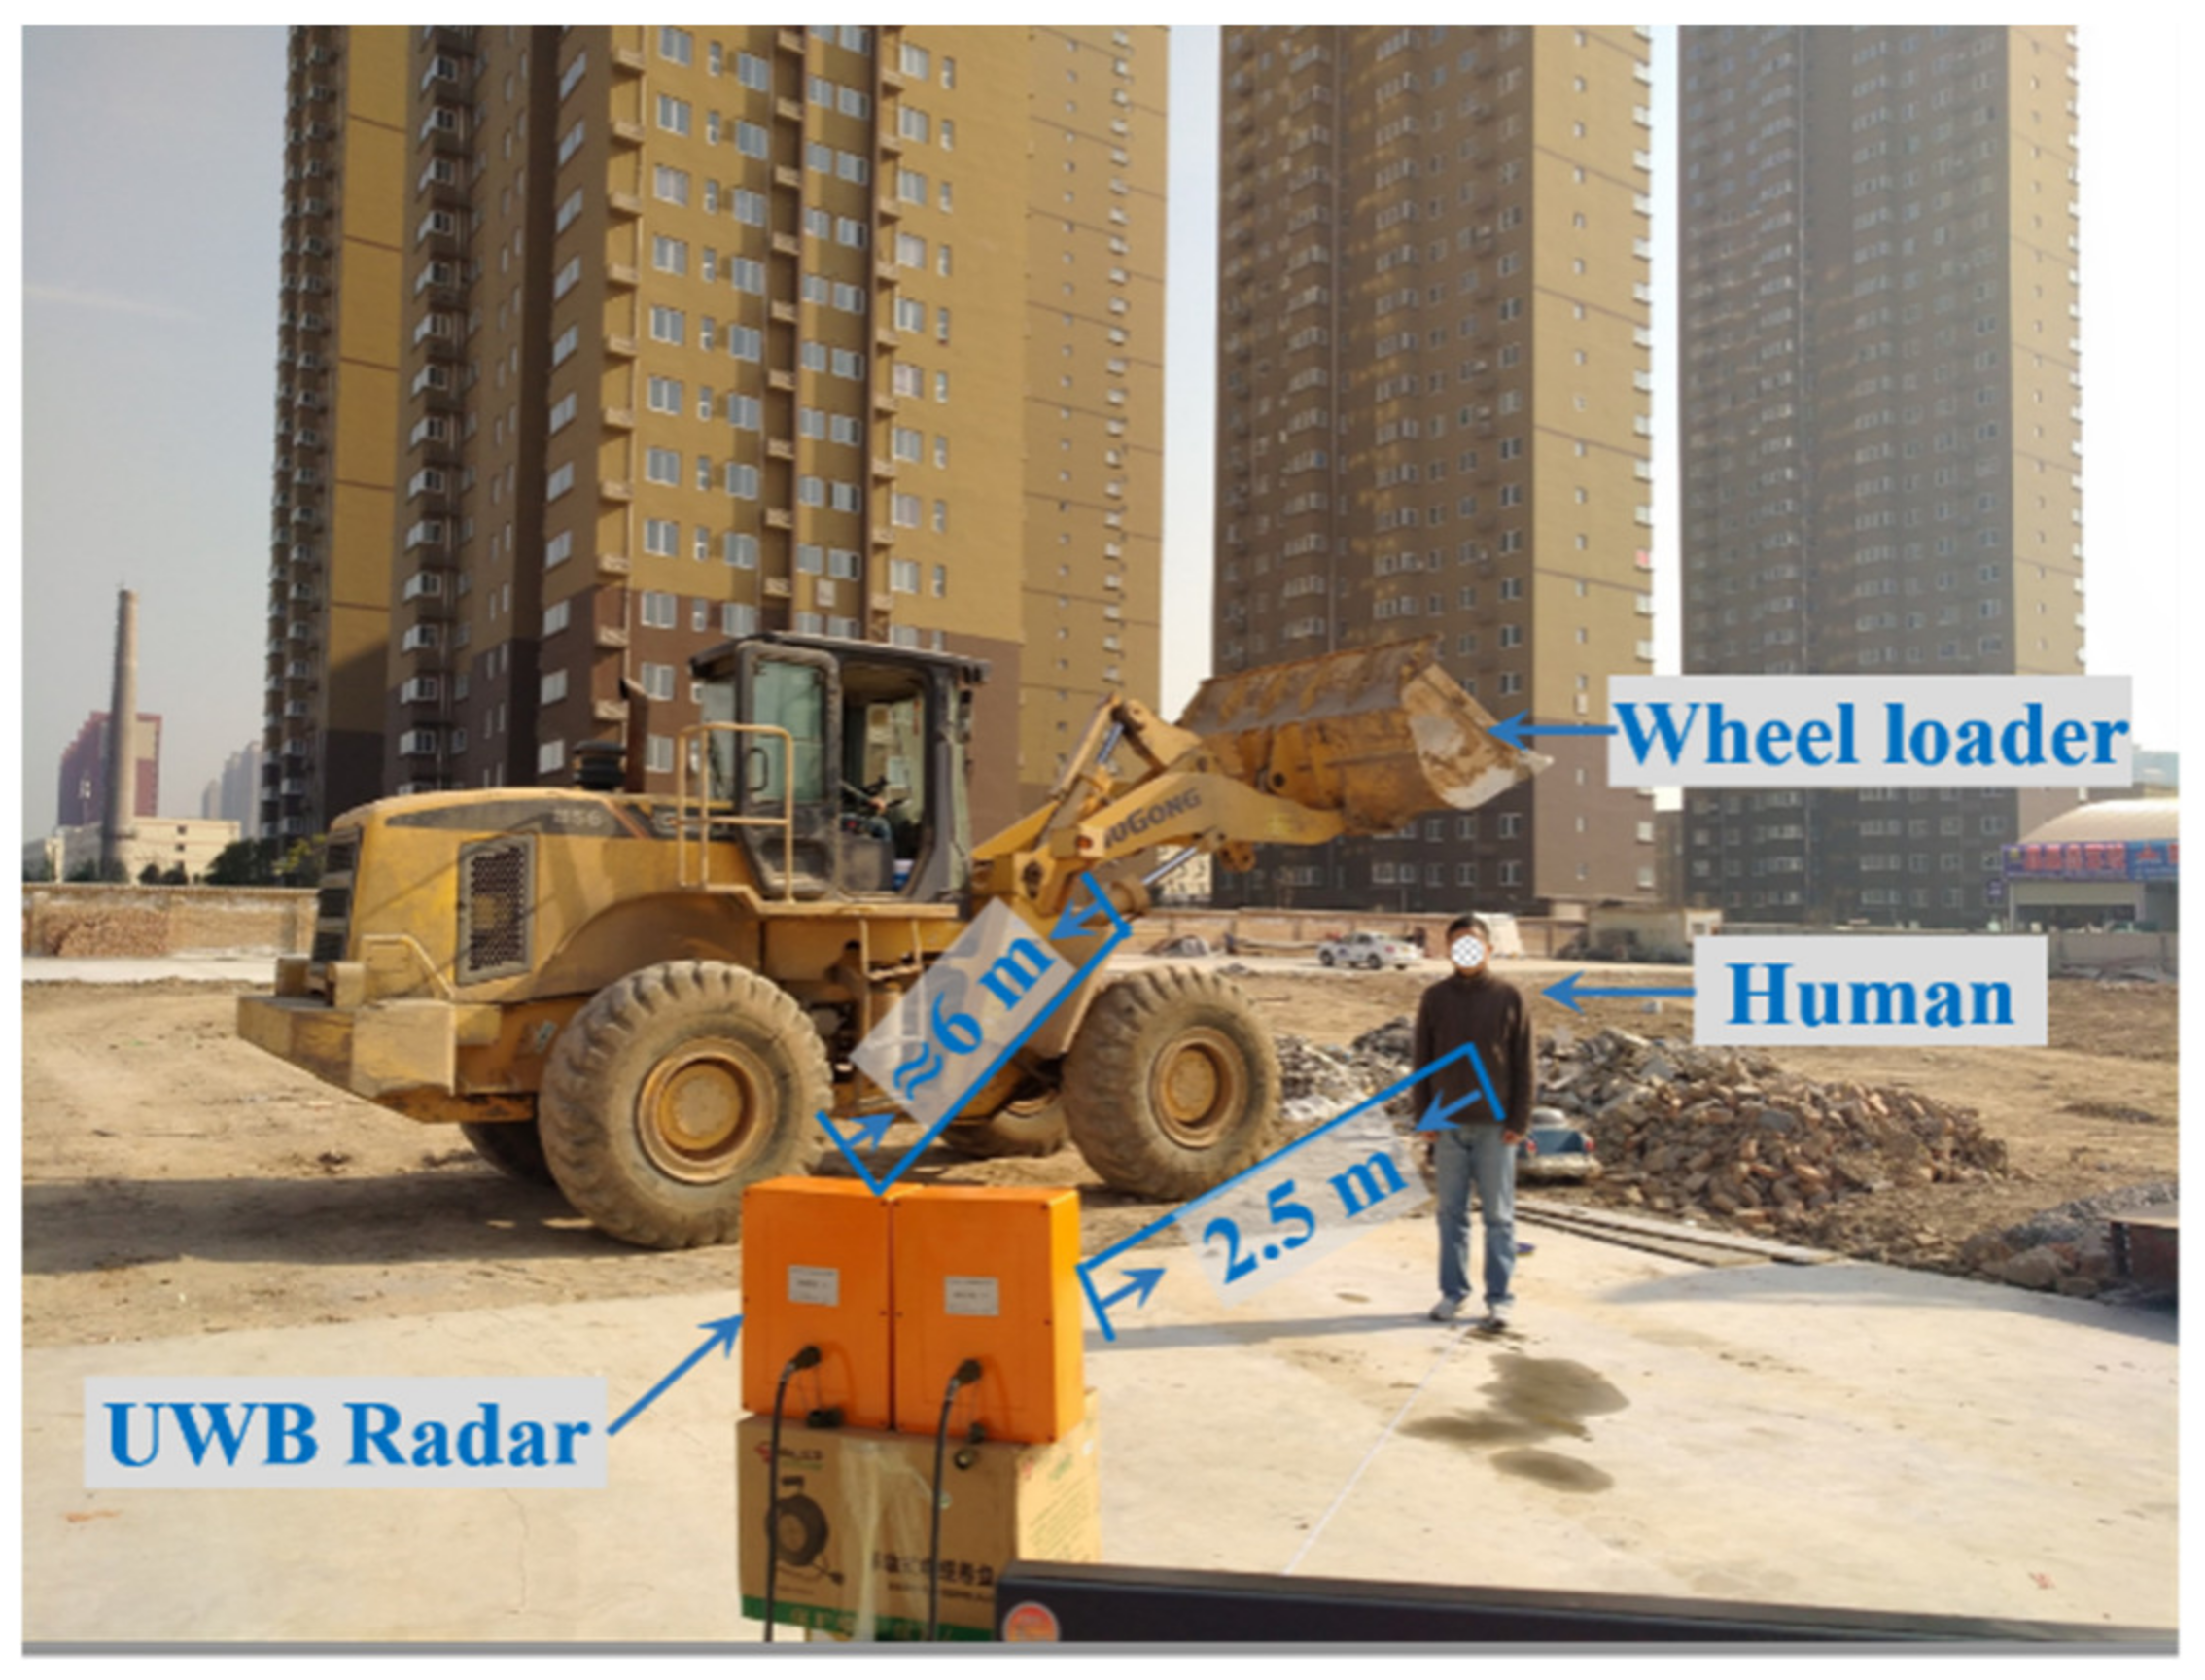
As illustrated, construction machineries are necessary to destroy or remove ruins during postdisaster emergency rescues. Herein, a LiuGong-856 wheel loader, one of the most commonly utilized construction machineries in China, was deployed. The experimental scenarios are illustrated in Figure 5. The wheel loader was located approximately 4–8 m from the UWB radar location. Simultaneously, a male adult stood stationary at approximately 2.5 m from the UWB radar to emulate the rescue scenarios, whereby human and construction machineries coexist within a very close distance range. Two male targets aged 43 and 28 years old, respectively, participated in the experiment. Both targets were measured 5 times, and the data acquisition time was 40 s per time. Thus, there were ten groups of radar data in total. Informed consent was sought from all human subjects, and the experiment was approved by the Ethics Committee of Air Force Medical University.

5. Results

5.1. Energy Spectral Density Comparisons of Construction Machinery in Idling, Digging, and Moving Modes

Typically, there are three single working modes: (1) idling mode, wherein only the engine of the machinery runs without any load, (2) digging mode, wherein the shovel swings owing to loading and unloading while the fuselage remains stationary, and (3) moving mode, wherein the fuselage moves forward and backward. In the pre-experiments, to test whether the frequency band of the construction machinery overlaps that of human respiration (0.2–0.4 Hz), the frequency spectra of the construction machinery at different working modes were analyzed. The energy spectral density ( E S D ) can illustrate how the energy of the radar signal is circulated with frequency [31]. It is defined by
E S D = R A F f 2 d f ,  
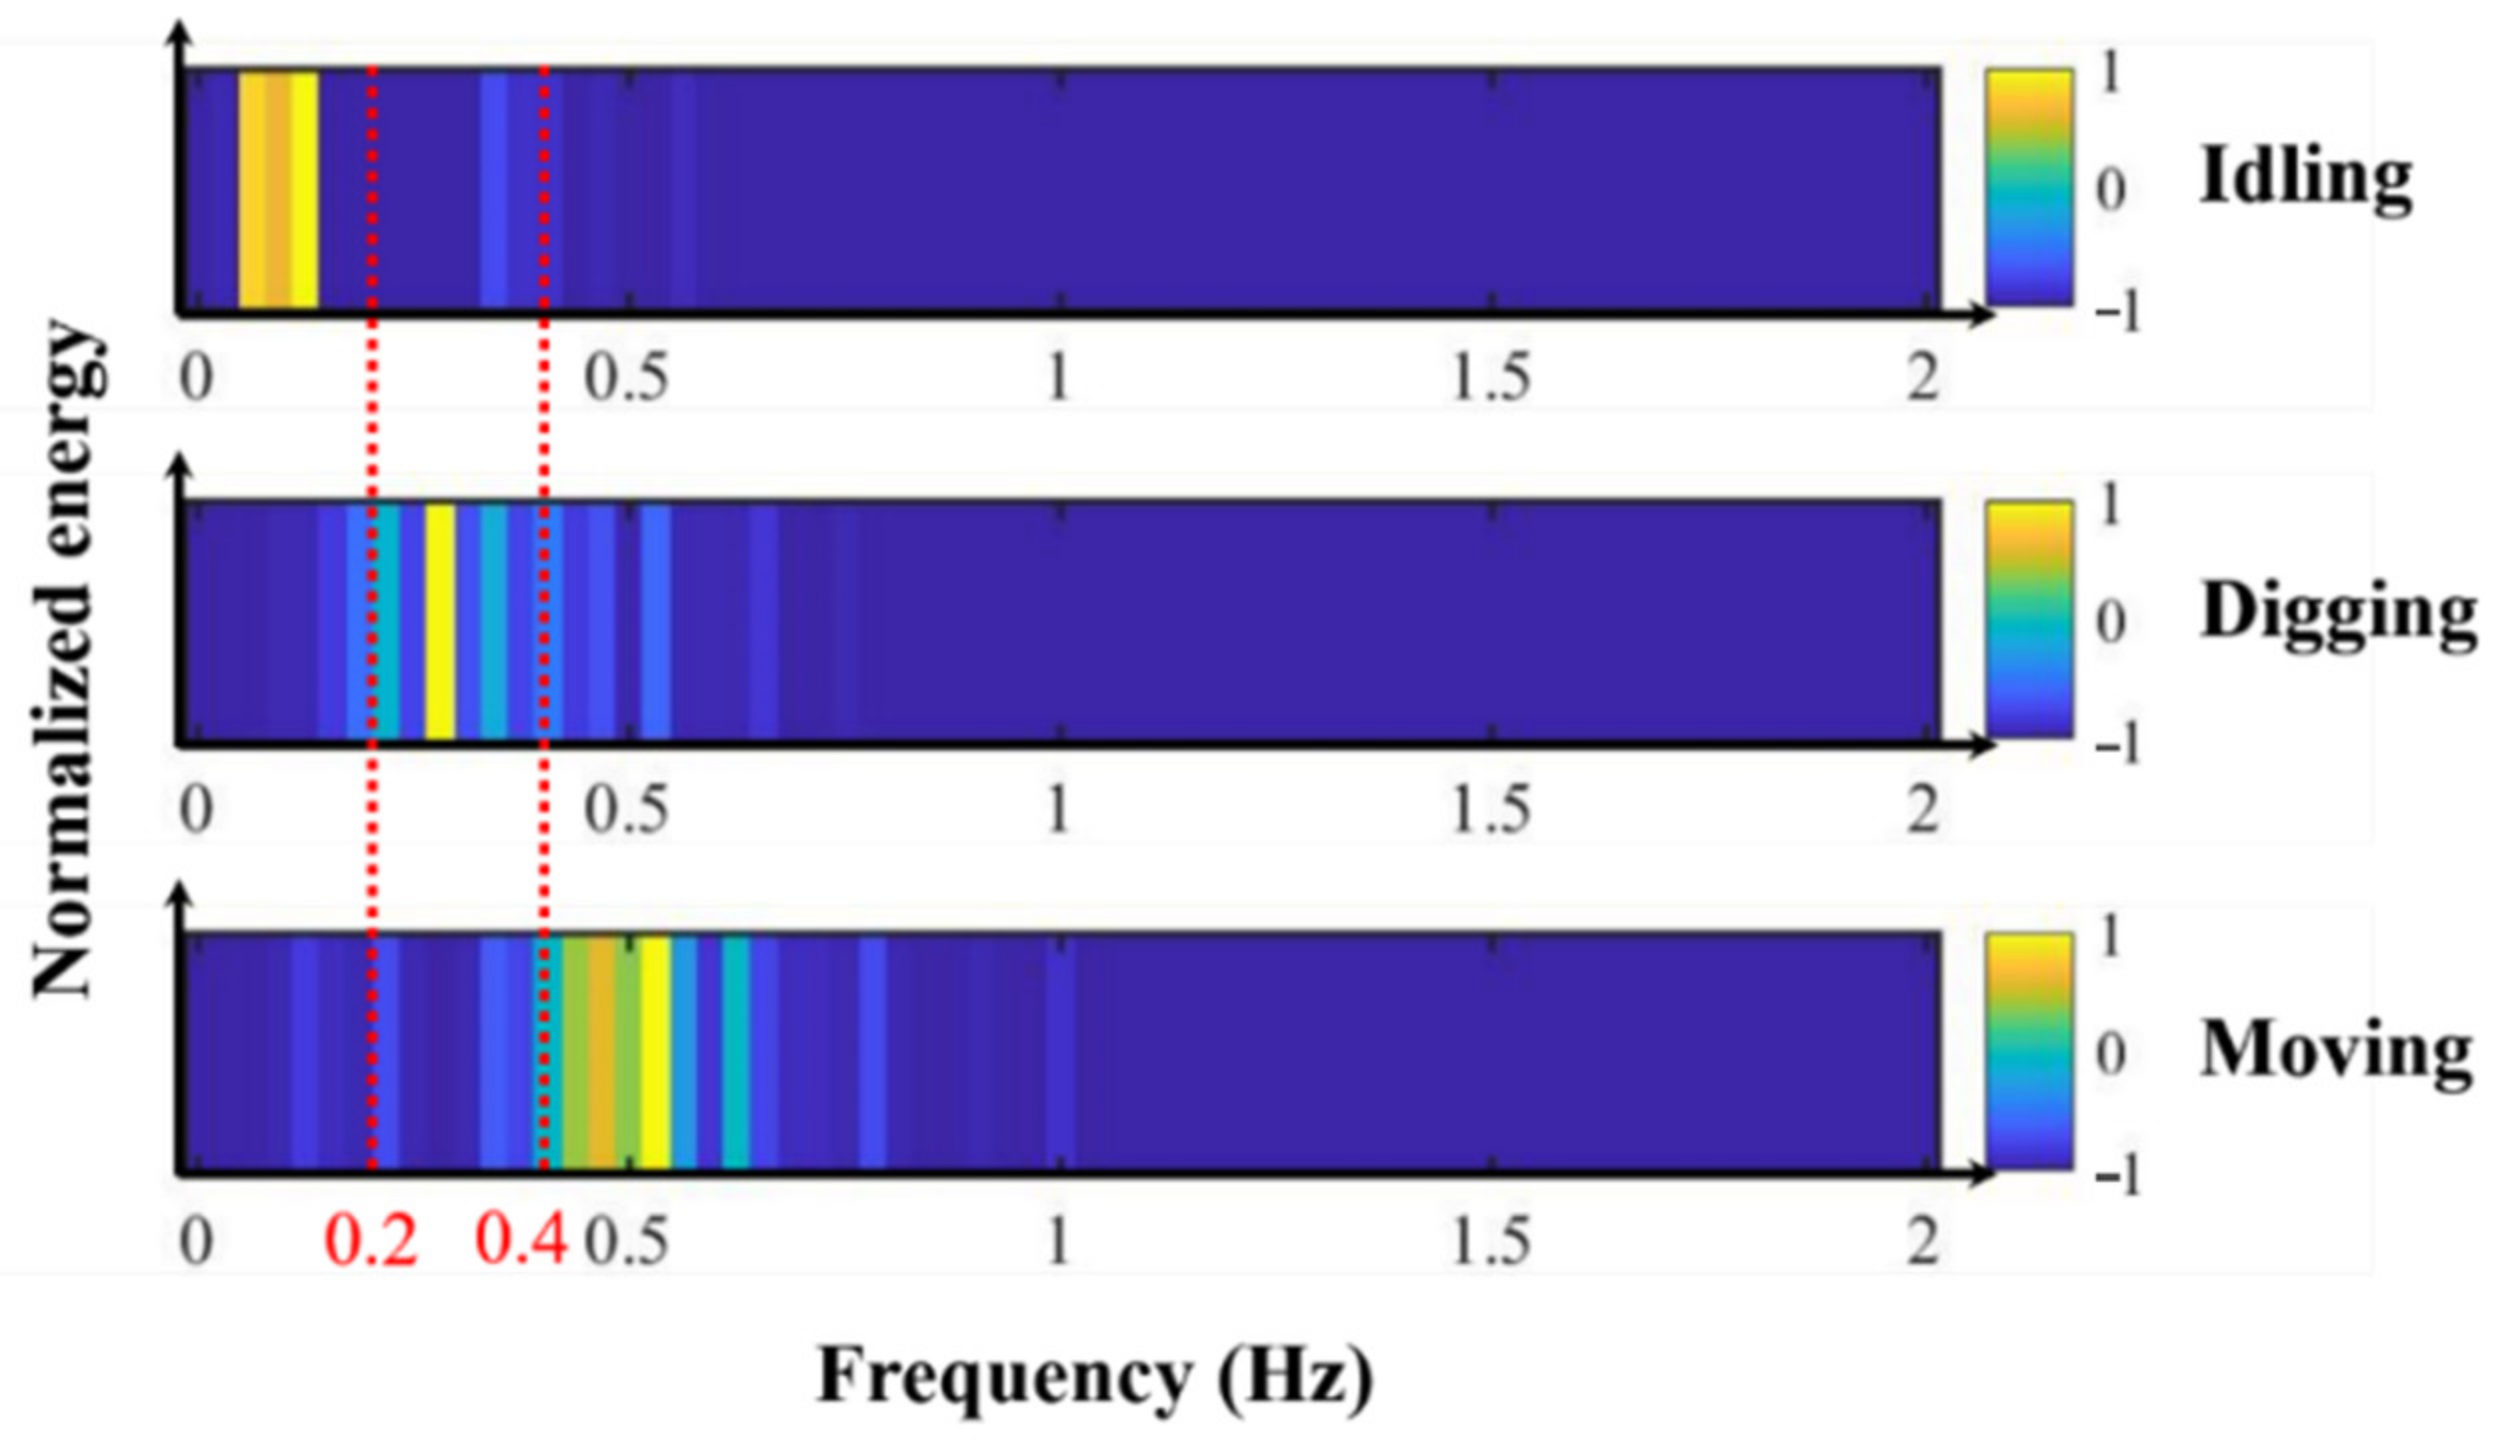
where R A F f represents the fast Fourier transform of the preprocessed radar signal. The typical E S D of construction machinery in idling, digging, and moving modes is shown in Figure 6. For the idling and moving modes, most of the energy is concentrated in the frequency ranges of 0–0.2 Hz and 0.4–0.6 Hz, respectively. However, the energy of the digging mode is mostly distributed in the range of 0.2–0.4 Hz, which overlaps with the frequency band of human respiration. The energy ratios in the frequency range of 0.2–0.4 Hz of the idling, digging, and moving modes in Figure 6 were 6.42%, 71.50%, and 9.49%, respectively. Thus, the digging modes of the construction machinery can induce cofrequency interference when searching for humans during a postdisaster rescue. Herein, it was chosen as the classification target.

5.2. Results of Signal Preprocessing, Wavelet Entropy Decomposition, and ICMLD-CFAR

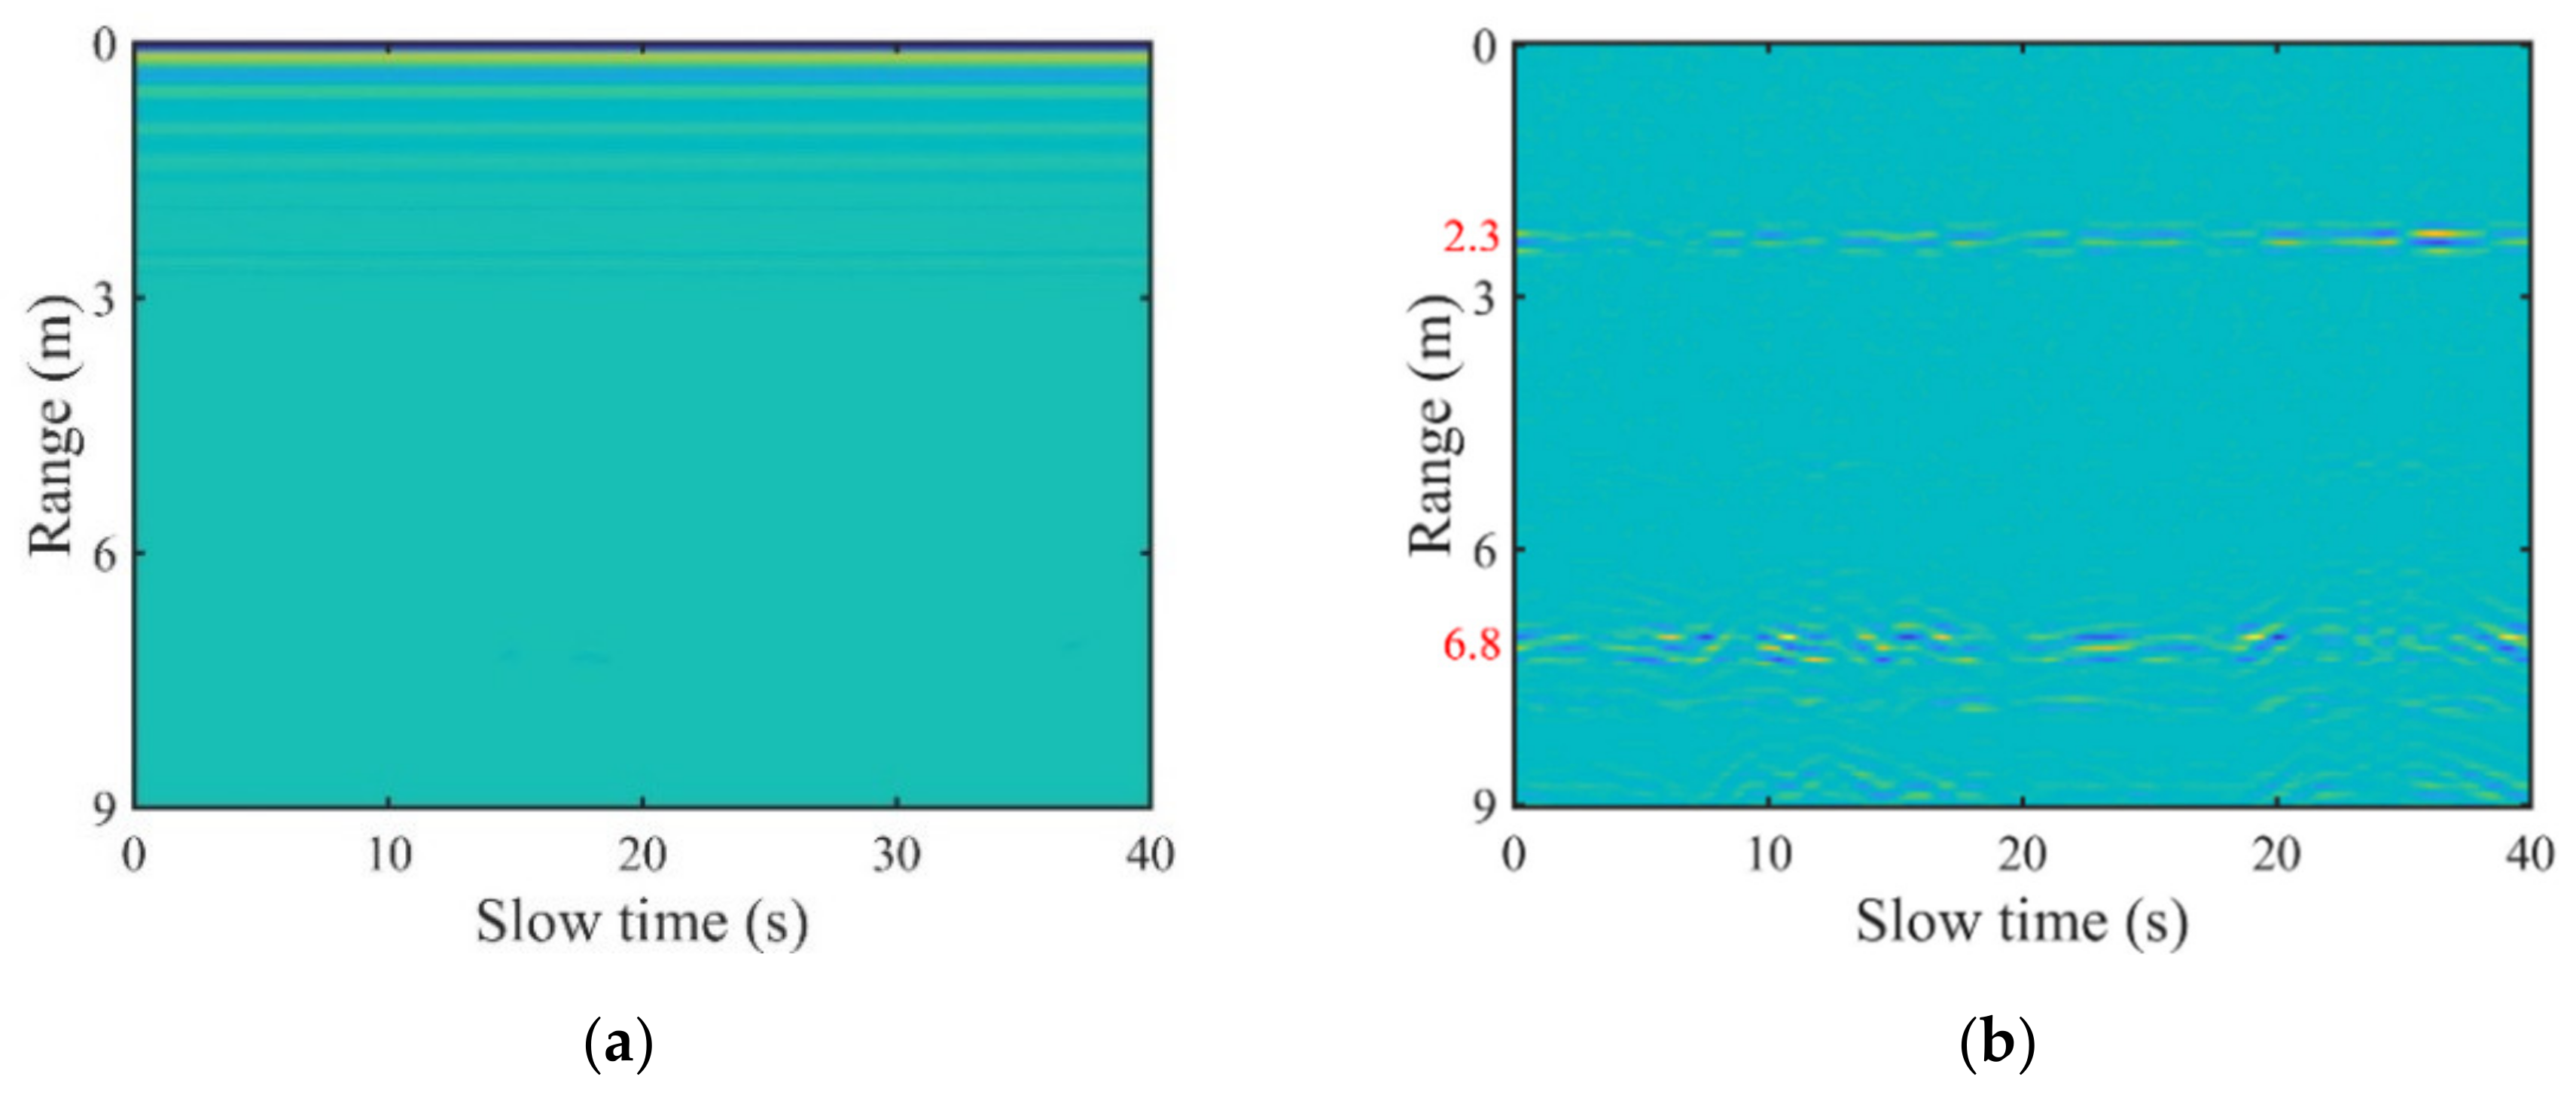
The two-dimensional pseudocolor image of the raw and preprocessed radar data for the experimental scenario in Figure 5 is shown in Figure 7.
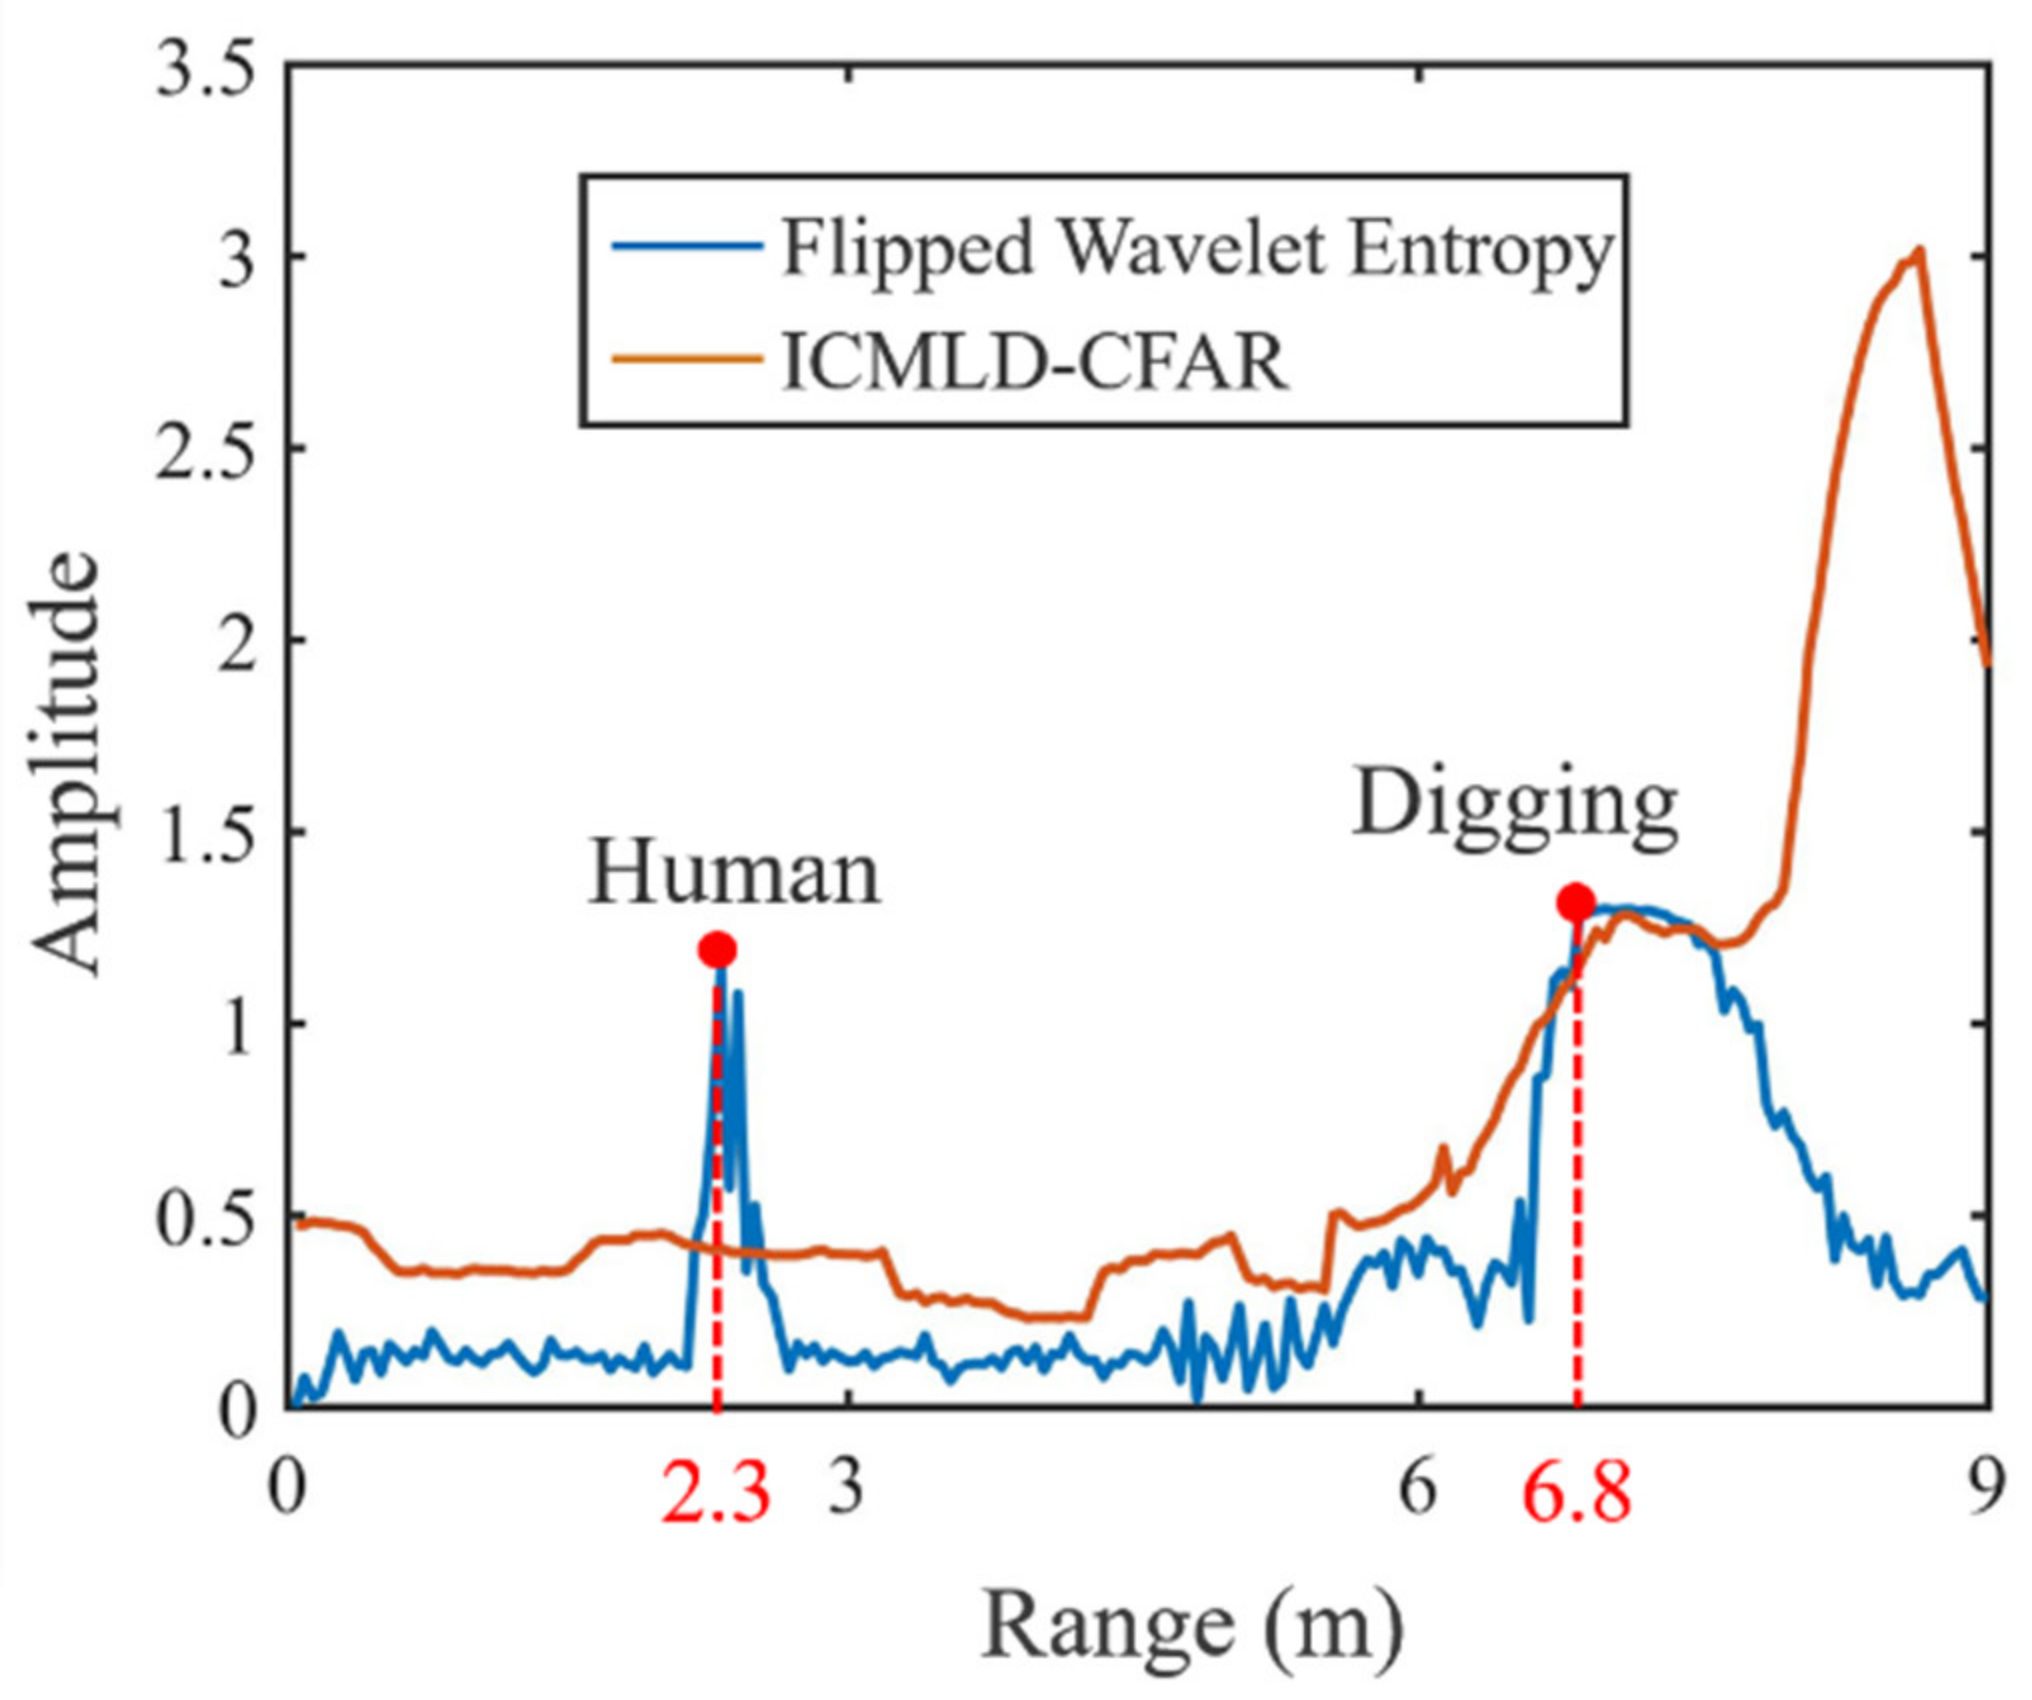
After preprocessing, the size of the radar data is compressed from [2048, 40×64] to [200, 40×64]. The wavelet entropy decomposition and ICMLD-CFAR are then converted to the preprocessed radar data, as illustrated in Figure 8.
At 2.3 m and 6.8 m, the values of many range points of the flipped wavelet entropy are larger than those of the corresponding values of ICMLD-CFAR. Thus, the points with the maximum wavelet entropy values were considered as the target positions.

5.3. Results of Distinction

After determining the target position, a novel feature of HHW was extracted to identify the human target from the construction machinery. A total of 10 groups of radar data were collected from the same construction machinery and human target. The measurement interval of each data acquisition was more than 5 min, and the positions of the human changed slightly within the range of 2–4 m each time. Moreover, the continuous digging action of construction machinery can change to some degree each data acquisition. Therefore, the states of the targets and the environmental interference were not identical for each data acquisition. Thus, the 10 groups of radar data can be regarded to arise from different datasets. The HHW values of the 10 groups of radar data for humans and the digging construction machinery positions are listed in Table 2.
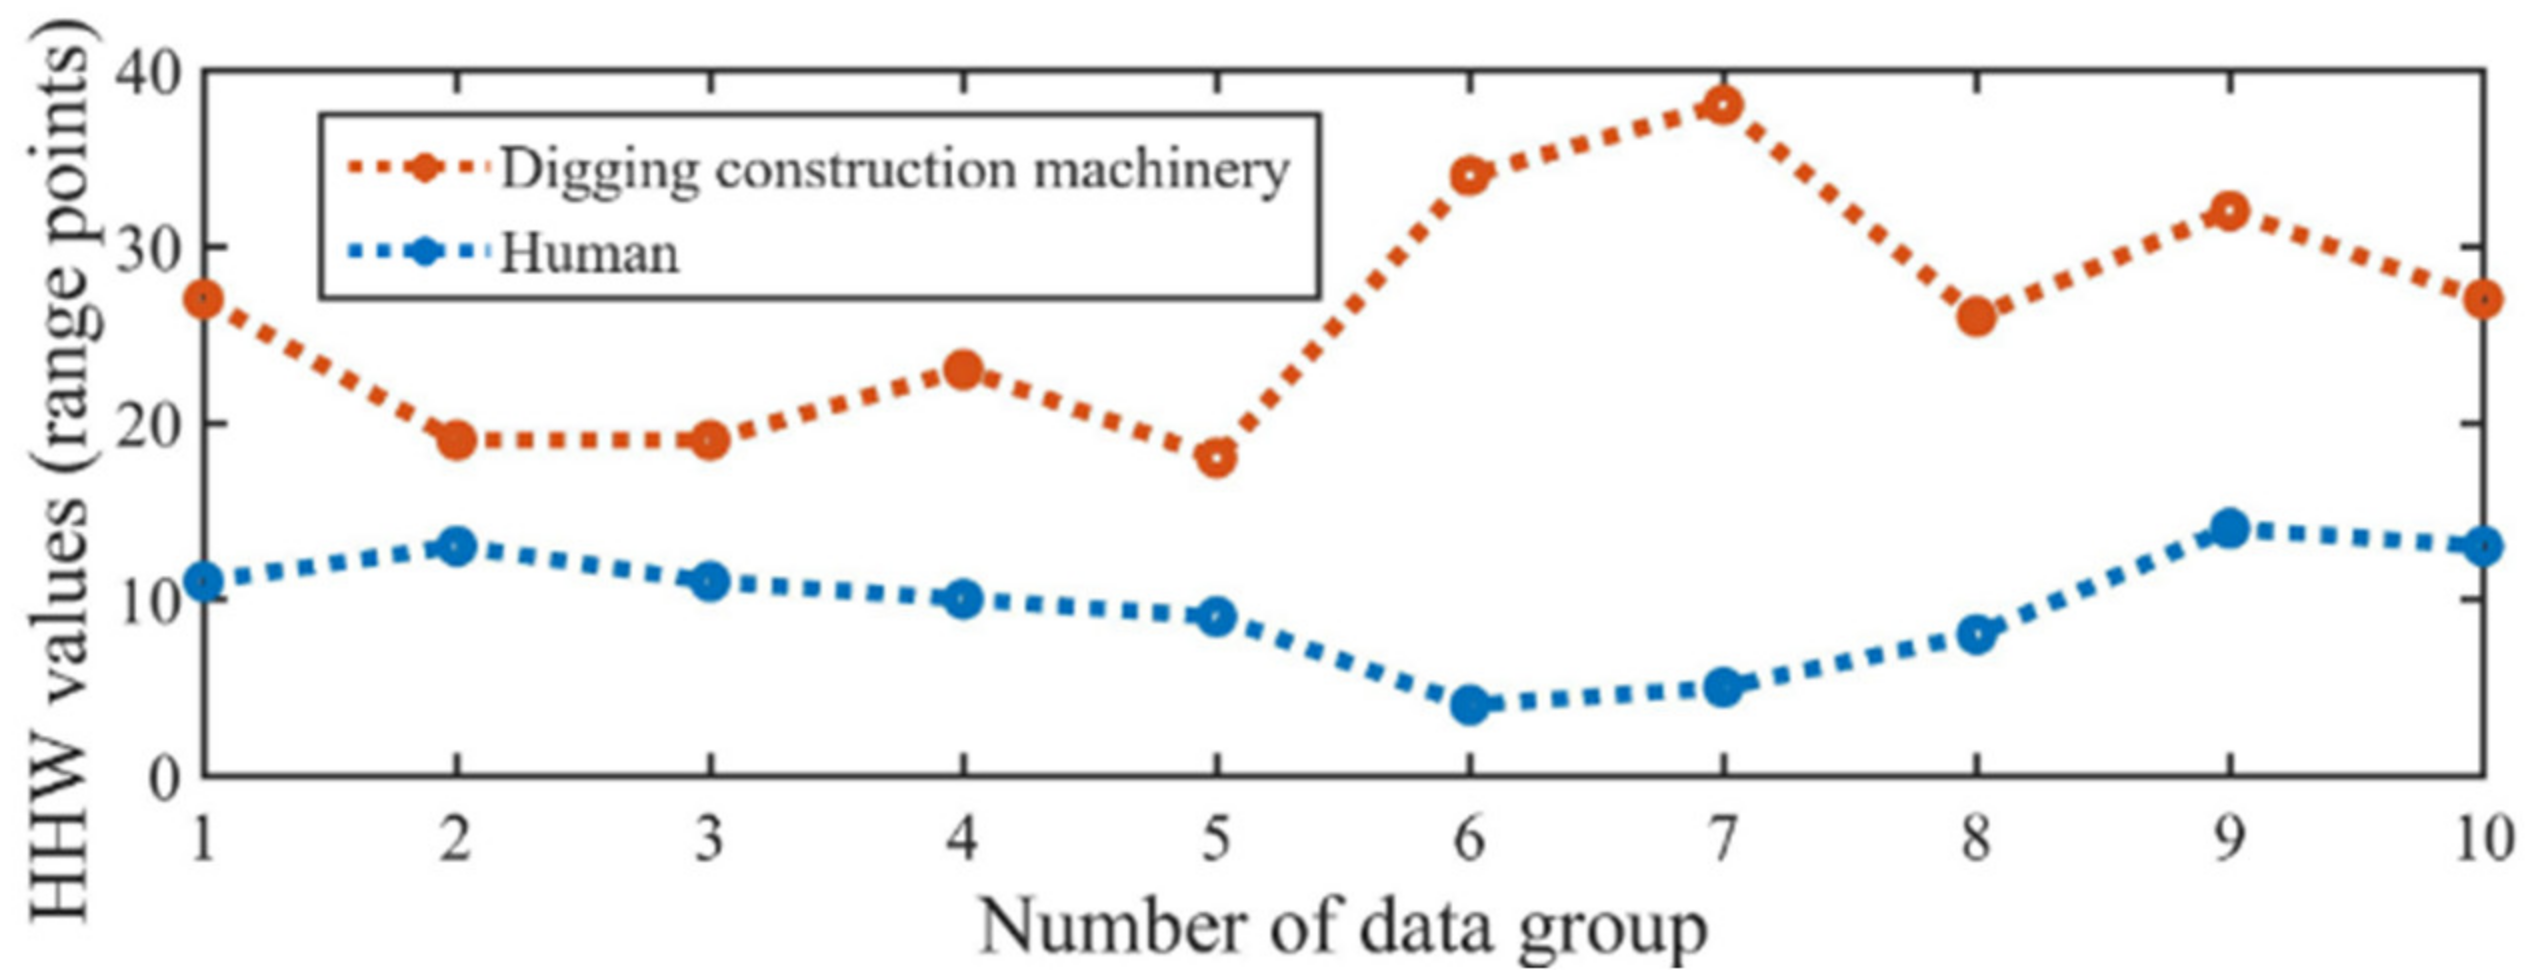
Apparently, the HHW values of the digging construction machinery are much larger than those of the human target. To describe more accurately this type of difference, a line diagram was used to compare the HHW values, as illustrated in Figure 9. The HHW values of humans are less than those of the digging construction machinery. There are large value differences between them with no intersections. Statistical parameters including mean, standard deviation, skewness, and kurtosis [32] are employed to quantitatively describe these kinds of differences, as shown in Table 3.
There is significant difference in the mean and standard values, more than double. The skewness of HHW values of human and digging construction machinery are similar, both reflecting a positive skew distribution. The kurtosis of human HHW values is less than zero, denoting that the distribution of human HHW values is high and sharp compared with the normal distribution, whereas the kurtosis of the HHW values of digging construction machinery is larger than zero, denoting a short and fat data distribution. Then, Levene’s Test was implemented to check for variance equality, and the corresponding p-value was 0.0667 > 0.05. Thus, the HHW values of human and digging construction machinery satisfy variance equality. Subsequently, a two-independent sample t-test was applied to the above two groups of HHW values, and the calculated p-value of the t-test was 1.9 × 10 6 << 0.05. Thus, there is a statistical difference between the HHW values of human and digging construction machinery. The above experimental results show that the proposed method can effectively distinguish human targets from working construction machineries.
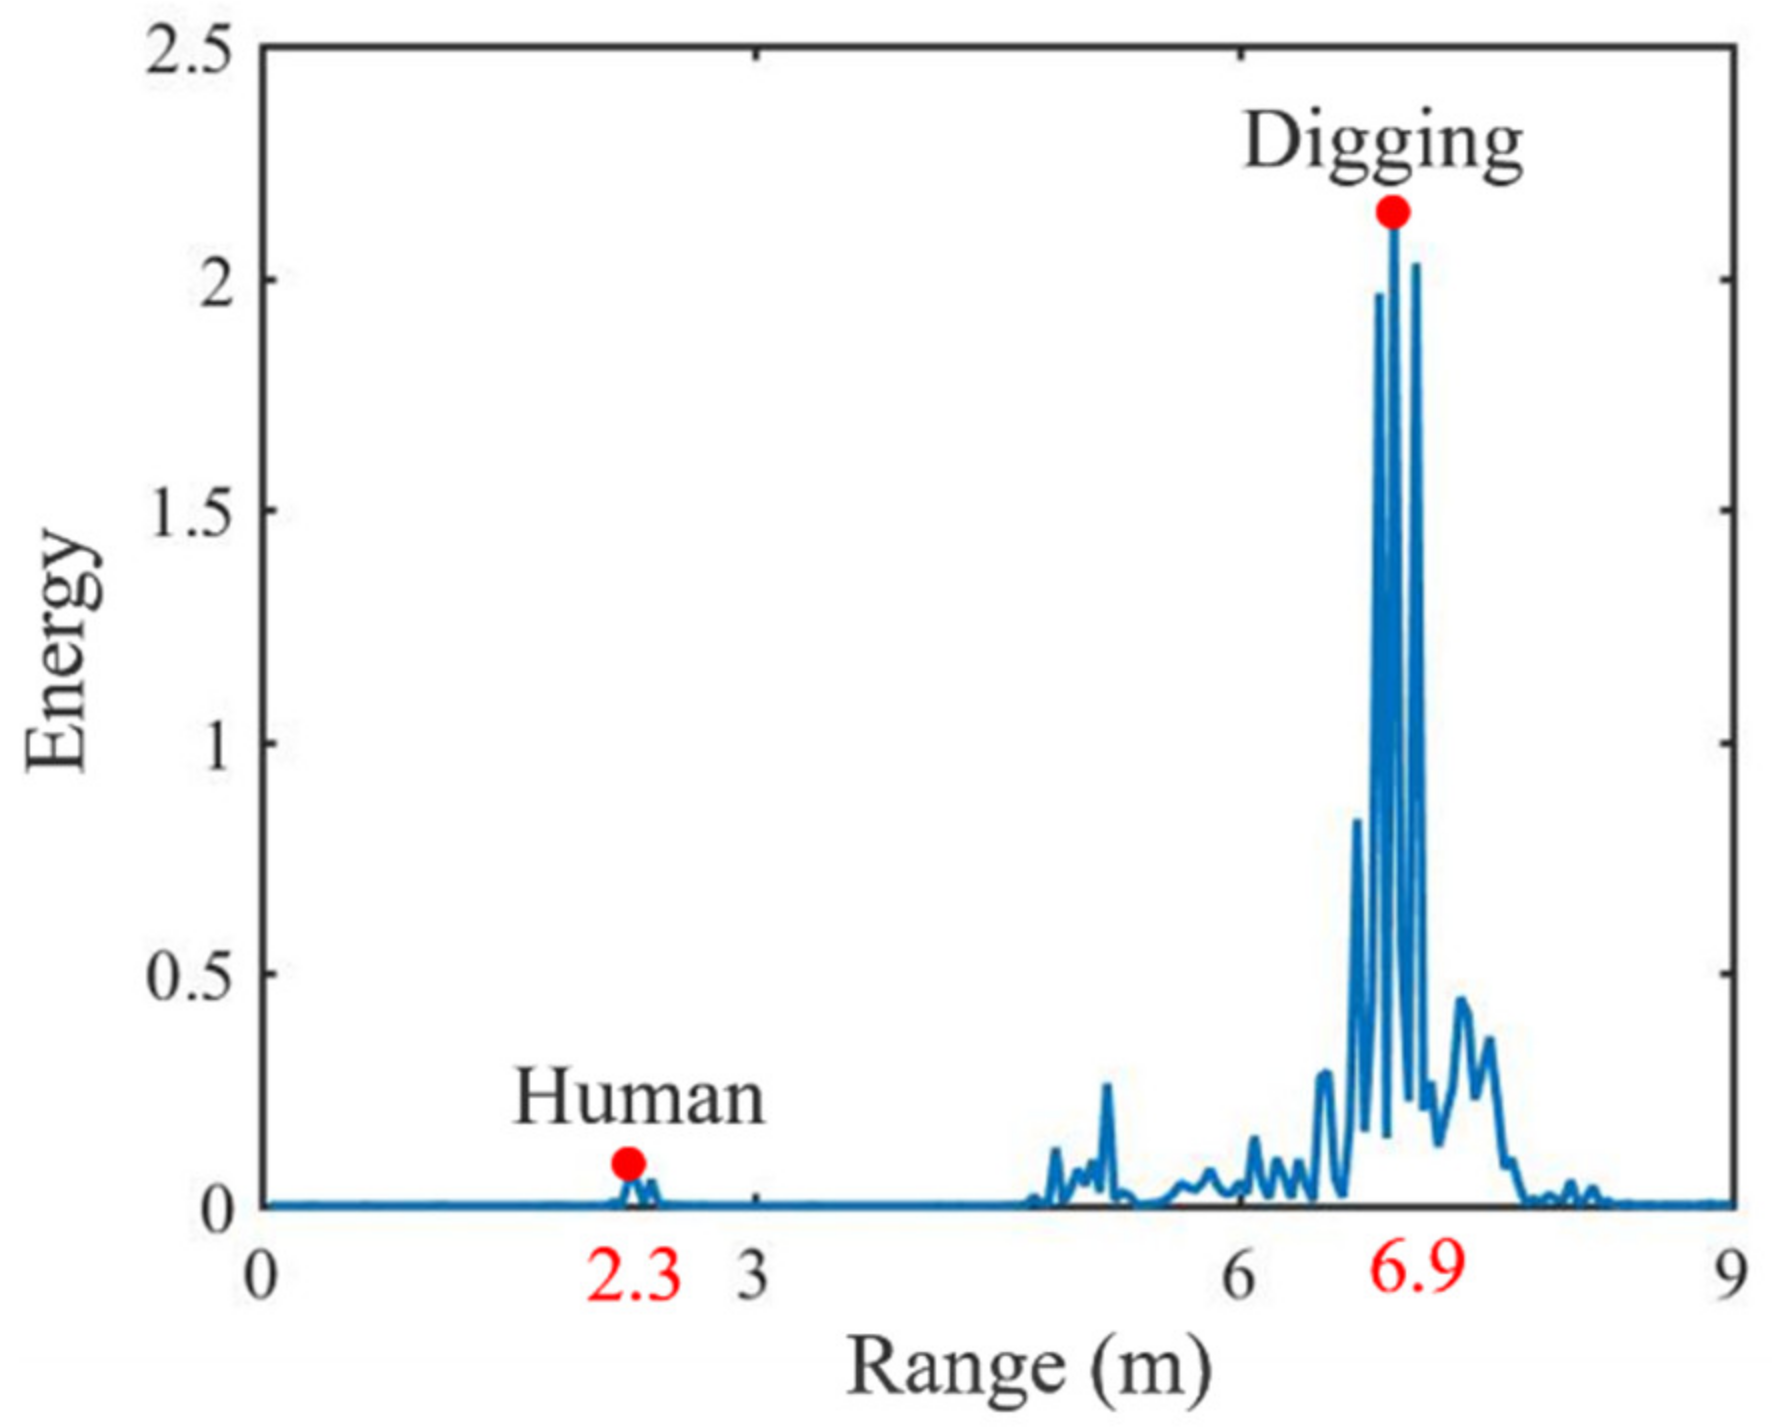
Traditional methods used for the detection of targets are usually based on finding the range point with maximum energy [31], as shown in Figure 10.
However, it is not suitable in this type of postdisaster rescue situation because there could be many strong interferences or noises whose vibration energies are much larger than those of humans, such as the walking of rescuers or the mechanical vibrations when clearing up the ruins for reconstructing roads. Thus, this can lead to the misdetection of human targets as noise. In addition, the traditional methods used to identify human targets by calculating their frequencies are also less efficient in this case because human respiration and digging construction machineries are proven to be within the same frequency band. Herein, the wavelet entropy decomposition and the proposed novel feature of HHW are capable of solving the aforementioned difficulties.

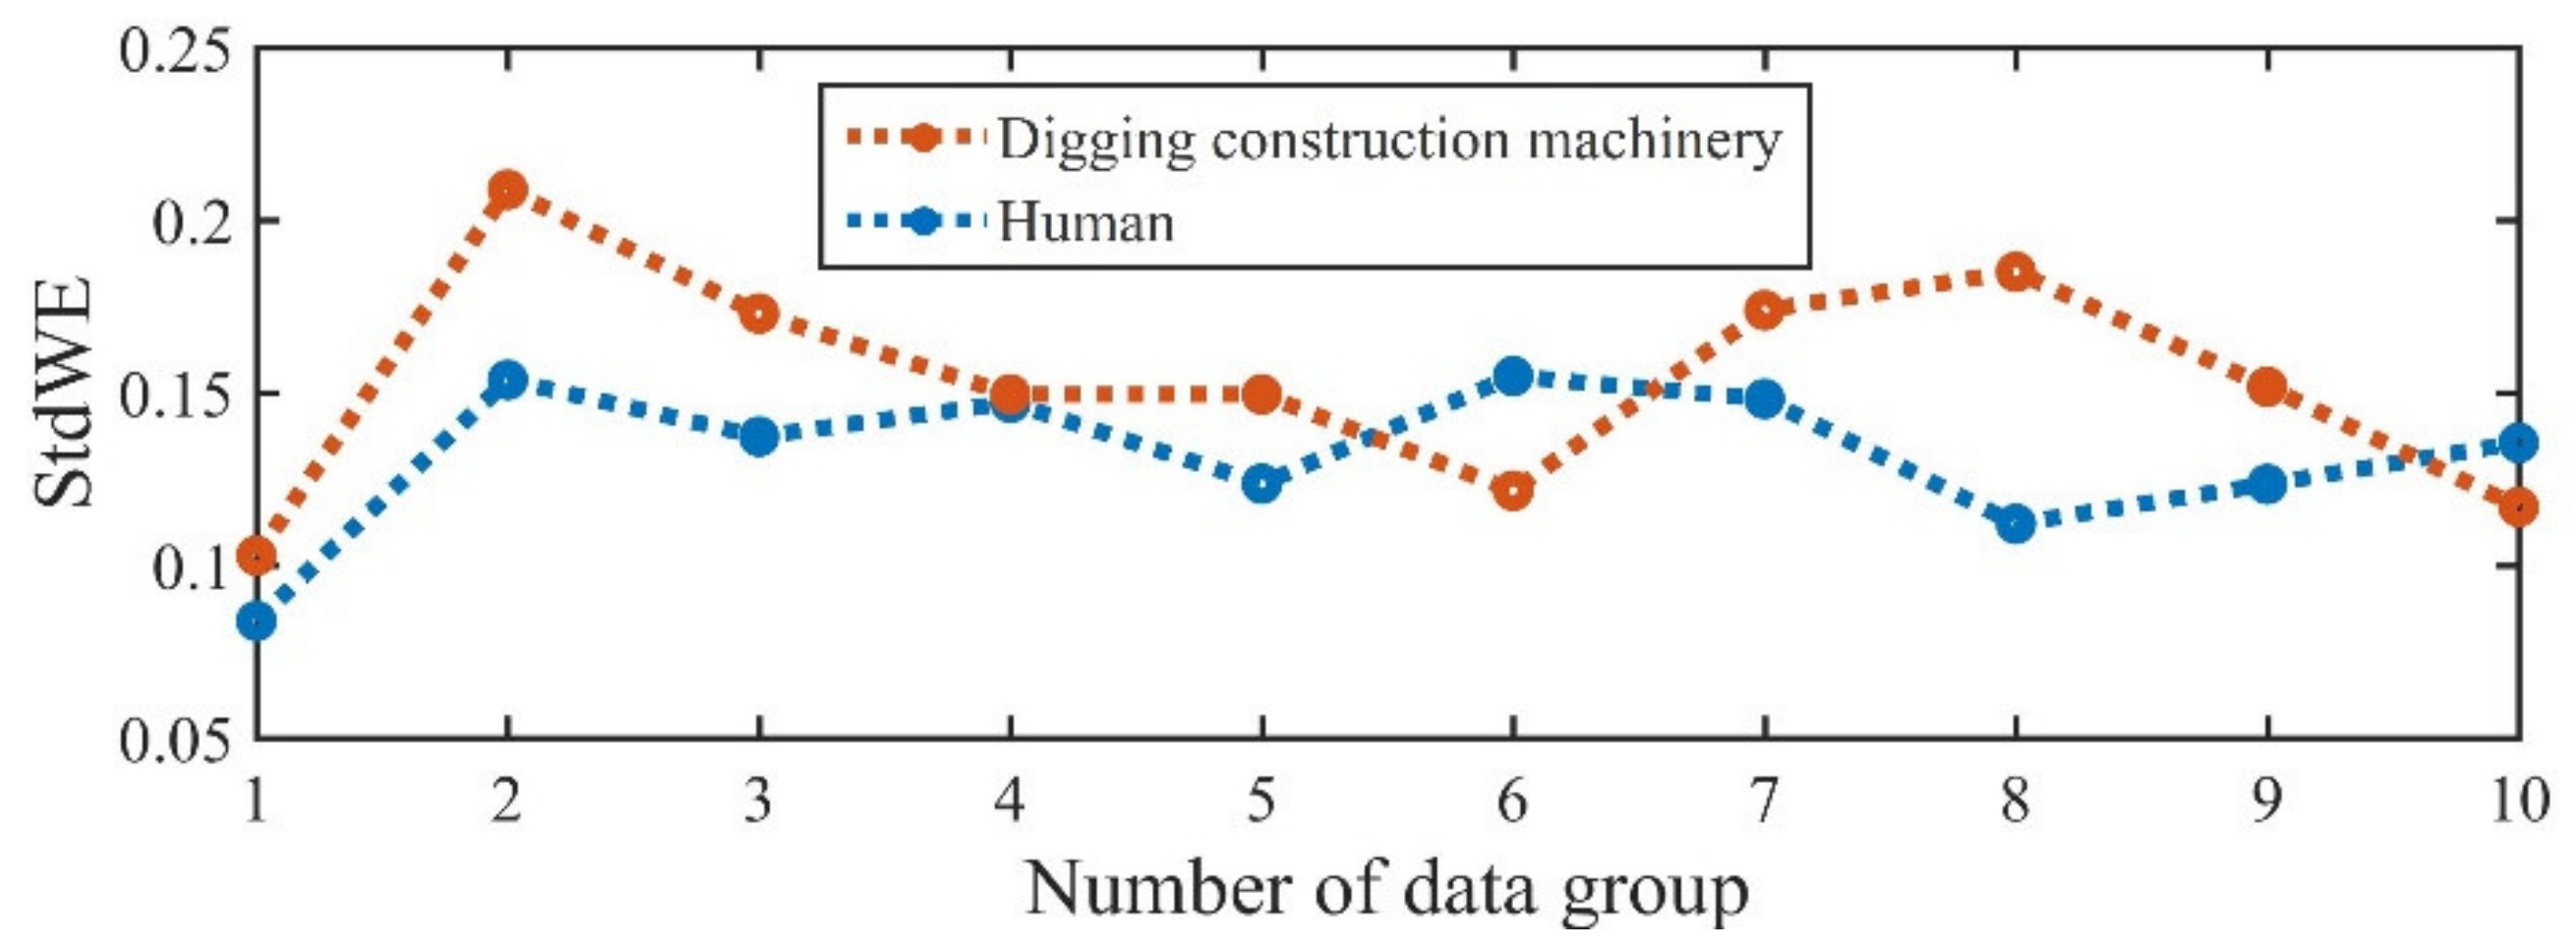
6. Discussion

In this study, the wavelet entropy decomposition and the proposed HHW feature overcame the disadvantages of the traditional methods associated with the identification of maximum energy and frequency. It promoted the potential for the use of UWB radar applications in actual postdisaster emergency rescue missions. Wang et al. [17] proposed a feature of standard deviation of wavelet entropy (StdWE) to distinguish between humans and dogs through brick walls and in free space using UWB radar. The frequency band of human respiration and that of a dog’s respiration intersect, similar to the situation in this study. Thus, the feature of StdWE is employed to be compared with HHW here. In the calculation of StdWE, the radar signal is divided into 128 nonoverlapping frames along slow time at each range point after wavelet entropy decompositions. Then, the average wavelet entropy ( M W E ) of 128 frames is illustrated by
M W E x = 1 N / 128 f r a = 1 N / 128 W E f r a x ,  
where W E f r a denotes the W E of the radar signal when the slow time is limited to the corresponding frame. Next, StdWE is calculated to reflect the fluctuation degree of WE. It is implemented by
S t d W E x = f r a = 1 N / 128 W E f r a x W E x N / 128 .
The comparison of the S t d W E of the 10 groups of radar data for human and digging construction machinery positions is shown in Figure 11. There are two intersections between the two lines at the 6th and 10th data groups. Additionally, other StdWE values of humans and digging construction machineries are very close. This reveals that StdWE has poor distinction effects in this kind of scenario. The comparison of statistical parameters for StdWE between humans and digging construction machineries is shown in Table 4. The values of all four kinds of statistical parameters are also very close. Compared with the results in Figure 9 and Table 3 calculated from the HHW values, the distinction effectiveness of the HHW feature is verified significantly better than StdWE feature in the distinction between human and mechanical vibrations within similar frequency bands using UWB radar.
However, there are still some improvements that need to be achieved before the method is used in practice. For example, experimental scenarios need to be more realistic. More investigation of the effect of subject number and species, clutter, and barriers between the targets and the UWB radar should be implemented. Moreover, the effect of changing the location of targets to the distinction performance needs to be researched in follow-up experiments, since survivors may be buried in different depths. In addition, the amount of radar data needs to be enlarged, and the statistical differences between the human targets and mechanical vibrations could be analyzed more accurately.

7. Conclusions

This study proposed a novel method to distinguish human targets from the interference of digging mechanical vibrations at a similar frequency band during postdisaster emergency rescues. UWB radar detection technology was used to collect data because it is one of the most reliable technologies used in postdisaster emergency rescues. Five preprocessing steps were then implemented to filter noise, compress data size, and reduce computational complexity. Wavelet entropy decomposition and the ICMLD-CFAR were also designed to automatically identify the positions of human targets and construction machinery. After the EEMD algorithm, the feature of E r was added to the ICMLD-CFAR to increase the difference between the noises and the targets; therefore, it was more accurate in identifying the target positions. Finally, a novel feature of HHW was extracted to distinguish humans from digging construction machineries. A two-independent sample t-test showed that there was a statistical difference between the HHW values of human targets and digging construction machineries, and this proved the effectiveness of the proposed method. We envision that the method can be used for actual postdisaster emergency rescue missions, and that it can help identify humans accurately and rapidly. Thus, more postdisaster survivors may be rescued during rescue missions.

Author Contributions

Conceptualization, H.X. and Y.M.; methodology, H.X. and Y.Z.; data curation, H.X., Y.Z., Z.Z. and G.S.; writing—original draft preparation, H.X. and Y.M.; writing—review and editing, J.W. and H.L.; funding acquisition, J.W. and H.L. All authors have read and agreed to the published version of the manuscript.

Funding

This research was funded by the Military Medical Promotion Plan of Air Force Military Medical University, grant number 2021HKYX10.

Institutional Review Board Statement

Informed consent was sought from all human subjects and the experiment was approved by the Ethics Committee of Air Force Medical University.

Informed Consent Statement

Written informed consent has been obtained from all the human subjects to publish this paper.

Data Availability Statement

The datasets generated during the current study are not publicly available but are available from the corresponding author upon reasonable request.

Conflicts of Interest

The authors declare no conflict of interest.

References

  1. Lv, H.; Jiao, T.; Zhang, Y.; An, Q.; Liu, M.; Fulai, L.; Jing, X.; Wang, J. An adaptive-MSSA-based algorithm for detection of trapped victims using UWB Radar. IEEE Geosci. Remote Sens. Lett. 2015, 12, 1808–1812. [Google Scholar] [CrossRef]
  2. Urdzik, D.; Kocur, D.; Rovnakova, J. Detection of multiple targets with enhancement of weak UWB radar signals for the purposes of through wall surveillance. In Proceedings of the IEEE International Symposium on Applied Machine Intelligence and Informatics (SAMI 2012), Herl’any, Slovakia, 26–28 January 2012. [Google Scholar]
  3. Xu, Y.; Wu, S.; Chen, C.; Chen, J.; Fang, G. A novel method for automatic detection of trapped victims by ultrawideband radar. IEEE Trans. Geosci. Remote Sens. 2012, 50, 3132–3142. [Google Scholar] [CrossRef]
  4. Li, J.; Zeng, Z.; Sun, J.; Liu, F. Through-wall detection of human being’s movement by UWB rada. IEEE Geosci. Remote Sens. Lett. 2012, 9, 1079–1083. [Google Scholar] [CrossRef]
  5. Riveral, N.V.; Venkatesh, S.; Anderson, C.; Buehrer, R.M. Multi-target estimation of heart and respiration rates using ultra-wideband sensors. In Proceedings of the European Signal Processing Conference, Florence, Italy, 4–8 September 2006. [Google Scholar]
  6. Amer, N. Stationary clutter- and linear-trend suppression in impulse-radar-based respiratory motion detection. In Proceedings of the IEEE International Conference on Ultra-Wideband (ICUWB), Bologna, Italy, 14–16 September 2011. [Google Scholar]
  7. Baranoski, E.J. Through-wall imaging: Historical perspective and future directions. J. Frankl. Inst. 2008, 345, 556–569. [Google Scholar] [CrossRef]
  8. Lu, B.; Song, Q.; Zhou, Z.; Zhang, X. Detection of human beings in motion behind the wall using SAR interferogram. IEEE Geosci. Remote Sens. Lett. 2012, 9, 968–971. [Google Scholar] [CrossRef]
  9. Hu, J.; Zhu, G.; Jin, T.; Zhou, Z. Adaptive through-wall indication of human target with different motions. IEEE Geosci. Remote Sens. Lett. 2014, 11, 911–915. [Google Scholar] [CrossRef]
  10. Zhang, Y.; Jiao, T.; Lv, H.; Li, S.; Li, C.; Lu, G.; Yu, X.; Li, Z.; Wang, J. An interference suppression technique for life detection using 5.75- and 35-GHz dual-frequency continuous-wave radar. IEEE Geosci. Remote Sens. Lett. 2015, 12, 482–486. [Google Scholar] [CrossRef]
  11. Schires, E.; Georgiou, P.; Lande, T.S. Vital sign monitoring through the back using an UWB impulse radar with body coupled antennas. IEEE Trans. Biomed. Circuits Syst. 2018, 12, 292–302. [Google Scholar] [CrossRef]
  12. Castro, D.; Mercuri, M.; Patel, A.; Puers, R.; van Hoof, C.; Torfs, T. Physiological driver monitoring using capacitively coupled and radar sensors. Appl. Sci. 2019, 9, 3994. [Google Scholar] [CrossRef] [Green Version]
  13. Leem, S.K.; Khan, F.; Cho, S.H. Vital sign monitoring and mobile phone usage detection using IR-UWB radar for intended use in car crash prevention. Sensors 2017, 17, 1240. [Google Scholar] [CrossRef]
  14. Chandra, A.; Chattopadhyay, S. A novel approach for coefficient quantization of low-pass finite impulse response filter using differential evolution algorithm. SIViP 2014, 8, 1307–1321. [Google Scholar] [CrossRef]
  15. Li, Z.; Li, W.; Lv, H.; Zhang, Y.; Jing, X.; Wang, J. A novel method for respiration-like clutter cancellation in life detection by dual-frequency IR-UWB radar. IEEE Trans. Microw. Theory Tech. 2013, 61, 2086–2092. [Google Scholar] [CrossRef]
  16. Zhao, L.; Yangyang, M.; Yang, Z.; Fulai, L.; Xiao, Y.; Fugui, Q.; Hao, L.; Guohua, L.; Jianqi, W. UWB radar features for distinguishing humans from animals in an actual post-disaster trapped scenario. IEEE Access 2021, 9, 154354. [Google Scholar] [CrossRef]
  17. Wang, Y.; Yu, X.; Zhang, Y.; Lv, H.; Jiao, T.; Lu, G.; Li, W.Z.; Li, Z.; Jing, X.; Wang, J. Using wavelet entropy to distinguish between humans and dogs detection by UWB radar. Prog. Electromagn. Res. 2013, 139, 335–352. [Google Scholar] [CrossRef] [Green Version]
  18. Rosso, O.A.; Blanco, S.; Yordanova, J.; Kolev, V.; Figliola, A.; Schürmann, M.; Başar, E. Wavelet entropy: A new tool for analysis of short duration brain electrical signals. J. Neurosci. Methods 2001, 105, 65–75. [Google Scholar] [CrossRef]
  19. Ma, Y.; Wang, P.; Huang, W.; Qi, F.; Liang, F.; Lv, H.; Yu, X.; Wang, J.; Zhang, Y. A robust multi-feature based method for distinguishing between humans and pets to ensure signal source in vital signs monitoring using UWB radar. EURASIP J. Adv. Signal Process. 2021, 2021, 27. [Google Scholar] [CrossRef]
  20. Matsui, T.; Ishizuka, T.; Ishihara, M.; Matsumura, K.; Kikuchi, M.; Kurita, A. The non-contact monitoring of heart and respiratory rates using laser irradiation: An experimental simultaneous monitoring with and without clothes during biochemical hazards. J. Med. Eng. Technol. 2003, 27, 133–136. [Google Scholar] [CrossRef]
  21. Kim, C.K.; Lee, H. Analysis of the generalized order statistics constant false alarm rate detector. ETRI J. 1994, 16, 17–34. [Google Scholar] [CrossRef]
  22. Weinberg, G.V. General transformation approach for constant false alarm rate detector development. Digit. Signal Process. 2014, 30, 15–26. [Google Scholar] [CrossRef]
  23. Holm, J.R.; James, A.R. The optimality of the censored mean-level detector. IEEE Trans. Inf. Theory 1991, 37, 206–209. [Google Scholar] [CrossRef]
  24. Ritcey, J.A. Performance analysis of the censored mean-level detector. IEEE Trans. Aerosp. Electron. Syst. 1986, AES–22, 443–454. [Google Scholar] [CrossRef]
  25. Rickard, J.T.; Dillard, G.M. Adaptive detection algorithms for multiple-target situations. IEEE Trans. Aerosp. Electron. Syst. 1977, AES–13, 338–343. [Google Scholar] [CrossRef]
  26. Abdou, L.; Soltani, F. OS-CFAR and CMLD threshold optimization in distributed systems using evolutionary strategies. Signal Image Video Process. 2008, 2, 155–167. [Google Scholar] [CrossRef]
  27. Li, Y.; Jing, X.; Lv, H.; Wang, J. Analysis of Characteristics of Two Close Stationary Human Targets Detected by Impulse Radio UWB Radar. Prog. Electromagn. Res. 2012, 126, 429–447. [Google Scholar] [CrossRef] [Green Version]
  28. Huang, N.E.; Shen, Z.; Long, S.R.; Wu, M.C.; Shih, H.H.; Zheng, Q.; Yen, N.; Tung, C.C.; Liu, H.H. The empirical mode decomposition and the Hilbert spectrum for nonlinear and non-stationary time series analysis. Proc. R. Soc. Lond. A 1998, 454, 903–995. [Google Scholar] [CrossRef]
  29. Wu, Z.; Huang, N.E. Ensemble empirical mode decomposition: A noise-assisted data analysis method. Adv. Adapt. Data Anal. 2009, 1, 1–41. [Google Scholar] [CrossRef]
  30. Ma, Y.; Liang, F.; Wang, P.; Lv, H.; Yu, X.; Zhang, Y.; Wang, J. An Accurate Method to Distinguish Between Stationary Human and Dog targets Under Through-Wall Condition Using UWB Radar. Remote Sens. 2019, 11, 2571. [Google Scholar] [CrossRef] [Green Version]
  31. Karim, A.M.; Güzel, M.S.; Tolun, M.R.; Kaya, H.; Çelebi, F.V. A new framework using deep auto-encoder and energy spectral density for medical waveform data classification and processing. Biocybern. Biomed. Eng. 2019, 39, 148–159. [Google Scholar] [CrossRef]
  32. Matti, H.; Mucchi, L.; Caputo, S.; Biotti, L.; Ciani, L.; Marabissi, D.; Patrizi, G. Ultra-wideband radar-based indoor activity monitoring for elderly care. Sensors 2021, 21, 3158. [Google Scholar]
Figure 1. Diagram depicting the utilized ultrawideband (UWB) radar (TA: transmitting antenna, RA: receiving antenna, ADC: analog-to-digital converter).
Applsci 12 10046 g001
Figure 2. Flow chart of the signal preprocessing steps (DC, direct current; LP, low-pass).
Applsci 12 10046 g002
Figure 3. Illustration of the censored mean-level detector, constant false-alarm rate.
Applsci 12 10046 g003
Figure 4. Illustration of the proposed feature of half-height width (HHW) of the target’s wavelet entropy.
Applsci 12 10046 g004
Figure 5. Experimental scenarios.
Applsci 12 10046 g005
Figure 6. Typical energy spectral density comparisons of construction machinery in the idling, digging, and moving modes of operation. Periodic frequency of healthy adult respiration (0.2–0.4 Hz) was marked between the two red dotted lines.
Applsci 12 10046 g006
Figure 7. Raw and preprocessed radar data when a human stands stationary at approximately 2.5 m from the UWB radar and when the digging wheel loader is approximately at 6 m. (a) Raw data, and (b) preprocessed data.
Applsci 12 10046 g007
Figure 8. Results of wavelet entropy decomposition and the ICMLD-CFAR.
Applsci 12 10046 g008
Figure 9. Comparison of HHW values of the 10 groups of radar data for human and digging construction machinery positions.
Applsci 12 10046 g009
Figure 10. Traditional method used to detect targets by identifying the maximum energy position.
Applsci 12 10046 g010
Figure 11. Comparison of StdWE values of the 10 groups of radar data for human and digging construction machinery positions.
Applsci 12 10046 g011
Table 1. Key parameters of the utilized ultrawideband (UWB) radar.
Key ParameterValue
Center frequency500 MHz
Bandwidth500 MHz
Detection range0–9 m
Pulse repetition frequency128 kHz
Range points2048
Sampling frequency along slow time64 Hz
Table 2. Half-height width values of 10 groups of human radar data and the digging construction machinery positions.
HHW Values
Human1113111094581413
Digging construction machinery27191923183438263227
Table 3. Statistical parameters for quantitatively describing differences between HHW values of human and digging construction machinery.
HHW ValuesMeanStandardSkewnessKurtosis
Human9.83.18752.1297−0.5217
Digging construction machinery26.36.45061.95330.3198
Table 4. Comparison of statistical parameters for StdWE between humans and digging construction machineries.
StdWE ValuesMeanStandardSkewnessKurtosis
Human0.13000.02093.1943−0.0.9826
Digging construction machinery0.15330.03132.09030.0367
Publisher’s Note: MDPI stays neutral with regard to jurisdictional claims in published maps and institutional affiliations.